Cities with the Highest Percentage of Salvadoran Population in Oklahoma
RELATED REPORTS & OPTIONS
Salvadoran
Oklahoma
Compare Cities
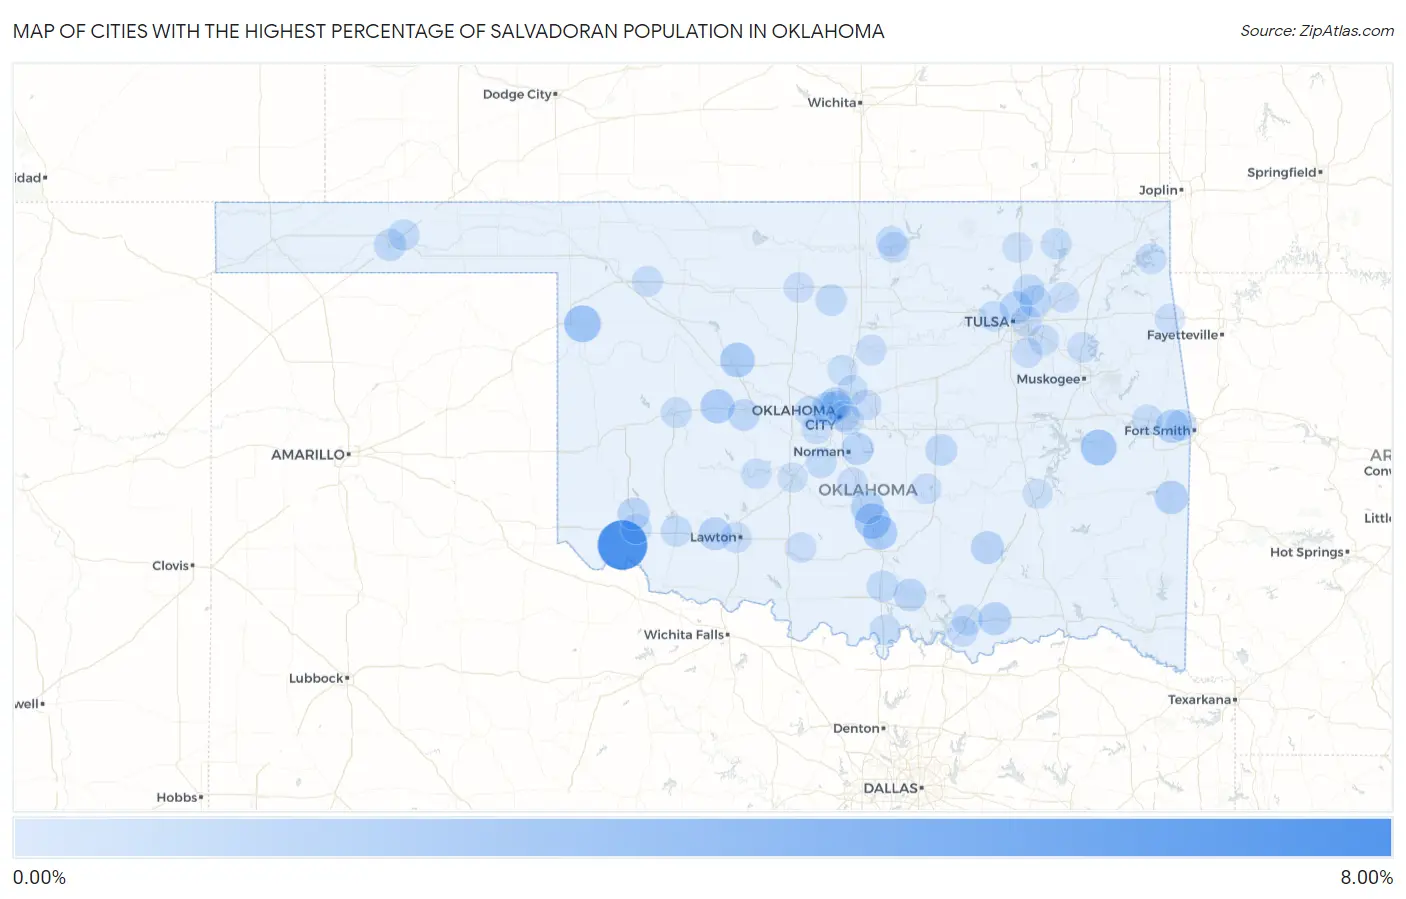
Map of Cities with the Highest Percentage of Salvadoran Population in Oklahoma
0.00%
8.00%
Cities with the Highest Percentage of Salvadoran Population in Oklahoma
| City | Salvadoran | vs State | vs National | |
| 1. | Olustee | 6.83% | 0.17%(+6.66)#1 | 0.72%(+6.11)#237 |
| 2. | Arnett | 2.25% | 0.17%(+2.08)#2 | 0.72%(+1.53)#835 |
| 3. | Whitefield | 1.92% | 0.17%(+1.76)#3 | 0.72%(+1.20)#947 |
| 4. | Pauls Valley | 1.81% | 0.17%(+1.64)#4 | 0.72%(+1.09)#991 |
| 5. | Watonga | 1.55% | 0.17%(+1.38)#5 | 0.72%(+0.825)#1,154 |
| 6. | Wynnewood | 1.47% | 0.17%(+1.30)#6 | 0.72%(+0.750)#1,205 |
| 7. | Hydro | 1.33% | 0.17%(+1.16)#7 | 0.72%(+0.608)#1,303 |
| 8. | Warr Acres | 1.21% | 0.17%(+1.04)#8 | 0.72%(+0.487)#1,404 |
| 9. | Muldrow | 1.15% | 0.17%(+0.987)#9 | 0.72%(+0.432)#1,443 |
| 10. | Heavener | 1.13% | 0.17%(+0.962)#10 | 0.72%(+0.407)#1,462 |
| 11. | Paoli | 1.06% | 0.17%(+0.891)#11 | 0.72%(+0.336)#1,542 |
| 12. | Bokchito | 0.98% | 0.17%(+0.814)#12 | 0.72%(+0.259)#1,639 |
| 13. | Coalgate | 0.95% | 0.17%(+0.788)#13 | 0.72%(+0.233)#1,667 |
| 14. | Cache | 0.91% | 0.17%(+0.741)#14 | 0.72%(+0.186)#1,727 |
| 15. | Turley | 0.86% | 0.17%(+0.690)#15 | 0.72%(+0.135)#1,782 |
| 16. | Mannsville | 0.83% | 0.17%(+0.661)#16 | 0.72%(+0.106)#1,822 |
| 17. | The Village | 0.81% | 0.17%(+0.645)#17 | 0.72%(+0.091)#1,854 |
| 18. | Norman | 0.80% | 0.17%(+0.633)#18 | 0.72%(+0.079)#1,873 |
| 19. | Blair | 0.72% | 0.17%(+0.554)#19 | 0.72%(-0.001)#2,017 |
| 20. | Guymon | 0.61% | 0.17%(+0.445)#20 | 0.72%(-0.110)#2,222 |
| 21. | Seminole | 0.55% | 0.17%(+0.379)#21 | 0.72%(-0.176)#2,375 |
| 22. | Owasso | 0.54% | 0.17%(+0.376)#22 | 0.72%(-0.179)#2,382 |
| 23. | Hinton | 0.54% | 0.17%(+0.374)#23 | 0.72%(-0.181)#2,393 |
| 24. | Covington | 0.51% | 0.17%(+0.343)#24 | 0.72%(-0.211)#2,455 |
| 25. | Ardmore | 0.46% | 0.17%(+0.297)#25 | 0.72%(-0.258)#2,569 |
| 26. | Optima | 0.42% | 0.17%(+0.255)#26 | 0.72%(-0.300)#2,694 |
| 27. | Collinsville | 0.42% | 0.17%(+0.254)#27 | 0.72%(-0.301)#2,696 |
| 28. | Roland | 0.41% | 0.17%(+0.244)#28 | 0.72%(-0.311)#2,734 |
| 29. | Shady Grove Cdp Cherokee County | 0.38% | 0.17%(+0.217)#29 | 0.72%(-0.338)#2,816 |
| 30. | Snyder | 0.38% | 0.17%(+0.211)#30 | 0.72%(-0.343)#2,839 |
| 31. | Nichols Hills | 0.31% | 0.17%(+0.144)#31 | 0.72%(-0.410)#3,093 |
| 32. | Yukon | 0.31% | 0.17%(+0.143)#32 | 0.72%(-0.412)#3,099 |
| 33. | Blanchard | 0.30% | 0.17%(+0.132)#33 | 0.72%(-0.423)#3,148 |
| 34. | Mooreland | 0.29% | 0.17%(+0.125)#34 | 0.72%(-0.430)#3,180 |
| 35. | Nowata | 0.28% | 0.17%(+0.115)#35 | 0.72%(-0.439)#3,218 |
| 36. | Clinton | 0.27% | 0.17%(+0.104)#36 | 0.72%(-0.451)#3,257 |
| 37. | Sand Springs | 0.27% | 0.17%(+0.099)#37 | 0.72%(-0.456)#3,273 |
| 38. | Tulsa | 0.25% | 0.17%(+0.084)#38 | 0.72%(-0.471)#3,338 |
| 39. | Lawton | 0.25% | 0.17%(+0.081)#39 | 0.72%(-0.473)#3,354 |
| 40. | Oklahoma City | 0.25% | 0.17%(+0.081)#40 | 0.72%(-0.474)#3,357 |
| 41. | Sallisaw | 0.25% | 0.17%(+0.079)#41 | 0.72%(-0.475)#3,366 |
| 42. | Mccord | 0.25% | 0.17%(+0.079)#42 | 0.72%(-0.476)#3,367 |
| 43. | Ponca City | 0.24% | 0.17%(+0.075)#43 | 0.72%(-0.480)#3,394 |
| 44. | Durant | 0.24% | 0.17%(+0.073)#44 | 0.72%(-0.482)#3,403 |
| 45. | Marietta | 0.21% | 0.17%(+0.046)#45 | 0.72%(-0.509)#3,544 |
| 46. | Calera | 0.21% | 0.17%(+0.040)#46 | 0.72%(-0.514)#3,572 |
| 47. | Grove | 0.19% | 0.17%(+0.019)#47 | 0.72%(-0.536)#3,669 |
| 48. | Anadarko | 0.17% | 0.17%(+0.008)#48 | 0.72%(-0.547)#3,725 |
| 49. | Konawa | 0.17% | 0.17%(+0.004)#49 | 0.72%(-0.551)#3,746 |
| 50. | Jones | 0.17% | 0.17%(+0.004)#50 | 0.72%(-0.551)#3,747 |
| 51. | Broken Arrow | 0.17% | 0.17%(+0.004)#51 | 0.72%(-0.551)#3,748 |
| 52. | Coyle | 0.17% | 0.17%(-0.000)#52 | 0.72%(-0.555)#3,762 |
| 53. | Altus | 0.14% | 0.17%(-0.023)#53 | 0.72%(-0.577)#3,860 |
| 54. | Duncan | 0.14% | 0.17%(-0.026)#54 | 0.72%(-0.581)#3,895 |
| 55. | Bixby | 0.14% | 0.17%(-0.028)#55 | 0.72%(-0.582)#3,911 |
| 56. | Claremore | 0.14% | 0.17%(-0.030)#56 | 0.72%(-0.585)#3,927 |
| 57. | Enid | 0.14% | 0.17%(-0.031)#57 | 0.72%(-0.586)#3,935 |
| 58. | Wagoner | 0.13% | 0.17%(-0.039)#58 | 0.72%(-0.594)#3,984 |
| 59. | Purcell | 0.11% | 0.17%(-0.061)#59 | 0.72%(-0.616)#4,131 |
| 60. | Guthrie | 0.10% | 0.17%(-0.066)#60 | 0.72%(-0.621)#4,162 |
| 61. | Edmond | 0.083% | 0.17%(-0.084)#61 | 0.72%(-0.639)#4,290 |
| 62. | Mustang | 0.073% | 0.17%(-0.094)#62 | 0.72%(-0.649)#4,346 |
| 63. | West Siloam Springs | 0.073% | 0.17%(-0.094)#63 | 0.72%(-0.649)#4,347 |
| 64. | Chickasha | 0.062% | 0.17%(-0.105)#64 | 0.72%(-0.660)#4,439 |
| 65. | Del City | 0.028% | 0.17%(-0.139)#65 | 0.72%(-0.694)#4,681 |
| 66. | Bartlesville | 0.021% | 0.17%(-0.145)#66 | 0.72%(-0.700)#4,715 |
| 67. | Mcalester | 0.011% | 0.17%(-0.156)#67 | 0.72%(-0.711)#4,778 |
Common Questions
What are the Top 10 Cities with the Highest Percentage of Salvadoran Population in Oklahoma?
Top 10 Cities with the Highest Percentage of Salvadoran Population in Oklahoma are:
#1
6.83%
#2
2.25%
#3
1.92%
#4
1.81%
#5
1.55%
#6
1.47%
#7
1.33%
#8
1.21%
#9
1.15%
#10
1.13%
What city has the Highest Percentage of Salvadoran Population in Oklahoma?
Olustee has the Highest Percentage of Salvadoran Population in Oklahoma with 6.83%.
What is the Percentage of Salvadoran Population in the State of Oklahoma?
Percentage of Salvadoran Population in Oklahoma is 0.17%.
What is the Percentage of Salvadoran Population in the United States?
Percentage of Salvadoran Population in the United States is 0.72%.