Cities with the Highest Percentage of Salvadoran Population in Indiana
RELATED REPORTS & OPTIONS
Salvadoran
Indiana
Compare Cities
Map of Cities with the Highest Percentage of Salvadoran Population in Indiana
0.00%
40.00%
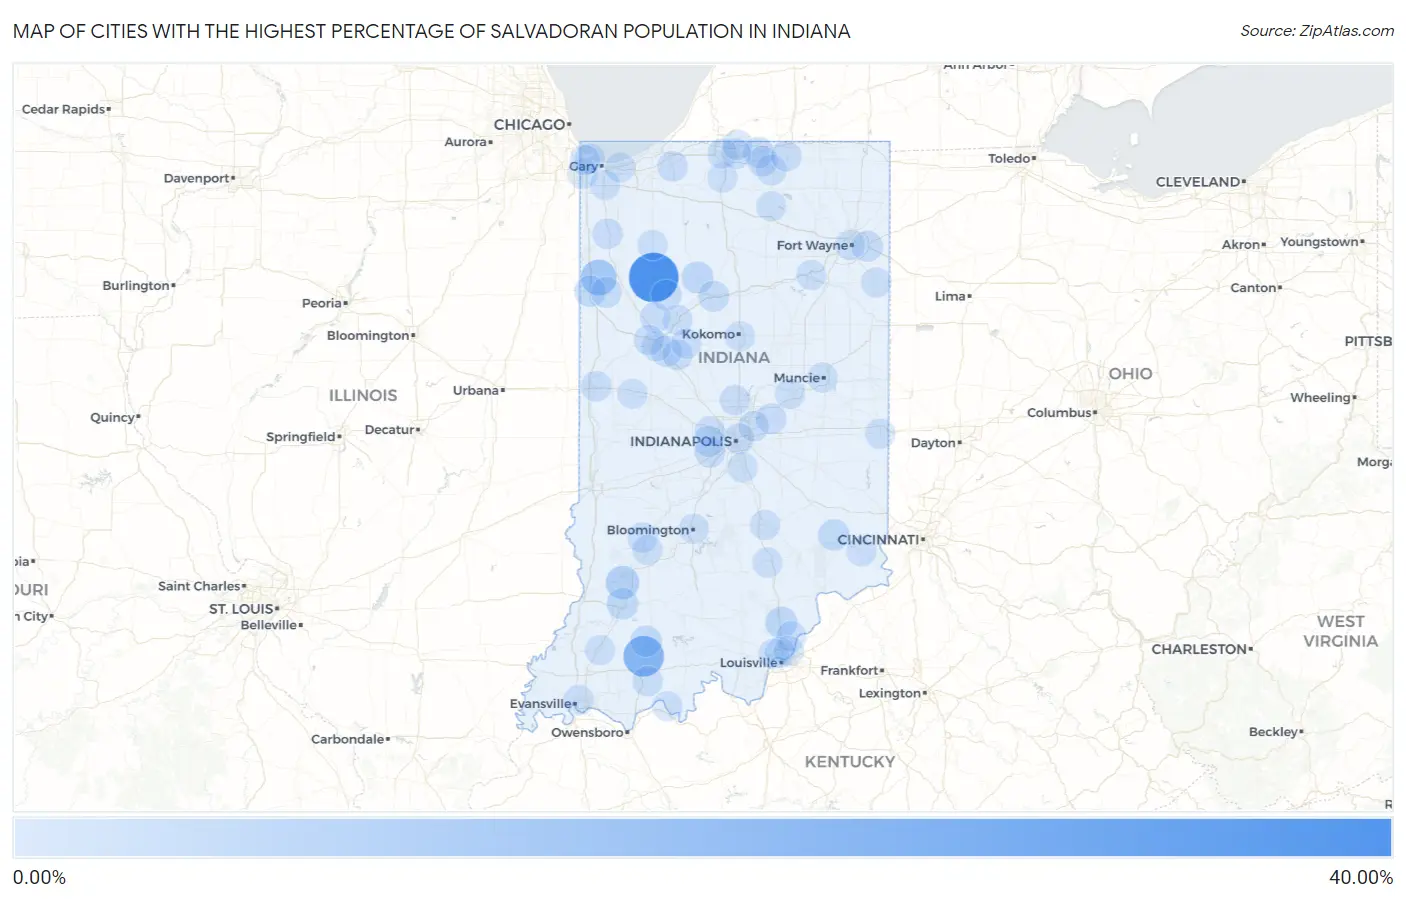
Cities with the Highest Percentage of Salvadoran Population in Indiana
| City | Salvadoran | vs State | vs National | |
| 1. | Monon | 39.40% | 0.20%(+39.2)#1 | 0.72%(+38.7)#3 |
| 2. | Rockfield | 30.26% | 0.20%(+30.1)#2 | 0.72%(+29.5)#12 |
| 3. | Fair Oaks | 27.44% | 0.20%(+27.2)#3 | 0.72%(+26.7)#20 |
| 4. | Philadelphia | 24.75% | 0.20%(+24.6)#4 | 0.72%(+24.0)#32 |
| 5. | Huntingburg | 20.71% | 0.20%(+20.5)#5 | 0.72%(+20.0)#39 |
| 6. | Brook | 11.04% | 0.20%(+10.8)#6 | 0.72%(+10.3)#128 |
| 7. | Lincoln | 6.35% | 0.20%(+6.15)#7 | 0.72%(+5.63)#260 |
| 8. | Plainville | 6.33% | 0.20%(+6.14)#8 | 0.72%(+5.61)#261 |
| 9. | Royal Center | 3.43% | 0.20%(+3.23)#9 | 0.72%(+2.71)#538 |
| 10. | Henryville | 2.99% | 0.20%(+2.80)#10 | 0.72%(+2.27)#618 |
| 11. | Osgood | 2.63% | 0.20%(+2.43)#11 | 0.72%(+1.91)#718 |
| 12. | Washington | 2.59% | 0.20%(+2.39)#12 | 0.72%(+1.87)#723 |
| 13. | Jasper | 2.43% | 0.20%(+2.23)#13 | 0.72%(+1.71)#778 |
| 14. | Kentland | 1.82% | 0.20%(+1.62)#14 | 0.72%(+1.10)#989 |
| 15. | New Haven | 1.59% | 0.20%(+1.39)#15 | 0.72%(+0.867)#1,125 |
| 16. | Avon | 1.50% | 0.20%(+1.30)#16 | 0.72%(+0.779)#1,181 |
| 17. | Logansport | 1.48% | 0.20%(+1.28)#17 | 0.72%(+0.754)#1,202 |
| 18. | Goodland | 1.21% | 0.20%(+1.01)#18 | 0.72%(+0.489)#1,401 |
| 19. | Elkhart | 1.13% | 0.20%(+0.934)#19 | 0.72%(+0.411)#1,458 |
| 20. | Dayton | 1.00% | 0.20%(+0.803)#20 | 0.72%(+0.279)#1,613 |
| 21. | Charlestown | 0.95% | 0.20%(+0.753)#21 | 0.72%(+0.230)#1,672 |
| 22. | Covington | 0.92% | 0.20%(+0.723)#22 | 0.72%(+0.200)#1,709 |
| 23. | Monticello | 0.78% | 0.20%(+0.585)#23 | 0.72%(+0.062)#1,902 |
| 24. | La Porte | 0.77% | 0.20%(+0.569)#24 | 0.72%(+0.046)#1,941 |
| 25. | Westfield | 0.76% | 0.20%(+0.564)#25 | 0.72%(+0.041)#1,947 |
| 26. | Goshen | 0.73% | 0.20%(+0.534)#26 | 0.72%(+0.010)#1,998 |
| 27. | Roselawn | 0.73% | 0.20%(+0.533)#27 | 0.72%(+0.010)#1,999 |
| 28. | Dunlap | 0.72% | 0.20%(+0.522)#28 | 0.72%(-0.001)#2,019 |
| 29. | Middlebury | 0.68% | 0.20%(+0.482)#29 | 0.72%(-0.042)#2,084 |
| 30. | Brookston | 0.61% | 0.20%(+0.411)#30 | 0.72%(-0.112)#2,228 |
| 31. | Fortville | 0.60% | 0.20%(+0.397)#31 | 0.72%(-0.126)#2,267 |
| 32. | East Chicago | 0.56% | 0.20%(+0.359)#32 | 0.72%(-0.164)#2,346 |
| 33. | Indianapolis | 0.48% | 0.20%(+0.279)#33 | 0.72%(-0.244)#2,535 |
| 34. | Mulberry | 0.47% | 0.20%(+0.270)#34 | 0.72%(-0.254)#2,564 |
| 35. | Putnamville | 0.46% | 0.20%(+0.260)#35 | 0.72%(-0.263)#2,586 |
| 36. | Santa Claus | 0.44% | 0.20%(+0.239)#36 | 0.72%(-0.285)#2,647 |
| 37. | Lawrence | 0.42% | 0.20%(+0.222)#37 | 0.72%(-0.301)#2,699 |
| 38. | Plainfield | 0.36% | 0.20%(+0.161)#38 | 0.72%(-0.362)#2,914 |
| 39. | Worthington | 0.35% | 0.20%(+0.153)#39 | 0.72%(-0.371)#2,947 |
| 40. | Decatur | 0.34% | 0.20%(+0.141)#40 | 0.72%(-0.382)#2,985 |
| 41. | Anderson | 0.31% | 0.20%(+0.107)#41 | 0.72%(-0.416)#3,120 |
| 42. | Evansville | 0.26% | 0.20%(+0.066)#42 | 0.72%(-0.457)#3,280 |
| 43. | Delphi | 0.20% | 0.20%(+0.003)#43 | 0.72%(-0.521)#3,598 |
| 44. | New Albany | 0.20% | 0.20%(+0.001)#44 | 0.72%(-0.522)#3,604 |
| 45. | Fort Wayne | 0.20% | 0.20%(+0.001)#45 | 0.72%(-0.522)#3,605 |
| 46. | Munster | 0.19% | 0.20%(-0.005)#46 | 0.72%(-0.528)#3,636 |
| 47. | Dillsboro | 0.17% | 0.20%(-0.026)#47 | 0.72%(-0.549)#3,730 |
| 48. | Bloomfield | 0.17% | 0.20%(-0.027)#48 | 0.72%(-0.551)#3,744 |
| 49. | Lakeville | 0.14% | 0.20%(-0.053)#49 | 0.72%(-0.577)#3,855 |
| 50. | Brownsburg | 0.14% | 0.20%(-0.062)#50 | 0.72%(-0.586)#3,929 |
| 51. | Waynetown | 0.13% | 0.20%(-0.070)#51 | 0.72%(-0.593)#3,980 |
| 52. | Medaryville | 0.13% | 0.20%(-0.070)#52 | 0.72%(-0.593)#3,983 |
| 53. | Oakland City | 0.12% | 0.20%(-0.074)#53 | 0.72%(-0.598)#4,008 |
| 54. | Muncie | 0.12% | 0.20%(-0.079)#54 | 0.72%(-0.602)#4,035 |
| 55. | Rossville | 0.11% | 0.20%(-0.084)#55 | 0.72%(-0.607)#4,065 |
| 56. | Lafayette | 0.11% | 0.20%(-0.087)#56 | 0.72%(-0.610)#4,085 |
| 57. | Leesburg | 0.11% | 0.20%(-0.092)#57 | 0.72%(-0.616)#4,126 |
| 58. | Greenwood | 0.10% | 0.20%(-0.095)#58 | 0.72%(-0.618)#4,142 |
| 59. | Bloomington | 0.091% | 0.20%(-0.107)#59 | 0.72%(-0.631)#4,224 |
| 60. | Clarksville | 0.091% | 0.20%(-0.108)#60 | 0.72%(-0.631)#4,230 |
| 61. | Hammond | 0.076% | 0.20%(-0.122)#61 | 0.72%(-0.645)#4,324 |
| 62. | Mishawaka | 0.065% | 0.20%(-0.134)#62 | 0.72%(-0.657)#4,413 |
| 63. | South Bend | 0.062% | 0.20%(-0.136)#63 | 0.72%(-0.660)#4,435 |
| 64. | Richmond | 0.062% | 0.20%(-0.137)#64 | 0.72%(-0.660)#4,438 |
| 65. | Seymour | 0.061% | 0.20%(-0.138)#65 | 0.72%(-0.661)#4,452 |
| 66. | Tell City | 0.054% | 0.20%(-0.145)#66 | 0.72%(-0.668)#4,497 |
| 67. | Huntington | 0.047% | 0.20%(-0.151)#67 | 0.72%(-0.675)#4,553 |
| 68. | Kokomo | 0.042% | 0.20%(-0.156)#68 | 0.72%(-0.680)#4,591 |
| 69. | Granger | 0.040% | 0.20%(-0.158)#69 | 0.72%(-0.682)#4,608 |
| 70. | Merrillville | 0.030% | 0.20%(-0.168)#70 | 0.72%(-0.691)#4,661 |
| 71. | Columbus | 0.026% | 0.20%(-0.173)#71 | 0.72%(-0.696)#4,690 |
| 72. | Jeffersonville | 0.024% | 0.20%(-0.174)#72 | 0.72%(-0.698)#4,699 |
| 73. | Portage | 0.024% | 0.20%(-0.175)#73 | 0.72%(-0.698)#4,702 |
| 74. | West Lafayette | 0.018% | 0.20%(-0.181)#74 | 0.72%(-0.704)#4,745 |
Common Questions
What are the Top 10 Cities with the Highest Percentage of Salvadoran Population in Indiana?
Top 10 Cities with the Highest Percentage of Salvadoran Population in Indiana are:
#1
39.40%
#2
20.71%
#3
11.04%
#4
6.33%
#5
3.43%
#6
2.99%
#7
2.63%
#8
2.59%
#9
2.43%
#10
1.82%
What city has the Highest Percentage of Salvadoran Population in Indiana?
Monon has the Highest Percentage of Salvadoran Population in Indiana with 39.40%.
What is the Percentage of Salvadoran Population in the State of Indiana?
Percentage of Salvadoran Population in Indiana is 0.20%.
What is the Percentage of Salvadoran Population in the United States?
Percentage of Salvadoran Population in the United States is 0.72%.