Cities with the Highest Percentage of Salvadoran Population in Illinois
RELATED REPORTS & OPTIONS
Salvadoran
Illinois
Compare Cities
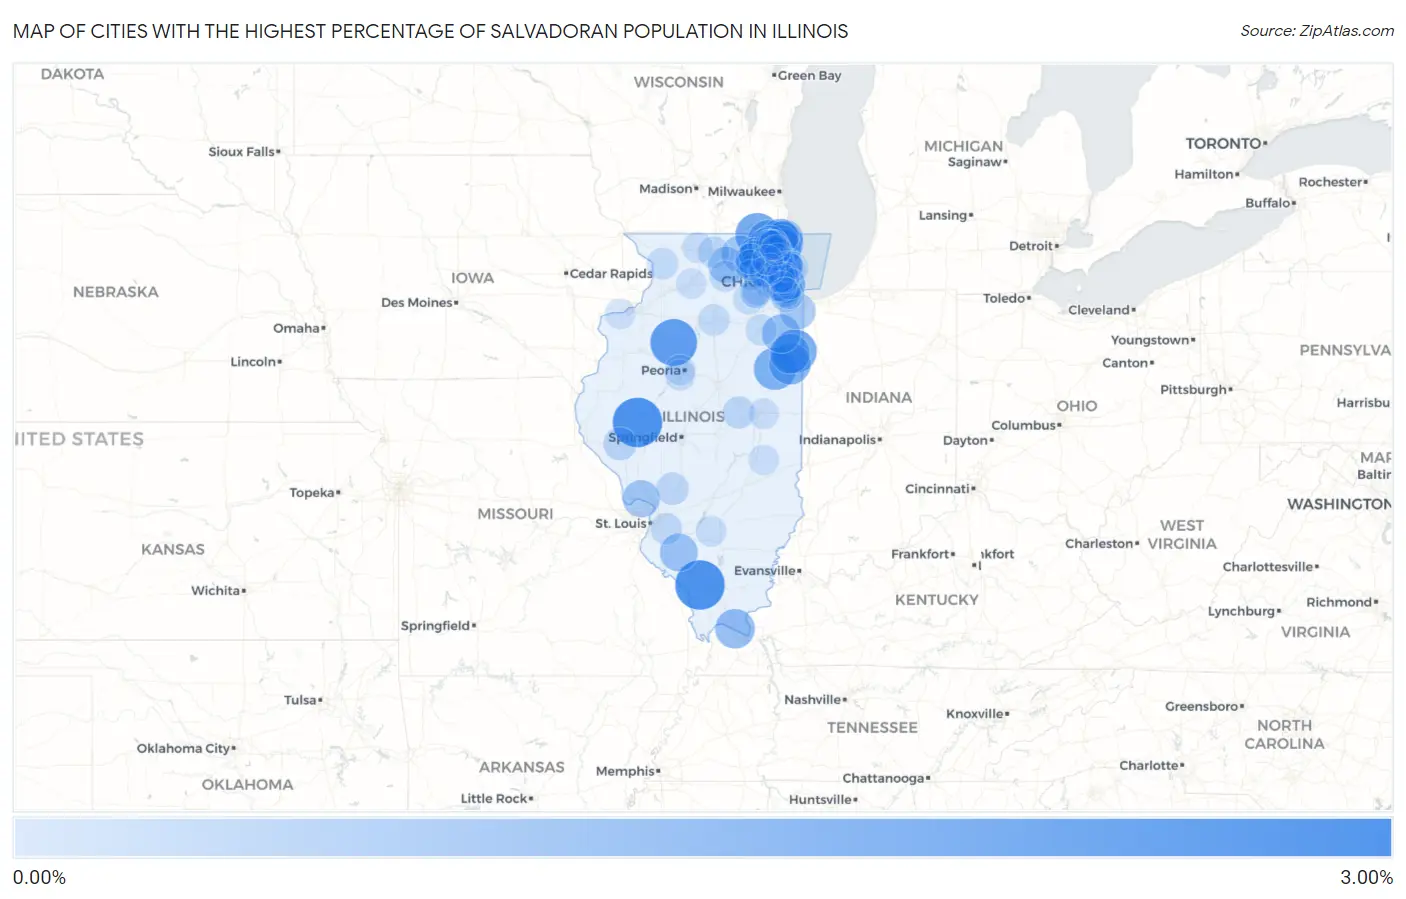
Map of Cities with the Highest Percentage of Salvadoran Population in Illinois
0.00%
3.00%
Cities with the Highest Percentage of Salvadoran Population in Illinois
| City | Salvadoran | vs State | vs National | |
| 1. | Murphysboro | 2.93% | 0.16%(+2.77)#1 | 0.72%(+2.21)#633 |
| 2. | Beardstown | 2.92% | 0.16%(+2.76)#2 | 0.72%(+2.20)#634 |
| 3. | Fox River Grove | 2.54% | 0.16%(+2.38)#3 | 0.72%(+1.82)#737 |
| 4. | Wyoming | 2.53% | 0.16%(+2.37)#4 | 0.72%(+1.81)#739 |
| 5. | Richmond | 2.12% | 0.16%(+1.96)#5 | 0.72%(+1.40)#876 |
| 6. | Park City | 2.06% | 0.16%(+1.91)#6 | 0.72%(+1.34)#889 |
| 7. | Beaverville | 2.02% | 0.16%(+1.86)#7 | 0.72%(+1.30)#906 |
| 8. | Round Lake Heights | 1.90% | 0.16%(+1.74)#8 | 0.72%(+1.18)#959 |
| 9. | Onarga | 1.86% | 0.16%(+1.70)#9 | 0.72%(+1.14)#974 |
| 10. | Carpentersville | 1.80% | 0.16%(+1.64)#10 | 0.72%(+1.08)#995 |
| 11. | Watseka | 1.74% | 0.16%(+1.58)#11 | 0.72%(+1.02)#1,022 |
| 12. | Martinton | 1.49% | 0.16%(+1.33)#12 | 0.72%(+0.766)#1,191 |
| 13. | Metropolis | 1.46% | 0.16%(+1.30)#13 | 0.72%(+0.737)#1,213 |
| 14. | Beach Park | 1.34% | 0.16%(+1.18)#14 | 0.72%(+0.622)#1,299 |
| 15. | Bourbonnais | 1.31% | 0.16%(+1.15)#15 | 0.72%(+0.591)#1,318 |
| 16. | Tilden | 1.21% | 0.16%(+1.05)#16 | 0.72%(+0.492)#1,398 |
| 17. | North Chicago | 1.19% | 0.16%(+1.03)#17 | 0.72%(+0.466)#1,416 |
| 18. | Wadsworth | 1.13% | 0.16%(+0.972)#18 | 0.72%(+0.409)#1,460 |
| 19. | Elsah | 1.11% | 0.16%(+0.954)#19 | 0.72%(+0.391)#1,478 |
| 20. | Rolling Meadows | 1.06% | 0.16%(+0.906)#20 | 0.72%(+0.343)#1,533 |
| 21. | Marengo | 1.03% | 0.16%(+0.872)#21 | 0.72%(+0.309)#1,575 |
| 22. | Volo | 1.02% | 0.16%(+0.862)#22 | 0.72%(+0.299)#1,586 |
| 23. | Kirkland | 1.00% | 0.16%(+0.846)#23 | 0.72%(+0.283)#1,607 |
| 24. | Steger | 0.99% | 0.16%(+0.829)#24 | 0.72%(+0.266)#1,633 |
| 25. | Wheeling | 0.93% | 0.16%(+0.771)#25 | 0.72%(+0.208)#1,695 |
| 26. | West Dundee | 0.92% | 0.16%(+0.759)#26 | 0.72%(+0.196)#1,716 |
| 27. | Stickney | 0.91% | 0.16%(+0.752)#27 | 0.72%(+0.189)#1,725 |
| 28. | Schiller Park | 0.84% | 0.16%(+0.686)#28 | 0.72%(+0.123)#1,799 |
| 29. | Waukegan | 0.76% | 0.16%(+0.601)#29 | 0.72%(+0.038)#1,950 |
| 30. | Palatine | 0.71% | 0.16%(+0.549)#30 | 0.72%(-0.014)#2,041 |
| 31. | Summit | 0.68% | 0.16%(+0.521)#31 | 0.72%(-0.042)#2,085 |
| 32. | Round Lake Beach | 0.62% | 0.16%(+0.466)#32 | 0.72%(-0.097)#2,198 |
| 33. | Morton Grove | 0.62% | 0.16%(+0.464)#33 | 0.72%(-0.099)#2,203 |
| 34. | Wood Dale | 0.62% | 0.16%(+0.460)#34 | 0.72%(-0.103)#2,209 |
| 35. | Lyons | 0.62% | 0.16%(+0.459)#35 | 0.72%(-0.104)#2,210 |
| 36. | Indian Creek | 0.60% | 0.16%(+0.444)#36 | 0.72%(-0.119)#2,249 |
| 37. | Elgin | 0.60% | 0.16%(+0.443)#37 | 0.72%(-0.120)#2,254 |
| 38. | Streamwood | 0.58% | 0.16%(+0.423)#38 | 0.72%(-0.140)#2,296 |
| 39. | Glenview | 0.58% | 0.16%(+0.418)#39 | 0.72%(-0.145)#2,307 |
| 40. | Griggsville | 0.55% | 0.16%(+0.387)#40 | 0.72%(-0.176)#2,376 |
| 41. | Harwood Heights | 0.50% | 0.16%(+0.345)#41 | 0.72%(-0.218)#2,472 |
| 42. | Mount Prospect | 0.47% | 0.16%(+0.315)#42 | 0.72%(-0.248)#2,550 |
| 43. | Benld | 0.46% | 0.16%(+0.299)#43 | 0.72%(-0.264)#2,593 |
| 44. | Des Plaines | 0.45% | 0.16%(+0.292)#44 | 0.72%(-0.271)#2,612 |
| 45. | Hanover Park | 0.45% | 0.16%(+0.290)#45 | 0.72%(-0.273)#2,620 |
| 46. | Crystal Lake | 0.42% | 0.16%(+0.264)#46 | 0.72%(-0.299)#2,692 |
| 47. | De Land | 0.42% | 0.16%(+0.261)#47 | 0.72%(-0.302)#2,705 |
| 48. | Franklin Park | 0.40% | 0.16%(+0.239)#48 | 0.72%(-0.324)#2,765 |
| 49. | Cicero | 0.38% | 0.16%(+0.217)#49 | 0.72%(-0.346)#2,853 |
| 50. | Rockford | 0.35% | 0.16%(+0.192)#50 | 0.72%(-0.371)#2,949 |
| 51. | Evanston | 0.34% | 0.16%(+0.182)#51 | 0.72%(-0.381)#2,980 |
| 52. | Shiloh | 0.34% | 0.16%(+0.180)#52 | 0.72%(-0.383)#2,991 |
| 53. | Lasalle | 0.33% | 0.16%(+0.176)#53 | 0.72%(-0.387)#3,009 |
| 54. | Palos Hills | 0.33% | 0.16%(+0.170)#54 | 0.72%(-0.393)#3,032 |
| 55. | Lake In The Hills | 0.33% | 0.16%(+0.169)#55 | 0.72%(-0.394)#3,034 |
| 56. | Mount Carroll | 0.32% | 0.16%(+0.162)#56 | 0.72%(-0.401)#3,057 |
| 57. | Palos Heights | 0.32% | 0.16%(+0.159)#57 | 0.72%(-0.404)#3,067 |
| 58. | Yorkville | 0.31% | 0.16%(+0.147)#58 | 0.72%(-0.416)#3,117 |
| 59. | Elmwood Park | 0.30% | 0.16%(+0.142)#59 | 0.72%(-0.421)#3,138 |
| 60. | Rosemont | 0.28% | 0.16%(+0.126)#60 | 0.72%(-0.437)#3,209 |
| 61. | Braceville | 0.27% | 0.16%(+0.114)#61 | 0.72%(-0.449)#3,253 |
| 62. | Northfield | 0.26% | 0.16%(+0.104)#62 | 0.72%(-0.459)#3,289 |
| 63. | Malta | 0.26% | 0.16%(+0.102)#63 | 0.72%(-0.461)#3,297 |
| 64. | Wheaton | 0.24% | 0.16%(+0.085)#64 | 0.72%(-0.478)#3,381 |
| 65. | Bartonville | 0.24% | 0.16%(+0.077)#65 | 0.72%(-0.486)#3,419 |
| 66. | Mundelein | 0.23% | 0.16%(+0.076)#66 | 0.72%(-0.487)#3,424 |
| 67. | Pecatonica | 0.23% | 0.16%(+0.075)#67 | 0.72%(-0.488)#3,428 |
| 68. | Round Lake Park | 0.23% | 0.16%(+0.073)#68 | 0.72%(-0.490)#3,434 |
| 69. | Skokie | 0.23% | 0.16%(+0.072)#69 | 0.72%(-0.491)#3,438 |
| 70. | Oak Lawn | 0.23% | 0.16%(+0.072)#70 | 0.72%(-0.491)#3,442 |
| 71. | Glendale Heights | 0.23% | 0.16%(+0.071)#71 | 0.72%(-0.492)#3,444 |
| 72. | Aurora | 0.23% | 0.16%(+0.067)#72 | 0.72%(-0.496)#3,468 |
| 73. | Zion | 0.22% | 0.16%(+0.065)#73 | 0.72%(-0.498)#3,478 |
| 74. | Chicago | 0.22% | 0.16%(+0.060)#74 | 0.72%(-0.503)#3,507 |
| 75. | Maywood | 0.22% | 0.16%(+0.059)#75 | 0.72%(-0.504)#3,512 |
| 76. | Bellevue | 0.22% | 0.16%(+0.059)#76 | 0.72%(-0.504)#3,516 |
| 77. | Campton Hills | 0.20% | 0.16%(+0.040)#77 | 0.72%(-0.523)#3,607 |
| 78. | Centralia | 0.20% | 0.16%(+0.040)#78 | 0.72%(-0.523)#3,609 |
| 79. | Hainesville | 0.20% | 0.16%(+0.039)#79 | 0.72%(-0.524)#3,620 |
| 80. | Buffalo Grove | 0.20% | 0.16%(+0.037)#80 | 0.72%(-0.526)#3,629 |
| 81. | Andalusia | 0.19% | 0.16%(+0.029)#81 | 0.72%(-0.534)#3,659 |
| 82. | Dixon | 0.19% | 0.16%(+0.028)#82 | 0.72%(-0.535)#3,667 |
| 83. | Clarendon Hills | 0.18% | 0.16%(+0.026)#83 | 0.72%(-0.537)#3,673 |
| 84. | Golf | 0.18% | 0.16%(+0.025)#84 | 0.72%(-0.539)#3,681 |
| 85. | Round Lake | 0.18% | 0.16%(+0.023)#85 | 0.72%(-0.540)#3,686 |
| 86. | Urbana | 0.18% | 0.16%(+0.022)#86 | 0.72%(-0.541)#3,697 |
| 87. | River Grove | 0.18% | 0.16%(+0.022)#87 | 0.72%(-0.541)#3,701 |
| 88. | Charleston | 0.18% | 0.16%(+0.021)#88 | 0.72%(-0.542)#3,702 |
| 89. | Western Springs | 0.17% | 0.16%(+0.011)#89 | 0.72%(-0.552)#3,751 |
| 90. | Northlake | 0.17% | 0.16%(+0.007)#90 | 0.72%(-0.556)#3,769 |
| 91. | Schaumburg | 0.16% | 0.16%(-0.000)#91 | 0.72%(-0.563)#3,797 |
| 92. | Bartlett | 0.15% | 0.16%(-0.007)#92 | 0.72%(-0.570)#3,821 |
| 93. | Boulder Hill | 0.15% | 0.16%(-0.012)#93 | 0.72%(-0.575)#3,845 |
| 94. | Pingree Grove | 0.14% | 0.16%(-0.022)#94 | 0.72%(-0.585)#3,926 |
| 95. | Libertyville | 0.14% | 0.16%(-0.022)#95 | 0.72%(-0.585)#3,928 |
| 96. | Montgomery | 0.14% | 0.16%(-0.023)#96 | 0.72%(-0.586)#3,932 |
| 97. | Hickory Hills | 0.13% | 0.16%(-0.025)#97 | 0.72%(-0.588)#3,944 |
| 98. | Huntley | 0.13% | 0.16%(-0.025)#98 | 0.72%(-0.588)#3,946 |
| 99. | Barrington | 0.13% | 0.16%(-0.025)#99 | 0.72%(-0.588)#3,951 |
| 100. | Grayslake | 0.12% | 0.16%(-0.034)#100 | 0.72%(-0.597)#4,000 |
Common Questions
What are the Top 10 Cities with the Highest Percentage of Salvadoran Population in Illinois?
Top 10 Cities with the Highest Percentage of Salvadoran Population in Illinois are:
#1
2.93%
#2
2.92%
#3
2.54%
#4
2.53%
#5
2.12%
#6
2.06%
#7
2.02%
#8
1.90%
#9
1.86%
#10
1.80%
What city has the Highest Percentage of Salvadoran Population in Illinois?
Murphysboro has the Highest Percentage of Salvadoran Population in Illinois with 2.93%.
What is the Percentage of Salvadoran Population in the State of Illinois?
Percentage of Salvadoran Population in Illinois is 0.16%.
What is the Percentage of Salvadoran Population in the United States?
Percentage of Salvadoran Population in the United States is 0.72%.