Cities with the Highest Percentage of Salvadoran Population in Virginia
RELATED REPORTS & OPTIONS
Salvadoran
Virginia
Compare Cities
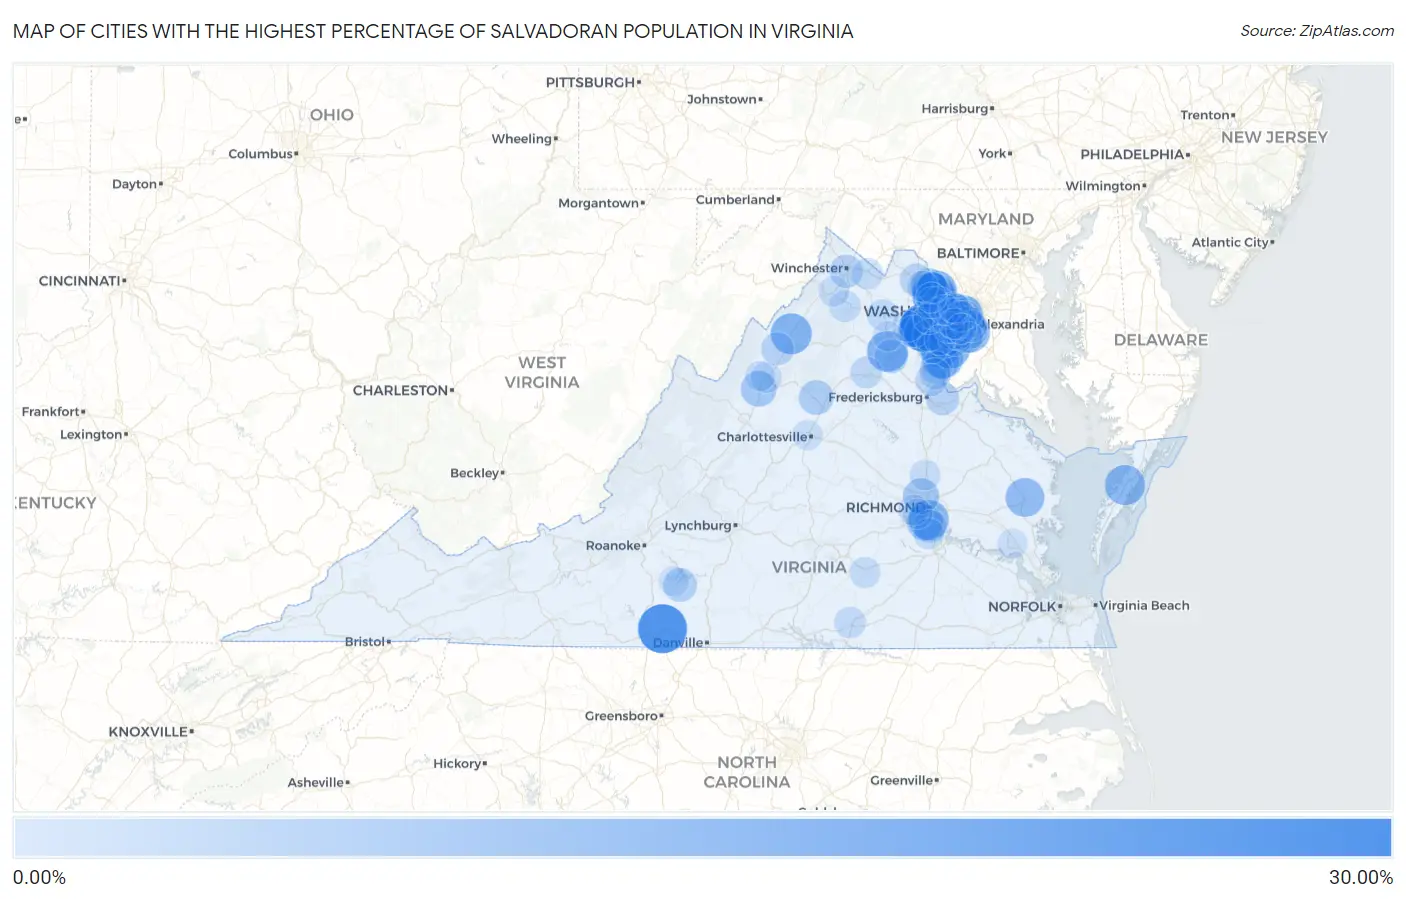
Map of Cities with the Highest Percentage of Salvadoran Population in Virginia
0.00%
30.00%
Cities with the Highest Percentage of Salvadoran Population in Virginia
| City | Salvadoran | vs State | vs National | |
| 1. | Yorkshire | 29.79% | 2.02%(+27.8)#1 | 0.72%(+29.1)#14 |
| 2. | Laurel Park | 28.99% | 2.02%(+27.0)#2 | 0.72%(+28.3)#15 |
| 3. | Loch Lomond | 27.66% | 2.02%(+25.6)#3 | 0.72%(+26.9)#17 |
| 4. | Woodlawn Cdp Fairfax County | 27.47% | 2.02%(+25.5)#4 | 0.72%(+26.7)#19 |
| 5. | Sudley | 21.56% | 2.02%(+19.5)#5 | 0.72%(+20.8)#37 |
| 6. | Herndon | 19.93% | 2.02%(+17.9)#6 | 0.72%(+19.2)#41 |
| 7. | Sterling | 19.92% | 2.02%(+17.9)#7 | 0.72%(+19.2)#42 |
| 8. | Manassas Park | 19.12% | 2.02%(+17.1)#8 | 0.72%(+18.4)#49 |
| 9. | Bull Run | 18.30% | 2.02%(+16.3)#9 | 0.72%(+17.6)#54 |
| 10. | Sugarland Run | 17.64% | 2.02%(+15.6)#10 | 0.72%(+16.9)#58 |
| 11. | Mount Jackson | 17.24% | 2.02%(+15.2)#11 | 0.72%(+16.5)#60 |
| 12. | Hutchison | 17.19% | 2.02%(+15.2)#12 | 0.72%(+16.5)#61 |
| 13. | Opal | 16.93% | 2.02%(+14.9)#13 | 0.72%(+16.2)#62 |
| 14. | Dumfries | 16.76% | 2.02%(+14.7)#14 | 0.72%(+16.0)#63 |
| 15. | Dale City | 16.26% | 2.02%(+14.2)#15 | 0.72%(+15.5)#68 |
| 16. | Onley | 15.85% | 2.02%(+13.8)#16 | 0.72%(+15.1)#70 |
| 17. | Bensley | 15.85% | 2.02%(+13.8)#17 | 0.72%(+15.1)#71 |
| 18. | Woodbridge | 15.76% | 2.02%(+13.7)#18 | 0.72%(+15.0)#72 |
| 19. | Hybla Valley | 15.65% | 2.02%(+13.6)#19 | 0.72%(+14.9)#74 |
| 20. | Seven Corners | 15.53% | 2.02%(+13.5)#20 | 0.72%(+14.8)#77 |
| 21. | Manassas | 14.08% | 2.02%(+12.1)#21 | 0.72%(+13.4)#89 |
| 22. | Saluda | 13.85% | 2.02%(+11.8)#22 | 0.72%(+13.1)#90 |
| 23. | Groveton | 12.44% | 2.02%(+10.4)#23 | 0.72%(+11.7)#107 |
| 24. | Dulles Town Center | 12.32% | 2.02%(+10.3)#24 | 0.72%(+11.6)#108 |
| 25. | Meadowbrook | 10.21% | 2.02%(+8.19)#25 | 0.72%(+9.49)#135 |
| 26. | Dumbarton | 9.87% | 2.02%(+7.85)#26 | 0.72%(+9.14)#140 |
| 27. | University Center | 9.80% | 2.02%(+7.79)#27 | 0.72%(+9.08)#142 |
| 28. | Mount Crawford | 9.63% | 2.02%(+7.61)#28 | 0.72%(+8.91)#148 |
| 29. | Annandale | 9.40% | 2.02%(+7.39)#29 | 0.72%(+8.68)#156 |
| 30. | Stanardsville | 7.93% | 2.02%(+5.91)#30 | 0.72%(+7.21)#194 |
| 31. | Triangle | 7.31% | 2.02%(+5.30)#31 | 0.72%(+6.59)#212 |
| 32. | Idylwood | 7.21% | 2.02%(+5.20)#32 | 0.72%(+6.49)#219 |
| 33. | West Falls Church | 7.12% | 2.02%(+5.10)#33 | 0.72%(+6.40)#223 |
| 34. | Penhook | 6.76% | 2.02%(+4.75)#34 | 0.72%(+6.04)#240 |
| 35. | Bealeton | 6.64% | 2.02%(+4.62)#35 | 0.72%(+5.92)#247 |
| 36. | Bailey S Crossroads | 6.19% | 2.02%(+4.18)#36 | 0.72%(+5.47)#269 |
| 37. | Winchester | 6.12% | 2.02%(+4.10)#37 | 0.72%(+5.40)#273 |
| 38. | Passapatanzy | 5.84% | 2.02%(+3.82)#38 | 0.72%(+5.12)#286 |
| 39. | Timberville | 5.70% | 2.02%(+3.68)#39 | 0.72%(+4.98)#292 |
| 40. | Leesburg | 5.57% | 2.02%(+3.56)#40 | 0.72%(+4.85)#297 |
| 41. | Bellwood | 5.54% | 2.02%(+3.52)#41 | 0.72%(+4.82)#302 |
| 42. | Lake Ridge | 5.49% | 2.02%(+3.48)#42 | 0.72%(+4.77)#304 |
| 43. | Newington Forest | 5.01% | 2.02%(+3.00)#43 | 0.72%(+4.29)#338 |
| 44. | Lincolnia | 4.89% | 2.02%(+2.87)#44 | 0.72%(+4.17)#351 |
| 45. | Boswell S Corner | 4.69% | 2.02%(+2.68)#45 | 0.72%(+3.97)#367 |
| 46. | Chantilly | 4.65% | 2.02%(+2.64)#46 | 0.72%(+3.93)#371 |
| 47. | Buckhall | 4.46% | 2.02%(+2.44)#47 | 0.72%(+3.74)#389 |
| 48. | Lorton | 4.39% | 2.02%(+2.38)#48 | 0.72%(+3.67)#395 |
| 49. | Fairfax | 4.37% | 2.02%(+2.36)#49 | 0.72%(+3.65)#399 |
| 50. | Greenbriar | 4.32% | 2.02%(+2.30)#50 | 0.72%(+3.60)#406 |
| 51. | Springfield | 4.26% | 2.02%(+2.25)#51 | 0.72%(+3.54)#412 |
| 52. | Stafford Courthouse | 4.24% | 2.02%(+2.23)#52 | 0.72%(+3.52)#416 |
| 53. | Alexandria | 4.18% | 2.02%(+2.17)#53 | 0.72%(+3.46)#423 |
| 54. | Culpeper | 4.13% | 2.02%(+2.12)#54 | 0.72%(+3.41)#428 |
| 55. | Linton Hall | 4.03% | 2.02%(+2.02)#55 | 0.72%(+3.31)#441 |
| 56. | Sully Square | 3.98% | 2.02%(+1.97)#56 | 0.72%(+3.26)#447 |
| 57. | Newington | 3.96% | 2.02%(+1.94)#57 | 0.72%(+3.24)#450 |
| 58. | Huntington | 3.95% | 2.02%(+1.94)#58 | 0.72%(+3.23)#452 |
| 59. | Reston | 3.86% | 2.02%(+1.85)#59 | 0.72%(+3.14)#461 |
| 60. | Leesylvania | 3.64% | 2.02%(+1.62)#60 | 0.72%(+2.91)#494 |
| 61. | South Hill | 3.63% | 2.02%(+1.61)#61 | 0.72%(+2.91)#496 |
| 62. | Rose Hill Cdp Fairfax County | 3.62% | 2.02%(+1.61)#62 | 0.72%(+2.90)#498 |
| 63. | Arlington | 3.58% | 2.02%(+1.57)#63 | 0.72%(+2.86)#508 |
| 64. | Long Branch | 3.58% | 2.02%(+1.56)#64 | 0.72%(+2.85)#512 |
| 65. | Independent Hill | 3.57% | 2.02%(+1.55)#65 | 0.72%(+2.85)#514 |
| 66. | Mount Vernon | 3.56% | 2.02%(+1.55)#66 | 0.72%(+2.84)#515 |
| 67. | Front Royal | 3.54% | 2.02%(+1.52)#67 | 0.72%(+2.82)#521 |
| 68. | Marshall | 3.40% | 2.02%(+1.38)#68 | 0.72%(+2.67)#542 |
| 69. | Aquia Harbour | 3.38% | 2.02%(+1.37)#69 | 0.72%(+2.66)#545 |
| 70. | Countryside | 3.12% | 2.02%(+1.10)#70 | 0.72%(+2.40)#580 |
| 71. | Chester | 3.04% | 2.02%(+1.02)#71 | 0.72%(+2.32)#609 |
| 72. | Mcnair | 3.04% | 2.02%(+1.02)#72 | 0.72%(+2.32)#611 |
| 73. | North Springfield | 3.04% | 2.02%(+1.02)#73 | 0.72%(+2.31)#612 |
| 74. | Berryville | 3.02% | 2.02%(+1.01)#74 | 0.72%(+2.30)#614 |
| 75. | Blackstone | 2.91% | 2.02%(+0.899)#75 | 0.72%(+2.19)#638 |
| 76. | West Springfield | 2.88% | 2.02%(+0.868)#76 | 0.72%(+2.16)#648 |
| 77. | Belmont | 2.86% | 2.02%(+0.846)#77 | 0.72%(+2.14)#654 |
| 78. | Harrisonburg | 2.84% | 2.02%(+0.822)#78 | 0.72%(+2.12)#660 |
| 79. | Gainesville | 2.83% | 2.02%(+0.812)#79 | 0.72%(+2.11)#666 |
| 80. | Middletown | 2.57% | 2.02%(+0.551)#80 | 0.72%(+1.85)#731 |
| 81. | Bon Air | 2.50% | 2.02%(+0.482)#81 | 0.72%(+1.78)#758 |
| 82. | Mcgaheysville | 2.44% | 2.02%(+0.427)#82 | 0.72%(+1.72)#771 |
| 83. | Burke | 2.42% | 2.02%(+0.405)#83 | 0.72%(+1.70)#782 |
| 84. | Ashland | 2.42% | 2.02%(+0.399)#84 | 0.72%(+1.69)#784 |
| 85. | Merrifield | 2.40% | 2.02%(+0.388)#85 | 0.72%(+1.68)#787 |
| 86. | Centreville | 2.38% | 2.02%(+0.365)#86 | 0.72%(+1.66)#794 |
| 87. | Pimmit Hills | 2.29% | 2.02%(+0.276)#87 | 0.72%(+1.57)#820 |
| 88. | University Of Virginia | 2.26% | 2.02%(+0.243)#88 | 0.72%(+1.54)#831 |
| 89. | Lake Barcroft | 1.97% | 2.02%(-0.043)#89 | 0.72%(+1.25)#924 |
| 90. | County Center | 1.96% | 2.02%(-0.053)#90 | 0.72%(+1.24)#927 |
| 91. | Manchester | 1.96% | 2.02%(-0.055)#91 | 0.72%(+1.24)#929 |
| 92. | Ravensworth | 1.95% | 2.02%(-0.062)#92 | 0.72%(+1.23)#932 |
| 93. | Belmont Estates | 1.93% | 2.02%(-0.087)#93 | 0.72%(+1.21)#942 |
| 94. | Oakton | 1.90% | 2.02%(-0.114)#94 | 0.72%(+1.18)#955 |
| 95. | Williamsburg | 1.81% | 2.02%(-0.202)#95 | 0.72%(+1.09)#990 |
| 96. | Warrenton | 1.80% | 2.02%(-0.216)#96 | 0.72%(+1.08)#996 |
| 97. | Union Hall | 1.77% | 2.02%(-0.242)#97 | 0.72%(+1.05)#1,007 |
| 98. | Tysons | 1.77% | 2.02%(-0.249)#98 | 0.72%(+1.05)#1,012 |
| 99. | Franconia | 1.76% | 2.02%(-0.257)#99 | 0.72%(+1.04)#1,014 |
| 100. | Oak Grove | 1.66% | 2.02%(-0.358)#100 | 0.72%(+0.936)#1,078 |
Common Questions
What are the Top 10 Cities with the Highest Percentage of Salvadoran Population in Virginia?
Top 10 Cities with the Highest Percentage of Salvadoran Population in Virginia are:
#1
29.79%
#2
28.99%
#3
27.66%
#4
21.56%
#5
19.93%
#6
19.92%
#7
19.12%
#8
18.30%
#9
17.64%
#10
17.24%
What city has the Highest Percentage of Salvadoran Population in Virginia?
Yorkshire has the Highest Percentage of Salvadoran Population in Virginia with 29.79%.
What is the Percentage of Salvadoran Population in the State of Virginia?
Percentage of Salvadoran Population in Virginia is 2.02%.
What is the Percentage of Salvadoran Population in the United States?
Percentage of Salvadoran Population in the United States is 0.72%.