Cities with the Highest Percentage of Salvadoran Population in New York
RELATED REPORTS & OPTIONS
Salvadoran
New York
Compare Cities
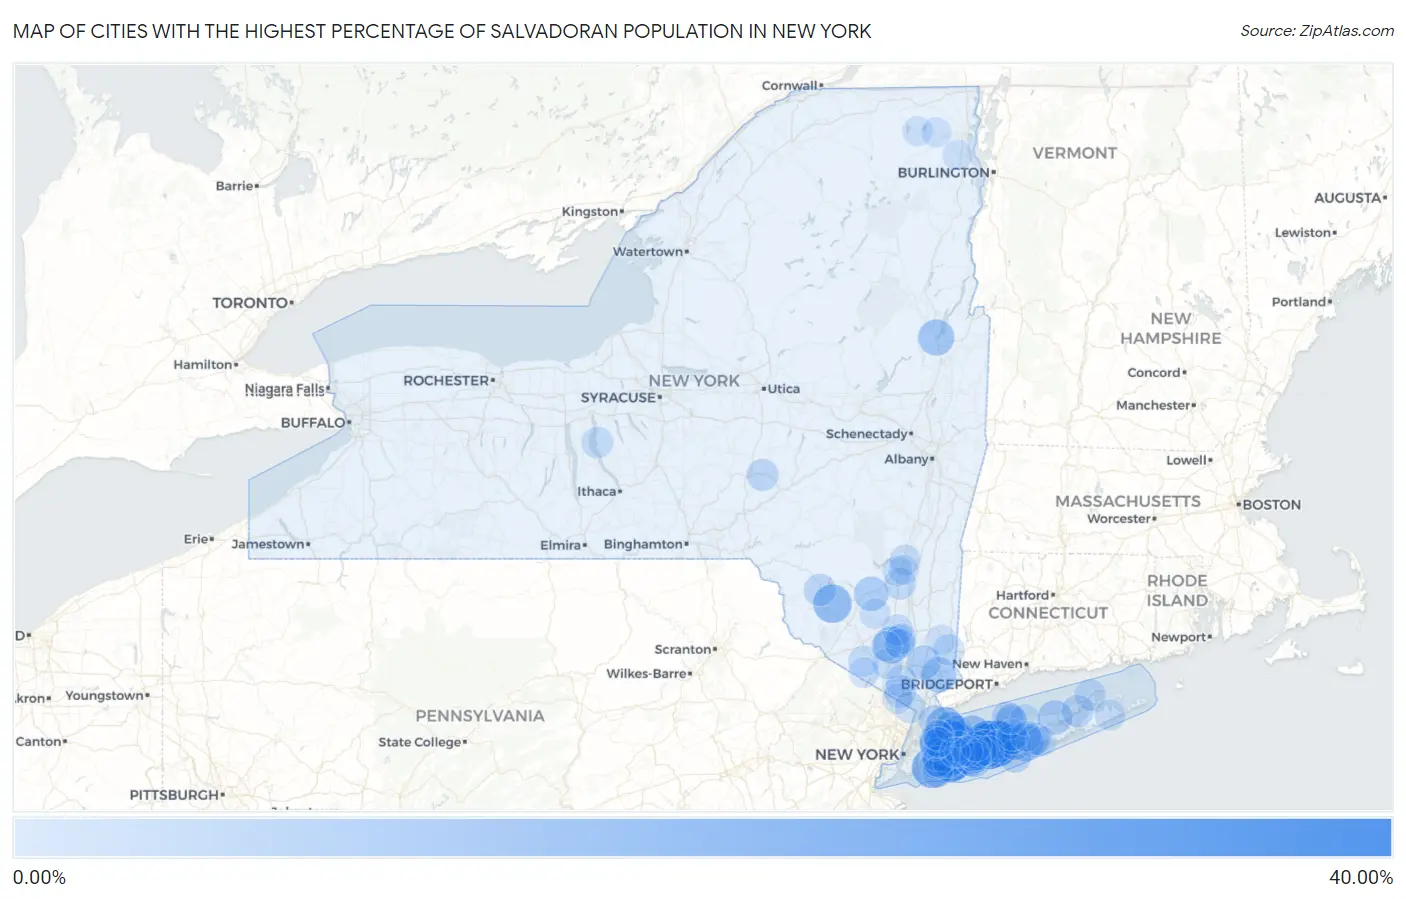
Map of Cities with the Highest Percentage of Salvadoran Population in New York
0.00%
40.00%
Cities with the Highest Percentage of Salvadoran Population in New York
| City | Salvadoran | vs State | vs National | |
| 1. | New Cassel | 30.99% | 0.94%(+30.1)#1 | 0.72%(+30.3)#11 |
| 2. | Central Islip | 26.03% | 0.94%(+25.1)#2 | 0.72%(+25.3)#25 |
| 3. | Brentwood | 25.86% | 0.94%(+24.9)#3 | 0.72%(+25.1)#26 |
| 4. | North Bay Shore | 25.62% | 0.94%(+24.7)#4 | 0.72%(+24.9)#28 |
| 5. | Roosevelt | 23.74% | 0.94%(+22.8)#5 | 0.72%(+23.0)#33 |
| 6. | Hempstead | 21.48% | 0.94%(+20.5)#6 | 0.72%(+20.8)#38 |
| 7. | Uniondale | 19.70% | 0.94%(+18.8)#7 | 0.72%(+19.0)#45 |
| 8. | Inwood | 18.05% | 0.94%(+17.1)#8 | 0.72%(+17.3)#57 |
| 9. | Wyandanch | 16.42% | 0.94%(+15.5)#9 | 0.72%(+15.7)#66 |
| 10. | North Amityville | 14.23% | 0.94%(+13.3)#10 | 0.72%(+13.5)#85 |
| 11. | South Fallsburg | 14.19% | 0.94%(+13.3)#11 | 0.72%(+13.5)#87 |
| 12. | Glen Cove | 14.18% | 0.94%(+13.2)#12 | 0.72%(+13.5)#88 |
| 13. | Islandia | 13.31% | 0.94%(+12.4)#13 | 0.72%(+12.6)#95 |
| 14. | Freeport | 12.20% | 0.94%(+11.3)#14 | 0.72%(+11.5)#110 |
| 15. | North Bellport | 12.10% | 0.94%(+11.2)#15 | 0.72%(+11.4)#111 |
| 16. | Westbury | 11.91% | 0.94%(+11.0)#16 | 0.72%(+11.2)#114 |
| 17. | Salisbury Mills | 11.81% | 0.94%(+10.9)#17 | 0.72%(+11.1)#115 |
| 18. | Huntington Station | 11.52% | 0.94%(+10.6)#18 | 0.72%(+10.8)#117 |
| 19. | North Lynbrook | 11.06% | 0.94%(+10.1)#19 | 0.72%(+10.3)#126 |
| 20. | Lake George | 10.71% | 0.94%(+9.77)#20 | 0.72%(+9.99)#130 |
| 21. | Baywood | 9.53% | 0.94%(+8.60)#21 | 0.72%(+8.81)#150 |
| 22. | Bedford Hills | 9.24% | 0.94%(+8.31)#22 | 0.72%(+8.52)#158 |
| 23. | Riverhead | 8.35% | 0.94%(+7.42)#23 | 0.72%(+7.63)#177 |
| 24. | Copiague | 8.23% | 0.94%(+7.29)#24 | 0.72%(+7.51)#180 |
| 25. | Kerhonkson | 8.15% | 0.94%(+7.21)#25 | 0.72%(+7.42)#182 |
| 26. | Grahamsville | 7.96% | 0.94%(+7.03)#26 | 0.72%(+7.24)#192 |
| 27. | Shrub Oak | 7.69% | 0.94%(+6.76)#27 | 0.72%(+6.97)#200 |
| 28. | Old Brookville | 7.31% | 0.94%(+6.37)#28 | 0.72%(+6.58)#213 |
| 29. | East Farmingdale | 7.03% | 0.94%(+6.10)#29 | 0.72%(+6.31)#227 |
| 30. | Salisbury | 6.85% | 0.94%(+5.91)#30 | 0.72%(+6.13)#234 |
| 31. | Port Jefferson Station | 6.78% | 0.94%(+5.85)#31 | 0.72%(+6.06)#238 |
| 32. | North Great River | 6.25% | 0.94%(+5.31)#32 | 0.72%(+5.53)#265 |
| 33. | Locust Valley | 5.84% | 0.94%(+4.91)#33 | 0.72%(+5.12)#285 |
| 34. | Fire Island | 5.70% | 0.94%(+4.77)#34 | 0.72%(+4.98)#290 |
| 35. | South Valley Stream | 5.47% | 0.94%(+4.53)#35 | 0.72%(+4.75)#306 |
| 36. | Williston Park | 5.41% | 0.94%(+4.47)#36 | 0.72%(+4.69)#310 |
| 37. | Mastic | 5.34% | 0.94%(+4.40)#37 | 0.72%(+4.62)#316 |
| 38. | North Patchogue | 5.31% | 0.94%(+4.37)#38 | 0.72%(+4.59)#320 |
| 39. | Elmont | 5.24% | 0.94%(+4.30)#39 | 0.72%(+4.52)#326 |
| 40. | Mamaroneck | 5.22% | 0.94%(+4.29)#40 | 0.72%(+4.50)#328 |
| 41. | Liberty | 5.13% | 0.94%(+4.19)#41 | 0.72%(+4.41)#331 |
| 42. | Amityville | 5.11% | 0.94%(+4.18)#42 | 0.72%(+4.39)#334 |
| 43. | Hillcrest | 5.01% | 0.94%(+4.08)#43 | 0.72%(+4.29)#337 |
| 44. | New Suffolk | 4.92% | 0.94%(+3.98)#44 | 0.72%(+4.20)#346 |
| 45. | North Lindenhurst | 4.85% | 0.94%(+3.91)#45 | 0.72%(+4.13)#358 |
| 46. | Morris | 4.67% | 0.94%(+3.74)#46 | 0.72%(+3.95)#369 |
| 47. | Poquott | 4.61% | 0.94%(+3.67)#47 | 0.72%(+3.89)#378 |
| 48. | Shirley | 4.48% | 0.94%(+3.54)#48 | 0.72%(+3.75)#387 |
| 49. | Kensington | 4.29% | 0.94%(+3.35)#49 | 0.72%(+3.57)#409 |
| 50. | Mount Ivy | 4.26% | 0.94%(+3.32)#50 | 0.72%(+3.53)#413 |
| 51. | Rifton | 4.20% | 0.94%(+3.26)#51 | 0.72%(+3.48)#420 |
| 52. | Great Neck Plaza | 4.19% | 0.94%(+3.26)#52 | 0.72%(+3.47)#421 |
| 53. | Greenport | 3.97% | 0.94%(+3.03)#53 | 0.72%(+3.25)#449 |
| 54. | Vails Gate | 3.96% | 0.94%(+3.02)#54 | 0.72%(+3.24)#451 |
| 55. | Brewster | 3.83% | 0.94%(+2.89)#55 | 0.72%(+3.11)#466 |
| 56. | Great Neck | 3.82% | 0.94%(+2.88)#56 | 0.72%(+3.09)#469 |
| 57. | Oyster Bay | 3.80% | 0.94%(+2.86)#57 | 0.72%(+3.07)#473 |
| 58. | Tappan | 3.62% | 0.94%(+2.68)#58 | 0.72%(+2.90)#500 |
| 59. | Aurora | 3.61% | 0.94%(+2.68)#59 | 0.72%(+2.89)#503 |
| 60. | Holtsville | 3.58% | 0.94%(+2.64)#60 | 0.72%(+2.86)#510 |
| 61. | Farmingville | 3.54% | 0.94%(+2.60)#61 | 0.72%(+2.82)#520 |
| 62. | West Hempstead | 3.51% | 0.94%(+2.57)#62 | 0.72%(+2.78)#525 |
| 63. | Gardnertown | 3.50% | 0.94%(+2.56)#63 | 0.72%(+2.78)#526 |
| 64. | Baldwin | 3.35% | 0.94%(+2.42)#64 | 0.72%(+2.63)#555 |
| 65. | Florida | 3.34% | 0.94%(+2.40)#65 | 0.72%(+2.62)#557 |
| 66. | Rocky Point | 3.32% | 0.94%(+2.38)#66 | 0.72%(+2.60)#559 |
| 67. | Hicksville | 3.29% | 0.94%(+2.35)#67 | 0.72%(+2.57)#562 |
| 68. | Lake Katrine | 3.10% | 0.94%(+2.16)#68 | 0.72%(+2.38)#592 |
| 69. | Valley Stream | 3.04% | 0.94%(+2.10)#69 | 0.72%(+2.32)#610 |
| 70. | East Hampton North | 2.92% | 0.94%(+1.98)#70 | 0.72%(+2.20)#637 |
| 71. | New Windsor | 2.79% | 0.94%(+1.85)#71 | 0.72%(+2.07)#673 |
| 72. | Baxter Estates | 2.79% | 0.94%(+1.85)#72 | 0.72%(+2.07)#674 |
| 73. | University Gardens | 2.76% | 0.94%(+1.82)#73 | 0.72%(+2.04)#683 |
| 74. | Lattingtown | 2.75% | 0.94%(+1.81)#74 | 0.72%(+2.02)#688 |
| 75. | Harriman | 2.64% | 0.94%(+1.70)#75 | 0.72%(+1.92)#716 |
| 76. | Warwick | 2.59% | 0.94%(+1.65)#76 | 0.72%(+1.86)#725 |
| 77. | Watchtower | 2.57% | 0.94%(+1.63)#77 | 0.72%(+1.85)#729 |
| 78. | Chestnut Ridge | 2.55% | 0.94%(+1.62)#78 | 0.72%(+1.83)#734 |
| 79. | West Babylon | 2.52% | 0.94%(+1.58)#79 | 0.72%(+1.80)#744 |
| 80. | Yaphank | 2.50% | 0.94%(+1.57)#80 | 0.72%(+1.78)#751 |
| 81. | Bay Shore | 2.48% | 0.94%(+1.54)#81 | 0.72%(+1.76)#764 |
| 82. | Lindenhurst | 2.44% | 0.94%(+1.50)#82 | 0.72%(+1.72)#774 |
| 83. | Port Jefferson | 2.42% | 0.94%(+1.48)#83 | 0.72%(+1.69)#785 |
| 84. | Hurley | 2.40% | 0.94%(+1.47)#84 | 0.72%(+1.68)#788 |
| 85. | Manorhaven | 2.37% | 0.94%(+1.43)#85 | 0.72%(+1.65)#795 |
| 86. | Levittown | 2.36% | 0.94%(+1.42)#86 | 0.72%(+1.64)#798 |
| 87. | Center Moriches | 2.22% | 0.94%(+1.28)#87 | 0.72%(+1.50)#843 |
| 88. | North Babylon | 2.21% | 0.94%(+1.27)#88 | 0.72%(+1.49)#844 |
| 89. | East Atlantic Beach | 2.15% | 0.94%(+1.21)#89 | 0.72%(+1.43)#867 |
| 90. | Firthcliffe | 2.13% | 0.94%(+1.19)#90 | 0.72%(+1.41)#874 |
| 91. | Farmingdale | 2.11% | 0.94%(+1.18)#91 | 0.72%(+1.39)#878 |
| 92. | Washingtonville | 2.08% | 0.94%(+1.14)#92 | 0.72%(+1.35)#886 |
| 93. | Manhasset | 2.05% | 0.94%(+1.11)#93 | 0.72%(+1.32)#893 |
| 94. | Wheatley Heights | 2.04% | 0.94%(+1.11)#94 | 0.72%(+1.32)#895 |
| 95. | Lyon Mountain | 2.00% | 0.94%(+1.06)#95 | 0.72%(+1.28)#917 |
| 96. | Lake Carmel | 1.98% | 0.94%(+1.04)#96 | 0.72%(+1.26)#922 |
| 97. | Peru | 1.94% | 0.94%(+1.00)#97 | 0.72%(+1.22)#939 |
| 98. | Dannemora | 1.90% | 0.94%(+0.961)#98 | 0.72%(+1.18)#960 |
| 99. | East Meadow | 1.88% | 0.94%(+0.944)#99 | 0.72%(+1.16)#969 |
| 100. | Kingston | 1.86% | 0.94%(+0.925)#100 | 0.72%(+1.14)#975 |
Common Questions
What are the Top 10 Cities with the Highest Percentage of Salvadoran Population in New York?
Top 10 Cities with the Highest Percentage of Salvadoran Population in New York are:
#1
30.99%
#2
26.03%
#3
25.86%
#4
25.62%
#5
23.74%
#6
21.48%
#7
19.70%
#8
18.05%
#9
16.42%
#10
14.23%
What city has the Highest Percentage of Salvadoran Population in New York?
New Cassel has the Highest Percentage of Salvadoran Population in New York with 30.99%.
What is the Percentage of Salvadoran Population in the State of New York?
Percentage of Salvadoran Population in New York is 0.94%.
What is the Percentage of Salvadoran Population in the United States?
Percentage of Salvadoran Population in the United States is 0.72%.