Cities with the Highest Percentage of Salvadoran Population in Missouri
RELATED REPORTS & OPTIONS
Salvadoran
Missouri
Compare Cities
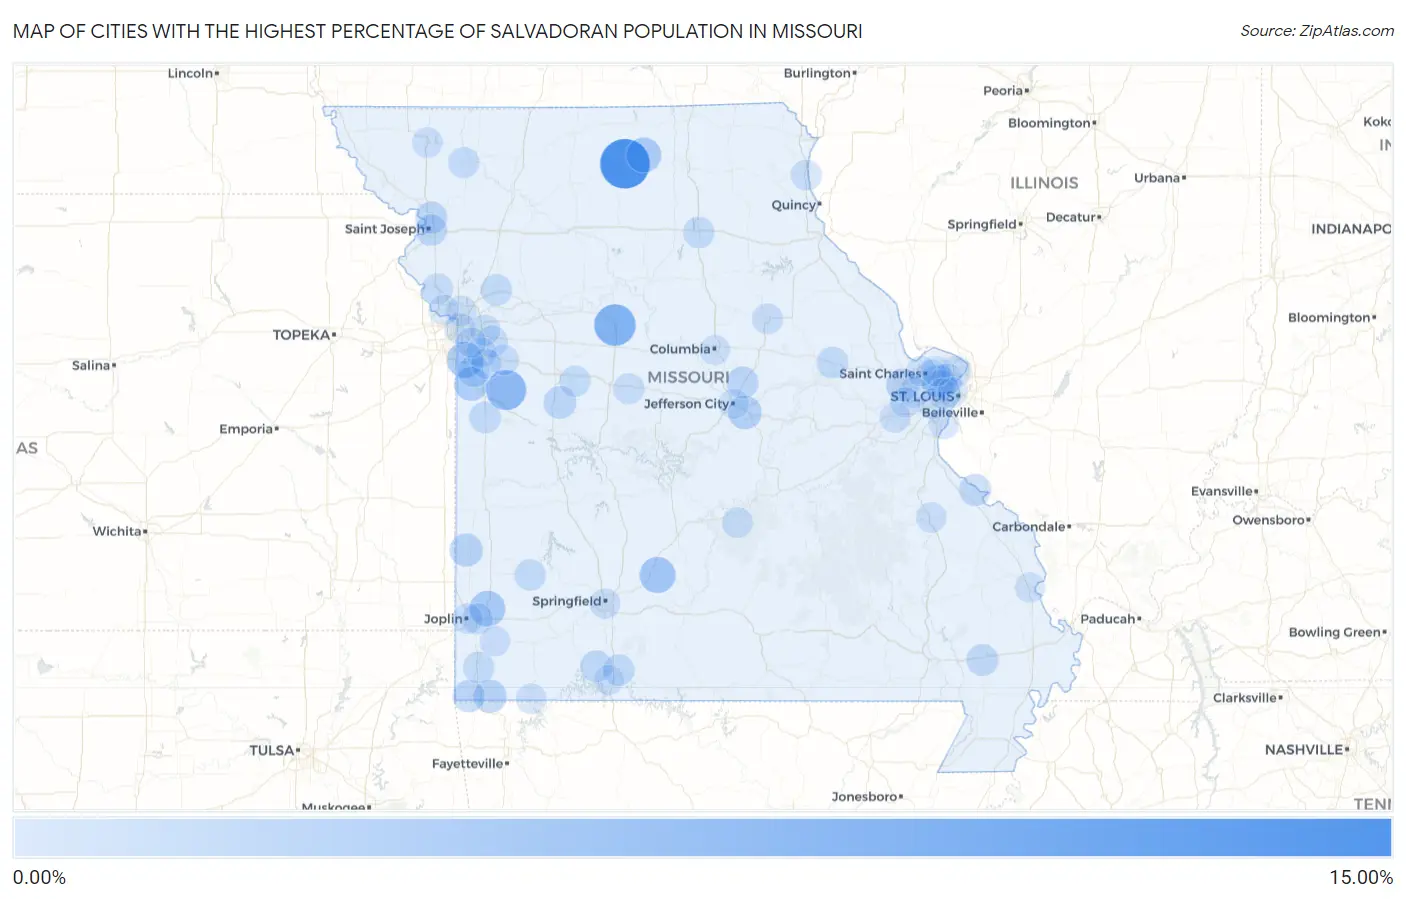
Map of Cities with the Highest Percentage of Salvadoran Population in Missouri
0.00%
15.00%
Cities with the Highest Percentage of Salvadoran Population in Missouri
| City | Salvadoran | vs State | vs National | |
| 1. | Milan | 10.46% | 0.13%(+10.3)#1 | 0.72%(+9.74)#132 |
| 2. | Marshall | 5.98% | 0.13%(+5.85)#2 | 0.72%(+5.26)#281 |
| 3. | Gunn City | 5.10% | 0.13%(+4.97)#3 | 0.72%(+4.38)#335 |
| 4. | Niangua | 3.10% | 0.13%(+2.97)#4 | 0.72%(+2.38)#588 |
| 5. | Grandview | 3.09% | 0.13%(+2.96)#5 | 0.72%(+2.37)#593 |
| 6. | Carthage | 2.87% | 0.13%(+2.74)#6 | 0.72%(+2.15)#650 |
| 7. | Green City | 2.52% | 0.13%(+2.39)#7 | 0.72%(+1.80)#747 |
| 8. | Peculiar | 2.08% | 0.13%(+1.95)#8 | 0.72%(+1.36)#885 |
| 9. | Taos | 1.73% | 0.13%(+1.60)#9 | 0.72%(+1.00)#1,032 |
| 10. | Liberal | 1.51% | 0.13%(+1.38)#10 | 0.72%(+0.790)#1,174 |
| 11. | Jane | 1.50% | 0.13%(+1.37)#11 | 0.72%(+0.774)#1,186 |
| 12. | Weldon Spring Heights | 1.38% | 0.13%(+1.25)#12 | 0.72%(+0.658)#1,268 |
| 13. | Woodson Terrace | 1.37% | 0.13%(+1.24)#13 | 0.72%(+0.648)#1,277 |
| 14. | Leeton | 1.32% | 0.13%(+1.19)#14 | 0.72%(+0.594)#1,316 |
| 15. | Noel | 1.04% | 0.13%(+0.906)#15 | 0.72%(+0.315)#1,568 |
| 16. | New Bloomfield | 0.99% | 0.13%(+0.860)#16 | 0.72%(+0.268)#1,629 |
| 17. | Country Club | 0.97% | 0.13%(+0.841)#17 | 0.72%(+0.250)#1,647 |
| 18. | Ste Genevieve | 0.97% | 0.13%(+0.837)#18 | 0.72%(+0.245)#1,654 |
| 19. | Dexter | 0.88% | 0.13%(+0.755)#19 | 0.72%(+0.163)#1,753 |
| 20. | Reeds Spring | 0.83% | 0.13%(+0.703)#20 | 0.72%(+0.112)#1,817 |
| 21. | St Joseph | 0.82% | 0.13%(+0.690)#21 | 0.72%(+0.098)#1,837 |
| 22. | Raymore | 0.80% | 0.13%(+0.675)#22 | 0.72%(+0.083)#1,866 |
| 23. | Archie | 0.77% | 0.13%(+0.644)#23 | 0.72%(+0.052)#1,928 |
| 24. | Merriam Woods | 0.74% | 0.13%(+0.613)#24 | 0.72%(+0.021)#1,978 |
| 25. | Lockwood | 0.73% | 0.13%(+0.599)#25 | 0.72%(+0.007)#2,001 |
| 26. | Jonesburg | 0.72% | 0.13%(+0.585)#26 | 0.72%(-0.006)#2,029 |
| 27. | Excelsior Springs | 0.67% | 0.13%(+0.543)#27 | 0.72%(-0.048)#2,096 |
| 28. | Goodman | 0.66% | 0.13%(+0.533)#28 | 0.72%(-0.059)#2,122 |
| 29. | Macon | 0.62% | 0.13%(+0.494)#29 | 0.72%(-0.098)#2,200 |
| 30. | Whiteman Afb | 0.49% | 0.13%(+0.356)#30 | 0.72%(-0.236)#2,521 |
| 31. | Stanberry | 0.48% | 0.13%(+0.346)#31 | 0.72%(-0.246)#2,542 |
| 32. | Blue Springs | 0.42% | 0.13%(+0.285)#32 | 0.72%(-0.306)#2,718 |
| 33. | Smithton | 0.39% | 0.13%(+0.259)#33 | 0.72%(-0.333)#2,795 |
| 34. | Kansas City | 0.37% | 0.13%(+0.237)#34 | 0.72%(-0.355)#2,878 |
| 35. | Platte City | 0.36% | 0.13%(+0.226)#35 | 0.72%(-0.366)#2,934 |
| 36. | Spanish Lake | 0.35% | 0.13%(+0.225)#36 | 0.72%(-0.367)#2,939 |
| 37. | Mexico | 0.32% | 0.13%(+0.192)#37 | 0.72%(-0.400)#3,055 |
| 38. | Independence | 0.32% | 0.13%(+0.191)#38 | 0.72%(-0.401)#3,056 |
| 39. | Duenweg | 0.31% | 0.13%(+0.182)#39 | 0.72%(-0.410)#3,091 |
| 40. | Lone Jack | 0.30% | 0.13%(+0.171)#40 | 0.72%(-0.420)#3,134 |
| 41. | Fort Leonard Wood | 0.29% | 0.13%(+0.165)#41 | 0.72%(-0.427)#3,166 |
| 42. | Canton | 0.29% | 0.13%(+0.163)#42 | 0.72%(-0.429)#3,177 |
| 43. | Bridgeton | 0.25% | 0.13%(+0.124)#43 | 0.72%(-0.468)#3,324 |
| 44. | Pacific | 0.25% | 0.13%(+0.119)#44 | 0.72%(-0.473)#3,351 |
| 45. | Seligman | 0.22% | 0.13%(+0.091)#45 | 0.72%(-0.501)#3,495 |
| 46. | Joplin | 0.21% | 0.13%(+0.080)#46 | 0.72%(-0.511)#3,558 |
| 47. | Oakville | 0.17% | 0.13%(+0.042)#47 | 0.72%(-0.549)#3,733 |
| 48. | Charlack | 0.16% | 0.13%(+0.025)#48 | 0.72%(-0.566)#3,808 |
| 49. | Springfield | 0.15% | 0.13%(+0.023)#49 | 0.72%(-0.568)#3,817 |
| 50. | Lee S Summit | 0.15% | 0.13%(+0.017)#50 | 0.72%(-0.574)#3,841 |
| 51. | Maryville | 0.14% | 0.13%(+0.010)#51 | 0.72%(-0.581)#3,899 |
| 52. | Farmington | 0.14% | 0.13%(+0.010)#52 | 0.72%(-0.582)#3,903 |
| 53. | Greenwood | 0.13% | 0.13%(+0.002)#53 | 0.72%(-0.589)#3,957 |
| 54. | Granby | 0.13% | 0.13%(+0.002)#54 | 0.72%(-0.590)#3,961 |
| 55. | Chesterfield | 0.12% | 0.13%(-0.005)#55 | 0.72%(-0.597)#4,002 |
| 56. | Ferguson | 0.11% | 0.13%(-0.017)#56 | 0.72%(-0.608)#4,074 |
| 57. | Cape Girardeau | 0.093% | 0.13%(-0.037)#57 | 0.72%(-0.629)#4,216 |
| 58. | Gladstone | 0.074% | 0.13%(-0.056)#58 | 0.72%(-0.648)#4,339 |
| 59. | Jefferson City | 0.068% | 0.13%(-0.062)#59 | 0.72%(-0.654)#4,385 |
| 60. | Parkville | 0.065% | 0.13%(-0.065)#60 | 0.72%(-0.656)#4,407 |
| 61. | Kirkwood | 0.065% | 0.13%(-0.065)#61 | 0.72%(-0.657)#4,414 |
| 62. | Columbia | 0.043% | 0.13%(-0.087)#62 | 0.72%(-0.679)#4,584 |
| 63. | Clayton | 0.041% | 0.13%(-0.089)#63 | 0.72%(-0.681)#4,603 |
| 64. | Raytown | 0.034% | 0.13%(-0.096)#64 | 0.72%(-0.688)#4,644 |
| 65. | Branson | 0.024% | 0.13%(-0.106)#65 | 0.72%(-0.698)#4,703 |
| 66. | Wildwood | 0.020% | 0.13%(-0.110)#66 | 0.72%(-0.702)#4,727 |
| 67. | St Louis | 0.017% | 0.13%(-0.113)#67 | 0.72%(-0.705)#4,749 |
| 68. | Hazelwood | 0.016% | 0.13%(-0.114)#68 | 0.72%(-0.706)#4,753 |
| 69. | St Charles | 0.011% | 0.13%(-0.119)#69 | 0.72%(-0.710)#4,776 |
Common Questions
What are the Top 10 Cities with the Highest Percentage of Salvadoran Population in Missouri?
Top 10 Cities with the Highest Percentage of Salvadoran Population in Missouri are:
What city has the Highest Percentage of Salvadoran Population in Missouri?
Milan has the Highest Percentage of Salvadoran Population in Missouri with 10.46%.
What is the Percentage of Salvadoran Population in the State of Missouri?
Percentage of Salvadoran Population in Missouri is 0.13%.
What is the Percentage of Salvadoran Population in the United States?
Percentage of Salvadoran Population in the United States is 0.72%.