Cities with the Highest Percentage of Population Employed in Education Instruction & Library in Vermont
RELATED REPORTS & OPTIONS
Education Instruction & Library
Vermont
Compare Cities
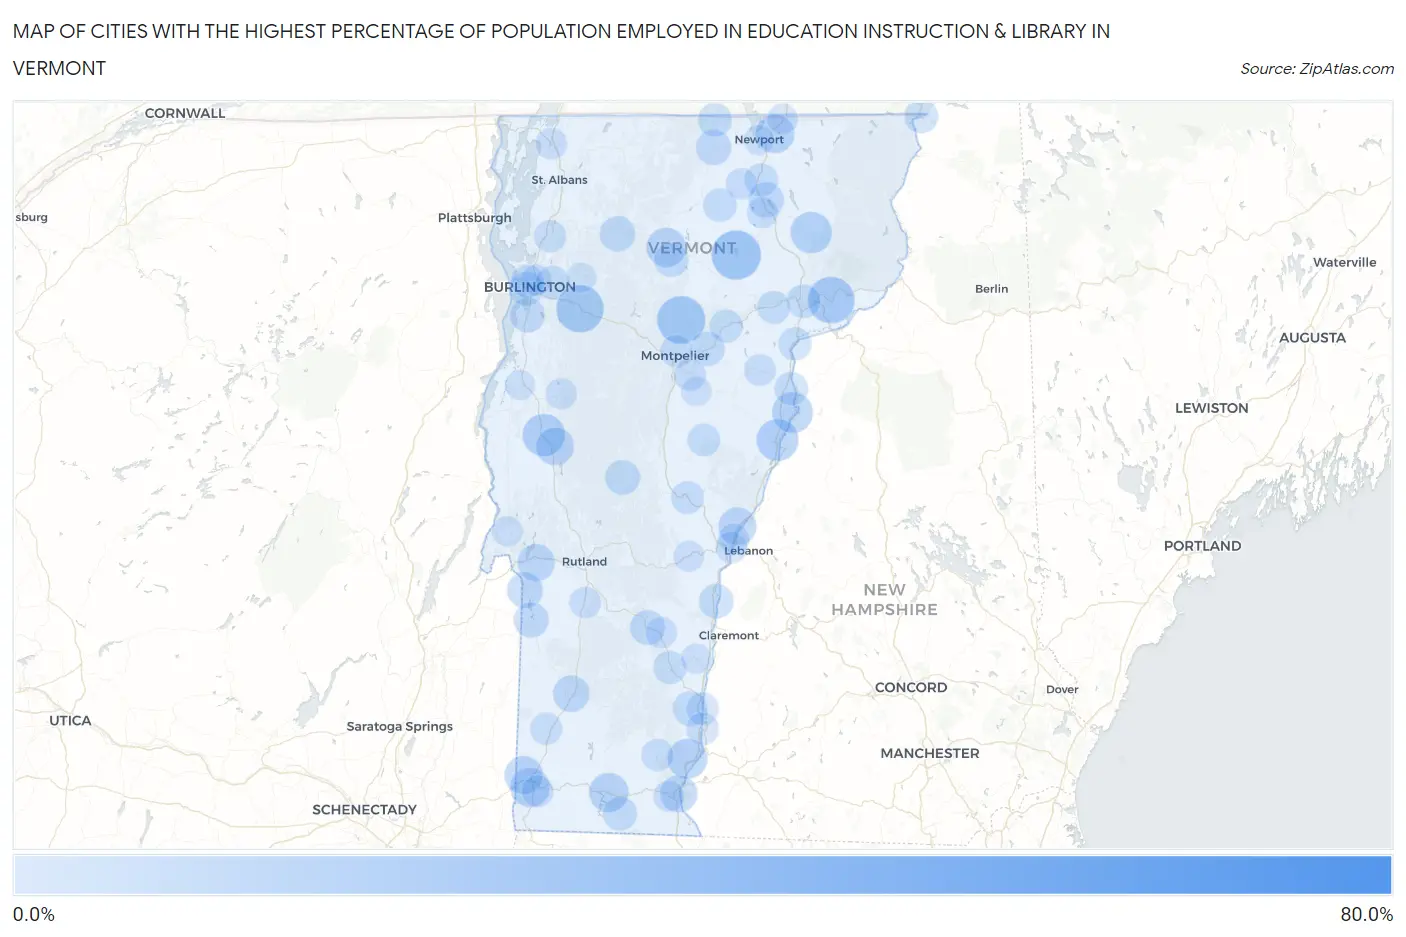
Map of Cities with the Highest Percentage of Population Employed in Education Instruction & Library in Vermont
0.0%
80.0%
Cities with the Highest Percentage of Population Employed in Education Instruction & Library in Vermont
| City | % Employed | vs State | vs National | |
| 1. | Lyndon Center | 77.1% | 8.3%(+68.8)#1 | 6.2%(+70.9)#27 |
| 2. | East Poultney | 42.4% | 8.3%(+34.1)#2 | 6.2%(+36.2)#155 |
| 3. | Peacham | 30.2% | 8.3%(+21.9)#3 | 6.2%(+24.0)#333 |
| 4. | Greensboro | 28.6% | 8.3%(+20.3)#4 | 6.2%(+22.4)#373 |
| 5. | Worcester | 27.0% | 8.3%(+18.7)#5 | 6.2%(+20.8)#422 |
| 6. | Richmond | 26.2% | 8.3%(+17.9)#6 | 6.2%(+20.0)#459 |
| 7. | Concord | 25.2% | 8.3%(+16.9)#7 | 6.2%(+19.0)#490 |
| 8. | Middlebury | 20.3% | 8.3%(+12.0)#8 | 6.2%(+14.1)#824 |
| 9. | South Hero | 19.8% | 8.3%(+11.5)#9 | 6.2%(+13.6)#877 |
| 10. | Bradford | 19.7% | 8.3%(+11.4)#10 | 6.2%(+13.5)#883 |
| 11. | West Burke | 19.1% | 8.3%(+10.8)#11 | 6.2%(+12.9)#950 |
| 12. | Newbury | 18.4% | 8.3%(+10.1)#12 | 6.2%(+12.2)#1,038 |
| 13. | Highgate Center | 17.5% | 8.3%(+9.20)#13 | 6.2%(+11.3)#1,159 |
| 14. | Gilman | 17.4% | 8.3%(+9.14)#14 | 6.2%(+11.3)#1,167 |
| 15. | Putney | 17.3% | 8.3%(+9.02)#15 | 6.2%(+11.1)#1,185 |
| 16. | Hyde Park | 16.9% | 8.3%(+8.60)#16 | 6.2%(+10.7)#1,271 |
| 17. | Old Bennington | 16.9% | 8.3%(+8.57)#17 | 6.2%(+10.7)#1,279 |
| 18. | Wilmington | 16.7% | 8.3%(+8.37)#18 | 6.2%(+10.5)#1,312 |
| 19. | West Dummerston | 16.7% | 8.3%(+8.37)#19 | 6.2%(+10.5)#1,329 |
| 20. | Derby Center | 16.2% | 8.3%(+7.87)#20 | 6.2%(+9.99)#1,427 |
| 21. | West Woodstock | 15.7% | 8.3%(+7.40)#21 | 6.2%(+9.51)#1,533 |
| 22. | North Bennington | 15.6% | 8.3%(+7.31)#22 | 6.2%(+9.43)#1,559 |
| 23. | East Middlebury | 15.0% | 8.3%(+6.74)#23 | 6.2%(+8.85)#1,702 |
| 24. | Norwich | 15.0% | 8.3%(+6.66)#24 | 6.2%(+8.78)#1,720 |
| 25. | East Charlotte | 14.6% | 8.3%(+6.33)#25 | 6.2%(+8.45)#1,805 |
| 26. | Castleton | 14.2% | 8.3%(+5.90)#26 | 6.2%(+8.02)#1,966 |
| 27. | Brattleboro | 14.2% | 8.3%(+5.86)#27 | 6.2%(+7.98)#1,977 |
| 28. | Huntington Center | 14.0% | 8.3%(+5.68)#28 | 6.2%(+7.80)#2,043 |
| 29. | Underhill Flats | 13.4% | 8.3%(+5.10)#29 | 6.2%(+7.22)#2,259 |
| 30. | Manchester Center | 13.4% | 8.3%(+5.10)#30 | 6.2%(+7.21)#2,261 |
| 31. | Stratton Mountain | 13.3% | 8.3%(+5.03)#31 | 6.2%(+7.15)#2,299 |
| 32. | Bakersfield | 12.9% | 8.3%(+4.63)#32 | 6.2%(+6.75)#2,466 |
| 33. | Poultney | 12.7% | 8.3%(+4.36)#33 | 6.2%(+6.48)#2,588 |
| 34. | Jeffersonville | 12.3% | 8.3%(+4.03)#34 | 6.2%(+6.14)#2,757 |
| 35. | Troy | 12.2% | 8.3%(+3.90)#35 | 6.2%(+6.01)#2,819 |
| 36. | Barton | 12.1% | 8.3%(+3.83)#36 | 6.2%(+5.95)#2,847 |
| 37. | Shelburne | 11.9% | 8.3%(+3.56)#37 | 6.2%(+5.67)#2,992 |
| 38. | Middletown Springs | 11.8% | 8.3%(+3.54)#38 | 6.2%(+5.66)#3,000 |
| 39. | Ludlow | 11.7% | 8.3%(+3.45)#39 | 6.2%(+5.57)#3,058 |
| 40. | Rochester | 11.7% | 8.3%(+3.35)#40 | 6.2%(+5.47)#3,117 |
| 41. | Wells | 11.6% | 8.3%(+3.31)#41 | 6.2%(+5.42)#3,149 |
| 42. | Windsor | 11.2% | 8.3%(+2.92)#42 | 6.2%(+5.04)#3,435 |
| 43. | Saxtons River | 11.1% | 8.3%(+2.85)#43 | 6.2%(+4.96)#3,496 |
| 44. | Plainfield | 11.1% | 8.3%(+2.81)#44 | 6.2%(+4.93)#3,525 |
| 45. | Weston | 11.1% | 8.3%(+2.81)#45 | 6.2%(+4.93)#3,549 |
| 46. | Lunenburg | 11.0% | 8.3%(+2.72)#46 | 6.2%(+4.84)#3,603 |
| 47. | South Burlington | 10.9% | 8.3%(+2.64)#47 | 6.2%(+4.75)#3,672 |
| 48. | Morrisville | 10.8% | 8.3%(+2.54)#48 | 6.2%(+4.66)#3,738 |
| 49. | Jacksonville | 10.8% | 8.3%(+2.45)#49 | 6.2%(+4.57)#3,803 |
| 50. | North Troy | 10.4% | 8.3%(+2.15)#50 | 6.2%(+4.26)#4,063 |
| 51. | Beecher Falls | 10.3% | 8.3%(+1.96)#51 | 6.2%(+4.07)#4,229 |
| 52. | St Johnsbury | 10.2% | 8.3%(+1.91)#52 | 6.2%(+4.02)#4,277 |
| 53. | Albany | 10.2% | 8.3%(+1.90)#53 | 6.2%(+4.02)#4,285 |
| 54. | Wells River | 10.2% | 8.3%(+1.87)#54 | 6.2%(+3.99)#4,324 |
| 55. | Essex Junction | 10.0% | 8.3%(+1.67)#55 | 6.2%(+3.78)#4,555 |
| 56. | Chester | 9.9% | 8.3%(+1.59)#56 | 6.2%(+3.70)#4,632 |
| 57. | Burlington | 9.9% | 8.3%(+1.56)#57 | 6.2%(+3.67)#4,677 |
| 58. | Orleans | 9.9% | 8.3%(+1.55)#58 | 6.2%(+3.67)#4,679 |
| 59. | Marshfield | 9.7% | 8.3%(+1.43)#59 | 6.2%(+3.55)#4,833 |
| 60. | Westford | 9.7% | 8.3%(+1.38)#60 | 6.2%(+3.49)#4,891 |
| 61. | Barnet | 9.7% | 8.3%(+1.38)#61 | 6.2%(+3.49)#4,896 |
| 62. | East Dorset | 9.5% | 8.3%(+1.17)#62 | 6.2%(+3.28)#5,131 |
| 63. | Danville | 9.4% | 8.3%(+1.08)#63 | 6.2%(+3.19)#5,240 |
| 64. | South Royalton | 9.2% | 8.3%(+0.920)#64 | 6.2%(+3.04)#5,436 |
| 65. | New Haven | 9.2% | 8.3%(+0.861)#65 | 6.2%(+2.98)#5,509 |
| 66. | Chelsea | 9.1% | 8.3%(+0.791)#66 | 6.2%(+2.91)#5,593 |
| 67. | Danby | 9.1% | 8.3%(+0.791)#67 | 6.2%(+2.91)#5,605 |
| 68. | Bellows Falls | 9.0% | 8.3%(+0.676)#68 | 6.2%(+2.79)#5,756 |
| 69. | Westminster | 8.9% | 8.3%(+0.622)#69 | 6.2%(+2.74)#5,828 |
| 70. | Montpelier | 8.9% | 8.3%(+0.593)#70 | 6.2%(+2.71)#5,868 |
| 71. | Newfane | 8.8% | 8.3%(+0.472)#71 | 6.2%(+2.59)#6,058 |
| 72. | Milton | 8.5% | 8.3%(+0.239)#72 | 6.2%(+2.36)#6,410 |
| 73. | Arlington | 8.4% | 8.3%(+0.090)#73 | 6.2%(+2.21)#6,642 |
| 74. | Barre | 8.1% | 8.3%(-0.157)#74 | 6.2%(+1.96)#7,086 |
| 75. | Bennington | 8.1% | 8.3%(-0.238)#75 | 6.2%(+1.88)#7,255 |
| 76. | Groton | 8.0% | 8.3%(-0.331)#76 | 6.2%(+1.78)#7,411 |
| 77. | Swanton | 7.8% | 8.3%(-0.475)#77 | 6.2%(+1.64)#7,689 |
| 78. | White River Junction | 7.8% | 8.3%(-0.495)#78 | 6.2%(+1.62)#7,732 |
| 79. | Wallingford | 7.8% | 8.3%(-0.507)#79 | 6.2%(+1.61)#7,755 |
| 80. | Proctorsville | 7.8% | 8.3%(-0.533)#80 | 6.2%(+1.58)#7,813 |
| 81. | West Charlotte | 7.8% | 8.3%(-0.548)#81 | 6.2%(+1.57)#7,838 |
| 82. | Glover | 7.7% | 8.3%(-0.607)#82 | 6.2%(+1.51)#7,964 |
| 83. | Irasburg | 7.5% | 8.3%(-0.800)#83 | 6.2%(+1.32)#8,375 |
| 84. | Bristol | 7.4% | 8.3%(-0.910)#84 | 6.2%(+1.21)#8,610 |
| 85. | Waterbury Center | 7.0% | 8.3%(-1.29)#85 | 6.2%(+0.823)#9,439 |
| 86. | West Brattleboro | 7.0% | 8.3%(-1.31)#86 | 6.2%(+0.801)#9,478 |
| 87. | Wilder | 7.0% | 8.3%(-1.33)#87 | 6.2%(+0.789)#9,510 |
| 88. | Woodstock | 6.9% | 8.3%(-1.36)#88 | 6.2%(+0.761)#9,561 |
| 89. | Winooski | 6.9% | 8.3%(-1.40)#89 | 6.2%(+0.719)#9,655 |
| 90. | Derby Line | 6.9% | 8.3%(-1.43)#90 | 6.2%(+0.689)#9,735 |
| 91. | Benson | 6.8% | 8.3%(-1.48)#91 | 6.2%(+0.635)#9,877 |
| 92. | South Lincoln | 6.5% | 8.3%(-1.76)#92 | 6.2%(+0.359)#10,631 |
| 93. | Whitingham | 6.5% | 8.3%(-1.78)#93 | 6.2%(+0.338)#10,687 |
| 94. | Springfield | 6.4% | 8.3%(-1.88)#94 | 6.2%(+0.235)#10,974 |
| 95. | Wardsboro | 6.4% | 8.3%(-1.92)#95 | 6.2%(+0.200)#11,074 |
| 96. | Huntington | 6.3% | 8.3%(-2.03)#96 | 6.2%(+0.088)#11,408 |
| 97. | Newport | 6.2% | 8.3%(-2.11)#97 | 6.2%(+0.009)#11,628 |
| 98. | Graniteville | 6.2% | 8.3%(-2.14)#98 | 6.2%(-0.024)#11,723 |
| 99. | Vergennes | 6.1% | 8.3%(-2.16)#99 | 6.2%(-0.048)#11,801 |
| 100. | Jericho | 6.1% | 8.3%(-2.23)#100 | 6.2%(-0.109)#12,007 |
1
2Common Questions
What are the Top 10 Cities with the Highest Percentage of Population Employed in Education Instruction & Library in Vermont?
Top 10 Cities with the Highest Percentage of Population Employed in Education Instruction & Library in Vermont are:
#1
28.6%
#2
27.0%
#3
26.2%
#4
25.2%
#5
20.3%
#6
19.7%
#7
19.1%
#8
18.4%
#9
17.3%
#10
16.9%
What city has the Highest Percentage of Population Employed in Education Instruction & Library in Vermont?
Greensboro has the Highest Percentage of Population Employed in Education Instruction & Library in Vermont with 28.6%.
What is the Percentage of Population Employed in Education Instruction & Library in the State of Vermont?
Percentage of Population Employed in Education Instruction & Library in Vermont is 8.3%.
What is the Percentage of Population Employed in Education Instruction & Library in the United States?
Percentage of Population Employed in Education Instruction & Library in the United States is 6.2%.