Cities with the Highest Percentage of Population Employed in Education Instruction & Library in Maryland
RELATED REPORTS & OPTIONS
Education Instruction & Library
Maryland
Compare Cities
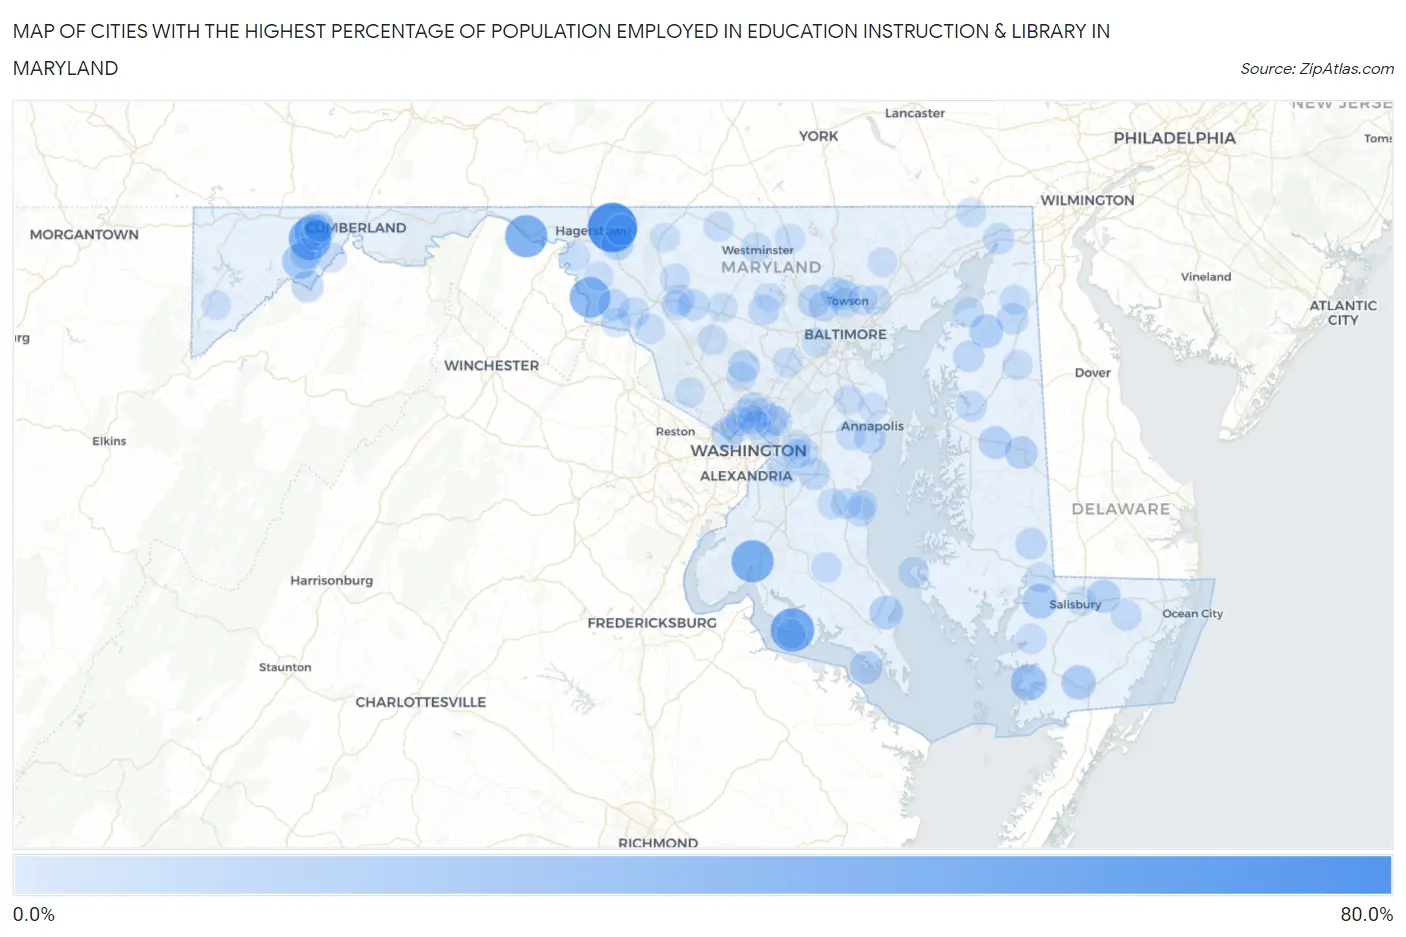
Map of Cities with the Highest Percentage of Population Employed in Education Instruction & Library in Maryland
0.0%
80.0%
Cities with the Highest Percentage of Population Employed in Education Instruction & Library in Maryland
| City | % Employed | vs State | vs National | |
| 1. | Chewsville | 75.8% | 6.7%(+69.1)#1 | 6.2%(+69.6)#28 |
| 2. | Rock Point | 54.5% | 6.7%(+47.9)#2 | 6.2%(+48.4)#70 |
| 3. | Klondike | 50.7% | 6.7%(+44.1)#3 | 6.2%(+44.6)#87 |
| 4. | Big Pool | 50.0% | 6.7%(+43.3)#4 | 6.2%(+43.8)#96 |
| 5. | Port Tobacco Village | 50.0% | 6.7%(+43.3)#5 | 6.2%(+43.8)#101 |
| 6. | Antietam | 44.4% | 6.7%(+37.7)#6 | 6.2%(+38.3)#136 |
| 7. | Midlothian | 30.9% | 6.7%(+24.2)#7 | 6.2%(+24.7)#314 |
| 8. | Fairmount | 28.6% | 6.7%(+21.9)#8 | 6.2%(+22.4)#366 |
| 9. | Moscow | 26.9% | 6.7%(+20.2)#9 | 6.2%(+20.7)#428 |
| 10. | Quantico | 24.5% | 6.7%(+17.9)#10 | 6.2%(+18.4)#520 |
| 11. | West Pocomoke | 23.0% | 6.7%(+16.4)#11 | 6.2%(+16.9)#609 |
| 12. | Drum Point | 21.3% | 6.7%(+14.6)#12 | 6.2%(+15.1)#738 |
| 13. | Kennedyville | 21.2% | 6.7%(+14.5)#13 | 6.2%(+15.0)#750 |
| 14. | Parsonsburg | 19.8% | 6.7%(+13.1)#14 | 6.2%(+13.6)#876 |
| 15. | Queen Anne | 18.6% | 6.7%(+11.9)#15 | 6.2%(+12.4)#1,009 |
| 16. | West Denton | 18.4% | 6.7%(+11.7)#16 | 6.2%(+12.2)#1,045 |
| 17. | Piney Point | 18.1% | 6.7%(+11.4)#17 | 6.2%(+11.9)#1,076 |
| 18. | Mount Aetna | 17.9% | 6.7%(+11.3)#18 | 6.2%(+11.8)#1,091 |
| 19. | College Park | 17.4% | 6.7%(+10.7)#19 | 6.2%(+11.2)#1,172 |
| 20. | Brookmont | 17.0% | 6.7%(+10.3)#20 | 6.2%(+10.8)#1,252 |
| 21. | Mccoole | 16.3% | 6.7%(+9.57)#21 | 6.2%(+10.1)#1,408 |
| 22. | Garrison | 16.2% | 6.7%(+9.53)#22 | 6.2%(+10.0)#1,416 |
| 23. | Brookeville | 16.2% | 6.7%(+9.47)#23 | 6.2%(+9.98)#1,430 |
| 24. | Lonaconing | 15.6% | 6.7%(+8.90)#24 | 6.2%(+9.41)#1,561 |
| 25. | Upper Marlboro | 14.4% | 6.7%(+7.74)#25 | 6.2%(+8.25)#1,860 |
| 26. | Lisbon | 14.3% | 6.7%(+7.59)#26 | 6.2%(+8.10)#1,935 |
| 27. | Brookview | 14.3% | 6.7%(+7.59)#27 | 6.2%(+8.10)#1,938 |
| 28. | New Market | 14.2% | 6.7%(+7.47)#28 | 6.2%(+7.98)#1,978 |
| 29. | Burkittsville | 14.1% | 6.7%(+7.39)#29 | 6.2%(+7.90)#2,005 |
| 30. | Chestertown | 13.8% | 6.7%(+7.14)#30 | 6.2%(+7.66)#2,081 |
| 31. | Annapolis Neck | 13.8% | 6.7%(+7.08)#31 | 6.2%(+7.59)#2,114 |
| 32. | Galena | 13.6% | 6.7%(+6.94)#32 | 6.2%(+7.45)#2,158 |
| 33. | North East | 13.5% | 6.7%(+6.76)#33 | 6.2%(+7.28)#2,231 |
| 34. | Sykesville | 13.3% | 6.7%(+6.56)#34 | 6.2%(+7.07)#2,324 |
| 35. | Grahamtown | 13.2% | 6.7%(+6.53)#35 | 6.2%(+7.04)#2,332 |
| 36. | Cavetown | 13.1% | 6.7%(+6.38)#36 | 6.2%(+6.89)#2,385 |
| 37. | Mays Chapel | 13.0% | 6.7%(+6.35)#37 | 6.2%(+6.87)#2,394 |
| 38. | Centreville | 12.9% | 6.7%(+6.16)#38 | 6.2%(+6.67)#2,505 |
| 39. | Forest Glen | 12.8% | 6.7%(+6.15)#39 | 6.2%(+6.66)#2,509 |
| 40. | Morningside | 12.6% | 6.7%(+5.93)#40 | 6.2%(+6.45)#2,601 |
| 41. | Taylors Island | 12.5% | 6.7%(+5.80)#41 | 6.2%(+6.32)#2,677 |
| 42. | Jefferson | 12.5% | 6.7%(+5.76)#42 | 6.2%(+6.27)#2,705 |
| 43. | Powellville | 12.2% | 6.7%(+5.47)#43 | 6.2%(+5.98)#2,836 |
| 44. | Lutherville | 12.1% | 6.7%(+5.42)#44 | 6.2%(+5.93)#2,860 |
| 45. | Owings | 11.7% | 6.7%(+5.00)#45 | 6.2%(+5.51)#3,079 |
| 46. | Shaft | 11.7% | 6.7%(+4.99)#46 | 6.2%(+5.50)#3,084 |
| 47. | Betterton | 11.7% | 6.7%(+4.97)#47 | 6.2%(+5.48)#3,103 |
| 48. | Pikesville | 11.6% | 6.7%(+4.90)#48 | 6.2%(+5.41)#3,158 |
| 49. | Chesapeake Beach | 11.4% | 6.7%(+4.74)#49 | 6.2%(+5.25)#3,263 |
| 50. | Golden Beach | 11.3% | 6.7%(+4.62)#50 | 6.2%(+5.13)#3,353 |
| 51. | Wildewood | 11.3% | 6.7%(+4.61)#51 | 6.2%(+5.13)#3,360 |
| 52. | Mount Vernon | 11.2% | 6.7%(+4.48)#52 | 6.2%(+4.99)#3,474 |
| 53. | Somerset | 11.1% | 6.7%(+4.39)#53 | 6.2%(+4.91)#3,563 |
| 54. | Frostburg | 11.0% | 6.7%(+4.30)#54 | 6.2%(+4.81)#3,624 |
| 55. | Bier | 11.0% | 6.7%(+4.29)#55 | 6.2%(+4.81)#3,629 |
| 56. | Ten Mile Creek | 10.9% | 6.7%(+4.24)#56 | 6.2%(+4.75)#3,668 |
| 57. | Mardela Springs | 10.7% | 6.7%(+4.05)#57 | 6.2%(+4.56)#3,810 |
| 58. | Cecilton | 10.7% | 6.7%(+4.00)#58 | 6.2%(+4.51)#3,850 |
| 59. | Dunkirk | 10.6% | 6.7%(+3.95)#59 | 6.2%(+4.46)#3,887 |
| 60. | Riva | 10.6% | 6.7%(+3.87)#60 | 6.2%(+4.39)#3,952 |
| 61. | Towson | 10.5% | 6.7%(+3.82)#61 | 6.2%(+4.34)#4,004 |
| 62. | Kettering | 10.5% | 6.7%(+3.78)#62 | 6.2%(+4.29)#4,034 |
| 63. | Mount Rainier | 10.5% | 6.7%(+3.78)#63 | 6.2%(+4.29)#4,037 |
| 64. | Kemp Mill | 10.5% | 6.7%(+3.77)#64 | 6.2%(+4.28)#4,041 |
| 65. | Westminster | 10.4% | 6.7%(+3.74)#65 | 6.2%(+4.25)#4,080 |
| 66. | Spring Ridge | 10.4% | 6.7%(+3.72)#66 | 6.2%(+4.24)#4,090 |
| 67. | Hillandale | 10.3% | 6.7%(+3.58)#67 | 6.2%(+4.09)#4,210 |
| 68. | Taneytown | 10.2% | 6.7%(+3.51)#68 | 6.2%(+4.02)#4,279 |
| 69. | Walkersville | 10.2% | 6.7%(+3.48)#69 | 6.2%(+3.99)#4,314 |
| 70. | Sudlersville | 10.1% | 6.7%(+3.42)#70 | 6.2%(+3.94)#4,383 |
| 71. | Downsville | 10.0% | 6.7%(+3.28)#71 | 6.2%(+3.79)#4,552 |
| 72. | Perry Hall | 10.0% | 6.7%(+3.27)#72 | 6.2%(+3.79)#4,554 |
| 73. | Damascus | 9.8% | 6.7%(+3.12)#73 | 6.2%(+3.63)#4,739 |
| 74. | Bartonsville | 9.7% | 6.7%(+3.02)#74 | 6.2%(+3.53)#4,849 |
| 75. | Arden On The Severn | 9.7% | 6.7%(+3.00)#75 | 6.2%(+3.51)#4,871 |
| 76. | Takoma Park | 9.6% | 6.7%(+2.93)#76 | 6.2%(+3.44)#4,948 |
| 77. | Olney | 9.5% | 6.7%(+2.79)#77 | 6.2%(+3.31)#5,104 |
| 78. | Mount Airy | 9.4% | 6.7%(+2.66)#78 | 6.2%(+3.18)#5,253 |
| 79. | Columbia | 9.4% | 6.7%(+2.66)#79 | 6.2%(+3.17)#5,259 |
| 80. | Rising Sun | 9.3% | 6.7%(+2.61)#80 | 6.2%(+3.12)#5,324 |
| 81. | Chevy Chase | 9.2% | 6.7%(+2.54)#81 | 6.2%(+3.05)#5,420 |
| 82. | Adamstown | 9.2% | 6.7%(+2.49)#82 | 6.2%(+3.00)#5,473 |
| 83. | North Beach | 9.1% | 6.7%(+2.36)#83 | 6.2%(+2.87)#5,655 |
| 84. | Carney | 9.1% | 6.7%(+2.36)#84 | 6.2%(+2.87)#5,660 |
| 85. | Hampstead | 9.0% | 6.7%(+2.29)#85 | 6.2%(+2.80)#5,741 |
| 86. | Rosemont | 8.9% | 6.7%(+2.18)#86 | 6.2%(+2.69)#5,902 |
| 87. | Darnestown | 8.8% | 6.7%(+2.07)#87 | 6.2%(+2.58)#6,075 |
| 88. | Lake Arbor | 8.8% | 6.7%(+2.06)#88 | 6.2%(+2.58)#6,083 |
| 89. | Berwyn Heights | 8.7% | 6.7%(+1.99)#89 | 6.2%(+2.50)#6,188 |
| 90. | Salisbury | 8.7% | 6.7%(+1.96)#90 | 6.2%(+2.47)#6,218 |
| 91. | Silver Spring | 8.6% | 6.7%(+1.95)#91 | 6.2%(+2.46)#6,228 |
| 92. | Loch Lynn Heights | 8.6% | 6.7%(+1.91)#92 | 6.2%(+2.42)#6,314 |
| 93. | Catonsville | 8.6% | 6.7%(+1.89)#93 | 6.2%(+2.40)#6,340 |
| 94. | Arnold | 8.5% | 6.7%(+1.85)#94 | 6.2%(+2.36)#6,398 |
| 95. | Fallston | 8.5% | 6.7%(+1.81)#95 | 6.2%(+2.32)#6,467 |
| 96. | Cobb Island | 8.5% | 6.7%(+1.79)#96 | 6.2%(+2.30)#6,491 |
| 97. | Largo | 8.5% | 6.7%(+1.78)#97 | 6.2%(+2.29)#6,497 |
| 98. | Eldersburg | 8.5% | 6.7%(+1.76)#98 | 6.2%(+2.27)#6,529 |
| 99. | Keedysville | 8.4% | 6.7%(+1.75)#99 | 6.2%(+2.26)#6,556 |
| 100. | Thurmont | 8.4% | 6.7%(+1.73)#100 | 6.2%(+2.24)#6,589 |
Common Questions
What are the Top 10 Cities with the Highest Percentage of Population Employed in Education Instruction & Library in Maryland?
Top 10 Cities with the Highest Percentage of Population Employed in Education Instruction & Library in Maryland are:
#1
75.8%
#2
54.5%
#3
50.7%
#4
50.0%
#5
50.0%
#6
44.4%
#7
30.9%
#8
28.6%
#9
26.9%
#10
24.5%
What city has the Highest Percentage of Population Employed in Education Instruction & Library in Maryland?
Chewsville has the Highest Percentage of Population Employed in Education Instruction & Library in Maryland with 75.8%.
What is the Percentage of Population Employed in Education Instruction & Library in the State of Maryland?
Percentage of Population Employed in Education Instruction & Library in Maryland is 6.7%.
What is the Percentage of Population Employed in Education Instruction & Library in the United States?
Percentage of Population Employed in Education Instruction & Library in the United States is 6.2%.