Cities with the Highest Percentage of Population Employed in Education Instruction & Library in Mississippi
RELATED REPORTS & OPTIONS
Education Instruction & Library
Mississippi
Compare Cities
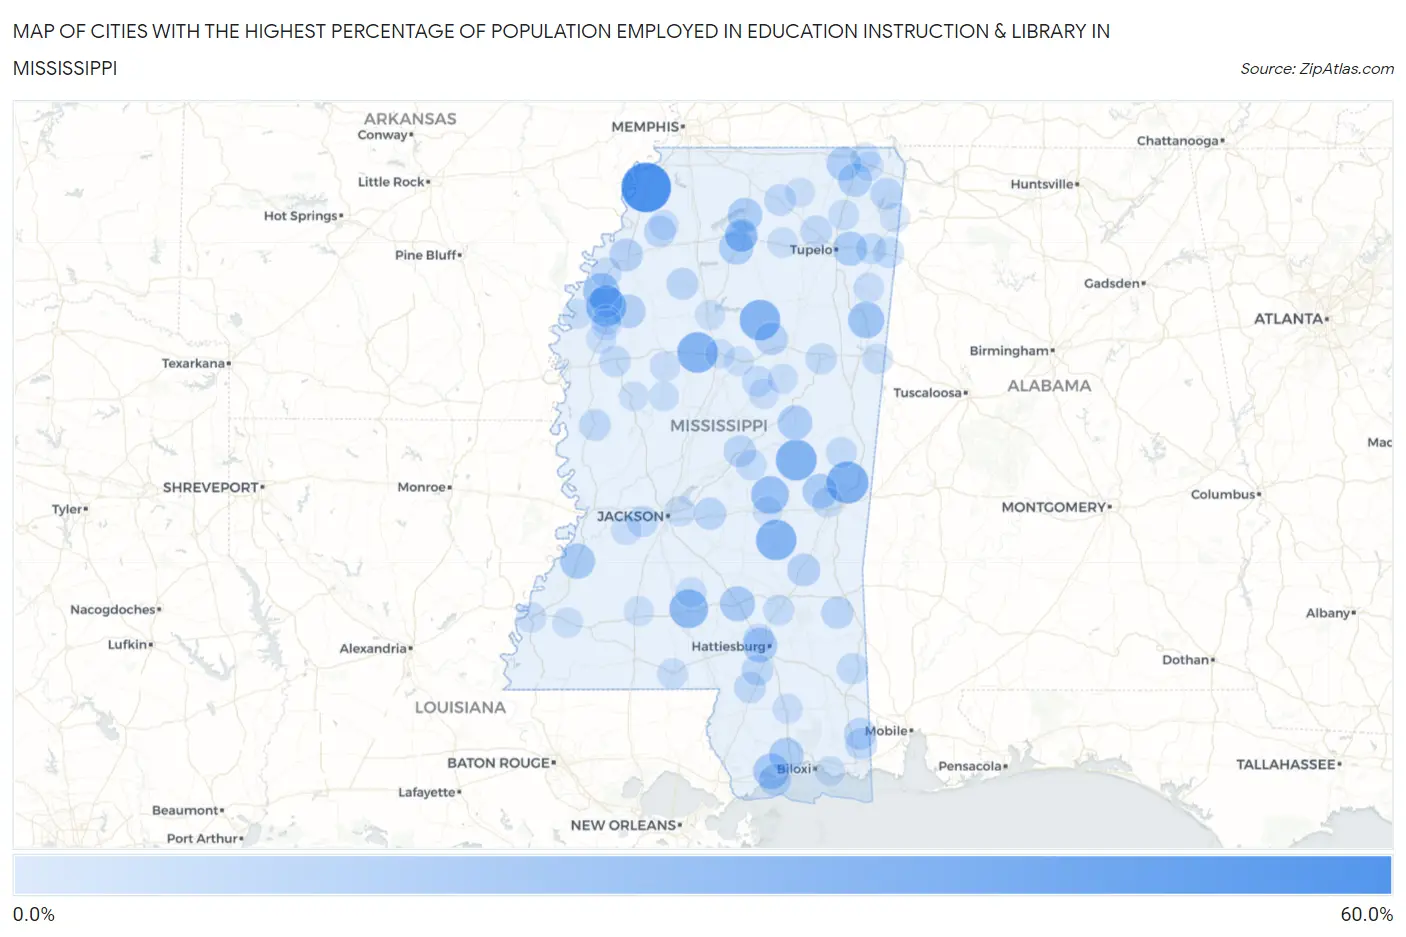
Map of Cities with the Highest Percentage of Population Employed in Education Instruction & Library in Mississippi
0.0%
60.0%
Cities with the Highest Percentage of Population Employed in Education Instruction & Library in Mississippi
| City | % Employed | vs State | vs National | |
| 1. | North Tunica | 57.0% | 6.8%(+50.1)#1 | 6.2%(+50.8)#60 |
| 2. | Scott | 50.0% | 6.8%(+43.2)#2 | 6.2%(+43.8)#97 |
| 3. | New Site | 38.8% | 6.8%(+32.0)#3 | 6.2%(+32.6)#181 |
| 4. | Meridian Station | 37.7% | 6.8%(+30.9)#4 | 6.2%(+31.6)#190 |
| 5. | Paris | 37.0% | 6.8%(+30.1)#5 | 6.2%(+30.8)#210 |
| 6. | Tucker | 35.6% | 6.8%(+28.7)#6 | 6.2%(+29.4)#232 |
| 7. | Carrollton | 35.0% | 6.8%(+28.2)#7 | 6.2%(+28.8)#244 |
| 8. | Slate Springs | 35.0% | 6.8%(+28.2)#8 | 6.2%(+28.8)#245 |
| 9. | Montrose | 34.7% | 6.8%(+27.8)#9 | 6.2%(+28.5)#250 |
| 10. | Merigold | 33.2% | 6.8%(+26.4)#10 | 6.2%(+27.0)#272 |
| 11. | Silver Creek | 30.4% | 6.8%(+23.6)#11 | 6.2%(+24.3)#323 |
| 12. | Conehatta | 27.9% | 6.8%(+21.1)#12 | 6.2%(+21.7)#392 |
| 13. | Independence | 26.6% | 6.8%(+19.7)#13 | 6.2%(+20.4)#439 |
| 14. | Bobo | 26.6% | 6.8%(+19.7)#14 | 6.2%(+20.4)#441 |
| 15. | New Hamilton | 24.5% | 6.8%(+17.7)#15 | 6.2%(+18.4)#521 |
| 16. | Shelby | 24.5% | 6.8%(+17.7)#16 | 6.2%(+18.3)#522 |
| 17. | Delisle | 22.8% | 6.8%(+15.9)#17 | 6.2%(+16.6)#629 |
| 18. | Collins | 21.6% | 6.8%(+14.7)#18 | 6.2%(+15.4)#723 |
| 19. | Port Gibson | 21.6% | 6.8%(+14.7)#19 | 6.2%(+15.4)#724 |
| 20. | Collinsville | 20.8% | 6.8%(+14.0)#20 | 6.2%(+14.7)#771 |
| 21. | Runnelstown | 20.7% | 6.8%(+13.8)#21 | 6.2%(+14.5)#783 |
| 22. | Arnold Line | 20.6% | 6.8%(+13.8)#22 | 6.2%(+14.4)#791 |
| 23. | Noxapater | 20.5% | 6.8%(+13.6)#23 | 6.2%(+14.3)#807 |
| 24. | Bogue Chitto Cdp Kemper And Neshoba Counties | 20.4% | 6.8%(+13.5)#24 | 6.2%(+14.2)#821 |
| 25. | Lyman | 20.3% | 6.8%(+13.4)#25 | 6.2%(+14.1)#829 |
| 26. | Taylor | 20.2% | 6.8%(+13.3)#26 | 6.2%(+14.0)#836 |
| 27. | Abbeville | 20.0% | 6.8%(+13.2)#27 | 6.2%(+13.8)#846 |
| 28. | Mooreville | 19.8% | 6.8%(+13.0)#28 | 6.2%(+13.6)#873 |
| 29. | Oak Grove | 19.6% | 6.8%(+12.8)#29 | 6.2%(+13.4)#894 |
| 30. | Rena Lara | 19.6% | 6.8%(+12.7)#30 | 6.2%(+13.4)#897 |
| 31. | Kossuth | 19.4% | 6.8%(+12.5)#31 | 6.2%(+13.2)#929 |
| 32. | Rienzi | 18.5% | 6.8%(+11.6)#32 | 6.2%(+12.3)#1,021 |
| 33. | Drew | 17.6% | 6.8%(+10.8)#33 | 6.2%(+11.4)#1,143 |
| 34. | University | 17.4% | 6.8%(+10.6)#34 | 6.2%(+11.2)#1,173 |
| 35. | Lyon | 17.0% | 6.8%(+10.2)#35 | 6.2%(+10.8)#1,251 |
| 36. | Heidelberg | 16.7% | 6.8%(+9.88)#36 | 6.2%(+10.5)#1,296 |
| 37. | Mound Bayou | 16.7% | 6.8%(+9.82)#37 | 6.2%(+10.5)#1,303 |
| 38. | Walthall | 16.7% | 6.8%(+9.82)#38 | 6.2%(+10.5)#1,321 |
| 39. | Bond | 16.4% | 6.8%(+9.59)#39 | 6.2%(+10.3)#1,374 |
| 40. | Clara | 15.5% | 6.8%(+8.67)#40 | 6.2%(+9.33)#1,580 |
| 41. | Pass Christian | 15.3% | 6.8%(+8.44)#41 | 6.2%(+9.10)#1,647 |
| 42. | Pelahatchie | 15.1% | 6.8%(+8.29)#42 | 6.2%(+8.96)#1,678 |
| 43. | Redwater | 15.0% | 6.8%(+8.18)#43 | 6.2%(+8.84)#1,706 |
| 44. | Hurley | 14.6% | 6.8%(+7.72)#44 | 6.2%(+8.39)#1,821 |
| 45. | Charleston | 14.5% | 6.8%(+7.61)#45 | 6.2%(+8.28)#1,848 |
| 46. | Oxford | 14.3% | 6.8%(+7.44)#46 | 6.2%(+8.10)#1,892 |
| 47. | Falcon | 14.3% | 6.8%(+7.44)#47 | 6.2%(+8.10)#1,915 |
| 48. | Paden | 14.3% | 6.8%(+7.44)#48 | 6.2%(+8.10)#1,925 |
| 49. | Bovina | 14.0% | 6.8%(+7.17)#49 | 6.2%(+7.84)#2,031 |
| 50. | Anguilla | 13.9% | 6.8%(+7.05)#50 | 6.2%(+7.72)#2,062 |
| 51. | Hickory Flat | 13.8% | 6.8%(+6.98)#51 | 6.2%(+7.64)#2,089 |
| 52. | Blue Springs | 13.7% | 6.8%(+6.82)#52 | 6.2%(+7.48)#2,152 |
| 53. | Lumberton | 13.6% | 6.8%(+6.78)#53 | 6.2%(+7.44)#2,169 |
| 54. | Big Point | 13.6% | 6.8%(+6.75)#54 | 6.2%(+7.42)#2,177 |
| 55. | Purvis | 13.5% | 6.8%(+6.69)#55 | 6.2%(+7.36)#2,201 |
| 56. | Indianola | 13.3% | 6.8%(+6.43)#56 | 6.2%(+7.10)#2,315 |
| 57. | Starkville | 13.1% | 6.8%(+6.21)#57 | 6.2%(+6.87)#2,393 |
| 58. | Leakesville | 13.0% | 6.8%(+6.11)#58 | 6.2%(+6.78)#2,446 |
| 59. | Raymond | 12.9% | 6.8%(+6.06)#59 | 6.2%(+6.73)#2,473 |
| 60. | Standing Pine | 12.6% | 6.8%(+5.78)#60 | 6.2%(+6.44)#2,603 |
| 61. | Ellisville | 12.4% | 6.8%(+5.55)#61 | 6.2%(+6.21)#2,722 |
| 62. | De Kalb | 12.3% | 6.8%(+5.45)#62 | 6.2%(+6.12)#2,771 |
| 63. | French Camp | 12.2% | 6.8%(+5.37)#63 | 6.2%(+6.04)#2,808 |
| 64. | Tremont | 12.2% | 6.8%(+5.32)#64 | 6.2%(+5.99)#2,829 |
| 65. | Fulton | 12.0% | 6.8%(+5.11)#65 | 6.2%(+5.78)#2,937 |
| 66. | Nellieburg | 11.9% | 6.8%(+5.03)#66 | 6.2%(+5.69)#2,979 |
| 67. | Baldwyn | 11.8% | 6.8%(+4.92)#67 | 6.2%(+5.58)#3,030 |
| 68. | Flowood | 11.6% | 6.8%(+4.79)#68 | 6.2%(+5.46)#3,123 |
| 69. | New Hebron | 11.6% | 6.8%(+4.75)#69 | 6.2%(+5.42)#3,152 |
| 70. | Alligator | 11.6% | 6.8%(+4.75)#70 | 6.2%(+5.41)#3,160 |
| 71. | Tylertown | 11.6% | 6.8%(+4.72)#71 | 6.2%(+5.38)#3,173 |
| 72. | Eudora | 11.4% | 6.8%(+4.57)#72 | 6.2%(+5.23)#3,277 |
| 73. | New Hope | 11.4% | 6.8%(+4.54)#73 | 6.2%(+5.21)#3,295 |
| 74. | Roxie | 11.1% | 6.8%(+4.26)#74 | 6.2%(+4.93)#3,521 |
| 75. | Mccool | 11.1% | 6.8%(+4.26)#75 | 6.2%(+4.93)#3,540 |
| 76. | Learned | 11.1% | 6.8%(+4.26)#76 | 6.2%(+4.93)#3,544 |
| 77. | Thaxton | 11.0% | 6.8%(+4.16)#77 | 6.2%(+4.83)#3,615 |
| 78. | Hatley | 11.0% | 6.8%(+4.13)#78 | 6.2%(+4.79)#3,638 |
| 79. | Rawls Springs | 10.9% | 6.8%(+4.06)#79 | 6.2%(+4.73)#3,688 |
| 80. | Boyle | 10.9% | 6.8%(+4.01)#80 | 6.2%(+4.67)#3,721 |
| 81. | Natchez | 10.9% | 6.8%(+4.00)#81 | 6.2%(+4.67)#3,724 |
| 82. | Wiggins | 10.7% | 6.8%(+3.84)#82 | 6.2%(+4.51)#3,851 |
| 83. | Sidon | 10.6% | 6.8%(+3.79)#83 | 6.2%(+4.45)#3,897 |
| 84. | Ackerman | 10.5% | 6.8%(+3.69)#84 | 6.2%(+4.35)#3,979 |
| 85. | Tchula | 10.5% | 6.8%(+3.60)#85 | 6.2%(+4.27)#4,059 |
| 86. | Beulah | 10.4% | 6.8%(+3.53)#86 | 6.2%(+4.19)#4,120 |
| 87. | Grenada | 10.3% | 6.8%(+3.47)#87 | 6.2%(+4.13)#4,173 |
| 88. | Brookhaven | 10.3% | 6.8%(+3.45)#88 | 6.2%(+4.12)#4,188 |
| 89. | Blue Mountain | 10.2% | 6.8%(+3.37)#89 | 6.2%(+4.04)#4,257 |
| 90. | Shaw | 10.2% | 6.8%(+3.34)#90 | 6.2%(+4.01)#4,298 |
| 91. | Gulf Park Estates | 10.2% | 6.8%(+3.32)#91 | 6.2%(+3.99)#4,319 |
| 92. | Belzoni | 10.1% | 6.8%(+3.29)#92 | 6.2%(+3.96)#4,360 |
| 93. | Farmington | 10.1% | 6.8%(+3.24)#93 | 6.2%(+3.91)#4,412 |
| 94. | Golden | 10.1% | 6.8%(+3.24)#94 | 6.2%(+3.91)#4,414 |
| 95. | Sledge | 10.1% | 6.8%(+3.21)#95 | 6.2%(+3.87)#4,454 |
| 96. | Kilmichael | 10.0% | 6.8%(+3.19)#96 | 6.2%(+3.86)#4,475 |
| 97. | Cleveland | 10.0% | 6.8%(+3.15)#97 | 6.2%(+3.82)#4,497 |
| 98. | Glen | 10.0% | 6.8%(+3.15)#98 | 6.2%(+3.82)#4,508 |
| 99. | Winona | 10.0% | 6.8%(+3.12)#99 | 6.2%(+3.79)#4,553 |
| 100. | Lake | 10.0% | 6.8%(+3.11)#100 | 6.2%(+3.77)#4,567 |
Common Questions
What are the Top 10 Cities with the Highest Percentage of Population Employed in Education Instruction & Library in Mississippi?
Top 10 Cities with the Highest Percentage of Population Employed in Education Instruction & Library in Mississippi are:
#1
57.0%
#2
37.7%
#3
35.6%
#4
35.0%
#5
35.0%
#6
34.7%
#7
33.2%
#8
30.4%
#9
27.9%
#10
24.5%
What city has the Highest Percentage of Population Employed in Education Instruction & Library in Mississippi?
North Tunica has the Highest Percentage of Population Employed in Education Instruction & Library in Mississippi with 57.0%.
What is the Percentage of Population Employed in Education Instruction & Library in the State of Mississippi?
Percentage of Population Employed in Education Instruction & Library in Mississippi is 6.8%.
What is the Percentage of Population Employed in Education Instruction & Library in the United States?
Percentage of Population Employed in Education Instruction & Library in the United States is 6.2%.