Cities with the Highest Percentage of Population Employed in Education Instruction & Library in Maine
RELATED REPORTS & OPTIONS
Education Instruction & Library
Maine
Compare Cities
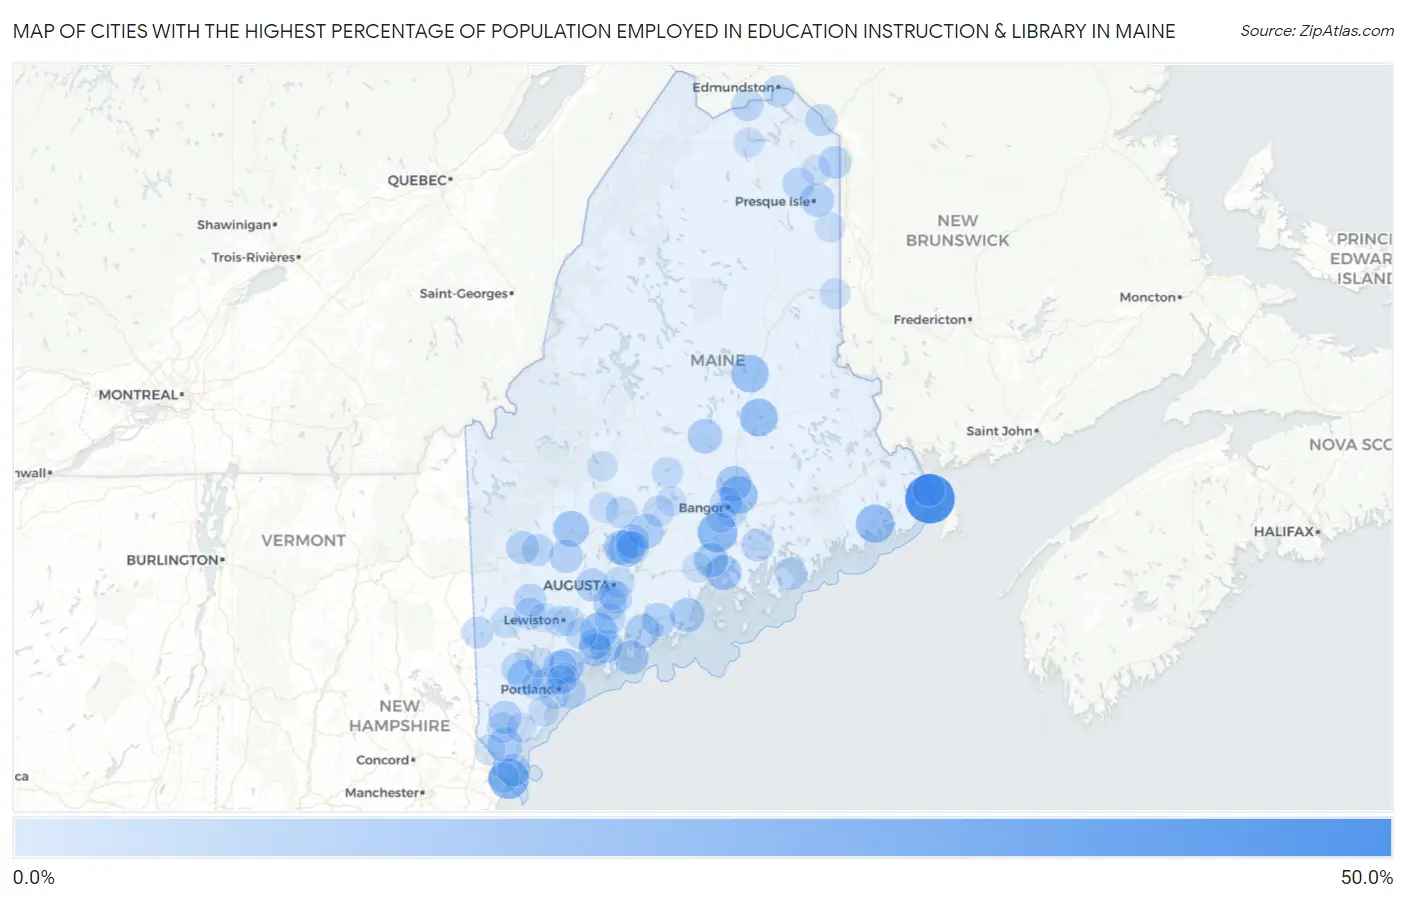
Map of Cities with the Highest Percentage of Population Employed in Education Instruction & Library in Maine
0.0%
50.0%
Cities with the Highest Percentage of Population Employed in Education Instruction & Library in Maine
| City | % Employed | vs State | vs National | |
| 1. | Lubec | 42.4% | 7.1%(+35.4)#1 | 6.2%(+36.2)#154 |
| 2. | Patten | 38.1% | 7.1%(+31.0)#2 | 6.2%(+31.9)#187 |
| 3. | Kittery Point | 24.0% | 7.1%(+16.9)#3 | 6.2%(+17.8)#552 |
| 4. | Cornish | 23.6% | 7.1%(+16.5)#4 | 6.2%(+17.4)#573 |
| 5. | Winterport | 22.6% | 7.1%(+15.5)#5 | 6.2%(+16.4)#640 |
| 6. | Machias | 19.4% | 7.1%(+12.3)#6 | 6.2%(+13.2)#922 |
| 7. | Lincoln | 19.1% | 7.1%(+12.0)#7 | 6.2%(+12.9)#955 |
| 8. | Orono | 18.6% | 7.1%(+11.6)#8 | 6.2%(+12.5)#1,007 |
| 9. | East Millinocket | 18.4% | 7.1%(+11.3)#9 | 6.2%(+12.2)#1,046 |
| 10. | Northeast Harbor | 17.6% | 7.1%(+10.5)#10 | 6.2%(+11.4)#1,145 |
| 11. | Bowdoinham | 17.2% | 7.1%(+10.2)#11 | 6.2%(+11.0)#1,207 |
| 12. | Waterville | 15.9% | 7.1%(+8.83)#12 | 6.2%(+9.71)#1,496 |
| 13. | Farmington | 15.2% | 7.1%(+8.10)#13 | 6.2%(+8.97)#1,675 |
| 14. | Old Town | 14.6% | 7.1%(+7.58)#14 | 6.2%(+8.46)#1,800 |
| 15. | Castine | 14.4% | 7.1%(+7.30)#15 | 6.2%(+8.17)#1,885 |
| 16. | Yarmouth | 14.2% | 7.1%(+7.17)#16 | 6.2%(+8.04)#1,957 |
| 17. | North Berwick | 14.0% | 7.1%(+6.96)#17 | 6.2%(+7.83)#2,033 |
| 18. | Standish | 13.9% | 7.1%(+6.80)#18 | 6.2%(+7.67)#2,077 |
| 19. | Clinton | 13.5% | 7.1%(+6.44)#19 | 6.2%(+7.32)#2,218 |
| 20. | Milo | 13.1% | 7.1%(+6.00)#20 | 6.2%(+6.88)#2,390 |
| 21. | Oakland | 13.0% | 7.1%(+5.95)#21 | 6.2%(+6.83)#2,422 |
| 22. | Searsport | 12.9% | 7.1%(+5.83)#22 | 6.2%(+6.70)#2,491 |
| 23. | Damariscotta | 12.6% | 7.1%(+5.59)#23 | 6.2%(+6.46)#2,596 |
| 24. | Rockland | 12.5% | 7.1%(+5.45)#24 | 6.2%(+6.32)#2,659 |
| 25. | Boothbay Harbor | 12.4% | 7.1%(+5.31)#25 | 6.2%(+6.19)#2,735 |
| 26. | Fairfield | 11.8% | 7.1%(+4.70)#26 | 6.2%(+5.57)#3,051 |
| 27. | Cumberland Center | 11.4% | 7.1%(+4.38)#27 | 6.2%(+5.25)#3,257 |
| 28. | Waldoboro | 11.4% | 7.1%(+4.33)#28 | 6.2%(+5.20)#3,296 |
| 29. | Bath | 11.1% | 7.1%(+4.08)#29 | 6.2%(+4.95)#3,504 |
| 30. | Presque Isle | 10.9% | 7.1%(+3.89)#30 | 6.2%(+4.76)#3,664 |
| 31. | Chisholm | 10.7% | 7.1%(+3.62)#31 | 6.2%(+4.49)#3,860 |
| 32. | Oak Hill | 10.6% | 7.1%(+3.59)#32 | 6.2%(+4.46)#3,885 |
| 33. | Alfred | 10.5% | 7.1%(+3.44)#33 | 6.2%(+4.32)#4,019 |
| 34. | South Berwick | 10.4% | 7.1%(+3.38)#34 | 6.2%(+4.25)#4,075 |
| 35. | Winthrop | 10.4% | 7.1%(+3.31)#35 | 6.2%(+4.18)#4,129 |
| 36. | Brunswick | 10.4% | 7.1%(+3.30)#36 | 6.2%(+4.18)#4,133 |
| 37. | Winslow | 10.2% | 7.1%(+3.16)#37 | 6.2%(+4.04)#4,259 |
| 38. | Gardiner | 10.2% | 7.1%(+3.10)#38 | 6.2%(+3.98)#4,337 |
| 39. | York Harbor | 10.1% | 7.1%(+3.06)#39 | 6.2%(+3.93)#4,389 |
| 40. | Veazie | 9.9% | 7.1%(+2.85)#40 | 6.2%(+3.72)#4,609 |
| 41. | North Anson | 9.9% | 7.1%(+2.85)#41 | 6.2%(+3.72)#4,612 |
| 42. | Limestone | 9.7% | 7.1%(+2.64)#42 | 6.2%(+3.52)#4,861 |
| 43. | Kezar Falls | 9.7% | 7.1%(+2.61)#43 | 6.2%(+3.48)#4,907 |
| 44. | Rumford | 9.5% | 7.1%(+2.44)#44 | 6.2%(+3.32)#5,085 |
| 45. | Eastport | 9.4% | 7.1%(+2.35)#45 | 6.2%(+3.23)#5,200 |
| 46. | South Paris | 9.3% | 7.1%(+2.26)#46 | 6.2%(+3.14)#5,296 |
| 47. | Ellsworth | 9.3% | 7.1%(+2.25)#47 | 6.2%(+3.13)#5,318 |
| 48. | Bar Harbor | 8.8% | 7.1%(+1.78)#48 | 6.2%(+2.66)#5,956 |
| 49. | Steep Falls | 8.7% | 7.1%(+1.65)#49 | 6.2%(+2.52)#6,149 |
| 50. | Washburn | 8.6% | 7.1%(+1.58)#50 | 6.2%(+2.45)#6,243 |
| 51. | Dixfield | 8.5% | 7.1%(+1.47)#51 | 6.2%(+2.35)#6,423 |
| 52. | Fort Kent | 8.5% | 7.1%(+1.47)#52 | 6.2%(+2.34)#6,432 |
| 53. | Portland | 8.3% | 7.1%(+1.28)#53 | 6.2%(+2.16)#6,719 |
| 54. | Mattawamkeag | 8.3% | 7.1%(+1.27)#54 | 6.2%(+2.15)#6,740 |
| 55. | Randolph | 8.3% | 7.1%(+1.19)#55 | 6.2%(+2.07)#6,876 |
| 56. | Van Buren | 8.2% | 7.1%(+1.11)#56 | 6.2%(+1.98)#7,027 |
| 57. | Madawaska | 7.9% | 7.1%(+0.842)#57 | 6.2%(+1.72)#7,543 |
| 58. | Oxford | 7.9% | 7.1%(+0.799)#58 | 6.2%(+1.67)#7,622 |
| 59. | Topsham | 7.8% | 7.1%(+0.718)#59 | 6.2%(+1.59)#7,791 |
| 60. | Brewer | 7.7% | 7.1%(+0.644)#60 | 6.2%(+1.52)#7,930 |
| 61. | Bangor | 7.5% | 7.1%(+0.470)#61 | 6.2%(+1.35)#8,318 |
| 62. | Brownville Junction | 7.5% | 7.1%(+0.418)#62 | 6.2%(+1.29)#8,422 |
| 63. | Fryeburg | 7.5% | 7.1%(+0.402)#63 | 6.2%(+1.28)#8,451 |
| 64. | Skowhegan | 7.5% | 7.1%(+0.396)#64 | 6.2%(+1.27)#8,461 |
| 65. | Milbridge | 7.3% | 7.1%(+0.275)#65 | 6.2%(+1.15)#8,709 |
| 66. | Dexter | 7.1% | 7.1%(-0.002)#66 | 6.2%(+0.873)#9,331 |
| 67. | Augusta | 7.0% | 7.1%(-0.023)#67 | 6.2%(+0.852)#9,378 |
| 68. | Danforth | 6.9% | 7.1%(-0.122)#68 | 6.2%(+0.753)#9,582 |
| 69. | Kingfield | 6.8% | 7.1%(-0.232)#69 | 6.2%(+0.643)#9,853 |
| 70. | Richmond | 6.7% | 7.1%(-0.333)#70 | 6.2%(+0.542)#10,113 |
| 71. | Dunstan | 6.7% | 7.1%(-0.385)#71 | 6.2%(+0.490)#10,258 |
| 72. | Pittsfield | 6.6% | 7.1%(-0.423)#72 | 6.2%(+0.452)#10,374 |
| 73. | Lisbon Falls | 6.5% | 7.1%(-0.516)#73 | 6.2%(+0.359)#10,629 |
| 74. | Kittery | 6.4% | 7.1%(-0.630)#74 | 6.2%(+0.245)#10,948 |
| 75. | Bridgton | 6.3% | 7.1%(-0.766)#75 | 6.2%(+0.109)#11,340 |
| 76. | Sanford | 6.3% | 7.1%(-0.780)#76 | 6.2%(+0.095)#11,389 |
| 77. | Gorham | 6.2% | 7.1%(-0.861)#77 | 6.2%(+0.014)#11,610 |
| 78. | Houlton | 6.1% | 7.1%(-0.909)#78 | 6.2%(-0.034)#11,755 |
| 79. | Westbrook | 6.1% | 7.1%(-0.964)#79 | 6.2%(-0.089)#11,932 |
| 80. | Auburn | 6.1% | 7.1%(-0.993)#80 | 6.2%(-0.118)#12,034 |
| 81. | Berwick | 5.9% | 7.1%(-1.12)#81 | 6.2%(-0.248)#12,385 |
| 82. | Lewiston | 5.7% | 7.1%(-1.33)#82 | 6.2%(-0.458)#12,995 |
| 83. | Falmouth Foreside | 5.6% | 7.1%(-1.42)#83 | 6.2%(-0.542)#13,252 |
| 84. | Hampden | 5.6% | 7.1%(-1.47)#84 | 6.2%(-0.594)#13,387 |
| 85. | South Portland | 5.5% | 7.1%(-1.51)#85 | 6.2%(-0.636)#13,538 |
| 86. | Saco | 5.4% | 7.1%(-1.68)#86 | 6.2%(-0.808)#14,025 |
| 87. | Belfast | 5.3% | 7.1%(-1.75)#87 | 6.2%(-0.874)#14,251 |
| 88. | Madison | 5.2% | 7.1%(-1.87)#88 | 6.2%(-1.000)#14,603 |
| 89. | West Kennebunk | 5.1% | 7.1%(-1.98)#89 | 6.2%(-1.10)#14,901 |
| 90. | Newport | 5.0% | 7.1%(-2.03)#90 | 6.2%(-1.15)#15,056 |
| 91. | North Windham | 4.9% | 7.1%(-2.16)#91 | 6.2%(-1.28)#15,467 |
| 92. | Eagle Lake | 4.8% | 7.1%(-2.30)#92 | 6.2%(-1.42)#15,899 |
| 93. | Mars Hill | 4.7% | 7.1%(-2.31)#93 | 6.2%(-1.44)#15,954 |
| 94. | Farmingdale | 4.7% | 7.1%(-2.31)#94 | 6.2%(-1.44)#15,957 |
| 95. | Bingham | 4.7% | 7.1%(-2.35)#95 | 6.2%(-1.47)#16,069 |
| 96. | Falmouth | 4.5% | 7.1%(-2.53)#96 | 6.2%(-1.65)#16,590 |
| 97. | Caribou | 4.5% | 7.1%(-2.54)#97 | 6.2%(-1.67)#16,653 |
| 98. | Oakfield | 4.5% | 7.1%(-2.60)#98 | 6.2%(-1.72)#16,839 |
| 99. | Bradley | 4.3% | 7.1%(-2.77)#99 | 6.2%(-1.89)#17,382 |
| 100. | Mechanic Falls | 4.3% | 7.1%(-2.77)#100 | 6.2%(-1.89)#17,384 |
1
2Common Questions
What are the Top 10 Cities with the Highest Percentage of Population Employed in Education Instruction & Library in Maine?
Top 10 Cities with the Highest Percentage of Population Employed in Education Instruction & Library in Maine are:
#1
42.4%
#2
24.0%
#3
22.6%
#4
19.4%
#5
19.1%
#6
18.6%
#7
18.4%
#8
17.2%
#9
15.9%
#10
15.2%
What city has the Highest Percentage of Population Employed in Education Instruction & Library in Maine?
Lubec has the Highest Percentage of Population Employed in Education Instruction & Library in Maine with 42.4%.
What is the Percentage of Population Employed in Education Instruction & Library in the State of Maine?
Percentage of Population Employed in Education Instruction & Library in Maine is 7.1%.
What is the Percentage of Population Employed in Education Instruction & Library in the United States?
Percentage of Population Employed in Education Instruction & Library in the United States is 6.2%.