Cities with the Highest Percentage of Population Employed in Education Instruction & Library in Virginia
RELATED REPORTS & OPTIONS
Education Instruction & Library
Virginia
Compare Cities
Map of Cities with the Highest Percentage of Population Employed in Education Instruction & Library in Virginia
0.0%
80.0%
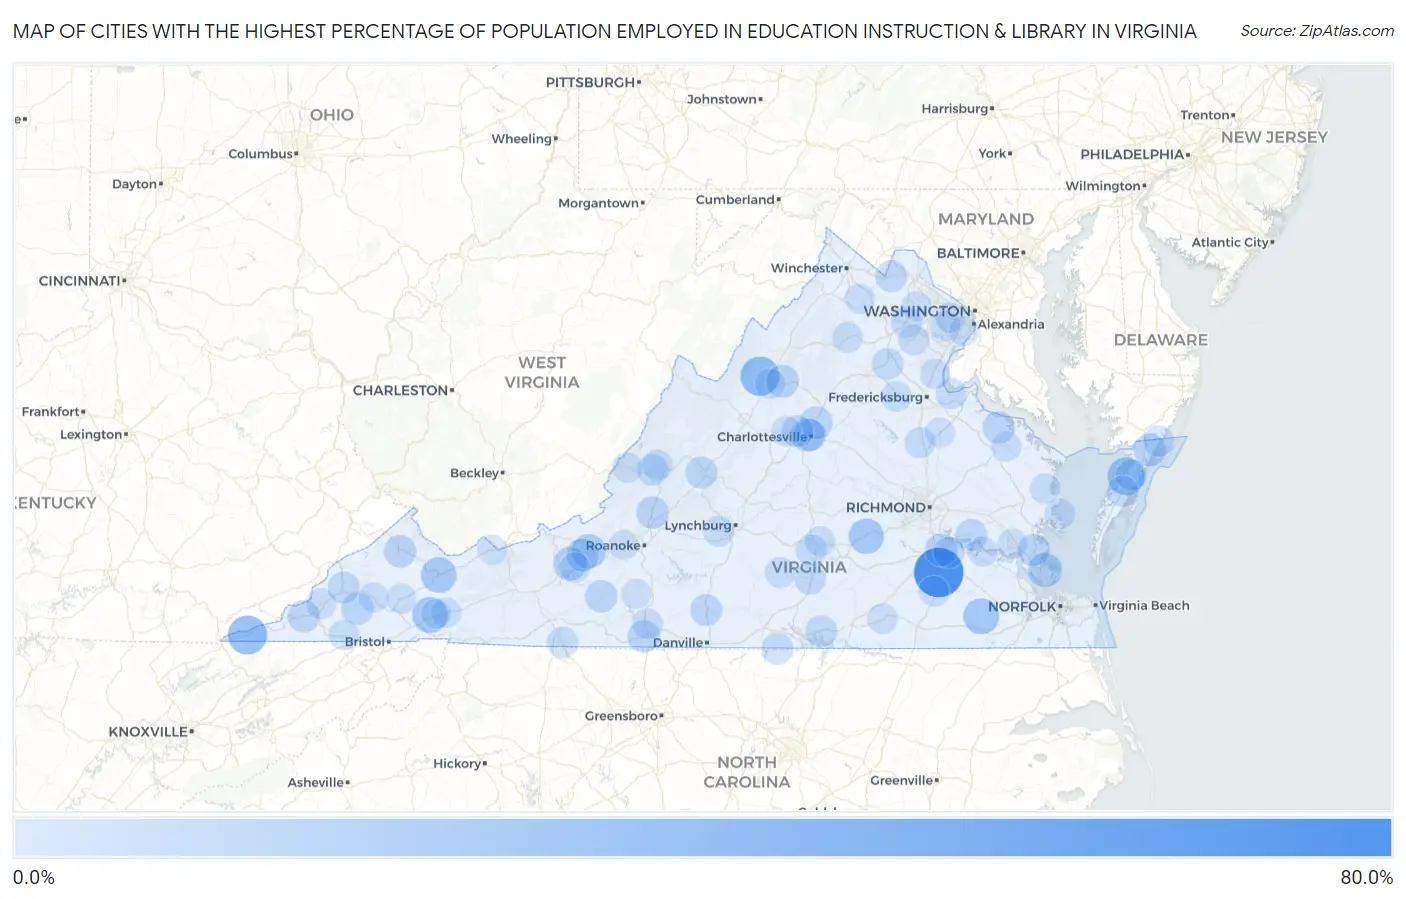
Cities with the Highest Percentage of Population Employed in Education Instruction & Library in Virginia
| City | % Employed | vs State | vs National | |
| 1. | Templeton | 70.5% | 6.5%(+63.9)#1 | 6.2%(+64.3)#31 |
| 2. | Brucetown | 52.7% | 6.5%(+46.1)#2 | 6.2%(+46.5)#76 |
| 3. | Mcdowell | 50.0% | 6.5%(+43.5)#3 | 6.2%(+43.8)#94 |
| 4. | Innovation | 39.6% | 6.5%(+33.0)#4 | 6.2%(+33.4)#174 |
| 5. | Stickleyville | 37.9% | 6.5%(+31.4)#5 | 6.2%(+31.7)#189 |
| 6. | Belmont Estates | 37.6% | 6.5%(+31.0)#6 | 6.2%(+31.4)#195 |
| 7. | Ewing | 37.4% | 6.5%(+30.9)#7 | 6.2%(+31.3)#203 |
| 8. | Bayside | 32.6% | 6.5%(+26.1)#8 | 6.2%(+26.4)#279 |
| 9. | Hilltown | 29.8% | 6.5%(+23.2)#9 | 6.2%(+23.6)#342 |
| 10. | North Garden | 28.6% | 6.5%(+22.0)#10 | 6.2%(+22.4)#367 |
| 11. | Big Rock | 27.6% | 6.5%(+21.0)#11 | 6.2%(+21.4)#396 |
| 12. | Sedley | 27.5% | 6.5%(+20.9)#12 | 6.2%(+21.3)#403 |
| 13. | Emory | 27.4% | 6.5%(+20.9)#13 | 6.2%(+21.2)#406 |
| 14. | Claypool Hill | 26.3% | 6.5%(+19.8)#14 | 6.2%(+20.2)#450 |
| 15. | Camp Barrett | 26.2% | 6.5%(+19.6)#15 | 6.2%(+20.0)#458 |
| 16. | Amelia Court House | 26.2% | 6.5%(+19.6)#16 | 6.2%(+20.0)#461 |
| 17. | Blacksburg | 23.2% | 6.5%(+16.6)#17 | 6.2%(+17.0)#597 |
| 18. | Bethel Manor | 22.8% | 6.5%(+16.2)#18 | 6.2%(+16.6)#631 |
| 19. | New River | 19.9% | 6.5%(+13.4)#19 | 6.2%(+13.8)#861 |
| 20. | University Of Virginia | 19.8% | 6.5%(+13.3)#20 | 6.2%(+13.7)#871 |
| 21. | Prices Fork | 18.4% | 6.5%(+11.9)#21 | 6.2%(+12.2)#1,029 |
| 22. | Pounding Mill | 18.4% | 6.5%(+11.9)#22 | 6.2%(+12.2)#1,031 |
| 23. | Massanutten | 18.4% | 6.5%(+11.8)#23 | 6.2%(+12.2)#1,037 |
| 24. | Fort Lee | 18.1% | 6.5%(+11.5)#24 | 6.2%(+11.9)#1,072 |
| 25. | Wattsville | 18.0% | 6.5%(+11.5)#25 | 6.2%(+11.9)#1,077 |
| 26. | Vansant | 17.8% | 6.5%(+11.3)#26 | 6.2%(+11.6)#1,113 |
| 27. | Fincastle | 17.7% | 6.5%(+11.2)#27 | 6.2%(+11.5)#1,131 |
| 28. | Hollymead | 17.5% | 6.5%(+10.9)#28 | 6.2%(+11.3)#1,162 |
| 29. | Montross | 17.3% | 6.5%(+10.7)#29 | 6.2%(+11.1)#1,194 |
| 30. | Floyd | 17.2% | 6.5%(+10.6)#30 | 6.2%(+11.0)#1,218 |
| 31. | Horse Pasture | 17.0% | 6.5%(+10.5)#31 | 6.2%(+10.8)#1,250 |
| 32. | Dungannon | 16.9% | 6.5%(+10.3)#32 | 6.2%(+10.7)#1,280 |
| 33. | Yorktown | 16.6% | 6.5%(+10.0)#33 | 6.2%(+10.4)#1,352 |
| 34. | Dryden | 16.4% | 6.5%(+9.86)#34 | 6.2%(+10.2)#1,381 |
| 35. | Lexington | 16.3% | 6.5%(+9.73)#35 | 6.2%(+10.1)#1,404 |
| 36. | Charles City | 15.8% | 6.5%(+9.24)#36 | 6.2%(+9.61)#1,521 |
| 37. | Charlottesville | 15.8% | 6.5%(+9.24)#37 | 6.2%(+9.60)#1,523 |
| 38. | Ivy | 15.6% | 6.5%(+9.02)#38 | 6.2%(+9.39)#1,566 |
| 39. | Chatham | 15.6% | 6.5%(+9.02)#39 | 6.2%(+9.38)#1,568 |
| 40. | Boydton | 15.4% | 6.5%(+8.89)#40 | 6.2%(+9.26)#1,603 |
| 41. | Millboro | 15.4% | 6.5%(+8.84)#41 | 6.2%(+9.20)#1,619 |
| 42. | Round Hill | 15.4% | 6.5%(+8.82)#42 | 6.2%(+9.18)#1,628 |
| 43. | Kincora | 15.3% | 6.5%(+8.80)#43 | 6.2%(+9.17)#1,633 |
| 44. | Wise | 15.3% | 6.5%(+8.75)#44 | 6.2%(+9.12)#1,641 |
| 45. | The University Of Virginia's College At Wise | 14.8% | 6.5%(+8.21)#45 | 6.2%(+8.58)#1,771 |
| 46. | Keysville | 14.6% | 6.5%(+8.01)#46 | 6.2%(+8.37)#1,824 |
| 47. | Virgilina | 14.5% | 6.5%(+7.94)#47 | 6.2%(+8.31)#1,839 |
| 48. | Low Moor | 14.5% | 6.5%(+7.90)#48 | 6.2%(+8.27)#1,855 |
| 49. | Remington | 14.3% | 6.5%(+7.74)#49 | 6.2%(+8.10)#1,898 |
| 50. | Big Stone Gap East | 14.3% | 6.5%(+7.74)#50 | 6.2%(+8.10)#1,901 |
| 51. | Earlysville | 14.2% | 6.5%(+7.69)#51 | 6.2%(+8.06)#1,952 |
| 52. | Chase Crossing | 14.1% | 6.5%(+7.57)#52 | 6.2%(+7.93)#1,995 |
| 53. | Melfa | 14.1% | 6.5%(+7.51)#53 | 6.2%(+7.87)#2,014 |
| 54. | Cana | 13.6% | 6.5%(+7.04)#54 | 6.2%(+7.41)#2,186 |
| 55. | Captains Cove | 13.4% | 6.5%(+6.88)#55 | 6.2%(+7.24)#2,249 |
| 56. | Haymarket | 13.4% | 6.5%(+6.82)#56 | 6.2%(+7.19)#2,271 |
| 57. | Prince George | 13.3% | 6.5%(+6.78)#57 | 6.2%(+7.15)#2,283 |
| 58. | Lake Caroline | 13.0% | 6.5%(+6.42)#58 | 6.2%(+6.78)#2,445 |
| 59. | Fairview Beach | 12.9% | 6.5%(+6.40)#59 | 6.2%(+6.77)#2,457 |
| 60. | Hampden Sydney | 12.9% | 6.5%(+6.35)#60 | 6.2%(+6.72)#2,475 |
| 61. | Goose Creek | 12.7% | 6.5%(+6.18)#61 | 6.2%(+6.55)#2,560 |
| 62. | Forest | 12.5% | 6.5%(+5.96)#62 | 6.2%(+6.33)#2,658 |
| 63. | Stony Creek | 12.2% | 6.5%(+5.63)#63 | 6.2%(+5.99)#2,828 |
| 64. | Lake Wilderness | 12.1% | 6.5%(+5.58)#64 | 6.2%(+5.95)#2,848 |
| 65. | Collinsville | 12.0% | 6.5%(+5.49)#65 | 6.2%(+5.86)#2,900 |
| 66. | Phenix | 11.9% | 6.5%(+5.37)#66 | 6.2%(+5.74)#2,955 |
| 67. | Nokesville | 11.8% | 6.5%(+5.24)#67 | 6.2%(+5.60)#3,019 |
| 68. | Washington | 11.8% | 6.5%(+5.22)#68 | 6.2%(+5.58)#3,042 |
| 69. | Burke Centre | 11.8% | 6.5%(+5.21)#69 | 6.2%(+5.57)#3,050 |
| 70. | Clifton Forge | 11.6% | 6.5%(+5.09)#70 | 6.2%(+5.45)#3,125 |
| 71. | Gwynn | 11.6% | 6.5%(+5.06)#71 | 6.2%(+5.42)#3,150 |
| 72. | Irvington | 11.5% | 6.5%(+4.99)#72 | 6.2%(+5.36)#3,187 |
| 73. | East Stone Gap | 11.5% | 6.5%(+4.94)#73 | 6.2%(+5.30)#3,224 |
| 74. | Big Stone Gap | 11.4% | 6.5%(+4.88)#74 | 6.2%(+5.24)#3,273 |
| 75. | Crozet | 11.3% | 6.5%(+4.74)#75 | 6.2%(+5.11)#3,368 |
| 76. | Massanetta Springs | 11.2% | 6.5%(+4.68)#76 | 6.2%(+5.05)#3,425 |
| 77. | Ferrum | 11.2% | 6.5%(+4.68)#77 | 6.2%(+5.05)#3,426 |
| 78. | Lawrenceville | 11.2% | 6.5%(+4.67)#78 | 6.2%(+5.04)#3,446 |
| 79. | Callaghan | 11.1% | 6.5%(+4.56)#79 | 6.2%(+4.93)#3,526 |
| 80. | Chilhowie | 11.0% | 6.5%(+4.47)#80 | 6.2%(+4.84)#3,606 |
| 81. | Radford | 11.0% | 6.5%(+4.46)#81 | 6.2%(+4.83)#3,613 |
| 82. | Williamsburg | 11.0% | 6.5%(+4.45)#82 | 6.2%(+4.82)#3,619 |
| 83. | Claremont | 11.0% | 6.5%(+4.44)#83 | 6.2%(+4.81)#3,627 |
| 84. | Warsaw | 10.9% | 6.5%(+4.38)#84 | 6.2%(+4.75)#3,673 |
| 85. | Gate City | 10.9% | 6.5%(+4.38)#85 | 6.2%(+4.75)#3,674 |
| 86. | Lebanon | 10.8% | 6.5%(+4.29)#86 | 6.2%(+4.65)#3,745 |
| 87. | St Paul | 10.8% | 6.5%(+4.24)#87 | 6.2%(+4.61)#3,774 |
| 88. | Hutchison | 10.8% | 6.5%(+4.20)#88 | 6.2%(+4.57)#3,800 |
| 89. | Sully Square | 10.7% | 6.5%(+4.19)#89 | 6.2%(+4.55)#3,812 |
| 90. | Farmville | 10.6% | 6.5%(+4.09)#90 | 6.2%(+4.46)#3,890 |
| 91. | Mantua | 10.6% | 6.5%(+4.04)#91 | 6.2%(+4.41)#3,932 |
| 92. | Aquia Harbour | 10.6% | 6.5%(+4.04)#92 | 6.2%(+4.40)#3,939 |
| 93. | Shenandoah Farms | 10.6% | 6.5%(+4.04)#93 | 6.2%(+4.40)#3,941 |
| 94. | Hayfield | 10.3% | 6.5%(+3.76)#94 | 6.2%(+4.12)#4,182 |
| 95. | Bluefield | 10.3% | 6.5%(+3.75)#95 | 6.2%(+4.11)#4,192 |
| 96. | Glade Spring | 10.3% | 6.5%(+3.73)#96 | 6.2%(+4.10)#4,203 |
| 97. | Stone Ridge | 10.2% | 6.5%(+3.64)#97 | 6.2%(+4.01)#4,294 |
| 98. | Glenvar | 10.1% | 6.5%(+3.60)#98 | 6.2%(+3.96)#4,353 |
| 99. | Bowling Green | 10.1% | 6.5%(+3.58)#99 | 6.2%(+3.95)#4,374 |
| 100. | Moneta | 10.0% | 6.5%(+3.45)#100 | 6.2%(+3.82)#4,509 |
Common Questions
What are the Top 10 Cities with the Highest Percentage of Population Employed in Education Instruction & Library in Virginia?
Top 10 Cities with the Highest Percentage of Population Employed in Education Instruction & Library in Virginia are:
#1
70.5%
#2
37.6%
#3
37.4%
#4
32.6%
#5
27.5%
#6
27.4%
#7
26.3%
#8
26.2%
#9
23.2%
#10
22.8%
What city has the Highest Percentage of Population Employed in Education Instruction & Library in Virginia?
Templeton has the Highest Percentage of Population Employed in Education Instruction & Library in Virginia with 70.5%.
What is the Percentage of Population Employed in Education Instruction & Library in the State of Virginia?
Percentage of Population Employed in Education Instruction & Library in Virginia is 6.5%.
What is the Percentage of Population Employed in Education Instruction & Library in the United States?
Percentage of Population Employed in Education Instruction & Library in the United States is 6.2%.