Cities with the Highest Percentage of Population Employed in Education Instruction & Library in Georgia
RELATED REPORTS & OPTIONS
Education Instruction & Library
Georgia
Compare Cities
Map of Cities with the Highest Percentage of Population Employed in Education Instruction & Library in Georgia
0.0%
50.0%
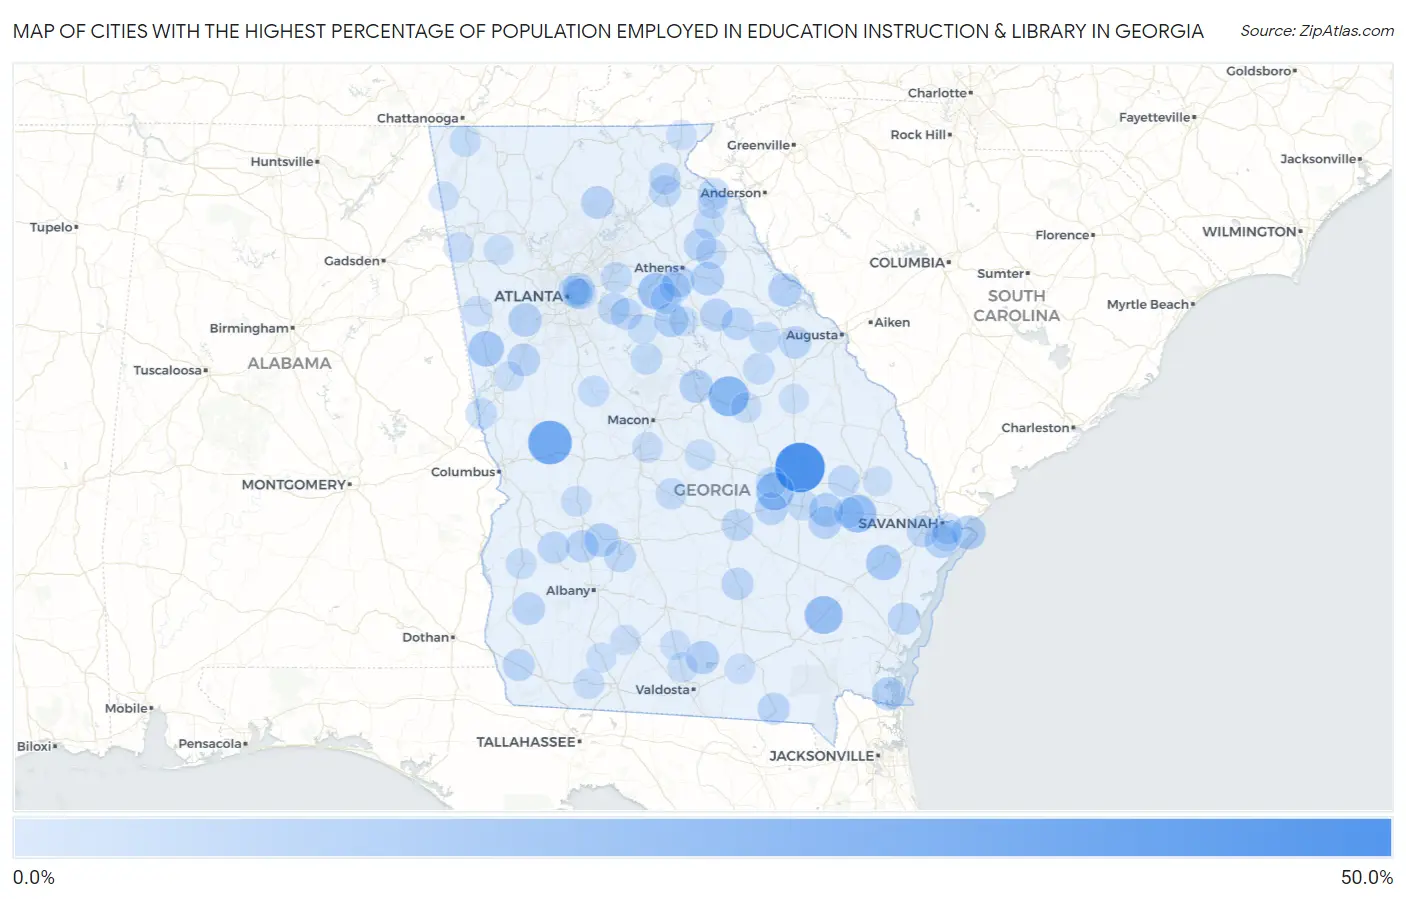
Cities with the Highest Percentage of Population Employed in Education Instruction & Library in Georgia
| City | % Employed | vs State | vs National | |
| 1. | Nunez | 50.0% | 6.3%(+43.7)#1 | 6.2%(+43.8)#90 |
| 2. | Talbotton | 37.5% | 6.3%(+31.2)#2 | 6.2%(+31.3)#196 |
| 3. | Deepstep | 29.6% | 6.3%(+23.3)#3 | 6.2%(+23.4)#344 |
| 4. | Patterson | 25.7% | 6.3%(+19.3)#4 | 6.2%(+19.5)#476 |
| 5. | Daisy | 25.3% | 6.3%(+18.9)#5 | 6.2%(+19.1)#489 |
| 6. | Tarrytown | 25.0% | 6.3%(+18.7)#6 | 6.2%(+18.8)#500 |
| 7. | Axson | 24.9% | 6.3%(+18.5)#7 | 6.2%(+18.7)#509 |
| 8. | Dixie | 23.2% | 6.3%(+16.9)#8 | 6.2%(+17.0)#595 |
| 9. | Good Hope | 23.0% | 6.3%(+16.6)#9 | 6.2%(+16.8)#616 |
| 10. | Waynesville | 21.1% | 6.3%(+14.8)#10 | 6.2%(+14.9)#752 |
| 11. | Waverly | 20.7% | 6.3%(+14.3)#11 | 6.2%(+14.5)#788 |
| 12. | Centralhatchee | 20.4% | 6.3%(+14.1)#12 | 6.2%(+14.2)#813 |
| 13. | Allenhurst | 19.9% | 6.3%(+13.6)#13 | 6.2%(+13.7)#862 |
| 14. | Berry College | 18.0% | 6.3%(+11.7)#14 | 6.2%(+11.8)#1,082 |
| 15. | Madison | 17.8% | 6.3%(+11.4)#15 | 6.2%(+11.6)#1,124 |
| 16. | Tybee Island | 17.6% | 6.3%(+11.3)#16 | 6.2%(+11.5)#1,135 |
| 17. | Collins | 17.2% | 6.3%(+10.8)#17 | 6.2%(+11.0)#1,214 |
| 18. | Leslie | 17.1% | 6.3%(+10.7)#18 | 6.2%(+10.9)#1,242 |
| 19. | Mershon | 16.7% | 6.3%(+10.3)#19 | 6.2%(+10.5)#1,333 |
| 20. | Chattahoochee Hills | 16.5% | 6.3%(+10.1)#20 | 6.2%(+10.3)#1,370 |
| 21. | Milledgeville | 16.4% | 6.3%(+10.1)#21 | 6.2%(+10.2)#1,383 |
| 22. | Crawford | 16.3% | 6.3%(+9.97)#22 | 6.2%(+10.1)#1,397 |
| 23. | Ellerslie | 16.3% | 6.3%(+9.95)#23 | 6.2%(+10.1)#1,400 |
| 24. | Kings Bay Base | 16.3% | 6.3%(+9.93)#24 | 6.2%(+10.1)#1,405 |
| 25. | Lincolnton | 16.3% | 6.3%(+9.93)#25 | 6.2%(+10.1)#1,406 |
| 26. | Ray City | 16.1% | 6.3%(+9.76)#26 | 6.2%(+9.92)#1,444 |
| 27. | Montgomery | 16.0% | 6.3%(+9.65)#27 | 6.2%(+9.81)#1,469 |
| 28. | Moreland | 15.1% | 6.3%(+8.80)#28 | 6.2%(+8.96)#1,679 |
| 29. | Union Point | 15.1% | 6.3%(+8.79)#29 | 6.2%(+8.95)#1,681 |
| 30. | Reidsville | 15.1% | 6.3%(+8.73)#30 | 6.2%(+8.89)#1,697 |
| 31. | Dawsonville | 15.1% | 6.3%(+8.72)#31 | 6.2%(+8.88)#1,700 |
| 32. | Mount Vernon | 14.7% | 6.3%(+8.39)#32 | 6.2%(+8.55)#1,778 |
| 33. | Dearing | 14.4% | 6.3%(+8.08)#33 | 6.2%(+8.24)#1,864 |
| 34. | Danielsville | 14.4% | 6.3%(+8.07)#34 | 6.2%(+8.22)#1,867 |
| 35. | Arlington | 14.4% | 6.3%(+8.04)#35 | 6.2%(+8.20)#1,877 |
| 36. | Crawfordville | 14.3% | 6.3%(+8.01)#36 | 6.2%(+8.16)#1,887 |
| 37. | Smithville | 14.3% | 6.3%(+7.94)#37 | 6.2%(+8.10)#1,910 |
| 38. | Fargo | 13.8% | 6.3%(+7.50)#38 | 6.2%(+7.66)#2,082 |
| 39. | Darien | 13.8% | 6.3%(+7.44)#39 | 6.2%(+7.60)#2,112 |
| 40. | Broxton | 13.7% | 6.3%(+7.34)#40 | 6.2%(+7.50)#2,147 |
| 41. | Parrott | 13.6% | 6.3%(+7.29)#41 | 6.2%(+7.45)#2,166 |
| 42. | Smarr | 13.6% | 6.3%(+7.27)#42 | 6.2%(+7.43)#2,174 |
| 43. | Athens-Clarke County Unified Government (Balance) | 13.6% | 6.3%(+7.22)#43 | 6.2%(+7.38)#2,194 |
| 44. | Watkinsville | 13.4% | 6.3%(+7.09)#44 | 6.2%(+7.25)#2,241 |
| 45. | Iron City | 13.4% | 6.3%(+7.06)#45 | 6.2%(+7.22)#2,258 |
| 46. | Mcrae Helena | 13.4% | 6.3%(+7.04)#46 | 6.2%(+7.19)#2,268 |
| 47. | Conyers | 13.3% | 6.3%(+6.99)#47 | 6.2%(+7.15)#2,304 |
| 48. | Henderson | 13.1% | 6.3%(+6.81)#48 | 6.2%(+6.97)#2,359 |
| 49. | North Decatur | 13.1% | 6.3%(+6.75)#49 | 6.2%(+6.91)#2,379 |
| 50. | Warwick | 13.0% | 6.3%(+6.70)#50 | 6.2%(+6.86)#2,397 |
| 51. | Pulaski | 13.0% | 6.3%(+6.70)#51 | 6.2%(+6.86)#2,402 |
| 52. | Cornelia | 13.0% | 6.3%(+6.67)#52 | 6.2%(+6.82)#2,423 |
| 53. | Gumlog | 13.0% | 6.3%(+6.66)#53 | 6.2%(+6.82)#2,428 |
| 54. | Clarkesville | 12.9% | 6.3%(+6.54)#54 | 6.2%(+6.70)#2,494 |
| 55. | Oxford | 12.8% | 6.3%(+6.47)#55 | 6.2%(+6.63)#2,526 |
| 56. | Mitchell | 12.7% | 6.3%(+6.33)#56 | 6.2%(+6.49)#2,581 |
| 57. | Monticello | 12.6% | 6.3%(+6.24)#57 | 6.2%(+6.40)#2,630 |
| 58. | West Point | 12.2% | 6.3%(+5.82)#58 | 6.2%(+5.97)#2,839 |
| 59. | Druid Hills | 12.1% | 6.3%(+5.79)#59 | 6.2%(+5.95)#2,851 |
| 60. | Camak | 12.1% | 6.3%(+5.73)#60 | 6.2%(+5.89)#2,886 |
| 61. | Thunderbolt | 12.0% | 6.3%(+5.69)#61 | 6.2%(+5.85)#2,901 |
| 62. | Barnesville | 12.0% | 6.3%(+5.63)#62 | 6.2%(+5.79)#2,931 |
| 63. | Avondale Estates | 12.0% | 6.3%(+5.62)#63 | 6.2%(+5.78)#2,936 |
| 64. | Chickamauga | 11.8% | 6.3%(+5.50)#64 | 6.2%(+5.66)#3,002 |
| 65. | Hawkinsville | 11.8% | 6.3%(+5.43)#65 | 6.2%(+5.58)#3,029 |
| 66. | Bishop | 11.7% | 6.3%(+5.40)#66 | 6.2%(+5.56)#3,061 |
| 67. | Grayson | 11.7% | 6.3%(+5.37)#67 | 6.2%(+5.53)#3,071 |
| 68. | Soperton | 11.7% | 6.3%(+5.32)#68 | 6.2%(+5.48)#3,107 |
| 69. | Lyons | 11.6% | 6.3%(+5.26)#69 | 6.2%(+5.42)#3,155 |
| 70. | Bostwick | 11.4% | 6.3%(+5.05)#70 | 6.2%(+5.21)#3,294 |
| 71. | Allentown | 11.3% | 6.3%(+4.95)#71 | 6.2%(+5.11)#3,371 |
| 72. | Claxton | 11.3% | 6.3%(+4.91)#72 | 6.2%(+5.07)#3,406 |
| 73. | Tennille | 11.2% | 6.3%(+4.84)#73 | 6.2%(+5.00)#3,470 |
| 74. | Comer | 11.2% | 6.3%(+4.83)#74 | 6.2%(+4.99)#3,473 |
| 75. | Centerville | 11.2% | 6.3%(+4.83)#75 | 6.2%(+4.99)#3,477 |
| 76. | Ellaville | 11.1% | 6.3%(+4.77)#76 | 6.2%(+4.93)#3,518 |
| 77. | Cuthbert | 11.0% | 6.3%(+4.70)#77 | 6.2%(+4.86)#3,582 |
| 78. | Cairo | 11.0% | 6.3%(+4.68)#78 | 6.2%(+4.84)#3,598 |
| 79. | Fairplay | 11.0% | 6.3%(+4.64)#79 | 6.2%(+4.80)#3,636 |
| 80. | Isle Of Hope | 11.0% | 6.3%(+4.62)#80 | 6.2%(+4.78)#3,644 |
| 81. | Sterling | 10.9% | 6.3%(+4.51)#81 | 6.2%(+4.67)#3,725 |
| 82. | Franklin Springs | 10.8% | 6.3%(+4.46)#82 | 6.2%(+4.62)#3,763 |
| 83. | Mount Zion | 10.7% | 6.3%(+4.33)#83 | 6.2%(+4.49)#3,868 |
| 84. | Decatur | 10.6% | 6.3%(+4.23)#84 | 6.2%(+4.39)#3,950 |
| 85. | Du Pont | 10.5% | 6.3%(+4.18)#85 | 6.2%(+4.34)#3,994 |
| 86. | Hahira | 10.4% | 6.3%(+4.07)#86 | 6.2%(+4.23)#4,095 |
| 87. | Lavonia | 10.2% | 6.3%(+3.85)#87 | 6.2%(+4.01)#4,293 |
| 88. | Cave Spring | 10.2% | 6.3%(+3.85)#88 | 6.2%(+4.00)#4,299 |
| 89. | Taylorsville | 10.2% | 6.3%(+3.83)#89 | 6.2%(+3.99)#4,323 |
| 90. | Mansfield | 10.1% | 6.3%(+3.77)#90 | 6.2%(+3.93)#4,392 |
| 91. | Funston | 10.1% | 6.3%(+3.71)#91 | 6.2%(+3.87)#4,461 |
| 92. | Sparks | 10.0% | 6.3%(+3.67)#92 | 6.2%(+3.83)#4,490 |
| 93. | Mountain City | 9.9% | 6.3%(+3.58)#93 | 6.2%(+3.74)#4,596 |
| 94. | Meigs | 9.9% | 6.3%(+3.58)#94 | 6.2%(+3.74)#4,599 |
| 95. | Buckhead | 9.9% | 6.3%(+3.55)#95 | 6.2%(+3.71)#4,629 |
| 96. | Cusseta Chattahoochee County Unified Government | 9.8% | 6.3%(+3.50)#96 | 6.2%(+3.66)#4,700 |
| 97. | Hogansville | 9.8% | 6.3%(+3.41)#97 | 6.2%(+3.57)#4,814 |
| 98. | Brooklet | 9.7% | 6.3%(+3.38)#98 | 6.2%(+3.53)#4,843 |
| 99. | Menlo | 9.7% | 6.3%(+3.34)#99 | 6.2%(+3.49)#4,885 |
| 100. | Louisville | 9.7% | 6.3%(+3.33)#100 | 6.2%(+3.49)#4,901 |
Common Questions
What are the Top 10 Cities with the Highest Percentage of Population Employed in Education Instruction & Library in Georgia?
Top 10 Cities with the Highest Percentage of Population Employed in Education Instruction & Library in Georgia are:
#1
50.0%
#2
37.5%
#3
29.6%
#4
25.7%
#5
25.3%
#6
25.0%
#7
23.0%
#8
20.4%
#9
19.9%
#10
17.8%
What city has the Highest Percentage of Population Employed in Education Instruction & Library in Georgia?
Nunez has the Highest Percentage of Population Employed in Education Instruction & Library in Georgia with 50.0%.
What is the Percentage of Population Employed in Education Instruction & Library in the State of Georgia?
Percentage of Population Employed in Education Instruction & Library in Georgia is 6.3%.
What is the Percentage of Population Employed in Education Instruction & Library in the United States?
Percentage of Population Employed in Education Instruction & Library in the United States is 6.2%.