Cities with the Highest Percentage of Population Employed in Education Instruction & Library in Indiana
RELATED REPORTS & OPTIONS
Education Instruction & Library
Indiana
Compare Cities
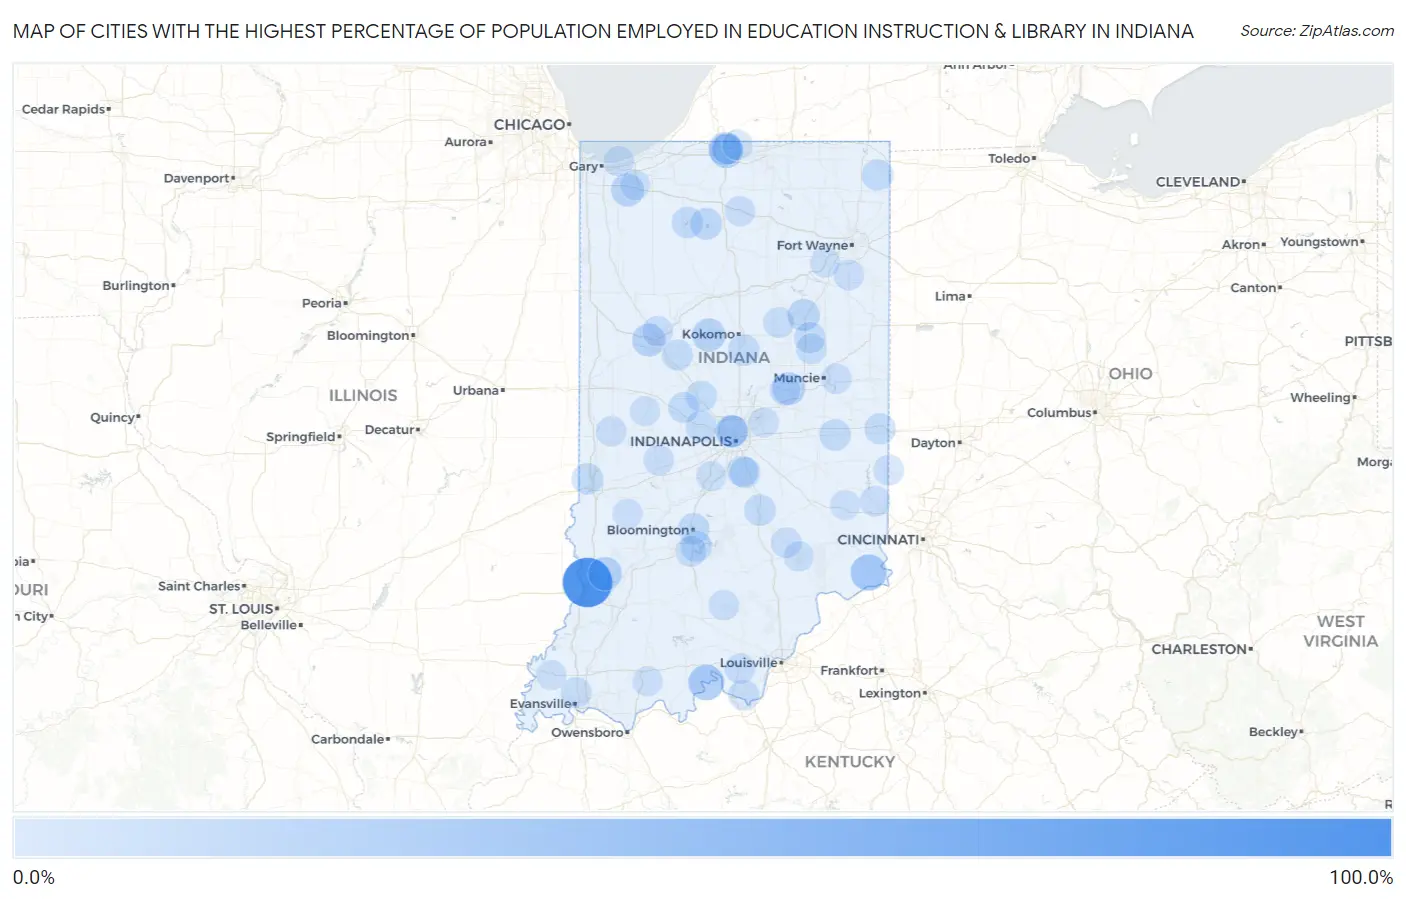
Map of Cities with the Highest Percentage of Population Employed in Education Instruction & Library in Indiana
0.0%
100.0%
Cities with the Highest Percentage of Population Employed in Education Instruction & Library in Indiana
| City | % Employed | vs State | vs National | |
| 1. | Emison | 100.0% | 5.8%(+94.2)#1 | 6.2%(+93.8)#11 |
| 2. | New Lebanon | 51.2% | 5.8%(+45.5)#2 | 6.2%(+45.1)#86 |
| 3. | Hedrick | 49.2% | 5.8%(+43.4)#3 | 6.2%(+43.0)#103 |
| 4. | Cowan | 45.9% | 5.8%(+40.2)#4 | 6.2%(+39.8)#124 |
| 5. | Buckskin | 42.9% | 5.8%(+37.1)#5 | 6.2%(+36.7)#151 |
| 6. | Graysville | 36.8% | 5.8%(+31.1)#6 | 6.2%(+30.7)#211 |
| 7. | East Enterprise | 35.7% | 5.8%(+30.0)#7 | 6.2%(+29.5)#226 |
| 8. | Lake Everett | 34.8% | 5.8%(+29.1)#8 | 6.2%(+28.7)#247 |
| 9. | Petroleum | 34.4% | 5.8%(+28.6)#9 | 6.2%(+28.2)#254 |
| 10. | Belleville | 33.5% | 5.8%(+27.7)#10 | 6.2%(+27.3)#259 |
| 11. | Boone Grove | 33.3% | 5.8%(+27.6)#11 | 6.2%(+27.1)#266 |
| 12. | Alton | 33.3% | 5.8%(+27.6)#12 | 6.2%(+27.1)#267 |
| 13. | Keystone | 31.6% | 5.8%(+25.8)#13 | 6.2%(+25.4)#295 |
| 14. | Wooster | 28.6% | 5.8%(+22.8)#14 | 6.2%(+22.4)#370 |
| 15. | Millgrove | 27.3% | 5.8%(+21.5)#15 | 6.2%(+21.1)#414 |
| 16. | Notre Dame | 24.9% | 5.8%(+19.2)#16 | 6.2%(+18.7)#506 |
| 17. | Freelandville | 24.4% | 5.8%(+18.6)#17 | 6.2%(+18.2)#528 |
| 18. | Roseland | 22.8% | 5.8%(+17.1)#18 | 6.2%(+16.6)#626 |
| 19. | Rob Roy | 22.7% | 5.8%(+17.0)#19 | 6.2%(+16.5)#634 |
| 20. | West Lafayette | 22.4% | 5.8%(+16.7)#20 | 6.2%(+16.3)#656 |
| 21. | Burlington | 22.3% | 5.8%(+16.5)#21 | 6.2%(+16.1)#663 |
| 22. | Aberdeen | 21.3% | 5.8%(+15.6)#22 | 6.2%(+15.2)#736 |
| 23. | Woodlawn Heights | 21.2% | 5.8%(+15.4)#23 | 6.2%(+15.0)#751 |
| 24. | Patricksburg | 21.0% | 5.8%(+15.2)#24 | 6.2%(+14.8)#761 |
| 25. | Hillsdale | 20.4% | 5.8%(+14.6)#25 | 6.2%(+14.2)#819 |
| 26. | Prospect | 19.5% | 5.8%(+13.7)#26 | 6.2%(+13.3)#911 |
| 27. | Wynnedale | 19.1% | 5.8%(+13.4)#27 | 6.2%(+12.9)#948 |
| 28. | Stendal | 19.0% | 5.8%(+13.3)#28 | 6.2%(+12.9)#962 |
| 29. | Chili | 18.4% | 5.8%(+12.7)#29 | 6.2%(+12.2)#1,028 |
| 30. | Landess | 18.2% | 5.8%(+12.4)#30 | 6.2%(+12.0)#1,065 |
| 31. | Cree Lake | 17.9% | 5.8%(+12.2)#31 | 6.2%(+11.8)#1,093 |
| 32. | Browns Crossing | 17.6% | 5.8%(+11.9)#32 | 6.2%(+11.4)#1,141 |
| 33. | Deer Creek | 17.5% | 5.8%(+11.8)#33 | 6.2%(+11.4)#1,153 |
| 34. | Alford | 17.0% | 5.8%(+11.3)#34 | 6.2%(+10.8)#1,249 |
| 35. | Gwynneville | 16.9% | 5.8%(+11.2)#35 | 6.2%(+10.8)#1,259 |
| 36. | Culver | 16.7% | 5.8%(+11.0)#36 | 6.2%(+10.6)#1,295 |
| 37. | Spring Hill | 16.7% | 5.8%(+10.9)#37 | 6.2%(+10.5)#1,326 |
| 38. | Straughn | 15.4% | 5.8%(+9.69)#38 | 6.2%(+9.26)#1,602 |
| 39. | Hamilton | 15.3% | 5.8%(+9.53)#39 | 6.2%(+9.11)#1,645 |
| 40. | Bass Lake | 15.2% | 5.8%(+9.47)#40 | 6.2%(+9.05)#1,659 |
| 41. | Sharpsville | 14.9% | 5.8%(+9.14)#41 | 6.2%(+8.72)#1,735 |
| 42. | Fairbanks | 14.8% | 5.8%(+9.08)#42 | 6.2%(+8.65)#1,755 |
| 43. | Bloomington | 14.8% | 5.8%(+9.00)#43 | 6.2%(+8.57)#1,774 |
| 44. | Charlottesville | 14.6% | 5.8%(+8.84)#44 | 6.2%(+8.41)#1,815 |
| 45. | New London | 14.6% | 5.8%(+8.83)#45 | 6.2%(+8.40)#1,820 |
| 46. | St Mary Of The Woods | 14.5% | 5.8%(+8.73)#46 | 6.2%(+8.31)#1,838 |
| 47. | Taylorsville | 14.5% | 5.8%(+8.71)#47 | 6.2%(+8.28)#1,847 |
| 48. | Anoka | 14.1% | 5.8%(+8.38)#48 | 6.2%(+7.96)#1,983 |
| 49. | Upland | 14.1% | 5.8%(+8.29)#49 | 6.2%(+7.87)#2,015 |
| 50. | Smithville Sanders | 13.7% | 5.8%(+7.98)#50 | 6.2%(+7.55)#2,127 |
| 51. | Spring Grove | 13.6% | 5.8%(+7.88)#51 | 6.2%(+7.45)#2,159 |
| 52. | Grandview Lake | 13.5% | 5.8%(+7.78)#52 | 6.2%(+7.35)#2,203 |
| 53. | Pittsboro | 13.4% | 5.8%(+7.63)#53 | 6.2%(+7.20)#2,266 |
| 54. | New Whiteland | 13.2% | 5.8%(+7.48)#54 | 6.2%(+7.05)#2,328 |
| 55. | Ulen | 13.2% | 5.8%(+7.45)#55 | 6.2%(+7.02)#2,340 |
| 56. | Advance | 13.1% | 5.8%(+7.34)#56 | 6.2%(+6.92)#2,373 |
| 57. | Indian Village | 13.0% | 5.8%(+7.20)#57 | 6.2%(+6.78)#2,450 |
| 58. | Mulberry | 12.8% | 5.8%(+7.08)#58 | 6.2%(+6.66)#2,512 |
| 59. | Sweetser | 12.3% | 5.8%(+6.55)#59 | 6.2%(+6.12)#2,769 |
| 60. | Whiteland | 12.3% | 5.8%(+6.53)#60 | 6.2%(+6.10)#2,777 |
| 61. | Harrodsburg | 11.9% | 5.8%(+6.16)#61 | 6.2%(+5.73)#2,958 |
| 62. | Rockford | 11.9% | 5.8%(+6.10)#62 | 6.2%(+5.67)#2,991 |
| 63. | Laconia | 11.8% | 5.8%(+6.01)#63 | 6.2%(+5.58)#3,041 |
| 64. | Matthews | 11.7% | 5.8%(+5.89)#64 | 6.2%(+5.47)#3,116 |
| 65. | Groveland | 11.5% | 5.8%(+5.74)#65 | 6.2%(+5.31)#3,219 |
| 66. | Highland | 11.5% | 5.8%(+5.69)#66 | 6.2%(+5.27)#3,247 |
| 67. | Marietta | 11.3% | 5.8%(+5.55)#67 | 6.2%(+5.12)#3,363 |
| 68. | Ramsey | 11.3% | 5.8%(+5.51)#68 | 6.2%(+5.09)#3,393 |
| 69. | Cedar Grove | 11.1% | 5.8%(+5.35)#69 | 6.2%(+4.93)#3,530 |
| 70. | Antioch | 11.1% | 5.8%(+5.35)#70 | 6.2%(+4.93)#3,534 |
| 71. | Beaver Dam | 11.1% | 5.8%(+5.35)#71 | 6.2%(+4.93)#3,538 |
| 72. | River Forest | 11.1% | 5.8%(+5.35)#72 | 6.2%(+4.93)#3,553 |
| 73. | West College Corner | 11.0% | 5.8%(+5.28)#73 | 6.2%(+4.85)#3,590 |
| 74. | Ogden Dunes | 11.0% | 5.8%(+5.25)#74 | 6.2%(+4.82)#3,618 |
| 75. | Ossian | 11.0% | 5.8%(+5.19)#75 | 6.2%(+4.77)#3,653 |
| 76. | Jefferson | 10.9% | 5.8%(+5.15)#76 | 6.2%(+4.73)#3,692 |
| 77. | Greencastle | 10.8% | 5.8%(+5.03)#77 | 6.2%(+4.61)#3,775 |
| 78. | Selma | 10.8% | 5.8%(+5.03)#78 | 6.2%(+4.61)#3,776 |
| 79. | Battle Ground | 10.6% | 5.8%(+4.84)#79 | 6.2%(+4.41)#3,929 |
| 80. | Foxcliff Estates | 10.5% | 5.8%(+4.77)#80 | 6.2%(+4.34)#3,985 |
| 81. | Center | 10.4% | 5.8%(+4.61)#81 | 6.2%(+4.19)#4,128 |
| 82. | Pleasant Lake | 10.2% | 5.8%(+4.45)#82 | 6.2%(+4.03)#4,269 |
| 83. | Bloomingdale | 10.2% | 5.8%(+4.45)#83 | 6.2%(+4.02)#4,284 |
| 84. | Fishersburg | 10.2% | 5.8%(+4.45)#84 | 6.2%(+4.02)#4,288 |
| 85. | Scipio | 10.2% | 5.8%(+4.41)#85 | 6.2%(+3.99)#4,325 |
| 86. | Bourbon | 10.1% | 5.8%(+4.35)#86 | 6.2%(+3.92)#4,394 |
| 87. | Campbellsburg | 10.0% | 5.8%(+4.24)#87 | 6.2%(+3.82)#4,504 |
| 88. | Vernon | 9.8% | 5.8%(+4.02)#88 | 6.2%(+3.59)#4,786 |
| 89. | Corydon | 9.8% | 5.8%(+4.00)#89 | 6.2%(+3.57)#4,804 |
| 90. | Valparaiso | 9.7% | 5.8%(+3.93)#90 | 6.2%(+3.51)#4,872 |
| 91. | Granger | 9.6% | 5.8%(+3.85)#91 | 6.2%(+3.43)#4,970 |
| 92. | Bethany | 9.5% | 5.8%(+3.77)#92 | 6.2%(+3.34)#5,068 |
| 93. | Merriam | 9.5% | 5.8%(+3.73)#93 | 6.2%(+3.31)#5,103 |
| 94. | Roanoke | 9.4% | 5.8%(+3.60)#94 | 6.2%(+3.18)#5,251 |
| 95. | Poseyville | 9.3% | 5.8%(+3.50)#95 | 6.2%(+3.08)#5,373 |
| 96. | Mccordsville | 9.2% | 5.8%(+3.39)#96 | 6.2%(+2.97)#5,519 |
| 97. | Santa Claus | 9.0% | 5.8%(+3.29)#97 | 6.2%(+2.86)#5,669 |
| 98. | Clay City | 9.0% | 5.8%(+3.26)#98 | 6.2%(+2.83)#5,705 |
| 99. | Oldenburg | 9.0% | 5.8%(+3.25)#99 | 6.2%(+2.83)#5,713 |
| 100. | Lake Holiday | 8.9% | 5.8%(+3.19)#100 | 6.2%(+2.76)#5,797 |
Common Questions
What are the Top 10 Cities with the Highest Percentage of Population Employed in Education Instruction & Library in Indiana?
Top 10 Cities with the Highest Percentage of Population Employed in Education Instruction & Library in Indiana are:
#1
100.0%
#2
35.7%
#3
33.3%
#4
24.9%
#5
24.4%
#6
22.8%
#7
22.4%
#8
22.3%
#9
21.3%
#10
21.2%
What city has the Highest Percentage of Population Employed in Education Instruction & Library in Indiana?
Emison has the Highest Percentage of Population Employed in Education Instruction & Library in Indiana with 100.0%.
What is the Percentage of Population Employed in Education Instruction & Library in the State of Indiana?
Percentage of Population Employed in Education Instruction & Library in Indiana is 5.8%.
What is the Percentage of Population Employed in Education Instruction & Library in the United States?
Percentage of Population Employed in Education Instruction & Library in the United States is 6.2%.