Cities with the Highest Percentage of Population Employed in Education Instruction & Library in Connecticut
RELATED REPORTS & OPTIONS
Education Instruction & Library
Connecticut
Compare Cities
Map of Cities with the Highest Percentage of Population Employed in Education Instruction & Library in Connecticut
0.0%
40.0%
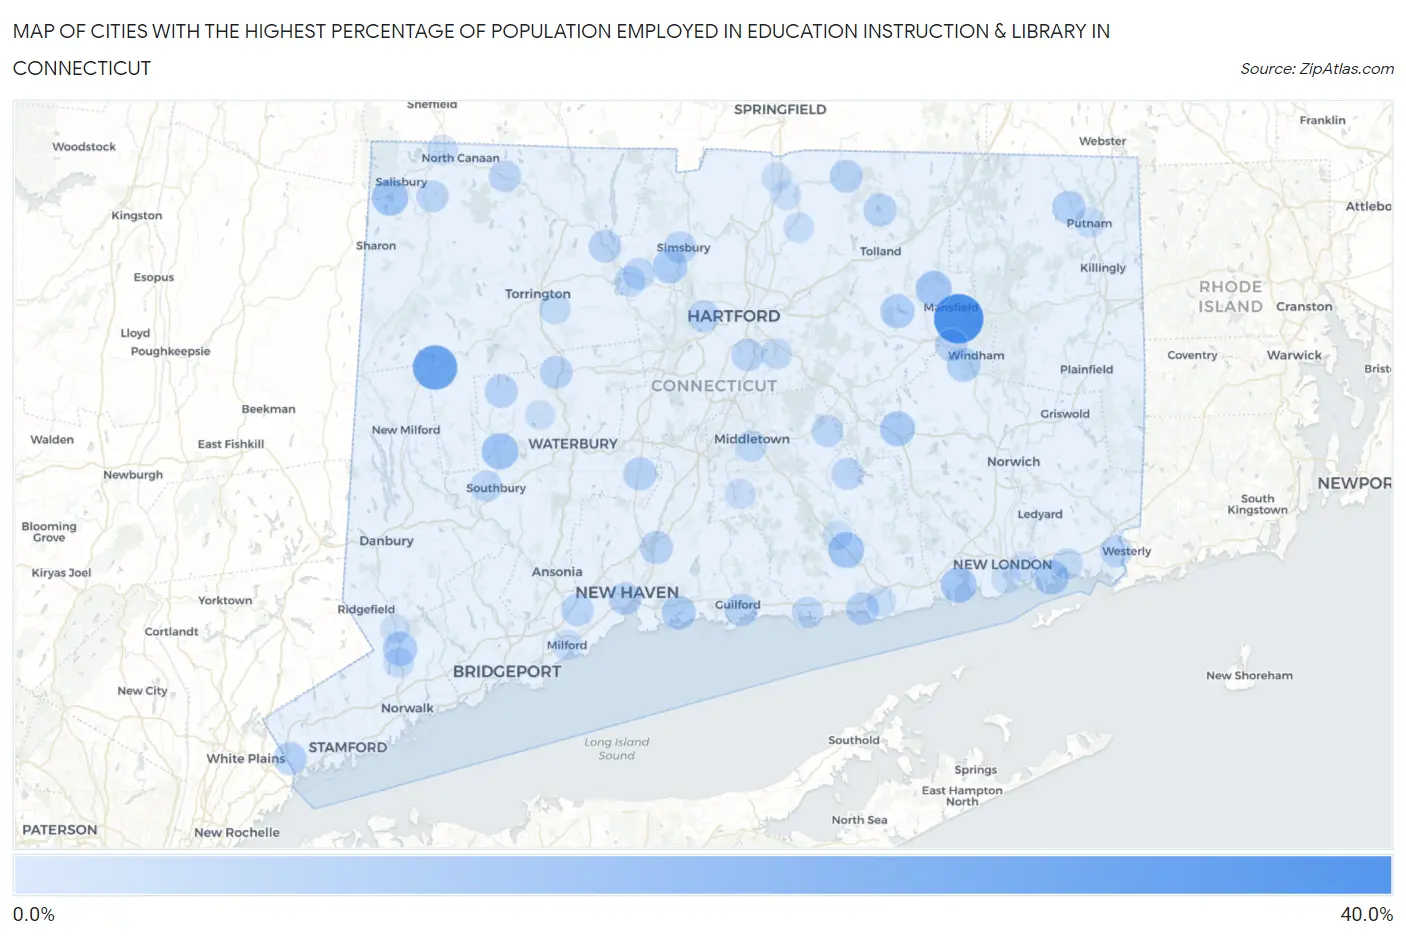
Cities with the Highest Percentage of Population Employed in Education Instruction & Library in Connecticut
| City | % Employed | vs State | vs National | |
| 1. | Mansfield Center | 36.8% | 7.4%(+29.4)#1 | 6.2%(+30.6)#212 |
| 2. | Lake Chaffee | 29.1% | 7.4%(+21.7)#2 | 6.2%(+22.9)#354 |
| 3. | New Preston | 28.7% | 7.4%(+21.3)#3 | 6.2%(+22.6)#362 |
| 4. | Route 7 Gateway | 25.9% | 7.4%(+18.5)#4 | 6.2%(+19.7)#469 |
| 5. | Quinnipiac University | 19.6% | 7.4%(+12.2)#5 | 6.2%(+13.4)#892 |
| 6. | Lakes East | 17.5% | 7.4%(+10.0)#6 | 6.2%(+11.3)#1,165 |
| 7. | Old Hill | 17.1% | 7.4%(+9.73)#7 | 6.2%(+11.0)#1,223 |
| 8. | Dayville | 17.1% | 7.4%(+9.68)#8 | 6.2%(+10.9)#1,234 |
| 9. | Pleasant Valley | 16.8% | 7.4%(+9.39)#9 | 6.2%(+10.6)#1,285 |
| 10. | Woodbury Center | 16.7% | 7.4%(+9.26)#10 | 6.2%(+10.5)#1,304 |
| 11. | Lakeville | 16.5% | 7.4%(+9.13)#11 | 6.2%(+10.4)#1,357 |
| 12. | Storrs | 15.8% | 7.4%(+8.44)#12 | 6.2%(+9.66)#1,507 |
| 13. | Deep River Center | 15.7% | 7.4%(+8.26)#13 | 6.2%(+9.49)#1,540 |
| 14. | Niantic | 15.7% | 7.4%(+8.26)#14 | 6.2%(+9.48)#1,543 |
| 15. | Bigelow Corners | 15.5% | 7.4%(+8.13)#15 | 6.2%(+9.35)#1,572 |
| 16. | Mamanasco Lake | 15.3% | 7.4%(+7.90)#16 | 6.2%(+9.12)#1,639 |
| 17. | Witches Woods | 15.0% | 7.4%(+7.59)#17 | 6.2%(+8.82)#1,710 |
| 18. | Mechanicsville | 14.8% | 7.4%(+7.41)#18 | 6.2%(+8.63)#1,761 |
| 19. | Hawleyville | 14.5% | 7.4%(+7.07)#19 | 6.2%(+8.29)#1,845 |
| 20. | Litchfield Borough | 14.4% | 7.4%(+7.03)#20 | 6.2%(+8.25)#1,858 |
| 21. | Colchester | 14.4% | 7.4%(+7.02)#21 | 6.2%(+8.25)#1,863 |
| 22. | Noank | 13.9% | 7.4%(+6.45)#22 | 6.2%(+7.67)#2,076 |
| 23. | East | 13.7% | 7.4%(+6.29)#23 | 6.2%(+7.51)#2,141 |
| 24. | Weatogue | 13.4% | 7.4%(+6.01)#24 | 6.2%(+7.23)#2,255 |
| 25. | Cannondale | 13.4% | 7.4%(+5.96)#25 | 6.2%(+7.19)#2,272 |
| 26. | Coventry Lake | 13.3% | 7.4%(+5.85)#26 | 6.2%(+7.07)#2,322 |
| 27. | Branford Center | 13.1% | 7.4%(+5.67)#27 | 6.2%(+6.89)#2,384 |
| 28. | Lake Bungee | 13.0% | 7.4%(+5.56)#28 | 6.2%(+6.78)#2,442 |
| 29. | South Windham | 12.8% | 7.4%(+5.42)#29 | 6.2%(+6.65)#2,515 |
| 30. | Topstone | 12.3% | 7.4%(+4.90)#30 | 6.2%(+6.12)#2,768 |
| 31. | South Woodstock | 12.2% | 7.4%(+4.75)#31 | 6.2%(+5.97)#2,840 |
| 32. | Poplar Plains | 12.1% | 7.4%(+4.74)#32 | 6.2%(+5.96)#2,841 |
| 33. | Tashua | 12.1% | 7.4%(+4.65)#33 | 6.2%(+5.88)#2,892 |
| 34. | Glenville | 12.0% | 7.4%(+4.63)#34 | 6.2%(+5.85)#2,904 |
| 35. | Woodmont Borough | 12.0% | 7.4%(+4.60)#35 | 6.2%(+5.82)#2,916 |
| 36. | North Haven | 11.9% | 7.4%(+4.50)#36 | 6.2%(+5.73)#2,963 |
| 37. | Cheshire Village | 11.9% | 7.4%(+4.46)#37 | 6.2%(+5.68)#2,983 |
| 38. | Crystal Lake | 11.8% | 7.4%(+4.43)#38 | 6.2%(+5.65)#3,004 |
| 39. | Bethlehem Village | 11.7% | 7.4%(+4.33)#39 | 6.2%(+5.56)#3,062 |
| 40. | Somers | 11.7% | 7.4%(+4.29)#40 | 6.2%(+5.51)#3,083 |
| 41. | Northford | 11.6% | 7.4%(+4.24)#41 | 6.2%(+5.47)#3,118 |
| 42. | Saybrook Manor | 11.5% | 7.4%(+4.09)#42 | 6.2%(+5.31)#3,216 |
| 43. | Cornwall | 11.4% | 7.4%(+4.02)#43 | 6.2%(+5.25)#3,270 |
| 44. | Thomaston | 11.3% | 7.4%(+3.92)#44 | 6.2%(+5.15)#3,343 |
| 45. | Guilford Center | 11.3% | 7.4%(+3.88)#45 | 6.2%(+5.10)#3,376 |
| 46. | New Haven | 11.3% | 7.4%(+3.87)#46 | 6.2%(+5.10)#3,386 |
| 47. | New Hartford Center | 11.2% | 7.4%(+3.76)#47 | 6.2%(+4.98)#3,481 |
| 48. | Brookfield Center | 11.1% | 7.4%(+3.71)#48 | 6.2%(+4.93)#3,533 |
| 49. | Rock Ridge | 11.1% | 7.4%(+3.65)#49 | 6.2%(+4.88)#3,572 |
| 50. | Botsford | 11.0% | 7.4%(+3.55)#50 | 6.2%(+4.77)#3,655 |
| 51. | Willimantic | 10.9% | 7.4%(+3.54)#51 | 6.2%(+4.76)#3,660 |
| 52. | Orange | 10.9% | 7.4%(+3.51)#52 | 6.2%(+4.73)#3,686 |
| 53. | Plattsville | 10.8% | 7.4%(+3.41)#53 | 6.2%(+4.63)#3,754 |
| 54. | Simsbury Center | 10.8% | 7.4%(+3.39)#54 | 6.2%(+4.61)#3,772 |
| 55. | Pawcatuck | 10.7% | 7.4%(+3.31)#55 | 6.2%(+4.53)#3,838 |
| 56. | Wethersfield | 10.7% | 7.4%(+3.28)#56 | 6.2%(+4.50)#3,854 |
| 57. | Lakes West | 10.6% | 7.4%(+3.21)#57 | 6.2%(+4.43)#3,911 |
| 58. | West Hartford | 10.4% | 7.4%(+3.01)#58 | 6.2%(+4.24)#4,091 |
| 59. | Norfolk | 10.3% | 7.4%(+2.85)#59 | 6.2%(+4.07)#4,220 |
| 60. | Candlewood Isle | 10.2% | 7.4%(+2.84)#60 | 6.2%(+4.06)#4,236 |
| 61. | Moodus | 10.2% | 7.4%(+2.79)#61 | 6.2%(+4.02)#4,289 |
| 62. | East Hampton | 10.1% | 7.4%(+2.66)#62 | 6.2%(+3.89)#4,435 |
| 63. | Falls Village | 10.0% | 7.4%(+2.64)#63 | 6.2%(+3.86)#4,468 |
| 64. | Knollcrest | 10.0% | 7.4%(+2.59)#64 | 6.2%(+3.82)#4,512 |
| 65. | Canton Valley | 9.9% | 7.4%(+2.54)#65 | 6.2%(+3.76)#4,583 |
| 66. | Oronoque | 9.8% | 7.4%(+2.41)#66 | 6.2%(+3.64)#4,724 |
| 67. | Groton Long Point Borough | 9.8% | 7.4%(+2.36)#67 | 6.2%(+3.58)#4,795 |
| 68. | Clinton | 9.6% | 7.4%(+2.23)#68 | 6.2%(+3.45)#4,931 |
| 69. | Gaylordsville | 9.6% | 7.4%(+2.15)#69 | 6.2%(+3.37)#5,029 |
| 70. | Heritage Village | 9.5% | 7.4%(+2.07)#70 | 6.2%(+3.29)#5,123 |
| 71. | Middletown | 9.4% | 7.4%(+2.04)#71 | 6.2%(+3.26)#5,163 |
| 72. | Northwest Harwinton | 9.3% | 7.4%(+1.86)#72 | 6.2%(+3.09)#5,364 |
| 73. | Glastonbury Center | 9.1% | 7.4%(+1.73)#73 | 6.2%(+2.95)#5,539 |
| 74. | Trumbull Center | 9.1% | 7.4%(+1.72)#74 | 6.2%(+2.94)#5,546 |
| 75. | Mystic | 9.1% | 7.4%(+1.71)#75 | 6.2%(+2.93)#5,561 |
| 76. | Newtown Borough | 9.0% | 7.4%(+1.62)#76 | 6.2%(+2.84)#5,693 |
| 77. | Collinsville | 8.8% | 7.4%(+1.38)#77 | 6.2%(+2.60)#6,024 |
| 78. | Branchville | 8.7% | 7.4%(+1.29)#78 | 6.2%(+2.51)#6,176 |
| 79. | Westport | 8.7% | 7.4%(+1.27)#79 | 6.2%(+2.49)#6,198 |
| 80. | Putnam | 8.4% | 7.4%(+0.960)#80 | 6.2%(+2.18)#6,682 |
| 81. | West Cornwall | 8.3% | 7.4%(+0.928)#81 | 6.2%(+2.15)#6,768 |
| 82. | Wilton Center | 8.3% | 7.4%(+0.909)#82 | 6.2%(+2.13)#6,787 |
| 83. | Stepney | 8.2% | 7.4%(+0.767)#83 | 6.2%(+1.99)#7,024 |
| 84. | Inglenook | 8.1% | 7.4%(+0.734)#84 | 6.2%(+1.96)#7,093 |
| 85. | Broad Brook | 8.0% | 7.4%(+0.597)#85 | 6.2%(+1.82)#7,340 |
| 86. | Naugatuck Borough | 8.0% | 7.4%(+0.592)#86 | 6.2%(+1.81)#7,365 |
| 87. | Canaan | 7.9% | 7.4%(+0.540)#87 | 6.2%(+1.76)#7,454 |
| 88. | Sandy Hook | 7.9% | 7.4%(+0.505)#88 | 6.2%(+1.73)#7,524 |
| 89. | Durham | 7.9% | 7.4%(+0.491)#89 | 6.2%(+1.71)#7,548 |
| 90. | Milford City Balance | 7.9% | 7.4%(+0.483)#90 | 6.2%(+1.70)#7,566 |
| 91. | Mill Plain | 7.8% | 7.4%(+0.414)#91 | 6.2%(+1.64)#7,702 |
| 92. | Old Saybrook Center | 7.6% | 7.4%(+0.192)#92 | 6.2%(+1.41)#8,148 |
| 93. | New London | 7.6% | 7.4%(+0.191)#93 | 6.2%(+1.41)#8,149 |
| 94. | Southwood Acres | 7.5% | 7.4%(+0.046)#94 | 6.2%(+1.27)#8,471 |
| 95. | Ball Pond | 7.4% | 7.4%(+0.034)#95 | 6.2%(+1.26)#8,493 |
| 96. | Watertown | 7.4% | 7.4%(+0.029)#96 | 6.2%(+1.25)#8,511 |
| 97. | Thompsonville | 7.4% | 7.4%(-0.011)#97 | 6.2%(+1.21)#8,598 |
| 98. | Long Hill | 7.4% | 7.4%(-0.049)#98 | 6.2%(+1.17)#8,672 |
| 99. | Georgetown | 7.3% | 7.4%(-0.076)#99 | 6.2%(+1.15)#8,715 |
| 100. | Chester Center | 7.2% | 7.4%(-0.162)#100 | 6.2%(+1.06)#8,901 |
Common Questions
What are the Top 10 Cities with the Highest Percentage of Population Employed in Education Instruction & Library in Connecticut?
Top 10 Cities with the Highest Percentage of Population Employed in Education Instruction & Library in Connecticut are:
#1
36.8%
#2
28.7%
#3
16.7%
#4
16.5%
#5
15.8%
#6
15.7%
#7
15.7%
#8
14.4%
#9
13.9%
#10
13.4%
What city has the Highest Percentage of Population Employed in Education Instruction & Library in Connecticut?
Mansfield Center has the Highest Percentage of Population Employed in Education Instruction & Library in Connecticut with 36.8%.
What is the Percentage of Population Employed in Education Instruction & Library in the State of Connecticut?
Percentage of Population Employed in Education Instruction & Library in Connecticut is 7.4%.
What is the Percentage of Population Employed in Education Instruction & Library in the United States?
Percentage of Population Employed in Education Instruction & Library in the United States is 6.2%.