Cities with the Highest Percentage of Population Employed in Education Instruction & Library in Pennsylvania
RELATED REPORTS & OPTIONS
Education Instruction & Library
Pennsylvania
Compare Cities
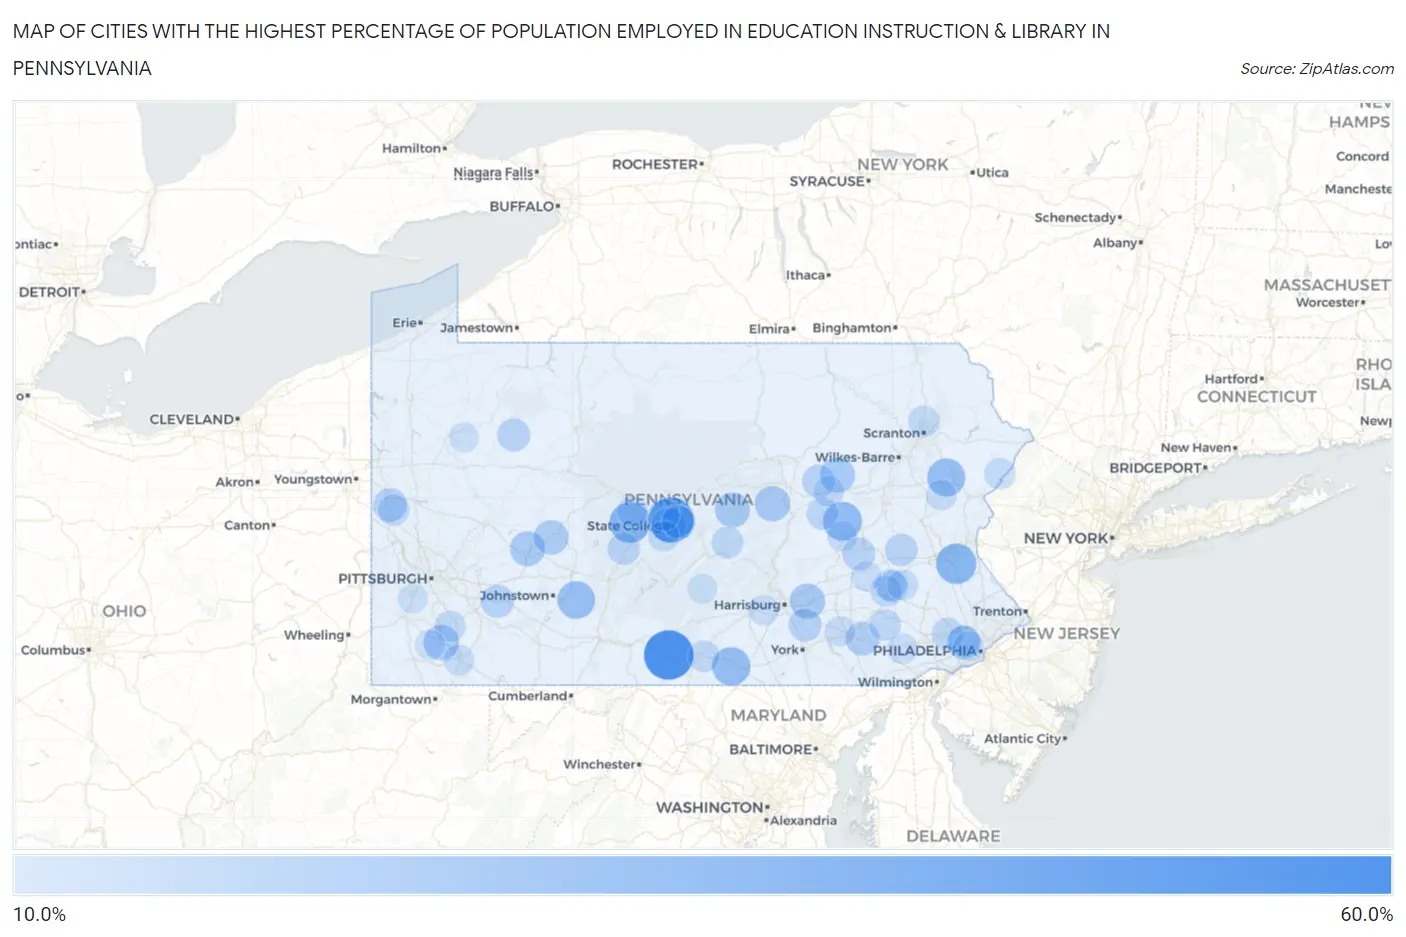
Map of Cities with the Highest Percentage of Population Employed in Education Instruction & Library in Pennsylvania
0.0%
60.0%
Cities with the Highest Percentage of Population Employed in Education Instruction & Library in Pennsylvania
| City | % Employed | vs State | vs National | |
| 1. | Fort Loudon | 58.4% | 6.2%(+52.2)#1 | 6.2%(+52.2)#55 |
| 2. | Green Hills Borough | 50.0% | 6.2%(+43.8)#2 | 6.2%(+43.8)#100 |
| 3. | Toftrees | 48.4% | 6.2%(+42.2)#3 | 6.2%(+42.2)#106 |
| 4. | Sandy Ridge | 37.7% | 6.2%(+31.6)#4 | 6.2%(+31.6)#192 |
| 5. | Franklin Forge | 37.5% | 6.2%(+31.3)#5 | 6.2%(+31.3)#202 |
| 6. | Desales University | 36.6% | 6.2%(+30.4)#6 | 6.2%(+30.4)#216 |
| 7. | Shellytown | 35.3% | 6.2%(+29.1)#7 | 6.2%(+29.1)#235 |
| 8. | Wilburton Number Two | 33.3% | 6.2%(+27.2)#8 | 6.2%(+27.1)#264 |
| 9. | Orrtanna | 31.8% | 6.2%(+25.6)#9 | 6.2%(+25.6)#292 |
| 10. | Pocono Pines | 31.3% | 6.2%(+25.2)#10 | 6.2%(+25.1)#301 |
| 11. | Armagh Borough | 31.1% | 6.2%(+24.9)#11 | 6.2%(+24.9)#308 |
| 12. | Dunlo | 30.6% | 6.2%(+24.5)#12 | 6.2%(+24.5)#320 |
| 13. | Birmingham Borough | 29.0% | 6.2%(+22.9)#13 | 6.2%(+22.8)#355 |
| 14. | New Boston | 27.4% | 6.2%(+21.2)#14 | 6.2%(+21.2)#405 |
| 15. | Wopsononock | 27.1% | 6.2%(+20.9)#15 | 6.2%(+20.9)#417 |
| 16. | Coal Center Borough | 27.1% | 6.2%(+20.9)#16 | 6.2%(+20.9)#419 |
| 17. | Hiller | 25.6% | 6.2%(+19.4)#17 | 6.2%(+19.4)#479 |
| 18. | Vicksburg | 25.3% | 6.2%(+19.1)#18 | 6.2%(+19.1)#486 |
| 19. | Union Deposit | 25.1% | 6.2%(+18.9)#19 | 6.2%(+18.9)#491 |
| 20. | State College Borough | 24.9% | 6.2%(+18.8)#20 | 6.2%(+18.7)#507 |
| 21. | Rohrsburg | 24.6% | 6.2%(+18.5)#21 | 6.2%(+18.5)#517 |
| 22. | Chevy Chase Heights | 24.4% | 6.2%(+18.2)#22 | 6.2%(+18.2)#527 |
| 23. | Woodward | 24.3% | 6.2%(+18.2)#23 | 6.2%(+18.1)#531 |
| 24. | Commodore | 24.3% | 6.2%(+18.1)#24 | 6.2%(+18.1)#534 |
| 25. | Westmont Borough | 24.1% | 6.2%(+17.9)#25 | 6.2%(+17.9)#542 |
| 26. | Park Forest Village | 23.8% | 6.2%(+17.6)#26 | 6.2%(+17.6)#557 |
| 27. | Morgan Hill | 23.0% | 6.2%(+16.9)#27 | 6.2%(+16.9)#610 |
| 28. | Lewisburg Borough | 22.6% | 6.2%(+16.4)#28 | 6.2%(+16.4)#643 |
| 29. | Orbisonia Borough | 22.2% | 6.2%(+16.1)#29 | 6.2%(+16.0)#668 |
| 30. | Smoketown | 22.1% | 6.2%(+15.9)#30 | 6.2%(+15.9)#679 |
| 31. | Carlisle Barracks | 22.1% | 6.2%(+15.9)#31 | 6.2%(+15.9)#680 |
| 32. | Haverford College | 22.0% | 6.2%(+15.9)#32 | 6.2%(+15.9)#684 |
| 33. | Sylvan Hills | 22.0% | 6.2%(+15.8)#33 | 6.2%(+15.8)#691 |
| 34. | Seven Valleys Borough | 21.9% | 6.2%(+15.8)#34 | 6.2%(+15.8)#695 |
| 35. | West Pittsburg | 21.2% | 6.2%(+15.1)#35 | 6.2%(+15.0)#746 |
| 36. | Mount Carbon Borough | 21.1% | 6.2%(+14.9)#36 | 6.2%(+14.9)#759 |
| 37. | Lemont | 21.0% | 6.2%(+14.8)#37 | 6.2%(+14.8)#762 |
| 38. | St Vincent College | 20.5% | 6.2%(+14.3)#38 | 6.2%(+14.3)#812 |
| 39. | Jerseytown | 20.3% | 6.2%(+14.1)#39 | 6.2%(+14.1)#828 |
| 40. | Falmouth | 19.8% | 6.2%(+13.7)#40 | 6.2%(+13.7)#870 |
| 41. | Friedensburg | 19.7% | 6.2%(+13.6)#41 | 6.2%(+13.6)#878 |
| 42. | Crown | 19.7% | 6.2%(+13.6)#42 | 6.2%(+13.6)#880 |
| 43. | Landingville Borough | 19.6% | 6.2%(+13.4)#43 | 6.2%(+13.4)#901 |
| 44. | Kempton | 19.0% | 6.2%(+12.9)#44 | 6.2%(+12.9)#961 |
| 45. | Shelocta Borough | 19.0% | 6.2%(+12.9)#45 | 6.2%(+12.9)#964 |
| 46. | Houserville | 18.9% | 6.2%(+12.8)#46 | 6.2%(+12.7)#977 |
| 47. | Dauphin Borough | 18.8% | 6.2%(+12.7)#47 | 6.2%(+12.6)#985 |
| 48. | Eldorado | 18.7% | 6.2%(+12.5)#48 | 6.2%(+12.5)#999 |
| 49. | Tipton | 18.4% | 6.2%(+12.2)#49 | 6.2%(+12.2)#1,036 |
| 50. | Elysburg | 17.8% | 6.2%(+11.6)#50 | 6.2%(+11.6)#1,119 |
| 51. | Edinboro Borough | 17.5% | 6.2%(+11.3)#51 | 6.2%(+11.3)#1,158 |
| 52. | Wagner | 17.5% | 6.2%(+11.3)#52 | 6.2%(+11.3)#1,161 |
| 53. | Goodville | 17.3% | 6.2%(+11.2)#53 | 6.2%(+11.1)#1,183 |
| 54. | Fox Chase | 17.1% | 6.2%(+11.0)#54 | 6.2%(+11.0)#1,222 |
| 55. | Applewold Borough | 17.1% | 6.2%(+10.9)#55 | 6.2%(+10.9)#1,232 |
| 56. | Port Allegany Borough | 17.1% | 6.2%(+10.9)#56 | 6.2%(+10.9)#1,236 |
| 57. | Lenhartsville Borough | 17.1% | 6.2%(+10.9)#57 | 6.2%(+10.9)#1,238 |
| 58. | Chesterbrook | 17.1% | 6.2%(+10.9)#58 | 6.2%(+10.9)#1,240 |
| 59. | Guilford | 17.0% | 6.2%(+10.8)#59 | 6.2%(+10.8)#1,257 |
| 60. | Muhlenberg Park | 16.9% | 6.2%(+10.7)#60 | 6.2%(+10.7)#1,278 |
| 61. | Chewton | 16.8% | 6.2%(+10.6)#61 | 6.2%(+10.6)#1,290 |
| 62. | Chinchilla | 16.8% | 6.2%(+10.6)#62 | 6.2%(+10.6)#1,291 |
| 63. | Juniata Gap | 16.7% | 6.2%(+10.6)#63 | 6.2%(+10.5)#1,297 |
| 64. | Spring Ridge | 16.7% | 6.2%(+10.5)#64 | 6.2%(+10.5)#1,298 |
| 65. | Rose Valley Borough | 16.7% | 6.2%(+10.5)#65 | 6.2%(+10.5)#1,305 |
| 66. | Julian | 16.7% | 6.2%(+10.5)#66 | 6.2%(+10.5)#1,317 |
| 67. | Bryn Mawr | 16.6% | 6.2%(+10.5)#67 | 6.2%(+10.5)#1,336 |
| 68. | Pine Ridge | 16.5% | 6.2%(+10.3)#68 | 6.2%(+10.3)#1,367 |
| 69. | Mayfield Borough | 16.5% | 6.2%(+10.3)#69 | 6.2%(+10.3)#1,372 |
| 70. | Mckinley | 16.3% | 6.2%(+10.1)#70 | 6.2%(+10.1)#1,399 |
| 71. | Chestnut Hill | 16.1% | 6.2%(+9.98)#71 | 6.2%(+9.96)#1,432 |
| 72. | Runville | 16.1% | 6.2%(+9.92)#72 | 6.2%(+9.91)#1,447 |
| 73. | Arnold City | 15.8% | 6.2%(+9.66)#73 | 6.2%(+9.65)#1,511 |
| 74. | Swarthmore Borough | 15.8% | 6.2%(+9.64)#74 | 6.2%(+9.62)#1,516 |
| 75. | Elkins Park | 15.7% | 6.2%(+9.48)#75 | 6.2%(+9.47)#1,544 |
| 76. | Buckhorn | 15.5% | 6.2%(+9.33)#76 | 6.2%(+9.32)#1,587 |
| 77. | Ramblewood | 15.5% | 6.2%(+9.32)#77 | 6.2%(+9.31)#1,589 |
| 78. | Pinecroft | 15.4% | 6.2%(+9.19)#78 | 6.2%(+9.18)#1,629 |
| 79. | Alsace Manor | 15.3% | 6.2%(+9.11)#79 | 6.2%(+9.09)#1,648 |
| 80. | South Uniontown | 15.1% | 6.2%(+8.94)#80 | 6.2%(+8.93)#1,689 |
| 81. | South Philipsburg | 14.8% | 6.2%(+8.64)#81 | 6.2%(+8.63)#1,760 |
| 82. | Indian Mountain Lake | 14.8% | 6.2%(+8.59)#82 | 6.2%(+8.57)#1,773 |
| 83. | Mapleton Borough | 14.7% | 6.2%(+8.52)#83 | 6.2%(+8.51)#1,796 |
| 84. | Landisville | 14.6% | 6.2%(+8.46)#84 | 6.2%(+8.45)#1,802 |
| 85. | New Kingstown | 14.5% | 6.2%(+8.36)#85 | 6.2%(+8.34)#1,831 |
| 86. | Beurys Lake | 14.3% | 6.2%(+8.12)#86 | 6.2%(+8.10)#1,930 |
| 87. | Westwood | 14.2% | 6.2%(+8.05)#87 | 6.2%(+8.03)#1,964 |
| 88. | Bethany Borough | 14.1% | 6.2%(+7.97)#88 | 6.2%(+7.96)#1,985 |
| 89. | East Rochester Borough | 14.1% | 6.2%(+7.90)#89 | 6.2%(+7.89)#2,010 |
| 90. | Gettysburg Borough | 14.0% | 6.2%(+7.84)#90 | 6.2%(+7.83)#2,035 |
| 91. | New Schaefferstown | 14.0% | 6.2%(+7.83)#91 | 6.2%(+7.82)#2,038 |
| 92. | Penn Wynne | 14.0% | 6.2%(+7.82)#92 | 6.2%(+7.81)#2,041 |
| 93. | Selinsgrove Borough | 14.0% | 6.2%(+7.80)#93 | 6.2%(+7.79)#2,045 |
| 94. | Skelp | 13.9% | 6.2%(+7.75)#94 | 6.2%(+7.74)#2,059 |
| 95. | Saltillo Borough | 13.6% | 6.2%(+7.43)#95 | 6.2%(+7.41)#2,182 |
| 96. | East Waterford | 13.6% | 6.2%(+7.39)#96 | 6.2%(+7.38)#2,196 |
| 97. | Rosemont | 13.5% | 6.2%(+7.36)#97 | 6.2%(+7.35)#2,206 |
| 98. | Hendersonville | 13.4% | 6.2%(+7.26)#98 | 6.2%(+7.25)#2,247 |
| 99. | Millsboro | 13.4% | 6.2%(+7.24)#99 | 6.2%(+7.23)#2,256 |
| 100. | Seneca | 13.4% | 6.2%(+7.24)#100 | 6.2%(+7.22)#2,257 |
Common Questions
What are the Top 10 Cities with the Highest Percentage of Population Employed in Education Instruction & Library in Pennsylvania?
Top 10 Cities with the Highest Percentage of Population Employed in Education Instruction & Library in Pennsylvania are:
#1
58.4%
#2
48.4%
#3
37.7%
#4
36.6%
#5
33.3%
#6
31.8%
#7
31.3%
#8
30.6%
#9
25.6%
#10
25.3%
What city has the Highest Percentage of Population Employed in Education Instruction & Library in Pennsylvania?
Fort Loudon has the Highest Percentage of Population Employed in Education Instruction & Library in Pennsylvania with 58.4%.
What is the Percentage of Population Employed in Education Instruction & Library in the State of Pennsylvania?
Percentage of Population Employed in Education Instruction & Library in Pennsylvania is 6.2%.
What is the Percentage of Population Employed in Education Instruction & Library in the United States?
Percentage of Population Employed in Education Instruction & Library in the United States is 6.2%.