Cities with the Highest Percentage of Population Employed in Education Instruction & Library in Illinois
RELATED REPORTS & OPTIONS
Education Instruction & Library
Illinois
Compare Cities
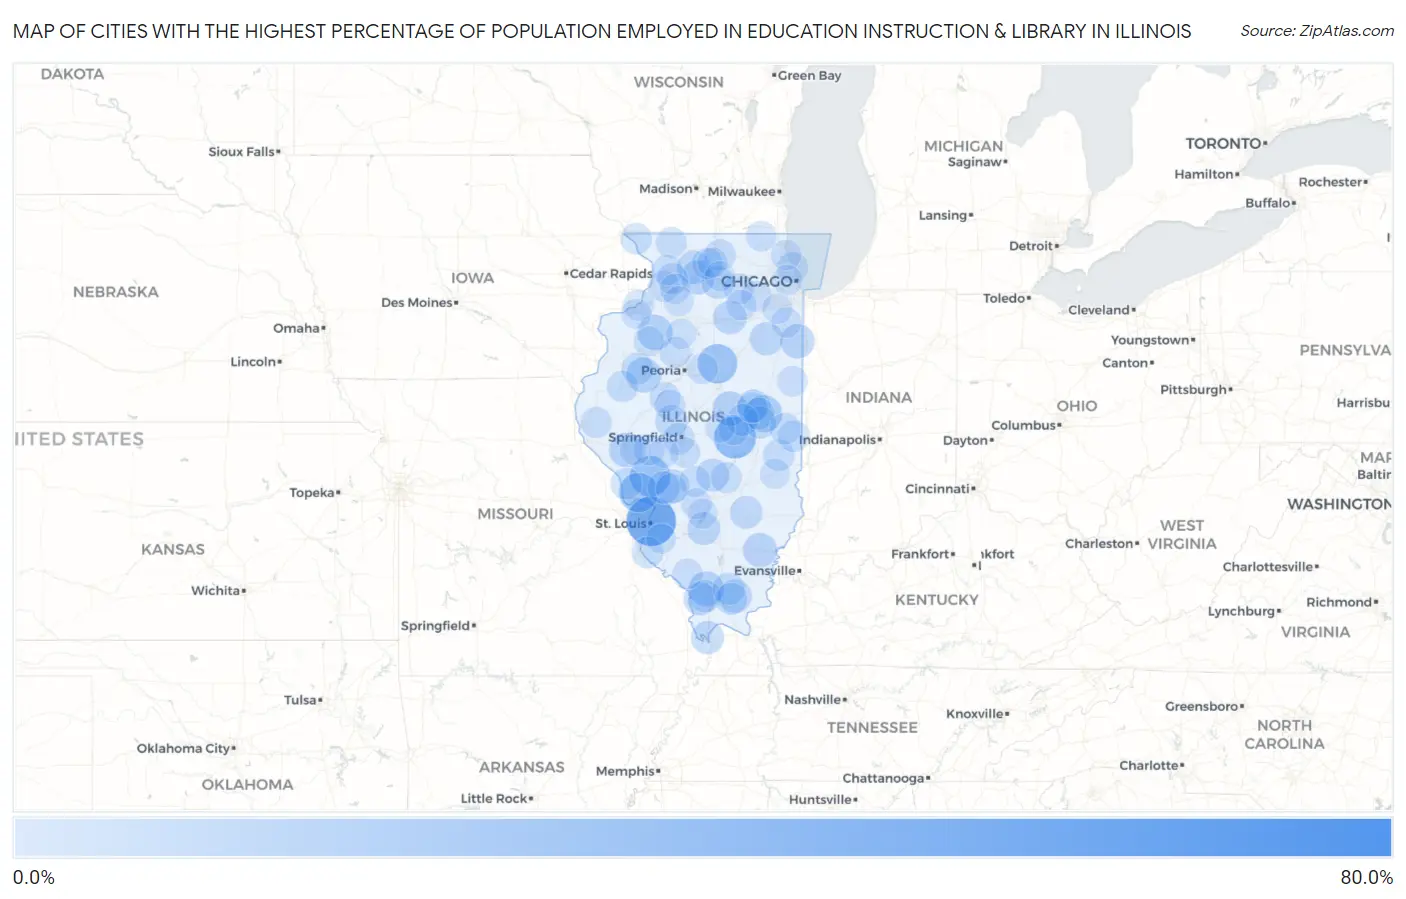
Map of Cities with the Highest Percentage of Population Employed in Education Instruction & Library in Illinois
0.0%
80.0%
Cities with the Highest Percentage of Population Employed in Education Instruction & Library in Illinois
| City | % Employed | vs State | vs National | |
| 1. | Unity | 69.0% | 6.3%(+62.7)#1 | 6.2%(+62.8)#36 |
| 2. | Swedona | 58.3% | 6.3%(+52.0)#2 | 6.2%(+52.1)#56 |
| 3. | Brooklyn | 51.5% | 6.3%(+45.2)#3 | 6.2%(+45.3)#83 |
| 4. | Taylor Ridge | 36.2% | 6.3%(+29.9)#4 | 6.2%(+30.0)#221 |
| 5. | Laplace | 35.8% | 6.3%(+29.5)#5 | 6.2%(+29.6)#225 |
| 6. | Merritt | 35.3% | 6.3%(+29.0)#6 | 6.2%(+29.1)#237 |
| 7. | Rockbridge | 32.7% | 6.3%(+26.4)#7 | 6.2%(+26.5)#277 |
| 8. | Burton | 32.7% | 6.3%(+26.4)#8 | 6.2%(+26.5)#278 |
| 9. | Ophiem | 31.5% | 6.3%(+25.2)#9 | 6.2%(+25.3)#298 |
| 10. | Otterville | 30.0% | 6.3%(+23.7)#10 | 6.2%(+23.8)#336 |
| 11. | Panola | 30.0% | 6.3%(+23.7)#11 | 6.2%(+23.8)#337 |
| 12. | Cameron | 26.5% | 6.3%(+20.2)#12 | 6.2%(+20.3)#443 |
| 13. | Urbana | 24.7% | 6.3%(+18.4)#13 | 6.2%(+18.5)#516 |
| 14. | Bishop Hill | 21.8% | 6.3%(+15.5)#14 | 6.2%(+15.6)#708 |
| 15. | Ellisville | 21.1% | 6.3%(+14.8)#15 | 6.2%(+14.9)#757 |
| 16. | De Witt | 20.5% | 6.3%(+14.2)#16 | 6.2%(+14.3)#805 |
| 17. | Carbondale | 20.4% | 6.3%(+14.1)#17 | 6.2%(+14.2)#817 |
| 18. | Florence | 20.0% | 6.3%(+13.7)#18 | 6.2%(+13.8)#858 |
| 19. | Hopkins Park | 19.5% | 6.3%(+13.2)#19 | 6.2%(+13.3)#913 |
| 20. | Burnt Prairie | 19.0% | 6.3%(+12.7)#20 | 6.2%(+12.8)#973 |
| 21. | Lost Nation | 18.8% | 6.3%(+12.5)#21 | 6.2%(+12.7)#984 |
| 22. | Lowpoint | 18.8% | 6.3%(+12.5)#22 | 6.2%(+12.6)#993 |
| 23. | Plum Valley | 18.7% | 6.3%(+12.4)#23 | 6.2%(+12.5)#1,001 |
| 24. | Mount Morris | 18.0% | 6.3%(+11.7)#24 | 6.2%(+11.8)#1,081 |
| 25. | Stonefort | 17.8% | 6.3%(+11.5)#25 | 6.2%(+11.6)#1,115 |
| 26. | Dayton | 17.8% | 6.3%(+11.5)#26 | 6.2%(+11.6)#1,127 |
| 27. | East Gillespie | 17.7% | 6.3%(+11.4)#27 | 6.2%(+11.5)#1,132 |
| 28. | Lake Of The Woods | 17.6% | 6.3%(+11.3)#28 | 6.2%(+11.4)#1,144 |
| 29. | Argyle | 17.2% | 6.3%(+10.9)#29 | 6.2%(+11.1)#1,199 |
| 30. | Union Hill | 17.1% | 6.3%(+10.8)#30 | 6.2%(+11.0)#1,221 |
| 31. | Ridgefield | 17.1% | 6.3%(+10.8)#31 | 6.2%(+10.9)#1,237 |
| 32. | Alto Pass | 17.0% | 6.3%(+10.7)#32 | 6.2%(+10.9)#1,244 |
| 33. | Cairo | 16.9% | 6.3%(+10.6)#33 | 6.2%(+10.7)#1,270 |
| 34. | Hoffman | 16.5% | 6.3%(+10.2)#34 | 6.2%(+10.3)#1,369 |
| 35. | Oconee | 16.5% | 6.3%(+10.2)#35 | 6.2%(+10.3)#1,371 |
| 36. | Royal Lakes | 16.0% | 6.3%(+9.70)#36 | 6.2%(+9.82)#1,461 |
| 37. | Louisville | 15.9% | 6.3%(+9.63)#37 | 6.2%(+9.74)#1,481 |
| 38. | Makanda | 15.8% | 6.3%(+9.47)#38 | 6.2%(+9.58)#1,524 |
| 39. | Steward | 15.7% | 6.3%(+9.43)#39 | 6.2%(+9.55)#1,530 |
| 40. | Petersburg | 15.5% | 6.3%(+9.24)#40 | 6.2%(+9.35)#1,575 |
| 41. | Tolono | 15.1% | 6.3%(+8.82)#41 | 6.2%(+8.93)#1,686 |
| 42. | Crab Orchard | 15.0% | 6.3%(+8.74)#42 | 6.2%(+8.85)#1,704 |
| 43. | New Burnside | 14.7% | 6.3%(+8.41)#43 | 6.2%(+8.52)#1,788 |
| 44. | Champaign | 14.6% | 6.3%(+8.33)#44 | 6.2%(+8.44)#1,808 |
| 45. | Monticello | 14.5% | 6.3%(+8.16)#45 | 6.2%(+8.27)#1,850 |
| 46. | St Augustine | 14.3% | 6.3%(+7.99)#46 | 6.2%(+8.10)#1,924 |
| 47. | Maeystown | 14.3% | 6.3%(+7.99)#47 | 6.2%(+8.10)#1,931 |
| 48. | Leland Grove | 14.2% | 6.3%(+7.93)#48 | 6.2%(+8.04)#1,958 |
| 49. | Lawrence | 14.2% | 6.3%(+7.87)#49 | 6.2%(+7.98)#1,976 |
| 50. | Hardin | 13.9% | 6.3%(+7.65)#50 | 6.2%(+7.76)#2,052 |
| 51. | Kansas | 13.9% | 6.3%(+7.56)#51 | 6.2%(+7.67)#2,075 |
| 52. | Cherry Valley | 13.7% | 6.3%(+7.45)#52 | 6.2%(+7.56)#2,125 |
| 53. | Chrisman | 13.7% | 6.3%(+7.39)#53 | 6.2%(+7.50)#2,146 |
| 54. | Sidell | 13.6% | 6.3%(+7.31)#54 | 6.2%(+7.43)#2,172 |
| 55. | Macomb | 13.6% | 6.3%(+7.31)#55 | 6.2%(+7.42)#2,175 |
| 56. | Galena | 13.4% | 6.3%(+7.12)#56 | 6.2%(+7.23)#2,254 |
| 57. | Evanston | 13.4% | 6.3%(+7.08)#57 | 6.2%(+7.19)#2,270 |
| 58. | Stillman Valley | 13.4% | 6.3%(+7.06)#58 | 6.2%(+7.17)#2,276 |
| 59. | Cowden | 13.2% | 6.3%(+6.92)#59 | 6.2%(+7.03)#2,333 |
| 60. | Morrison | 13.1% | 6.3%(+6.76)#60 | 6.2%(+6.88)#2,391 |
| 61. | Irving | 13.0% | 6.3%(+6.75)#61 | 6.2%(+6.86)#2,398 |
| 62. | Columbus | 13.0% | 6.3%(+6.67)#62 | 6.2%(+6.78)#2,451 |
| 63. | Coleta | 12.8% | 6.3%(+6.49)#63 | 6.2%(+6.61)#2,533 |
| 64. | Princeville | 12.7% | 6.3%(+6.36)#64 | 6.2%(+6.47)#2,591 |
| 65. | Lena | 12.6% | 6.3%(+6.26)#65 | 6.2%(+6.37)#2,642 |
| 66. | Hinckley | 12.6% | 6.3%(+6.26)#66 | 6.2%(+6.37)#2,644 |
| 67. | Topeka | 12.5% | 6.3%(+6.20)#67 | 6.2%(+6.32)#2,688 |
| 68. | Hampton | 12.4% | 6.3%(+6.09)#68 | 6.2%(+6.20)#2,725 |
| 69. | Mount Clare | 12.4% | 6.3%(+6.08)#69 | 6.2%(+6.19)#2,736 |
| 70. | Easton | 12.4% | 6.3%(+6.08)#70 | 6.2%(+6.19)#2,737 |
| 71. | Oswego | 12.4% | 6.3%(+6.07)#71 | 6.2%(+6.19)#2,738 |
| 72. | Woodson | 12.4% | 6.3%(+6.06)#72 | 6.2%(+6.17)#2,745 |
| 73. | Winchester | 12.2% | 6.3%(+5.87)#73 | 6.2%(+5.98)#2,832 |
| 74. | Eureka | 12.2% | 6.3%(+5.86)#74 | 6.2%(+5.98)#2,838 |
| 75. | Wellington | 12.1% | 6.3%(+5.79)#75 | 6.2%(+5.90)#2,876 |
| 76. | Greenville | 11.9% | 6.3%(+5.61)#76 | 6.2%(+5.73)#2,962 |
| 77. | Campbell Hill | 11.9% | 6.3%(+5.61)#77 | 6.2%(+5.72)#2,968 |
| 78. | Peotone | 11.8% | 6.3%(+5.49)#78 | 6.2%(+5.60)#3,022 |
| 79. | Pawnee | 11.6% | 6.3%(+5.34)#79 | 6.2%(+5.46)#3,124 |
| 80. | Chadwick | 11.6% | 6.3%(+5.34)#80 | 6.2%(+5.45)#3,126 |
| 81. | Millington | 11.6% | 6.3%(+5.33)#81 | 6.2%(+5.44)#3,131 |
| 82. | Cerro Gordo | 11.6% | 6.3%(+5.32)#82 | 6.2%(+5.43)#3,141 |
| 83. | Spring Grove | 11.6% | 6.3%(+5.28)#83 | 6.2%(+5.39)#3,170 |
| 84. | Highwood | 11.5% | 6.3%(+5.18)#84 | 6.2%(+5.29)#3,235 |
| 85. | Mahomet | 11.4% | 6.3%(+5.11)#85 | 6.2%(+5.22)#3,288 |
| 86. | Casey | 11.4% | 6.3%(+5.07)#86 | 6.2%(+5.18)#3,318 |
| 87. | Preemption | 11.3% | 6.3%(+4.99)#87 | 6.2%(+5.11)#3,372 |
| 88. | Bradford | 11.3% | 6.3%(+4.98)#88 | 6.2%(+5.09)#3,394 |
| 89. | Oneida | 11.3% | 6.3%(+4.97)#89 | 6.2%(+5.08)#3,395 |
| 90. | Oak Park | 11.3% | 6.3%(+4.96)#90 | 6.2%(+5.07)#3,405 |
| 91. | Waverly | 11.2% | 6.3%(+4.94)#91 | 6.2%(+5.05)#3,422 |
| 92. | Como | 11.2% | 6.3%(+4.94)#92 | 6.2%(+5.05)#3,423 |
| 93. | Creston | 11.1% | 6.3%(+4.82)#93 | 6.2%(+4.93)#3,524 |
| 94. | Deer Grove | 11.1% | 6.3%(+4.82)#94 | 6.2%(+4.93)#3,546 |
| 95. | Keyesport | 11.1% | 6.3%(+4.76)#95 | 6.2%(+4.87)#3,576 |
| 96. | New Lenox | 11.1% | 6.3%(+4.76)#96 | 6.2%(+4.87)#3,577 |
| 97. | Davis Junction | 11.0% | 6.3%(+4.73)#97 | 6.2%(+4.84)#3,594 |
| 98. | Smithton | 11.0% | 6.3%(+4.73)#98 | 6.2%(+4.84)#3,600 |
| 99. | Forsyth | 11.0% | 6.3%(+4.72)#99 | 6.2%(+4.84)#3,605 |
| 100. | Coal Valley | 11.0% | 6.3%(+4.69)#100 | 6.2%(+4.81)#3,625 |
Common Questions
What are the Top 10 Cities with the Highest Percentage of Population Employed in Education Instruction & Library in Illinois?
Top 10 Cities with the Highest Percentage of Population Employed in Education Instruction & Library in Illinois are:
#1
51.5%
#2
35.8%
#3
32.7%
#4
30.0%
#5
30.0%
#6
24.7%
#7
21.8%
#8
21.1%
#9
20.5%
#10
20.4%
What city has the Highest Percentage of Population Employed in Education Instruction & Library in Illinois?
Brooklyn has the Highest Percentage of Population Employed in Education Instruction & Library in Illinois with 51.5%.
What is the Percentage of Population Employed in Education Instruction & Library in the State of Illinois?
Percentage of Population Employed in Education Instruction & Library in Illinois is 6.3%.
What is the Percentage of Population Employed in Education Instruction & Library in the United States?
Percentage of Population Employed in Education Instruction & Library in the United States is 6.2%.