Cities with the Highest Percentage of Population Employed in Education Instruction & Library in Oklahoma
RELATED REPORTS & OPTIONS
Education Instruction & Library
Oklahoma
Compare Cities
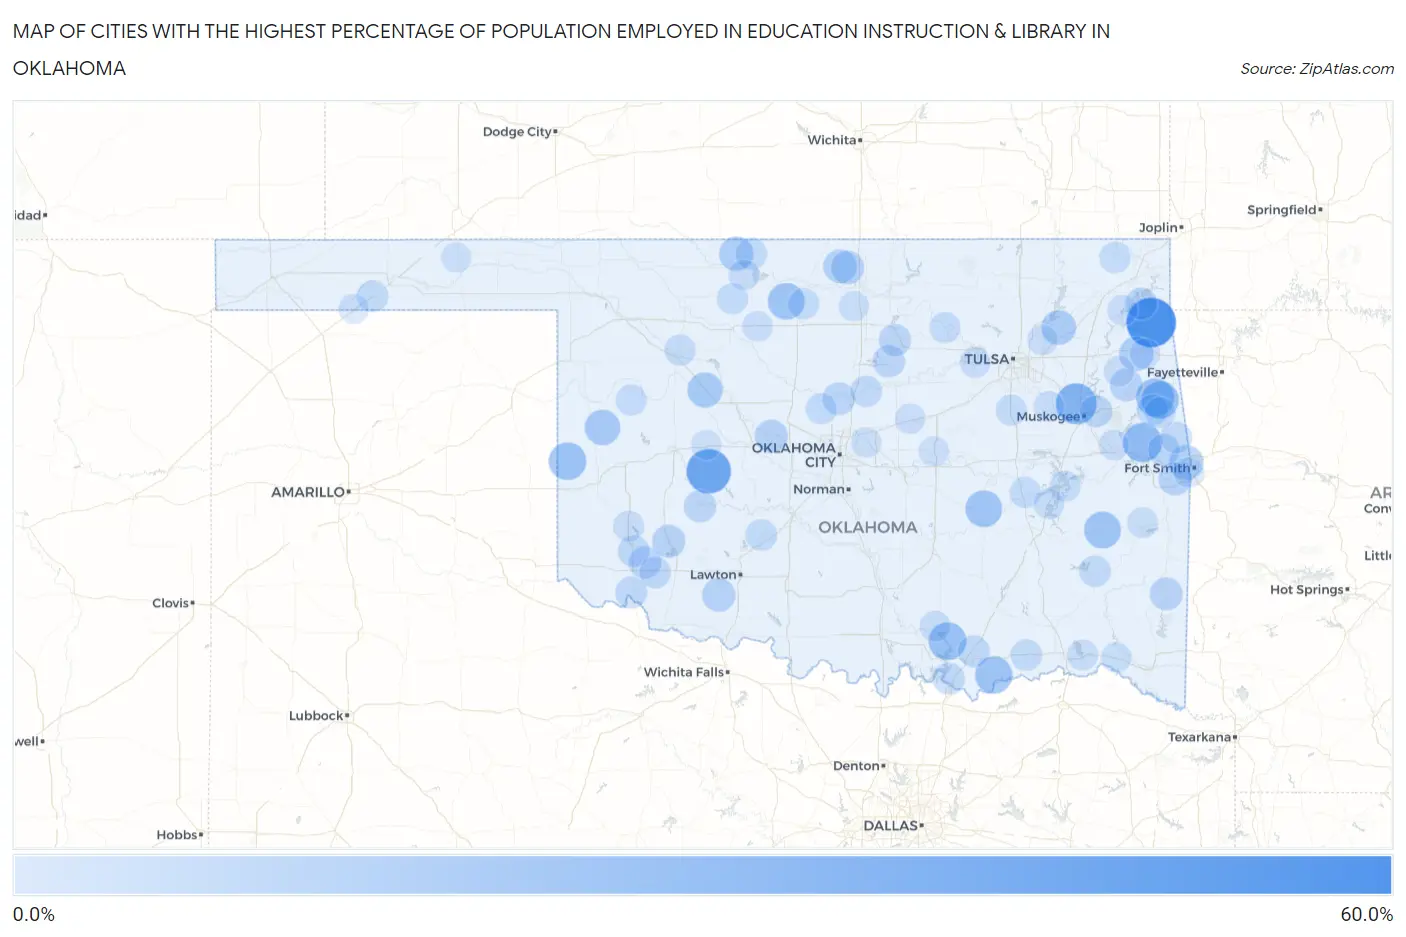
Map of Cities with the Highest Percentage of Population Employed in Education Instruction & Library in Oklahoma
0.0%
60.0%
Cities with the Highest Percentage of Population Employed in Education Instruction & Library in Oklahoma
| City | % Employed | vs State | vs National | |
| 1. | Brush Creek | 59.8% | 6.2%(+53.6)#1 | 6.2%(+53.6)#53 |
| 2. | Colony | 46.6% | 6.2%(+40.4)#2 | 6.2%(+40.4)#118 |
| 3. | Tullahassee | 37.5% | 6.2%(+31.3)#3 | 6.2%(+31.3)#199 |
| 4. | Reagan | 36.4% | 6.2%(+30.1)#4 | 6.2%(+30.2)#219 |
| 5. | Sand Point | 36.0% | 6.2%(+29.7)#5 | 6.2%(+29.8)#222 |
| 6. | Dwight Mission | 33.3% | 6.2%(+27.1)#6 | 6.2%(+27.1)#265 |
| 7. | Mcbride | 32.1% | 6.2%(+25.9)#7 | 6.2%(+26.0)#287 |
| 8. | Cave Spring | 31.0% | 6.2%(+24.7)#8 | 6.2%(+24.8)#313 |
| 9. | Titanic | 30.0% | 6.2%(+23.8)#9 | 6.2%(+23.8)#335 |
| 10. | Bee | 29.4% | 6.2%(+23.2)#10 | 6.2%(+23.2)#347 |
| 11. | Mulberry | 29.2% | 6.2%(+22.9)#11 | 6.2%(+23.0)#353 |
| 12. | Sweetwater | 28.8% | 6.2%(+22.5)#12 | 6.2%(+22.6)#361 |
| 13. | Albany | 28.0% | 6.2%(+21.8)#13 | 6.2%(+21.8)#391 |
| 14. | Panola | 27.3% | 6.2%(+21.0)#14 | 6.2%(+21.1)#412 |
| 15. | Hillsdale | 27.0% | 6.2%(+20.8)#15 | 6.2%(+20.8)#423 |
| 16. | Horntown | 26.7% | 6.2%(+20.4)#16 | 6.2%(+20.5)#434 |
| 17. | Emet | 25.0% | 6.2%(+18.8)#17 | 6.2%(+18.8)#501 |
| 18. | Strong City | 23.8% | 6.2%(+17.6)#18 | 6.2%(+17.6)#561 |
| 19. | Bug Tussle | 23.6% | 6.2%(+17.4)#19 | 6.2%(+17.4)#569 |
| 20. | Oakwood | 22.9% | 6.2%(+16.6)#20 | 6.2%(+16.7)#624 |
| 21. | Oak Hill-Piney | 22.6% | 6.2%(+16.3)#21 | 6.2%(+16.4)#641 |
| 22. | Sequoyah | 21.9% | 6.2%(+15.6)#22 | 6.2%(+15.7)#699 |
| 23. | Moffett | 21.1% | 6.2%(+14.8)#23 | 6.2%(+14.9)#758 |
| 24. | Burlington | 21.0% | 6.2%(+14.7)#24 | 6.2%(+14.8)#765 |
| 25. | Leach | 20.9% | 6.2%(+14.7)#25 | 6.2%(+14.7)#768 |
| 26. | Hough | 19.2% | 6.2%(+13.0)#26 | 6.2%(+13.0)#942 |
| 27. | Preston | 19.0% | 6.2%(+12.8)#27 | 6.2%(+12.9)#958 |
| 28. | Deer Creek | 18.9% | 6.2%(+12.7)#28 | 6.2%(+12.7)#978 |
| 29. | Faxon | 18.5% | 6.2%(+12.3)#29 | 6.2%(+12.3)#1,018 |
| 30. | Nardin | 18.5% | 6.2%(+12.2)#30 | 6.2%(+12.3)#1,025 |
| 31. | Chance | 18.4% | 6.2%(+12.2)#31 | 6.2%(+12.2)#1,030 |
| 32. | Roosevelt | 18.0% | 6.2%(+11.8)#32 | 6.2%(+11.8)#1,084 |
| 33. | Calumet | 17.8% | 6.2%(+11.5)#33 | 6.2%(+11.6)#1,120 |
| 34. | Fort Coffee | 17.6% | 6.2%(+11.4)#34 | 6.2%(+11.5)#1,136 |
| 35. | Smithville | 17.3% | 6.2%(+11.1)#35 | 6.2%(+11.1)#1,188 |
| 36. | Grandview | 17.1% | 6.2%(+10.8)#36 | 6.2%(+10.9)#1,243 |
| 37. | Friendship | 16.7% | 6.2%(+10.4)#37 | 6.2%(+10.5)#1,335 |
| 38. | Cedar Valley | 16.6% | 6.2%(+10.3)#38 | 6.2%(+10.4)#1,350 |
| 39. | Stillwater | 16.0% | 6.2%(+9.76)#39 | 6.2%(+9.81)#1,470 |
| 40. | Mountain View | 15.9% | 6.2%(+9.68)#40 | 6.2%(+9.73)#1,484 |
| 41. | Morrison | 15.7% | 6.2%(+9.50)#41 | 6.2%(+9.55)#1,529 |
| 42. | Akins | 15.5% | 6.2%(+9.28)#42 | 6.2%(+9.33)#1,581 |
| 43. | Fort Gibson | 15.3% | 6.2%(+9.06)#43 | 6.2%(+9.11)#1,643 |
| 44. | Dennis | 15.2% | 6.2%(+8.95)#44 | 6.2%(+9.01)#1,672 |
| 45. | Blair | 15.1% | 6.2%(+8.89)#45 | 6.2%(+8.95)#1,683 |
| 46. | Cartwright | 15.1% | 6.2%(+8.84)#46 | 6.2%(+8.89)#1,696 |
| 47. | Elmer | 15.0% | 6.2%(+8.76)#47 | 6.2%(+8.82)#1,714 |
| 48. | Armstrong | 14.9% | 6.2%(+8.66)#48 | 6.2%(+8.71)#1,740 |
| 49. | Headrick | 14.7% | 6.2%(+8.47)#49 | 6.2%(+8.52)#1,790 |
| 50. | Tuskahoma | 14.3% | 6.2%(+8.05)#50 | 6.2%(+8.10)#1,934 |
| 51. | Byron | 14.3% | 6.2%(+8.05)#51 | 6.2%(+8.10)#1,946 |
| 52. | Cyril | 14.2% | 6.2%(+7.99)#52 | 6.2%(+8.05)#1,955 |
| 53. | Barber | 14.2% | 6.2%(+7.96)#53 | 6.2%(+8.01)#1,969 |
| 54. | Nicut | 14.2% | 6.2%(+7.91)#54 | 6.2%(+7.97)#1,981 |
| 55. | Boswell | 14.0% | 6.2%(+7.72)#55 | 6.2%(+7.77)#2,048 |
| 56. | Goodwell | 13.9% | 6.2%(+7.63)#56 | 6.2%(+7.69)#2,069 |
| 57. | Rocky Mountain | 13.8% | 6.2%(+7.56)#57 | 6.2%(+7.61)#2,103 |
| 58. | Cumberland | 13.8% | 6.2%(+7.52)#58 | 6.2%(+7.57)#2,119 |
| 59. | Langston | 13.7% | 6.2%(+7.44)#59 | 6.2%(+7.50)#2,148 |
| 60. | Welch | 13.5% | 6.2%(+7.25)#60 | 6.2%(+7.30)#2,221 |
| 61. | Cashion | 13.4% | 6.2%(+7.19)#61 | 6.2%(+7.25)#2,248 |
| 62. | Leedey | 13.4% | 6.2%(+7.18)#62 | 6.2%(+7.24)#2,253 |
| 63. | Beggs | 13.4% | 6.2%(+7.11)#63 | 6.2%(+7.17)#2,278 |
| 64. | Kremlin | 13.3% | 6.2%(+7.10)#64 | 6.2%(+7.15)#2,291 |
| 65. | Chester | 13.3% | 6.2%(+7.10)#65 | 6.2%(+7.15)#2,296 |
| 66. | Carmen | 13.2% | 6.2%(+6.94)#66 | 6.2%(+6.99)#2,351 |
| 67. | Bentley | 13.2% | 6.2%(+6.92)#67 | 6.2%(+6.97)#2,357 |
| 68. | Briartown | 13.0% | 6.2%(+6.81)#68 | 6.2%(+6.86)#2,406 |
| 69. | Hanna | 13.0% | 6.2%(+6.81)#69 | 6.2%(+6.86)#2,409 |
| 70. | Blackburn | 12.9% | 6.2%(+6.67)#70 | 6.2%(+6.72)#2,481 |
| 71. | Caney Ridge | 12.8% | 6.2%(+6.58)#71 | 6.2%(+6.64)#2,522 |
| 72. | Lyons Switch | 12.8% | 6.2%(+6.52)#72 | 6.2%(+6.57)#2,546 |
| 73. | Longtown | 12.6% | 6.2%(+6.39)#73 | 6.2%(+6.44)#2,605 |
| 74. | Granite | 12.6% | 6.2%(+6.35)#74 | 6.2%(+6.40)#2,631 |
| 75. | Tishomingo | 12.4% | 6.2%(+6.14)#75 | 6.2%(+6.19)#2,732 |
| 76. | Milfay | 12.2% | 6.2%(+6.01)#76 | 6.2%(+6.06)#2,795 |
| 77. | Sawyer | 12.1% | 6.2%(+5.90)#77 | 6.2%(+5.96)#2,843 |
| 78. | Crowder | 12.0% | 6.2%(+5.73)#78 | 6.2%(+5.79)#2,932 |
| 79. | Fanshawe | 11.9% | 6.2%(+5.64)#79 | 6.2%(+5.70)#2,977 |
| 80. | Sunray | 11.8% | 6.2%(+5.53)#80 | 6.2%(+5.58)#3,032 |
| 81. | Ringwood | 11.7% | 6.2%(+5.44)#81 | 6.2%(+5.49)#3,093 |
| 82. | Haskell | 11.7% | 6.2%(+5.43)#82 | 6.2%(+5.48)#3,100 |
| 83. | Peggs | 11.6% | 6.2%(+5.37)#83 | 6.2%(+5.43)#3,146 |
| 84. | Grand Lake Towne | 11.5% | 6.2%(+5.30)#84 | 6.2%(+5.36)#3,189 |
| 85. | Cherokee | 11.4% | 6.2%(+5.19)#85 | 6.2%(+5.25)#3,262 |
| 86. | Twin Oaks | 11.4% | 6.2%(+5.19)#86 | 6.2%(+5.25)#3,266 |
| 87. | Gore | 11.4% | 6.2%(+5.14)#87 | 6.2%(+5.19)#3,304 |
| 88. | Chandler | 11.4% | 6.2%(+5.12)#88 | 6.2%(+5.17)#3,327 |
| 89. | Billings | 11.2% | 6.2%(+5.00)#89 | 6.2%(+5.06)#3,420 |
| 90. | Mannford | 11.2% | 6.2%(+4.99)#90 | 6.2%(+5.04)#3,438 |
| 91. | Valliant | 11.2% | 6.2%(+4.97)#91 | 6.2%(+5.02)#3,457 |
| 92. | Valley Park | 11.1% | 6.2%(+4.87)#92 | 6.2%(+4.93)#3,554 |
| 93. | Cookson | 11.1% | 6.2%(+4.83)#93 | 6.2%(+4.89)#3,567 |
| 94. | Prague | 11.0% | 6.2%(+4.80)#94 | 6.2%(+4.86)#3,587 |
| 95. | Arkoma | 11.0% | 6.2%(+4.72)#95 | 6.2%(+4.78)#3,646 |
| 96. | Turpin | 10.9% | 6.2%(+4.71)#96 | 6.2%(+4.77)#3,657 |
| 97. | Baron | 10.9% | 6.2%(+4.67)#97 | 6.2%(+4.73)#3,690 |
| 98. | Weatherford | 10.8% | 6.2%(+4.58)#98 | 6.2%(+4.63)#3,755 |
| 99. | Jones | 10.7% | 6.2%(+4.47)#99 | 6.2%(+4.53)#3,839 |
| 100. | Texhoma | 10.7% | 6.2%(+4.43)#100 | 6.2%(+4.48)#3,871 |
Common Questions
What are the Top 10 Cities with the Highest Percentage of Population Employed in Education Instruction & Library in Oklahoma?
Top 10 Cities with the Highest Percentage of Population Employed in Education Instruction & Library in Oklahoma are:
#1
59.8%
#2
46.6%
#3
37.5%
#4
33.3%
#5
30.0%
#6
29.4%
#7
29.2%
#8
28.8%
#9
28.0%
#10
27.3%
What city has the Highest Percentage of Population Employed in Education Instruction & Library in Oklahoma?
Brush Creek has the Highest Percentage of Population Employed in Education Instruction & Library in Oklahoma with 59.8%.
What is the Percentage of Population Employed in Education Instruction & Library in the State of Oklahoma?
Percentage of Population Employed in Education Instruction & Library in Oklahoma is 6.2%.
What is the Percentage of Population Employed in Education Instruction & Library in the United States?
Percentage of Population Employed in Education Instruction & Library in the United States is 6.2%.