Cities with the Highest Percentage of Population Employed in Education Instruction & Library in New Hampshire
RELATED REPORTS & OPTIONS
Education Instruction & Library
New Hampshire
Compare Cities
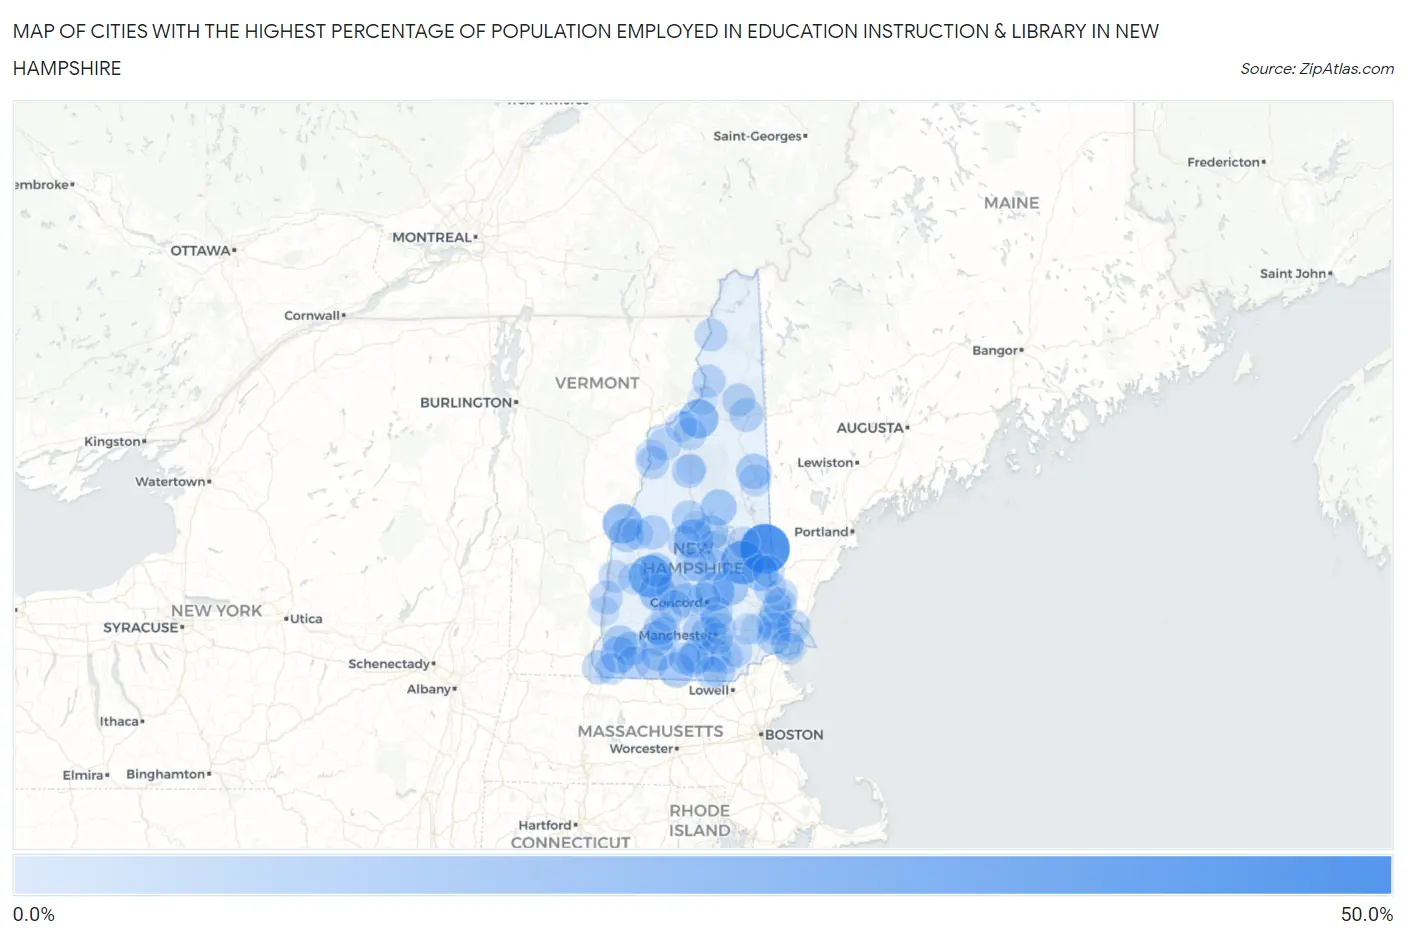
Map of Cities with the Highest Percentage of Population Employed in Education Instruction & Library in New Hampshire
0.0%
50.0%
Cities with the Highest Percentage of Population Employed in Education Instruction & Library in New Hampshire
| City | % Employed | vs State | vs National | |
| 1. | Sanbornville | 42.7% | 6.5%(+36.2)#1 | 6.2%(+36.5)#153 |
| 2. | Alton | 29.2% | 6.5%(+22.7)#2 | 6.2%(+23.0)#351 |
| 3. | Blodgett Landing | 26.7% | 6.5%(+20.2)#3 | 6.2%(+20.5)#436 |
| 4. | Hanover | 20.2% | 6.5%(+13.7)#4 | 6.2%(+14.1)#832 |
| 5. | Whitefield | 19.4% | 6.5%(+12.9)#5 | 6.2%(+13.2)#923 |
| 6. | Loudon | 18.7% | 6.5%(+12.2)#6 | 6.2%(+12.5)#1,002 |
| 7. | New Hampton | 18.5% | 6.5%(+12.0)#7 | 6.2%(+12.4)#1,016 |
| 8. | Bradford | 15.3% | 6.5%(+8.82)#8 | 6.2%(+9.14)#1,636 |
| 9. | Farmington | 14.3% | 6.5%(+7.76)#9 | 6.2%(+8.08)#1,948 |
| 10. | West Swanzey | 14.3% | 6.5%(+7.76)#10 | 6.2%(+8.07)#1,949 |
| 11. | Pittsfield | 12.9% | 6.5%(+6.40)#11 | 6.2%(+6.72)#2,476 |
| 12. | Center Sandwich | 12.7% | 6.5%(+6.23)#12 | 6.2%(+6.54)#2,563 |
| 13. | Francestown | 12.7% | 6.5%(+6.23)#13 | 6.2%(+6.54)#2,565 |
| 14. | Greenville | 11.4% | 6.5%(+4.87)#14 | 6.2%(+5.19)#3,309 |
| 15. | North Conway | 11.3% | 6.5%(+4.78)#15 | 6.2%(+5.09)#3,390 |
| 16. | Amherst | 11.1% | 6.5%(+4.61)#16 | 6.2%(+4.93)#3,522 |
| 17. | Peterborough | 10.6% | 6.5%(+4.13)#17 | 6.2%(+4.45)#3,901 |
| 18. | Warner | 10.6% | 6.5%(+4.09)#18 | 6.2%(+4.40)#3,937 |
| 19. | Pinardville | 10.3% | 6.5%(+3.80)#19 | 6.2%(+4.12)#4,187 |
| 20. | Goffstown | 10.3% | 6.5%(+3.80)#20 | 6.2%(+4.11)#4,193 |
| 21. | Keene | 10.2% | 6.5%(+3.70)#21 | 6.2%(+4.02)#4,290 |
| 22. | Lebanon | 10.1% | 6.5%(+3.59)#22 | 6.2%(+3.91)#4,410 |
| 23. | Meredith | 9.8% | 6.5%(+3.33)#23 | 6.2%(+3.65)#4,714 |
| 24. | Hancock | 9.8% | 6.5%(+3.30)#24 | 6.2%(+3.62)#4,752 |
| 25. | New London | 9.7% | 6.5%(+3.21)#25 | 6.2%(+3.53)#4,854 |
| 26. | East Merrimack | 9.5% | 6.5%(+2.96)#26 | 6.2%(+3.28)#5,138 |
| 27. | Marlborough | 9.4% | 6.5%(+2.86)#27 | 6.2%(+3.18)#5,249 |
| 28. | Canaan | 9.3% | 6.5%(+2.82)#28 | 6.2%(+3.14)#5,301 |
| 29. | Tilton Northfield | 9.3% | 6.5%(+2.80)#29 | 6.2%(+3.12)#5,323 |
| 30. | Contoocook | 9.0% | 6.5%(+2.51)#30 | 6.2%(+2.83)#5,707 |
| 31. | Newmarket | 8.7% | 6.5%(+2.20)#31 | 6.2%(+2.51)#6,159 |
| 32. | Durham | 8.6% | 6.5%(+2.05)#32 | 6.2%(+2.37)#6,392 |
| 33. | Plymouth | 8.4% | 6.5%(+1.92)#33 | 6.2%(+2.24)#6,584 |
| 34. | Milford | 8.2% | 6.5%(+1.71)#34 | 6.2%(+2.02)#6,956 |
| 35. | Bennington | 8.2% | 6.5%(+1.70)#35 | 6.2%(+2.01)#6,974 |
| 36. | Gorham | 8.1% | 6.5%(+1.61)#36 | 6.2%(+1.92)#7,167 |
| 37. | Exeter | 8.0% | 6.5%(+1.48)#37 | 6.2%(+1.80)#7,390 |
| 38. | Hinsdale | 7.8% | 6.5%(+1.32)#38 | 6.2%(+1.64)#7,701 |
| 39. | North Woodstock | 7.8% | 6.5%(+1.30)#39 | 6.2%(+1.62)#7,736 |
| 40. | Concord | 7.5% | 6.5%(+1.05)#40 | 6.2%(+1.37)#8,262 |
| 41. | Dover | 7.5% | 6.5%(+0.968)#41 | 6.2%(+1.29)#8,431 |
| 42. | Lisbon | 7.3% | 6.5%(+0.817)#42 | 6.2%(+1.13)#8,737 |
| 43. | Charlestown | 7.2% | 6.5%(+0.694)#43 | 6.2%(+1.01)#9,020 |
| 44. | Portsmouth | 7.1% | 6.5%(+0.594)#44 | 6.2%(+0.911)#9,240 |
| 45. | Groveton | 7.1% | 6.5%(+0.588)#45 | 6.2%(+0.905)#9,261 |
| 46. | Newfields | 7.0% | 6.5%(+0.517)#46 | 6.2%(+0.834)#9,412 |
| 47. | North Haverhill | 6.9% | 6.5%(+0.430)#47 | 6.2%(+0.747)#9,595 |
| 48. | Berlin | 6.9% | 6.5%(+0.385)#48 | 6.2%(+0.701)#9,702 |
| 49. | Suncook | 6.7% | 6.5%(+0.208)#49 | 6.2%(+0.525)#10,157 |
| 50. | Antrim | 6.6% | 6.5%(+0.126)#50 | 6.2%(+0.443)#10,401 |
| 51. | Troy | 6.5% | 6.5%(+0.001)#51 | 6.2%(+0.318)#10,748 |
| 52. | Londonderry | 6.4% | 6.5%(-0.137)#52 | 6.2%(+0.180)#11,132 |
| 53. | Colebrook | 6.3% | 6.5%(-0.174)#53 | 6.2%(+0.143)#11,250 |
| 54. | Hampton | 6.3% | 6.5%(-0.228)#54 | 6.2%(+0.089)#11,405 |
| 55. | Henniker | 6.1% | 6.5%(-0.431)#55 | 6.2%(-0.114)#12,020 |
| 56. | Somersworth | 6.0% | 6.5%(-0.504)#56 | 6.2%(-0.187)#12,236 |
| 57. | Bethlehem | 6.0% | 6.5%(-0.536)#57 | 6.2%(-0.219)#12,317 |
| 58. | Claremont | 5.9% | 6.5%(-0.596)#58 | 6.2%(-0.279)#12,461 |
| 59. | Wilton | 5.9% | 6.5%(-0.649)#59 | 6.2%(-0.332)#12,625 |
| 60. | Hudson | 5.7% | 6.5%(-0.835)#60 | 6.2%(-0.518)#13,155 |
| 61. | Laconia | 5.7% | 6.5%(-0.839)#61 | 6.2%(-0.522)#13,171 |
| 62. | Rochester | 5.6% | 6.5%(-0.864)#62 | 6.2%(-0.547)#13,264 |
| 63. | Bristol | 5.5% | 6.5%(-1.04)#63 | 6.2%(-0.725)#13,782 |
| 64. | Derry | 5.4% | 6.5%(-1.12)#64 | 6.2%(-0.804)#14,013 |
| 65. | Conway | 5.4% | 6.5%(-1.13)#65 | 6.2%(-0.816)#14,053 |
| 66. | Nashua | 5.2% | 6.5%(-1.28)#66 | 6.2%(-0.964)#14,500 |
| 67. | South Hooksett | 5.2% | 6.5%(-1.28)#67 | 6.2%(-0.966)#14,507 |
| 68. | Jaffrey | 5.1% | 6.5%(-1.38)#68 | 6.2%(-1.06)#14,772 |
| 69. | Manchester | 4.8% | 6.5%(-1.74)#69 | 6.2%(-1.43)#15,936 |
| 70. | Littleton | 4.6% | 6.5%(-1.93)#70 | 6.2%(-1.62)#16,485 |
| 71. | Belmont | 4.5% | 6.5%(-1.98)#71 | 6.2%(-1.66)#16,621 |
| 72. | Franklin | 4.5% | 6.5%(-2.01)#72 | 6.2%(-1.69)#16,752 |
| 73. | Milton | 4.4% | 6.5%(-2.13)#73 | 6.2%(-1.82)#17,129 |
| 74. | Wolfeboro | 4.2% | 6.5%(-2.31)#74 | 6.2%(-1.99)#17,689 |
| 75. | Winchester | 4.2% | 6.5%(-2.33)#75 | 6.2%(-2.02)#17,748 |
| 76. | Enfield | 3.8% | 6.5%(-2.71)#76 | 6.2%(-2.40)#18,856 |
| 77. | Woodsville | 3.7% | 6.5%(-2.79)#77 | 6.2%(-2.47)#19,036 |
| 78. | Hooksett | 3.5% | 6.5%(-3.00)#78 | 6.2%(-2.68)#19,595 |
| 79. | Newport | 3.4% | 6.5%(-3.05)#79 | 6.2%(-2.74)#19,787 |
| 80. | Epping | 3.3% | 6.5%(-3.24)#80 | 6.2%(-2.92)#20,266 |
| 81. | Raymond | 3.2% | 6.5%(-3.34)#81 | 6.2%(-3.02)#20,518 |
| 82. | Hampton Beach | 2.9% | 6.5%(-3.62)#82 | 6.2%(-3.31)#21,193 |
| 83. | Hillsborough | 2.8% | 6.5%(-3.67)#83 | 6.2%(-3.36)#21,315 |
| 84. | North Walpole | 2.0% | 6.5%(-4.53)#84 | 6.2%(-4.21)#23,148 |
| 85. | Ashland | 1.9% | 6.5%(-4.65)#85 | 6.2%(-4.33)#23,353 |
| 86. | Lincoln | 1.5% | 6.5%(-4.97)#86 | 6.2%(-4.65)#23,877 |
| 87. | Lancaster | 0.90% | 6.5%(-5.60)#87 | 6.2%(-5.28)#24,712 |
1
Common Questions
What are the Top 10 Cities with the Highest Percentage of Population Employed in Education Instruction & Library in New Hampshire?
Top 10 Cities with the Highest Percentage of Population Employed in Education Instruction & Library in New Hampshire are:
#1
42.7%
#2
29.2%
#3
26.7%
#4
20.2%
#5
19.4%
#6
18.7%
#7
18.5%
#8
15.3%
#9
14.3%
#10
14.3%
What city has the Highest Percentage of Population Employed in Education Instruction & Library in New Hampshire?
Sanbornville has the Highest Percentage of Population Employed in Education Instruction & Library in New Hampshire with 42.7%.
What is the Percentage of Population Employed in Education Instruction & Library in the State of New Hampshire?
Percentage of Population Employed in Education Instruction & Library in New Hampshire is 6.5%.
What is the Percentage of Population Employed in Education Instruction & Library in the United States?
Percentage of Population Employed in Education Instruction & Library in the United States is 6.2%.