Cities with the Highest Percentage of Population Employed in Education Instruction & Library in Texas
RELATED REPORTS & OPTIONS
Education Instruction & Library
Texas
Compare Cities
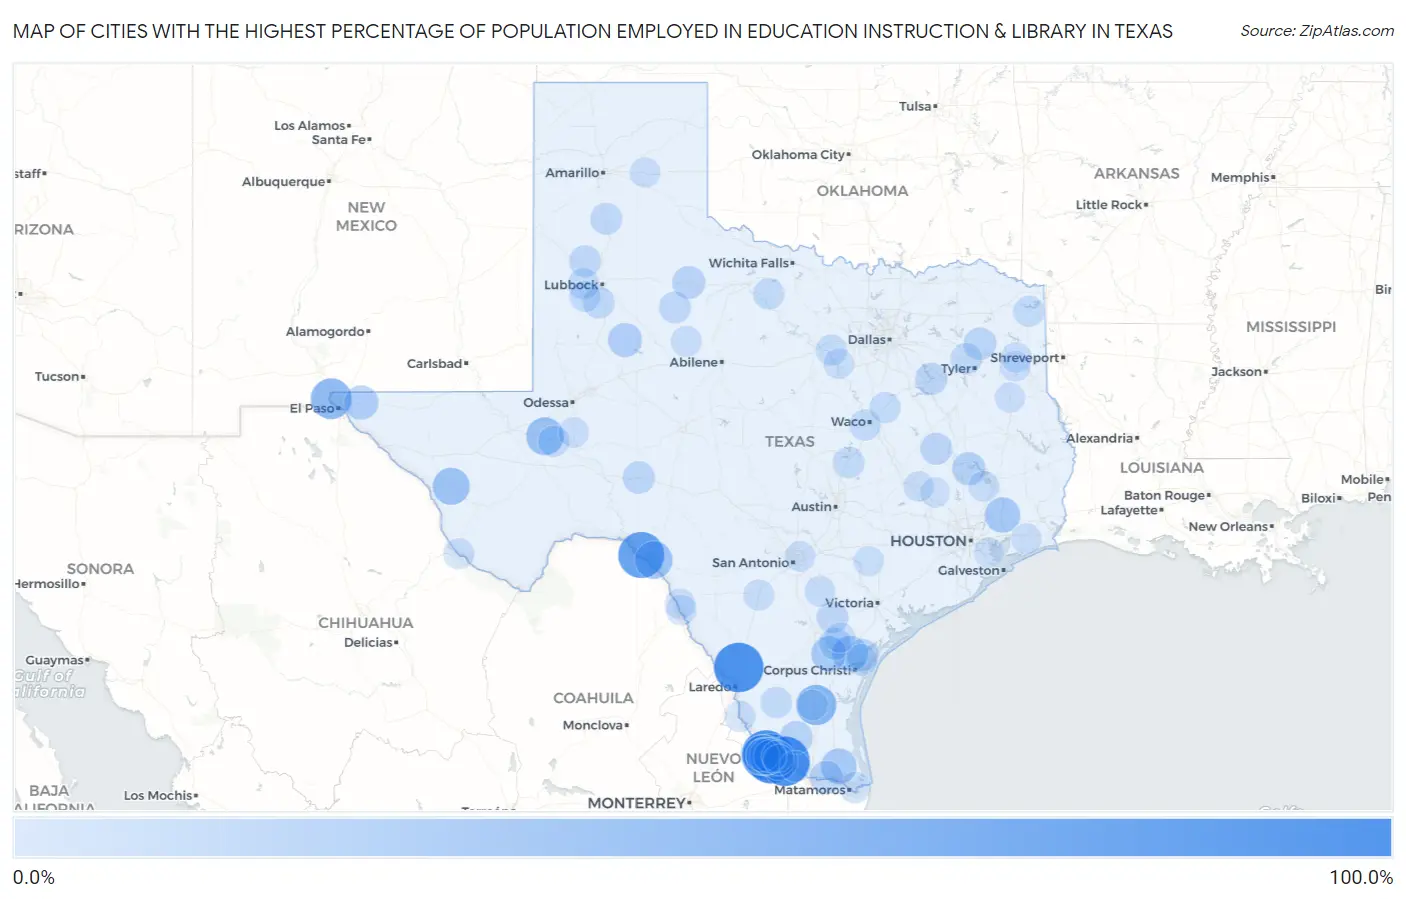
Map of Cities with the Highest Percentage of Population Employed in Education Instruction & Library in Texas
0.0%
100.0%
Cities with the Highest Percentage of Population Employed in Education Instruction & Library in Texas
| City | % Employed | vs State | vs National | |
| 1. | North Escobares | 100.0% | 6.4%(+93.6)#1 | 6.2%(+93.8)#1 |
| 2. | Sunset Acres | 100.0% | 6.4%(+93.6)#2 | 6.2%(+93.8)#12 |
| 3. | Santel | 100.0% | 6.4%(+93.6)#3 | 6.2%(+93.8)#18 |
| 4. | Gutierrez | 100.0% | 6.4%(+93.6)#4 | 6.2%(+93.8)#19 |
| 5. | Sheffield | 86.4% | 6.4%(+80.0)#5 | 6.2%(+80.2)#20 |
| 6. | Box Canyon | 84.2% | 6.4%(+77.8)#6 | 6.2%(+78.0)#21 |
| 7. | Prado Verde | 60.8% | 6.4%(+54.4)#7 | 6.2%(+54.6)#47 |
| 8. | Ramos | 60.0% | 6.4%(+53.6)#8 | 6.2%(+53.8)#51 |
| 9. | Airport Road Addition | 58.5% | 6.4%(+52.2)#9 | 6.2%(+52.4)#54 |
| 10. | Rancho Viejo | 56.4% | 6.4%(+50.0)#10 | 6.2%(+50.2)#63 |
| 11. | Evergreen | 56.0% | 6.4%(+49.6)#11 | 6.2%(+49.8)#64 |
| 12. | Salineno North | 52.4% | 6.4%(+46.0)#12 | 6.2%(+46.2)#79 |
| 13. | Ranchitos Del Norte | 51.5% | 6.4%(+45.1)#13 | 6.2%(+45.3)#84 |
| 14. | Chaparrito | 47.8% | 6.4%(+41.5)#14 | 6.2%(+41.7)#111 |
| 15. | Grandfalls | 47.5% | 6.4%(+41.1)#15 | 6.2%(+41.3)#113 |
| 16. | Lake View | 47.0% | 6.4%(+40.6)#16 | 6.2%(+40.8)#115 |
| 17. | J F Villareal | 45.7% | 6.4%(+39.4)#17 | 6.2%(+39.6)#127 |
| 18. | Valentine | 44.4% | 6.4%(+38.1)#18 | 6.2%(+38.3)#135 |
| 19. | Miguel Barrera | 43.6% | 6.4%(+37.3)#19 | 6.2%(+37.5)#144 |
| 20. | San Juan | 43.5% | 6.4%(+37.1)#20 | 6.2%(+37.3)#145 |
| 21. | Los Ebanos Cdp Starr County | 42.0% | 6.4%(+35.7)#21 | 6.2%(+35.8)#158 |
| 22. | Alamo Beach | 39.1% | 6.4%(+32.8)#22 | 6.2%(+32.9)#177 |
| 23. | Loma Linda | 38.8% | 6.4%(+32.4)#23 | 6.2%(+32.6)#180 |
| 24. | Lasana | 38.0% | 6.4%(+31.6)#24 | 6.2%(+31.8)#188 |
| 25. | Dayton Lakes | 37.5% | 6.4%(+31.1)#25 | 6.2%(+31.3)#201 |
| 26. | Sandia | 36.7% | 6.4%(+30.3)#26 | 6.2%(+30.5)#214 |
| 27. | Butterfield | 32.4% | 6.4%(+26.1)#27 | 6.2%(+26.2)#281 |
| 28. | Gail | 31.8% | 6.4%(+25.5)#28 | 6.2%(+25.6)#290 |
| 29. | Kopperl | 29.8% | 6.4%(+23.4)#29 | 6.2%(+23.6)#341 |
| 30. | Riverside | 28.8% | 6.4%(+22.4)#30 | 6.2%(+22.6)#360 |
| 31. | South Frydek | 28.6% | 6.4%(+22.2)#31 | 6.2%(+22.4)#369 |
| 32. | Relampago | 27.6% | 6.4%(+21.2)#32 | 6.2%(+21.4)#397 |
| 33. | San Isidro | 27.5% | 6.4%(+21.1)#33 | 6.2%(+21.3)#402 |
| 34. | Guthrie | 27.0% | 6.4%(+20.6)#34 | 6.2%(+20.8)#425 |
| 35. | Fronton Ranchettes | 26.7% | 6.4%(+20.3)#35 | 6.2%(+20.5)#433 |
| 36. | Wadsworth | 26.1% | 6.4%(+19.7)#36 | 6.2%(+19.9)#462 |
| 37. | Beauxart Gardens | 25.8% | 6.4%(+19.4)#37 | 6.2%(+19.6)#470 |
| 38. | Holly Lake Ranch | 25.5% | 6.4%(+19.1)#38 | 6.2%(+19.3)#483 |
| 39. | Santo | 24.9% | 6.4%(+18.5)#39 | 6.2%(+18.7)#508 |
| 40. | Rochelle | 24.3% | 6.4%(+17.9)#40 | 6.2%(+18.1)#535 |
| 41. | Ozona | 24.2% | 6.4%(+17.8)#41 | 6.2%(+18.0)#537 |
| 42. | Benjamin Perez | 24.1% | 6.4%(+17.8)#42 | 6.2%(+18.0)#539 |
| 43. | Tradewinds | 24.1% | 6.4%(+17.7)#43 | 6.2%(+17.9)#541 |
| 44. | Star Harbor | 23.5% | 6.4%(+17.2)#44 | 6.2%(+17.3)#574 |
| 45. | Leona | 23.2% | 6.4%(+16.9)#45 | 6.2%(+17.0)#593 |
| 46. | Tynan | 23.1% | 6.4%(+16.7)#46 | 6.2%(+16.9)#600 |
| 47. | Tuleta | 22.7% | 6.4%(+16.4)#47 | 6.2%(+16.5)#633 |
| 48. | Spade | 22.6% | 6.4%(+16.2)#48 | 6.2%(+16.4)#642 |
| 49. | Mound | 22.5% | 6.4%(+16.1)#49 | 6.2%(+16.3)#652 |
| 50. | Jayton | 22.4% | 6.4%(+16.0)#50 | 6.2%(+16.2)#659 |
| 51. | New Home | 22.3% | 6.4%(+15.9)#51 | 6.2%(+16.1)#665 |
| 52. | Tulia | 22.2% | 6.4%(+15.9)#52 | 6.2%(+16.0)#667 |
| 53. | Richards | 22.0% | 6.4%(+15.6)#53 | 6.2%(+15.8)#693 |
| 54. | May | 21.7% | 6.4%(+15.3)#54 | 6.2%(+15.5)#716 |
| 55. | Harrold | 21.7% | 6.4%(+15.3)#55 | 6.2%(+15.5)#718 |
| 56. | Gregory | 21.4% | 6.4%(+15.0)#56 | 6.2%(+15.2)#733 |
| 57. | Paige | 21.0% | 6.4%(+14.6)#57 | 6.2%(+14.8)#763 |
| 58. | Hideaway | 21.0% | 6.4%(+14.6)#58 | 6.2%(+14.8)#764 |
| 59. | Rice Tracts | 20.9% | 6.4%(+14.5)#59 | 6.2%(+14.7)#770 |
| 60. | Ringgold | 20.6% | 6.4%(+14.2)#60 | 6.2%(+14.4)#793 |
| 61. | Megargel | 20.6% | 6.4%(+14.2)#61 | 6.2%(+14.4)#795 |
| 62. | Imperial | 20.5% | 6.4%(+14.1)#62 | 6.2%(+14.3)#809 |
| 63. | Salado | 20.5% | 6.4%(+14.1)#63 | 6.2%(+14.3)#811 |
| 64. | Thompsonville | 20.4% | 6.4%(+14.0)#64 | 6.2%(+14.2)#815 |
| 65. | El Rancho Vela | 20.2% | 6.4%(+13.9)#65 | 6.2%(+14.1)#831 |
| 66. | Smyer | 20.2% | 6.4%(+13.9)#66 | 6.2%(+14.0)#833 |
| 67. | Reid Hope King | 20.2% | 6.4%(+13.8)#67 | 6.2%(+14.0)#837 |
| 68. | Lakeside Town San Patricio County | 20.0% | 6.4%(+13.6)#68 | 6.2%(+13.8)#848 |
| 69. | Woodway | 19.6% | 6.4%(+13.3)#69 | 6.2%(+13.5)#889 |
| 70. | Douglassville | 19.5% | 6.4%(+13.1)#70 | 6.2%(+13.3)#914 |
| 71. | Ropesville | 19.4% | 6.4%(+13.0)#71 | 6.2%(+13.2)#924 |
| 72. | Western Lake | 18.9% | 6.4%(+12.6)#72 | 6.2%(+12.7)#976 |
| 73. | Whitharral | 18.9% | 6.4%(+12.6)#73 | 6.2%(+12.7)#979 |
| 74. | Mount Calm | 18.9% | 6.4%(+12.5)#74 | 6.2%(+12.7)#982 |
| 75. | San Ygnacio | 18.8% | 6.4%(+12.4)#75 | 6.2%(+12.6)#991 |
| 76. | North Pearsall | 18.7% | 6.4%(+12.4)#76 | 6.2%(+12.5)#997 |
| 77. | Falls City | 18.6% | 6.4%(+12.2)#77 | 6.2%(+12.4)#1,015 |
| 78. | Coldspring | 18.4% | 6.4%(+12.0)#78 | 6.2%(+12.2)#1,040 |
| 79. | La Joya | 18.2% | 6.4%(+11.8)#79 | 6.2%(+12.0)#1,058 |
| 80. | Roby | 18.0% | 6.4%(+11.6)#80 | 6.2%(+11.8)#1,087 |
| 81. | Presidio | 17.9% | 6.4%(+11.5)#81 | 6.2%(+11.7)#1,105 |
| 82. | Camargito | 17.8% | 6.4%(+11.5)#82 | 6.2%(+11.6)#1,110 |
| 83. | Nada | 17.5% | 6.4%(+11.2)#83 | 6.2%(+11.4)#1,152 |
| 84. | Easton | 17.4% | 6.4%(+11.0)#84 | 6.2%(+11.2)#1,175 |
| 85. | Hallsville | 17.1% | 6.4%(+10.7)#85 | 6.2%(+10.9)#1,241 |
| 86. | Falfurrias | 17.0% | 6.4%(+10.7)#86 | 6.2%(+10.9)#1,246 |
| 87. | Crane | 16.9% | 6.4%(+10.5)#87 | 6.2%(+10.7)#1,277 |
| 88. | Skidmore | 16.8% | 6.4%(+10.5)#88 | 6.2%(+10.7)#1,282 |
| 89. | Elm Creek | 16.8% | 6.4%(+10.4)#89 | 6.2%(+10.6)#1,287 |
| 90. | Windcrest | 16.6% | 6.4%(+10.2)#90 | 6.2%(+10.4)#1,345 |
| 91. | Stowell | 16.6% | 6.4%(+10.2)#91 | 6.2%(+10.4)#1,349 |
| 92. | College Station | 16.5% | 6.4%(+10.2)#92 | 6.2%(+10.4)#1,354 |
| 93. | Las Quintas Fronterizas | 16.5% | 6.4%(+10.2)#93 | 6.2%(+10.4)#1,355 |
| 94. | Groom | 16.2% | 6.4%(+9.84)#94 | 6.2%(+10.0)#1,420 |
| 95. | Decordova | 16.1% | 6.4%(+9.75)#95 | 6.2%(+9.94)#1,437 |
| 96. | Shiner | 16.1% | 6.4%(+9.75)#96 | 6.2%(+9.93)#1,440 |
| 97. | Mount Enterprise | 16.1% | 6.4%(+9.71)#97 | 6.2%(+9.89)#1,450 |
| 98. | Anderson | 15.7% | 6.4%(+9.38)#98 | 6.2%(+9.56)#1,527 |
| 99. | Plum | 15.4% | 6.4%(+9.05)#99 | 6.2%(+9.24)#1,609 |
| 100. | Taylor Lake Village | 15.3% | 6.4%(+8.94)#100 | 6.2%(+9.12)#1,638 |
Common Questions
What are the Top 10 Cities with the Highest Percentage of Population Employed in Education Instruction & Library in Texas?
Top 10 Cities with the Highest Percentage of Population Employed in Education Instruction & Library in Texas are:
#1
100.0%
#2
100.0%
#3
100.0%
#4
100.0%
#5
84.2%
#6
60.8%
#7
60.0%
#8
58.5%
#9
56.4%
#10
56.0%
What city has the Highest Percentage of Population Employed in Education Instruction & Library in Texas?
North Escobares has the Highest Percentage of Population Employed in Education Instruction & Library in Texas with 100.0%.
What is the Percentage of Population Employed in Education Instruction & Library in the State of Texas?
Percentage of Population Employed in Education Instruction & Library in Texas is 6.4%.
What is the Percentage of Population Employed in Education Instruction & Library in the United States?
Percentage of Population Employed in Education Instruction & Library in the United States is 6.2%.