Cities with the Highest Percentage of Population Employed in Education Instruction & Library in Tennessee
RELATED REPORTS & OPTIONS
Education Instruction & Library
Tennessee
Compare Cities
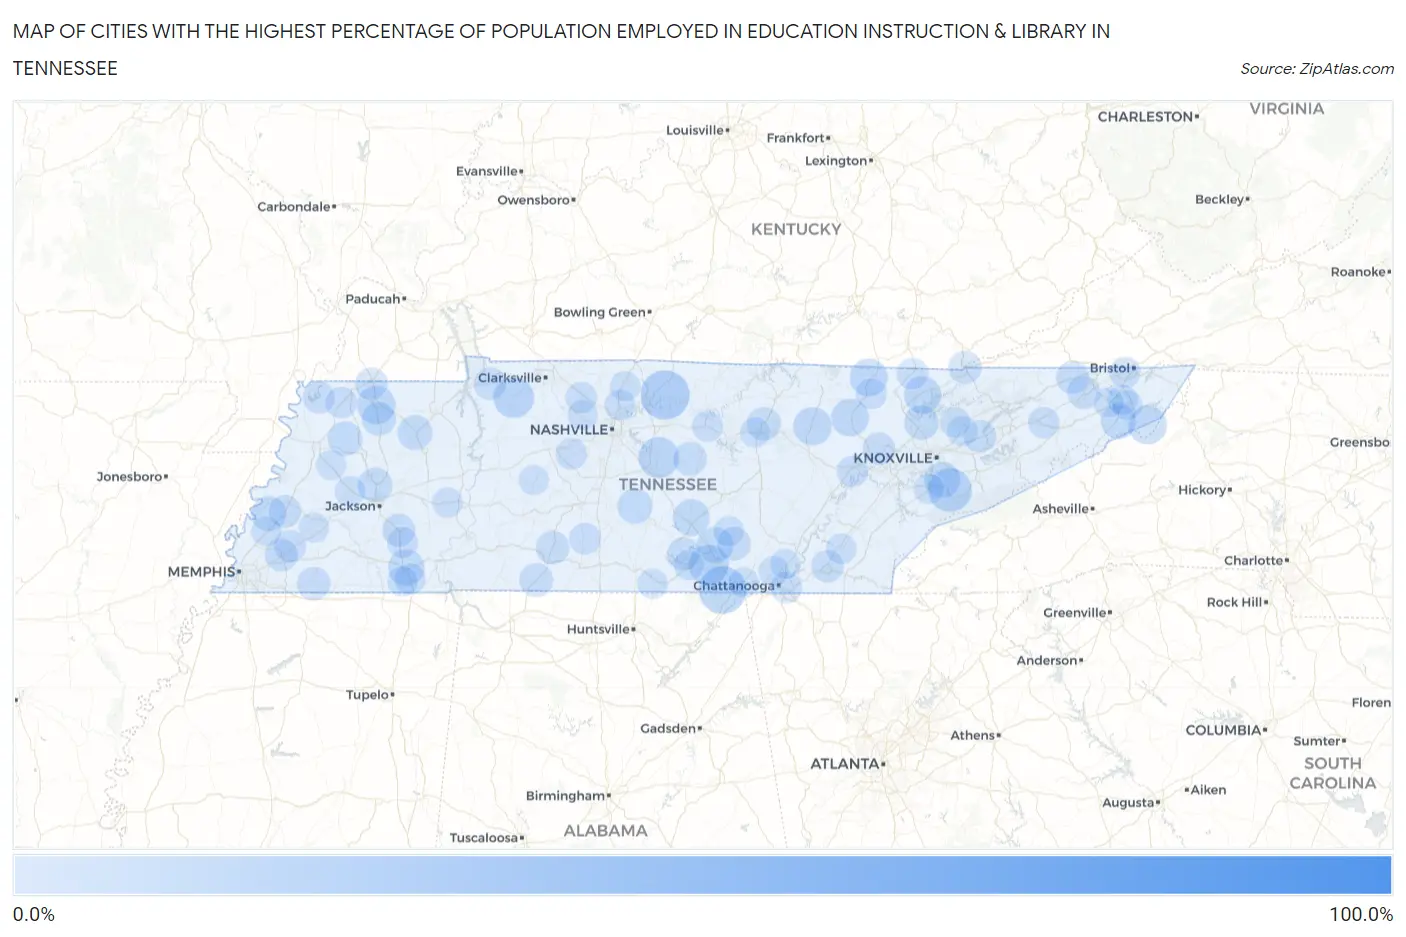
Map of Cities with the Highest Percentage of Population Employed in Education Instruction & Library in Tennessee
0.0%
100.0%
Cities with the Highest Percentage of Population Employed in Education Instruction & Library in Tennessee
| City | % Employed | vs State | vs National | |
| 1. | Mercer | 100.0% | 5.8%(+94.2)#1 | 6.2%(+93.8)#9 |
| 2. | Morris Chapel | 46.3% | 5.8%(+40.5)#2 | 6.2%(+40.1)#120 |
| 3. | Luray | 28.2% | 5.8%(+22.4)#3 | 6.2%(+22.1)#386 |
| 4. | Castalian Springs | 26.9% | 5.8%(+21.0)#4 | 6.2%(+20.7)#429 |
| 5. | Orme | 25.0% | 5.8%(+19.2)#5 | 6.2%(+18.8)#504 |
| 6. | Embreeville | 24.9% | 5.8%(+19.0)#6 | 6.2%(+18.7)#510 |
| 7. | Wildersville | 24.6% | 5.8%(+18.8)#7 | 6.2%(+18.5)#518 |
| 8. | Walland | 21.2% | 5.8%(+15.4)#8 | 6.2%(+15.0)#745 |
| 9. | Walterhill | 18.4% | 5.8%(+12.6)#9 | 6.2%(+12.3)#1,026 |
| 10. | Cumberland City | 18.3% | 5.8%(+12.4)#10 | 6.2%(+12.1)#1,053 |
| 11. | Palmersville | 18.0% | 5.8%(+12.2)#11 | 6.2%(+11.8)#1,086 |
| 12. | Sewanee | 17.8% | 5.8%(+11.9)#12 | 6.2%(+11.6)#1,118 |
| 13. | Roan Mountain | 15.9% | 5.8%(+10.1)#13 | 6.2%(+9.76)#1,478 |
| 14. | Martin | 15.9% | 5.8%(+10.1)#14 | 6.2%(+9.74)#1,483 |
| 15. | Yuma | 15.9% | 5.8%(+10.1)#15 | 6.2%(+9.73)#1,489 |
| 16. | Clarkrange | 15.9% | 5.8%(+10.0)#16 | 6.2%(+9.68)#1,503 |
| 17. | Sunbright | 15.4% | 5.8%(+9.51)#17 | 6.2%(+9.17)#1,630 |
| 18. | Oneida | 15.2% | 5.8%(+9.34)#18 | 6.2%(+9.00)#1,673 |
| 19. | Fincastle | 14.8% | 5.8%(+8.93)#19 | 6.2%(+8.59)#1,769 |
| 20. | New Union | 14.4% | 5.8%(+8.56)#20 | 6.2%(+8.21)#1,871 |
| 21. | Pelham | 13.8% | 5.8%(+8.00)#21 | 6.2%(+7.66)#2,083 |
| 22. | Selmer | 13.8% | 5.8%(+7.95)#22 | 6.2%(+7.61)#2,101 |
| 23. | Wildwood | 13.7% | 5.8%(+7.88)#23 | 6.2%(+7.54)#2,133 |
| 24. | Lenox | 13.2% | 5.8%(+7.39)#24 | 6.2%(+7.05)#2,329 |
| 25. | Unicoi | 13.1% | 5.8%(+7.31)#25 | 6.2%(+6.97)#2,362 |
| 26. | Delano | 12.9% | 5.8%(+7.03)#26 | 6.2%(+6.69)#2,496 |
| 27. | Unionville | 12.6% | 5.8%(+6.75)#27 | 6.2%(+6.41)#2,625 |
| 28. | Burlison | 12.5% | 5.8%(+6.66)#28 | 6.2%(+6.32)#2,664 |
| 29. | Mckenzie | 12.4% | 5.8%(+6.51)#29 | 6.2%(+6.17)#2,744 |
| 30. | Three Way | 12.2% | 5.8%(+6.37)#30 | 6.2%(+6.03)#2,811 |
| 31. | Yorkville | 12.2% | 5.8%(+6.35)#31 | 6.2%(+6.01)#2,818 |
| 32. | Gladeville | 12.2% | 5.8%(+6.32)#32 | 6.2%(+5.98)#2,833 |
| 33. | Norris | 12.1% | 5.8%(+6.27)#33 | 6.2%(+5.93)#2,863 |
| 34. | Blanche | 11.9% | 5.8%(+6.09)#34 | 6.2%(+5.74)#2,948 |
| 35. | Sharon | 11.6% | 5.8%(+5.77)#35 | 6.2%(+5.42)#3,148 |
| 36. | Huron | 11.4% | 5.8%(+5.52)#36 | 6.2%(+5.18)#3,324 |
| 37. | Loretto | 11.4% | 5.8%(+5.52)#37 | 6.2%(+5.17)#3,328 |
| 38. | Hampton | 11.3% | 5.8%(+5.47)#38 | 6.2%(+5.13)#3,356 |
| 39. | Algood | 11.3% | 5.8%(+5.42)#39 | 6.2%(+5.08)#3,402 |
| 40. | Orebank | 11.3% | 5.8%(+5.41)#40 | 6.2%(+5.07)#3,407 |
| 41. | Coalmont | 11.3% | 5.8%(+5.41)#41 | 6.2%(+5.07)#3,410 |
| 42. | Auburntown | 11.2% | 5.8%(+5.39)#42 | 6.2%(+5.05)#3,424 |
| 43. | Moscow | 11.0% | 5.8%(+5.18)#43 | 6.2%(+4.84)#3,601 |
| 44. | Ethridge | 11.0% | 5.8%(+5.17)#44 | 6.2%(+4.83)#3,612 |
| 45. | Fall Branch | 10.8% | 5.8%(+4.91)#45 | 6.2%(+4.57)#3,799 |
| 46. | Cumberland Gap | 10.7% | 5.8%(+4.87)#46 | 6.2%(+4.53)#3,830 |
| 47. | Church Hill | 10.6% | 5.8%(+4.79)#47 | 6.2%(+4.45)#3,900 |
| 48. | Estill Springs | 10.6% | 5.8%(+4.72)#48 | 6.2%(+4.38)#3,964 |
| 49. | Arlington | 10.5% | 5.8%(+4.63)#49 | 6.2%(+4.29)#4,036 |
| 50. | Henderson | 10.4% | 5.8%(+4.52)#50 | 6.2%(+4.17)#4,139 |
| 51. | Covington | 10.2% | 5.8%(+4.37)#51 | 6.2%(+4.03)#4,270 |
| 52. | Dover | 10.2% | 5.8%(+4.37)#52 | 6.2%(+4.03)#4,271 |
| 53. | Strawberry Plains | 10.2% | 5.8%(+4.34)#53 | 6.2%(+4.00)#4,309 |
| 54. | Coalfield | 10.1% | 5.8%(+4.30)#54 | 6.2%(+3.96)#4,351 |
| 55. | New Market | 10.1% | 5.8%(+4.22)#55 | 6.2%(+3.88)#4,441 |
| 56. | Cleveland | 10.1% | 5.8%(+4.22)#56 | 6.2%(+3.88)#4,442 |
| 57. | South Fulton | 9.8% | 5.8%(+3.98)#57 | 6.2%(+3.64)#4,722 |
| 58. | Gallaway | 9.8% | 5.8%(+3.91)#58 | 6.2%(+3.57)#4,806 |
| 59. | Biltmore | 9.6% | 5.8%(+3.77)#59 | 6.2%(+3.43)#4,969 |
| 60. | Samburg | 9.5% | 5.8%(+3.68)#60 | 6.2%(+3.34)#5,060 |
| 61. | Lynnville | 9.3% | 5.8%(+3.49)#61 | 6.2%(+3.15)#5,286 |
| 62. | Troy | 9.3% | 5.8%(+3.41)#62 | 6.2%(+3.07)#5,390 |
| 63. | Ridgeside | 9.2% | 5.8%(+3.34)#63 | 6.2%(+2.99)#5,484 |
| 64. | Jellico | 9.1% | 5.8%(+3.27)#64 | 6.2%(+2.92)#5,565 |
| 65. | Mosheim | 9.0% | 5.8%(+3.14)#65 | 6.2%(+2.80)#5,747 |
| 66. | Fairview | 9.0% | 5.8%(+3.13)#66 | 6.2%(+2.79)#5,761 |
| 67. | Pleasant View | 8.9% | 5.8%(+3.04)#67 | 6.2%(+2.70)#5,887 |
| 68. | Hilham | 8.7% | 5.8%(+2.91)#68 | 6.2%(+2.57)#6,095 |
| 69. | Gordonsville | 8.7% | 5.8%(+2.82)#69 | 6.2%(+2.48)#6,210 |
| 70. | Norene | 8.6% | 5.8%(+2.80)#70 | 6.2%(+2.46)#6,233 |
| 71. | Goodlettsville | 8.6% | 5.8%(+2.78)#71 | 6.2%(+2.44)#6,262 |
| 72. | Eastview | 8.6% | 5.8%(+2.77)#72 | 6.2%(+2.43)#6,303 |
| 73. | Finger | 8.6% | 5.8%(+2.77)#73 | 6.2%(+2.43)#6,307 |
| 74. | Walnut Hill | 8.5% | 5.8%(+2.65)#74 | 6.2%(+2.30)#6,484 |
| 75. | Rockwood | 8.5% | 5.8%(+2.64)#75 | 6.2%(+2.30)#6,485 |
| 76. | Huntsville | 8.5% | 5.8%(+2.64)#76 | 6.2%(+2.30)#6,486 |
| 77. | Bells | 8.3% | 5.8%(+2.47)#77 | 6.2%(+2.13)#6,788 |
| 78. | Calhoun | 8.3% | 5.8%(+2.43)#78 | 6.2%(+2.09)#6,840 |
| 79. | Blaine | 8.2% | 5.8%(+2.41)#79 | 6.2%(+2.07)#6,878 |
| 80. | Ramer | 8.1% | 5.8%(+2.31)#80 | 6.2%(+1.96)#7,068 |
| 81. | Maryville | 8.1% | 5.8%(+2.30)#81 | 6.2%(+1.96)#7,085 |
| 82. | Winchester | 8.1% | 5.8%(+2.29)#82 | 6.2%(+1.95)#7,116 |
| 83. | Altamont | 8.1% | 5.8%(+2.28)#83 | 6.2%(+1.93)#7,137 |
| 84. | Watauga | 8.1% | 5.8%(+2.24)#84 | 6.2%(+1.90)#7,198 |
| 85. | White House | 8.0% | 5.8%(+2.19)#85 | 6.2%(+1.85)#7,290 |
| 86. | Ashland City | 8.0% | 5.8%(+2.17)#86 | 6.2%(+1.83)#7,330 |
| 87. | Darden | 8.0% | 5.8%(+2.16)#87 | 6.2%(+1.82)#7,352 |
| 88. | Flintville | 8.0% | 5.8%(+2.11)#88 | 6.2%(+1.77)#7,439 |
| 89. | Cookeville | 7.9% | 5.8%(+2.09)#89 | 6.2%(+1.75)#7,490 |
| 90. | Munford | 7.9% | 5.8%(+2.07)#90 | 6.2%(+1.73)#7,519 |
| 91. | Signal Mountain | 7.9% | 5.8%(+2.04)#91 | 6.2%(+1.70)#7,580 |
| 92. | Jasper | 7.9% | 5.8%(+2.01)#92 | 6.2%(+1.67)#7,629 |
| 93. | Stanton | 7.8% | 5.8%(+2.00)#93 | 6.2%(+1.65)#7,659 |
| 94. | Oak Grove Cdp Washington County | 7.8% | 5.8%(+1.97)#94 | 6.2%(+1.62)#7,729 |
| 95. | Elizabethton | 7.8% | 5.8%(+1.94)#95 | 6.2%(+1.60)#7,776 |
| 96. | Luttrell | 7.8% | 5.8%(+1.94)#96 | 6.2%(+1.59)#7,784 |
| 97. | Friendship | 7.8% | 5.8%(+1.93)#97 | 6.2%(+1.59)#7,798 |
| 98. | Centerville | 7.8% | 5.8%(+1.92)#98 | 6.2%(+1.58)#7,822 |
| 99. | Johnson City | 7.8% | 5.8%(+1.92)#99 | 6.2%(+1.58)#7,825 |
| 100. | Falling Water | 7.7% | 5.8%(+1.84)#100 | 6.2%(+1.49)#8,007 |
Common Questions
What are the Top 10 Cities with the Highest Percentage of Population Employed in Education Instruction & Library in Tennessee?
Top 10 Cities with the Highest Percentage of Population Employed in Education Instruction & Library in Tennessee are:
#1
26.9%
#2
25.0%
#3
21.2%
#4
18.4%
#5
18.3%
#6
17.8%
#7
15.9%
#8
15.9%
#9
15.9%
#10
15.4%
What city has the Highest Percentage of Population Employed in Education Instruction & Library in Tennessee?
Castalian Springs has the Highest Percentage of Population Employed in Education Instruction & Library in Tennessee with 26.9%.
What is the Percentage of Population Employed in Education Instruction & Library in the State of Tennessee?
Percentage of Population Employed in Education Instruction & Library in Tennessee is 5.8%.
What is the Percentage of Population Employed in Education Instruction & Library in the United States?
Percentage of Population Employed in Education Instruction & Library in the United States is 6.2%.