Cities with the Highest Percentage of Population Employed in Education Instruction & Library in New York
RELATED REPORTS & OPTIONS
Education Instruction & Library
New York
Compare Cities
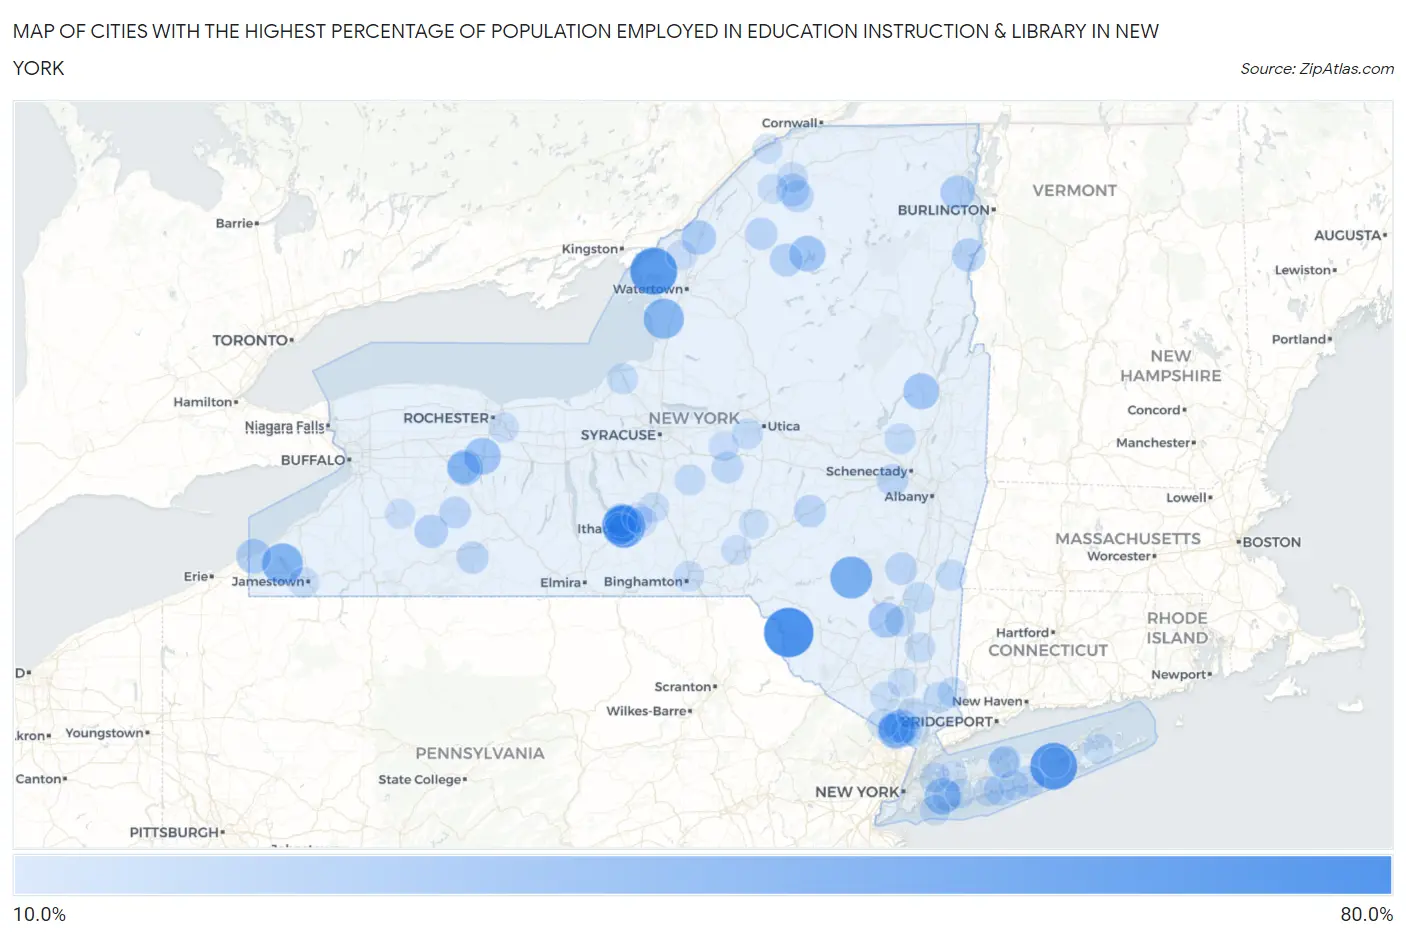
Map of Cities with the Highest Percentage of Population Employed in Education Instruction & Library in New York
0.0%
80.0%
Cities with the Highest Percentage of Population Employed in Education Instruction & Library in New York
| City | % Employed | vs State | vs National | |
| 1. | Hortonville | 64.3% | 7.7%(+56.6)#1 | 6.2%(+58.1)#41 |
| 2. | Three Mile Bay | 57.9% | 7.7%(+50.2)#2 | 6.2%(+51.7)#57 |
| 3. | Northampton | 57.4% | 7.7%(+49.8)#3 | 6.2%(+51.3)#58 |
| 4. | Forest Home | 47.7% | 7.7%(+40.0)#4 | 6.2%(+41.5)#112 |
| 5. | Slaterville Springs | 45.7% | 7.7%(+38.0)#5 | 6.2%(+39.5)#128 |
| 6. | Pine Hill | 45.4% | 7.7%(+37.7)#6 | 6.2%(+39.2)#130 |
| 7. | Chautauqua | 42.3% | 7.7%(+34.6)#7 | 6.2%(+36.1)#156 |
| 8. | Belleville | 40.7% | 7.7%(+33.0)#8 | 6.2%(+34.5)#167 |
| 9. | Brooktondale | 38.5% | 7.7%(+30.8)#9 | 6.2%(+32.3)#184 |
| 10. | Fallsburg | 36.3% | 7.7%(+28.6)#10 | 6.2%(+30.1)#220 |
| 11. | Cayuga Heights | 35.6% | 7.7%(+28.0)#11 | 6.2%(+29.5)#229 |
| 12. | Kaser | 35.6% | 7.7%(+27.9)#12 | 6.2%(+29.4)#230 |
| 13. | East Avon | 32.2% | 7.7%(+24.6)#13 | 6.2%(+26.1)#285 |
| 14. | Northeast Ithaca | 32.0% | 7.7%(+24.3)#14 | 6.2%(+25.8)#288 |
| 15. | Round Top | 31.1% | 7.7%(+23.5)#15 | 6.2%(+25.0)#307 |
| 16. | Malverne Park Oaks | 31.0% | 7.7%(+23.3)#16 | 6.2%(+24.8)#312 |
| 17. | Cranberry Lake | 30.3% | 7.7%(+22.6)#17 | 6.2%(+24.1)#327 |
| 18. | Lake Luzerne | 30.3% | 7.7%(+22.6)#18 | 6.2%(+24.1)#328 |
| 19. | Piffard | 30.1% | 7.7%(+22.4)#19 | 6.2%(+23.9)#334 |
| 20. | Stone Ridge | 29.0% | 7.7%(+21.3)#20 | 6.2%(+22.8)#358 |
| 21. | Monsey | 28.3% | 7.7%(+20.6)#21 | 6.2%(+22.1)#384 |
| 22. | Ripley | 27.3% | 7.7%(+19.6)#22 | 6.2%(+21.1)#411 |
| 23. | Bard College | 27.0% | 7.7%(+19.4)#23 | 6.2%(+20.9)#420 |
| 24. | Redwood | 26.7% | 7.7%(+19.0)#24 | 6.2%(+20.5)#432 |
| 25. | New Square | 26.3% | 7.7%(+18.6)#25 | 6.2%(+20.1)#453 |
| 26. | Copake | 26.2% | 7.7%(+18.5)#26 | 6.2%(+20.0)#457 |
| 27. | Peru | 26.2% | 7.7%(+18.5)#27 | 6.2%(+20.0)#460 |
| 28. | Cadyville | 25.0% | 7.7%(+17.3)#28 | 6.2%(+18.8)#495 |
| 29. | Macdonnell Heights | 24.7% | 7.7%(+17.0)#29 | 6.2%(+18.5)#514 |
| 30. | Vassar College | 24.5% | 7.7%(+16.8)#30 | 6.2%(+18.3)#523 |
| 31. | Lake Huntington | 24.5% | 7.7%(+16.8)#31 | 6.2%(+18.3)#524 |
| 32. | Westport | 24.3% | 7.7%(+16.7)#32 | 6.2%(+18.2)#530 |
| 33. | East Ithaca | 24.3% | 7.7%(+16.7)#33 | 6.2%(+18.1)#532 |
| 34. | Houghton | 24.0% | 7.7%(+16.3)#34 | 6.2%(+17.8)#546 |
| 35. | Lansing | 24.0% | 7.7%(+16.3)#35 | 6.2%(+17.8)#549 |
| 36. | Jacksonville | 23.3% | 7.7%(+15.6)#36 | 6.2%(+17.1)#589 |
| 37. | Star Lake | 23.0% | 7.7%(+15.3)#37 | 6.2%(+16.8)#617 |
| 38. | Shorehaven | 22.9% | 7.7%(+15.2)#38 | 6.2%(+16.7)#620 |
| 39. | Hannawa Falls | 22.4% | 7.7%(+14.7)#39 | 6.2%(+16.2)#657 |
| 40. | Mountain Dale | 22.2% | 7.7%(+14.6)#40 | 6.2%(+16.0)#670 |
| 41. | Ithaca | 22.1% | 7.7%(+14.4)#41 | 6.2%(+15.9)#677 |
| 42. | Schenevus | 21.9% | 7.7%(+14.2)#42 | 6.2%(+15.7)#700 |
| 43. | Colton | 21.6% | 7.7%(+14.0)#43 | 6.2%(+15.5)#720 |
| 44. | Edwards | 21.6% | 7.7%(+13.9)#44 | 6.2%(+15.4)#725 |
| 45. | Palenville | 21.4% | 7.7%(+13.7)#45 | 6.2%(+15.2)#735 |
| 46. | Alfred | 21.2% | 7.7%(+13.6)#46 | 6.2%(+15.1)#743 |
| 47. | Duane Lake | 21.1% | 7.7%(+13.4)#47 | 6.2%(+14.9)#755 |
| 48. | Retsof | 20.9% | 7.7%(+13.3)#48 | 6.2%(+14.8)#766 |
| 49. | Dalton | 20.6% | 7.7%(+12.9)#49 | 6.2%(+14.4)#792 |
| 50. | Newfield | 20.3% | 7.7%(+12.6)#50 | 6.2%(+14.1)#825 |
| 51. | Stony Brook University | 20.3% | 7.7%(+12.6)#51 | 6.2%(+14.1)#826 |
| 52. | Hamilton | 20.1% | 7.7%(+12.4)#52 | 6.2%(+13.9)#840 |
| 53. | Brookhaven | 20.1% | 7.7%(+12.4)#53 | 6.2%(+13.9)#842 |
| 54. | Crugers | 20.0% | 7.7%(+12.3)#54 | 6.2%(+13.8)#859 |
| 55. | Varna | 20.0% | 7.7%(+12.3)#55 | 6.2%(+13.8)#860 |
| 56. | Great River | 19.7% | 7.7%(+12.0)#56 | 6.2%(+13.5)#885 |
| 57. | Heritage Hills | 19.3% | 7.7%(+11.6)#57 | 6.2%(+13.1)#940 |
| 58. | Galway | 19.2% | 7.7%(+11.5)#58 | 6.2%(+13.0)#945 |
| 59. | Minetto | 18.8% | 7.7%(+11.1)#59 | 6.2%(+12.6)#990 |
| 60. | Red Hook | 18.7% | 7.7%(+11.0)#60 | 6.2%(+12.5)#1,000 |
| 61. | Stony Brook | 18.6% | 7.7%(+11.0)#61 | 6.2%(+12.5)#1,006 |
| 62. | Rifton | 18.6% | 7.7%(+11.0)#62 | 6.2%(+12.5)#1,008 |
| 63. | Garrattsville | 18.5% | 7.7%(+10.8)#63 | 6.2%(+12.3)#1,017 |
| 64. | Copake Lake | 18.3% | 7.7%(+10.6)#64 | 6.2%(+12.1)#1,054 |
| 65. | Clinton | 18.2% | 7.7%(+10.5)#65 | 6.2%(+12.0)#1,056 |
| 66. | Deruyter | 18.1% | 7.7%(+10.5)#66 | 6.2%(+11.9)#1,071 |
| 67. | Potsdam | 17.9% | 7.7%(+10.3)#67 | 6.2%(+11.8)#1,098 |
| 68. | Riverside | 17.9% | 7.7%(+10.2)#68 | 6.2%(+11.7)#1,103 |
| 69. | Port Dickinson | 17.6% | 7.7%(+9.92)#69 | 6.2%(+11.4)#1,147 |
| 70. | Jamestown West | 17.6% | 7.7%(+9.90)#70 | 6.2%(+11.4)#1,149 |
| 71. | Bardonia | 17.5% | 7.7%(+9.85)#71 | 6.2%(+11.3)#1,156 |
| 72. | Titusville | 17.3% | 7.7%(+9.63)#72 | 6.2%(+11.1)#1,190 |
| 73. | Peach Lake | 17.3% | 7.7%(+9.62)#73 | 6.2%(+11.1)#1,195 |
| 74. | Munsons Corners | 17.2% | 7.7%(+9.53)#74 | 6.2%(+11.0)#1,210 |
| 75. | Blue Point | 17.2% | 7.7%(+9.52)#75 | 6.2%(+11.0)#1,211 |
| 76. | Pittsford | 17.2% | 7.7%(+9.51)#76 | 6.2%(+11.0)#1,212 |
| 77. | South Hempstead | 17.2% | 7.7%(+9.51)#77 | 6.2%(+11.0)#1,215 |
| 78. | Sloatsburg | 17.1% | 7.7%(+9.45)#78 | 6.2%(+10.9)#1,228 |
| 79. | Atlantic Beach | 17.1% | 7.7%(+9.45)#79 | 6.2%(+10.9)#1,229 |
| 80. | Freeville | 17.0% | 7.7%(+9.29)#80 | 6.2%(+10.8)#1,253 |
| 81. | Brightwaters | 16.9% | 7.7%(+9.26)#81 | 6.2%(+10.7)#1,265 |
| 82. | Bainbridge | 16.9% | 7.7%(+9.26)#82 | 6.2%(+10.7)#1,266 |
| 83. | Munnsville | 16.9% | 7.7%(+9.23)#83 | 6.2%(+10.7)#1,274 |
| 84. | East Setauket | 16.7% | 7.7%(+9.03)#84 | 6.2%(+10.5)#1,301 |
| 85. | Great Neck | 16.7% | 7.7%(+9.01)#85 | 6.2%(+10.5)#1,302 |
| 86. | Arcade | 16.6% | 7.7%(+8.97)#86 | 6.2%(+10.5)#1,339 |
| 87. | Viola | 16.6% | 7.7%(+8.95)#87 | 6.2%(+10.4)#1,342 |
| 88. | La Fargeville | 16.6% | 7.7%(+8.91)#88 | 6.2%(+10.4)#1,348 |
| 89. | Gilbertsville | 16.6% | 7.7%(+8.90)#89 | 6.2%(+10.4)#1,351 |
| 90. | Sag Harbor | 16.5% | 7.7%(+8.88)#90 | 6.2%(+10.4)#1,353 |
| 91. | Canton | 16.4% | 7.7%(+8.74)#91 | 6.2%(+10.2)#1,380 |
| 92. | Dryden | 16.3% | 7.7%(+8.65)#92 | 6.2%(+10.1)#1,395 |
| 93. | Rochester Institute Of Technology | 16.2% | 7.7%(+8.56)#93 | 6.2%(+10.0)#1,415 |
| 94. | Waddington | 16.2% | 7.7%(+8.53)#94 | 6.2%(+10.0)#1,421 |
| 95. | Brookville | 16.2% | 7.7%(+8.52)#95 | 6.2%(+10.0)#1,422 |
| 96. | Bridgeville | 16.2% | 7.7%(+8.51)#96 | 6.2%(+9.99)#1,426 |
| 97. | Kiryas Joel | 16.2% | 7.7%(+8.50)#97 | 6.2%(+9.98)#1,428 |
| 98. | Cornwall On Hudson | 16.1% | 7.7%(+8.44)#98 | 6.2%(+9.93)#1,442 |
| 99. | Upper Nyack | 16.0% | 7.7%(+8.37)#99 | 6.2%(+9.86)#1,453 |
| 100. | North Wantagh | 16.0% | 7.7%(+8.36)#100 | 6.2%(+9.85)#1,454 |
Common Questions
What are the Top 10 Cities with the Highest Percentage of Population Employed in Education Instruction & Library in New York?
Top 10 Cities with the Highest Percentage of Population Employed in Education Instruction & Library in New York are:
#1
64.3%
#2
57.9%
#3
57.4%
#4
47.7%
#5
45.4%
#6
42.3%
#7
40.7%
#8
35.6%
#9
35.6%
#10
32.2%
What city has the Highest Percentage of Population Employed in Education Instruction & Library in New York?
Hortonville has the Highest Percentage of Population Employed in Education Instruction & Library in New York with 64.3%.
What is the Percentage of Population Employed in Education Instruction & Library in the State of New York?
Percentage of Population Employed in Education Instruction & Library in New York is 7.7%.
What is the Percentage of Population Employed in Education Instruction & Library in the United States?
Percentage of Population Employed in Education Instruction & Library in the United States is 6.2%.