Cities with the Highest Percentage of Population Employed in Education Instruction & Library in Michigan
RELATED REPORTS & OPTIONS
Education Instruction & Library
Michigan
Compare Cities
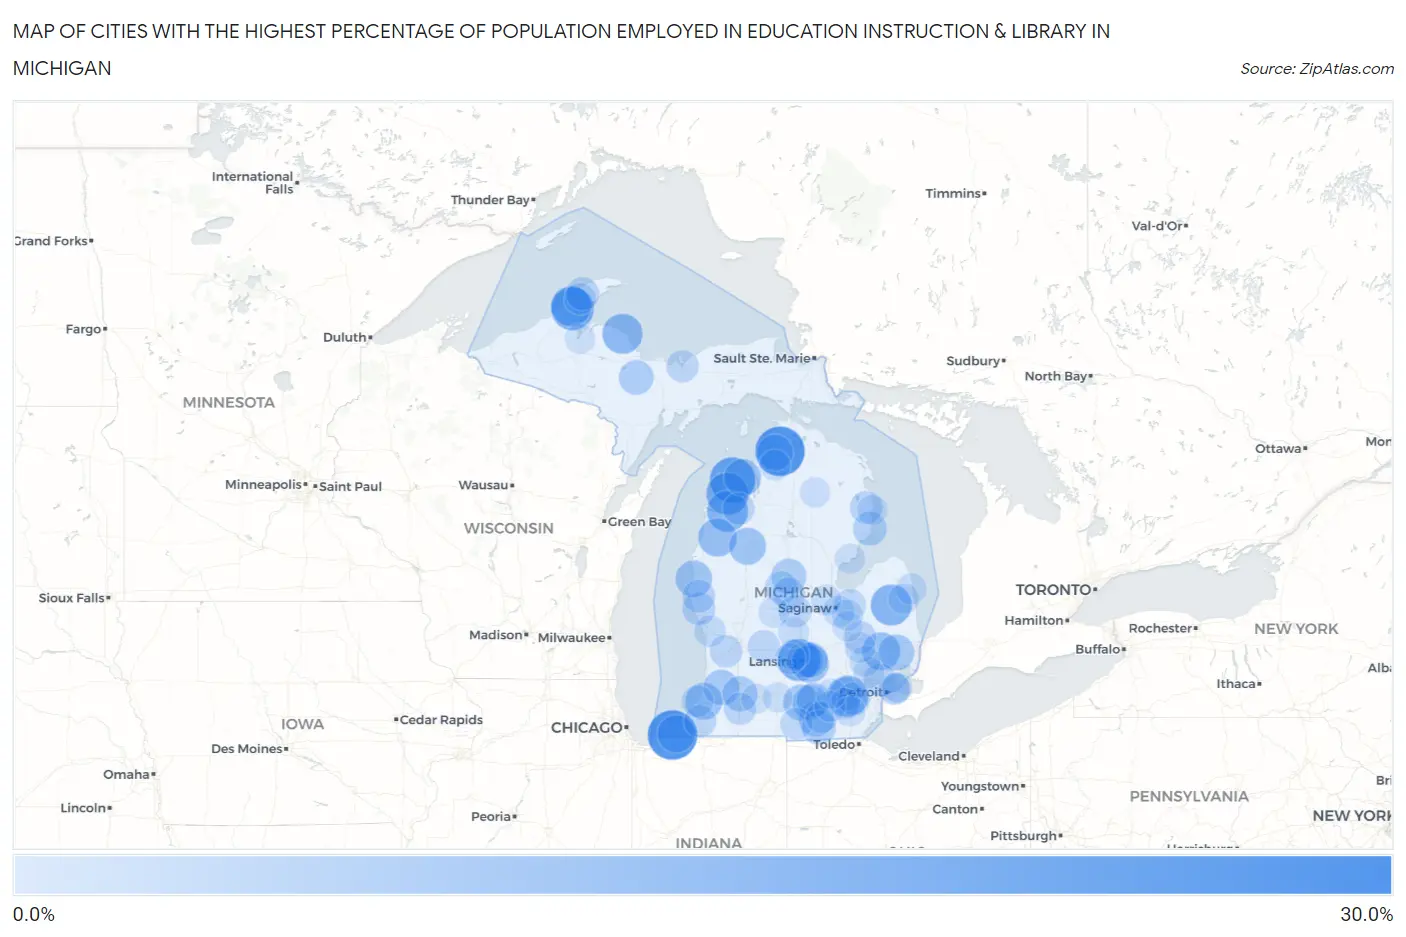
Map of Cities with the Highest Percentage of Population Employed in Education Instruction & Library in Michigan
0.0%
30.0%
Cities with the Highest Percentage of Population Employed in Education Instruction & Library in Michigan
| City | % Employed | vs State | vs National | |
| 1. | Lakeport | 29.4% | 5.3%(+24.0)#1 | 6.2%(+23.2)#350 |
| 2. | Michiana | 28.5% | 5.3%(+23.1)#2 | 6.2%(+22.3)#378 |
| 3. | Bay View | 28.3% | 5.3%(+23.0)#3 | 6.2%(+22.1)#383 |
| 4. | Leland | 24.0% | 5.3%(+18.6)#4 | 6.2%(+17.8)#551 |
| 5. | Bruce Crossing | 23.1% | 5.3%(+17.7)#5 | 6.2%(+16.9)#601 |
| 6. | Houghton | 21.4% | 5.3%(+16.1)#6 | 6.2%(+15.2)#731 |
| 7. | Maple City | 20.7% | 5.3%(+15.3)#7 | 6.2%(+14.5)#789 |
| 8. | Edgemont Park | 20.5% | 5.3%(+15.2)#8 | 6.2%(+14.3)#803 |
| 9. | Covington | 20.4% | 5.3%(+15.1)#9 | 6.2%(+14.2)#816 |
| 10. | Fulton | 20.4% | 5.3%(+15.0)#10 | 6.2%(+14.2)#820 |
| 11. | Ann Arbor | 19.7% | 5.3%(+14.4)#11 | 6.2%(+13.5)#884 |
| 12. | Bendon | 19.6% | 5.3%(+14.2)#12 | 6.2%(+13.4)#900 |
| 13. | Snover | 19.4% | 5.3%(+14.0)#13 | 6.2%(+13.2)#928 |
| 14. | Hancock | 18.7% | 5.3%(+13.4)#14 | 6.2%(+12.6)#996 |
| 15. | Big Bay | 18.5% | 5.3%(+13.1)#15 | 6.2%(+12.3)#1,020 |
| 16. | Skanee | 17.9% | 5.3%(+12.6)#16 | 6.2%(+11.8)#1,095 |
| 17. | Brethren | 16.7% | 5.3%(+11.3)#17 | 6.2%(+10.5)#1,311 |
| 18. | Paris | 16.7% | 5.3%(+11.3)#18 | 6.2%(+10.5)#1,315 |
| 19. | Leonard | 16.2% | 5.3%(+10.8)#19 | 6.2%(+9.99)#1,425 |
| 20. | Okemos | 16.0% | 5.3%(+10.7)#20 | 6.2%(+9.86)#1,452 |
| 21. | New Buffalo | 16.0% | 5.3%(+10.6)#21 | 6.2%(+9.77)#1,475 |
| 22. | Brimley | 15.8% | 5.3%(+10.4)#22 | 6.2%(+9.57)#1,526 |
| 23. | Omena | 15.4% | 5.3%(+10.0)#23 | 6.2%(+9.20)#1,617 |
| 24. | Wedgewood | 15.3% | 5.3%(+9.97)#24 | 6.2%(+9.12)#1,640 |
| 25. | Paw Paw Lake | 15.2% | 5.3%(+9.88)#25 | 6.2%(+9.03)#1,666 |
| 26. | Pentwater | 14.9% | 5.3%(+9.56)#26 | 6.2%(+8.72)#1,732 |
| 27. | Rock | 14.6% | 5.3%(+9.27)#27 | 6.2%(+8.42)#1,813 |
| 28. | Petoskey | 14.5% | 5.3%(+9.16)#28 | 6.2%(+8.31)#1,836 |
| 29. | Spring Arbor | 14.4% | 5.3%(+9.03)#29 | 6.2%(+8.19)#1,880 |
| 30. | Armada | 14.4% | 5.3%(+9.03)#30 | 6.2%(+8.18)#1,881 |
| 31. | East Lansing | 14.1% | 5.3%(+8.80)#31 | 6.2%(+7.95)#1,986 |
| 32. | Bloomingdale | 13.8% | 5.3%(+8.47)#32 | 6.2%(+7.63)#2,095 |
| 33. | Haslett | 13.8% | 5.3%(+8.46)#33 | 6.2%(+7.62)#2,100 |
| 34. | Manitou Beach Devils Lake | 13.5% | 5.3%(+8.12)#34 | 6.2%(+7.27)#2,234 |
| 35. | Westwood | 13.3% | 5.3%(+8.00)#35 | 6.2%(+7.16)#2,280 |
| 36. | Vandercook Lake | 13.3% | 5.3%(+7.97)#36 | 6.2%(+7.13)#2,306 |
| 37. | Clare | 13.3% | 5.3%(+7.96)#37 | 6.2%(+7.12)#2,310 |
| 38. | Gwinn | 13.0% | 5.3%(+7.62)#38 | 6.2%(+6.78)#2,452 |
| 39. | Michigan Center | 12.7% | 5.3%(+7.34)#39 | 6.2%(+6.50)#2,578 |
| 40. | Clayton | 12.4% | 5.3%(+7.02)#40 | 6.2%(+6.18)#2,741 |
| 41. | Oscoda | 12.0% | 5.3%(+6.67)#41 | 6.2%(+5.83)#2,912 |
| 42. | Mohawk | 11.8% | 5.3%(+6.42)#42 | 6.2%(+5.58)#3,033 |
| 43. | Eureka | 11.5% | 5.3%(+6.14)#43 | 6.2%(+5.29)#3,234 |
| 44. | Barton Hills | 11.4% | 5.3%(+6.11)#44 | 6.2%(+5.26)#3,253 |
| 45. | Ahmeek | 11.4% | 5.3%(+6.02)#45 | 6.2%(+5.18)#3,325 |
| 46. | Whitehall | 11.3% | 5.3%(+5.93)#46 | 6.2%(+5.08)#3,398 |
| 47. | Huntington Woods | 11.0% | 5.3%(+5.71)#47 | 6.2%(+4.87)#3,581 |
| 48. | Davison | 11.0% | 5.3%(+5.69)#48 | 6.2%(+4.85)#3,593 |
| 49. | New Era | 11.0% | 5.3%(+5.68)#49 | 6.2%(+4.83)#3,608 |
| 50. | Lincoln | 11.0% | 5.3%(+5.64)#50 | 6.2%(+4.79)#3,639 |
| 51. | Beal City | 10.8% | 5.3%(+5.50)#51 | 6.2%(+4.66)#3,741 |
| 52. | Ypsilanti | 10.8% | 5.3%(+5.49)#52 | 6.2%(+4.64)#3,749 |
| 53. | Mount Pleasant | 10.8% | 5.3%(+5.44)#53 | 6.2%(+4.59)#3,788 |
| 54. | Hudsonville | 10.7% | 5.3%(+5.33)#54 | 6.2%(+4.49)#3,864 |
| 55. | Alma | 10.7% | 5.3%(+5.32)#55 | 6.2%(+4.47)#3,884 |
| 56. | Pittsford | 10.6% | 5.3%(+5.24)#56 | 6.2%(+4.39)#3,946 |
| 57. | Berrien Springs | 10.5% | 5.3%(+5.12)#57 | 6.2%(+4.28)#4,048 |
| 58. | Saranac | 10.4% | 5.3%(+5.09)#58 | 6.2%(+4.24)#4,085 |
| 59. | Schoolcraft | 10.3% | 5.3%(+5.01)#59 | 6.2%(+4.17)#4,144 |
| 60. | Munising | 10.3% | 5.3%(+4.94)#60 | 6.2%(+4.10)#4,205 |
| 61. | Chums Corner | 10.2% | 5.3%(+4.89)#61 | 6.2%(+4.05)#4,246 |
| 62. | Reese | 10.2% | 5.3%(+4.81)#62 | 6.2%(+3.97)#4,343 |
| 63. | Hillsdale | 10.1% | 5.3%(+4.79)#63 | 6.2%(+3.95)#4,372 |
| 64. | Atlantic Mine | 10.1% | 5.3%(+4.78)#64 | 6.2%(+3.93)#4,387 |
| 65. | Grosse Pointe Park | 10.1% | 5.3%(+4.73)#65 | 6.2%(+3.89)#4,433 |
| 66. | Lake Michigan Beach | 10.0% | 5.3%(+4.70)#66 | 6.2%(+3.86)#4,473 |
| 67. | Fruitport | 9.8% | 5.3%(+4.48)#67 | 6.2%(+3.64)#4,719 |
| 68. | Bridgeport | 9.7% | 5.3%(+4.37)#68 | 6.2%(+3.52)#4,857 |
| 69. | Onsted | 9.7% | 5.3%(+4.34)#69 | 6.2%(+3.50)#4,880 |
| 70. | Laurium | 9.6% | 5.3%(+4.29)#70 | 6.2%(+3.45)#4,941 |
| 71. | Lake Gogebic | 9.5% | 5.3%(+4.18)#71 | 6.2%(+3.34)#5,064 |
| 72. | Frankenmuth | 9.4% | 5.3%(+4.04)#72 | 6.2%(+3.20)#5,225 |
| 73. | Manchester | 9.3% | 5.3%(+3.97)#73 | 6.2%(+3.13)#5,315 |
| 74. | Wacousta | 9.3% | 5.3%(+3.92)#74 | 6.2%(+3.08)#5,377 |
| 75. | Lamont | 9.2% | 5.3%(+3.91)#75 | 6.2%(+3.06)#5,402 |
| 76. | Scotts | 9.2% | 5.3%(+3.84)#76 | 6.2%(+3.00)#5,471 |
| 77. | Orchard Lake Village | 9.1% | 5.3%(+3.78)#77 | 6.2%(+2.94)#5,547 |
| 78. | Boyne City | 9.1% | 5.3%(+3.76)#78 | 6.2%(+2.92)#5,572 |
| 79. | Village Of Clarkston | 9.1% | 5.3%(+3.75)#79 | 6.2%(+2.91)#5,585 |
| 80. | Maple Rapids | 9.1% | 5.3%(+3.75)#80 | 6.2%(+2.91)#5,586 |
| 81. | Forestville | 9.1% | 5.3%(+3.75)#81 | 6.2%(+2.91)#5,608 |
| 82. | Grand Ledge | 9.1% | 5.3%(+3.73)#82 | 6.2%(+2.89)#5,643 |
| 83. | Deckerville | 9.0% | 5.3%(+3.64)#83 | 6.2%(+2.80)#5,745 |
| 84. | Ewen | 8.9% | 5.3%(+3.60)#84 | 6.2%(+2.76)#5,800 |
| 85. | Freeland | 8.9% | 5.3%(+3.60)#85 | 6.2%(+2.76)#5,803 |
| 86. | Goodrich | 8.9% | 5.3%(+3.52)#86 | 6.2%(+2.68)#5,918 |
| 87. | Grosse Pointe | 8.8% | 5.3%(+3.48)#87 | 6.2%(+2.63)#5,990 |
| 88. | Saline | 8.8% | 5.3%(+3.44)#88 | 6.2%(+2.59)#6,043 |
| 89. | Chassell | 8.8% | 5.3%(+3.43)#89 | 6.2%(+2.58)#6,067 |
| 90. | Mcbride | 8.6% | 5.3%(+3.30)#90 | 6.2%(+2.46)#6,234 |
| 91. | Milan | 8.6% | 5.3%(+3.25)#91 | 6.2%(+2.41)#6,336 |
| 92. | Lewiston | 8.6% | 5.3%(+3.22)#92 | 6.2%(+2.38)#6,378 |
| 93. | Au Gres | 8.6% | 5.3%(+3.22)#93 | 6.2%(+2.38)#6,381 |
| 94. | Grosse Pointe Farms | 8.5% | 5.3%(+3.15)#94 | 6.2%(+2.31)#6,483 |
| 95. | Harrisville | 8.5% | 5.3%(+3.15)#95 | 6.2%(+2.30)#6,489 |
| 96. | L Anse | 8.4% | 5.3%(+3.08)#96 | 6.2%(+2.23)#6,591 |
| 97. | Chelsea | 8.4% | 5.3%(+3.07)#97 | 6.2%(+2.23)#6,596 |
| 98. | Clio | 8.4% | 5.3%(+3.06)#98 | 6.2%(+2.22)#6,621 |
| 99. | Climax | 8.4% | 5.3%(+3.05)#99 | 6.2%(+2.21)#6,637 |
| 100. | Marshall | 8.3% | 5.3%(+2.91)#100 | 6.2%(+2.07)#6,874 |
Common Questions
What are the Top 10 Cities with the Highest Percentage of Population Employed in Education Instruction & Library in Michigan?
Top 10 Cities with the Highest Percentage of Population Employed in Education Instruction & Library in Michigan are:
#1
28.5%
#2
28.3%
#3
24.0%
#4
21.4%
#5
20.7%
#6
20.5%
#7
19.7%
#8
19.6%
#9
19.4%
#10
18.7%
What city has the Highest Percentage of Population Employed in Education Instruction & Library in Michigan?
Michiana has the Highest Percentage of Population Employed in Education Instruction & Library in Michigan with 28.5%.
What is the Percentage of Population Employed in Education Instruction & Library in the State of Michigan?
Percentage of Population Employed in Education Instruction & Library in Michigan is 5.3%.
What is the Percentage of Population Employed in Education Instruction & Library in the United States?
Percentage of Population Employed in Education Instruction & Library in the United States is 6.2%.