Cities with the Highest Percentage of Population Employed in Education Instruction & Library in Utah
RELATED REPORTS & OPTIONS
Education Instruction & Library
Utah
Compare Cities
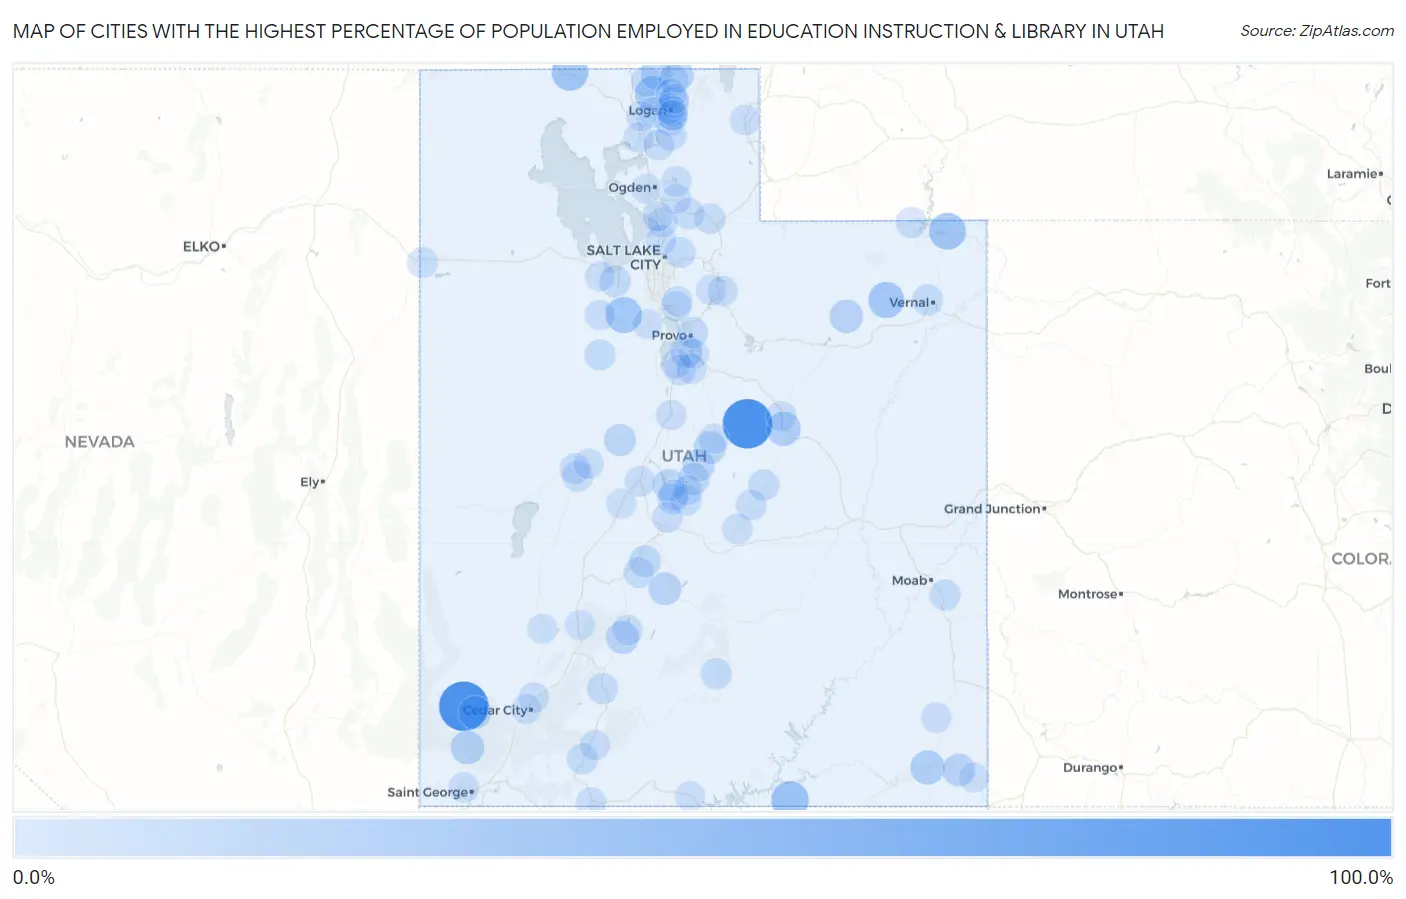
Map of Cities with the Highest Percentage of Population Employed in Education Instruction & Library in Utah
0.0%
100.0%
Cities with the Highest Percentage of Population Employed in Education Instruction & Library in Utah
| City | % Employed | vs State | vs National | |
| 1. | Clear Creek | 100.0% | 6.4%(+93.6)#1 | 6.2%(+93.8)#13 |
| 2. | Beryl Junction | 100.0% | 6.4%(+93.6)#2 | 6.2%(+93.8)#14 |
| 3. | Navajo Mountain | 42.0% | 6.4%(+35.6)#3 | 6.2%(+35.8)#160 |
| 4. | Dutch John | 38.5% | 6.4%(+32.1)#4 | 6.2%(+32.3)#185 |
| 5. | Snowville | 37.3% | 6.4%(+30.9)#5 | 6.2%(+31.1)#204 |
| 6. | Ophir | 35.1% | 6.4%(+28.8)#6 | 6.2%(+29.0)#242 |
| 7. | Whiterocks | 34.6% | 6.4%(+28.2)#7 | 6.2%(+28.4)#252 |
| 8. | Cache | 30.4% | 6.4%(+24.1)#8 | 6.2%(+24.3)#324 |
| 9. | West Wood | 26.5% | 6.4%(+20.1)#9 | 6.2%(+20.3)#445 |
| 10. | Bluff | 25.9% | 6.4%(+19.5)#10 | 6.2%(+19.7)#467 |
| 11. | Central | 23.0% | 6.4%(+16.6)#11 | 6.2%(+16.8)#615 |
| 12. | Altamont | 22.3% | 6.4%(+15.9)#12 | 6.2%(+16.1)#664 |
| 13. | Newcastle | 20.7% | 6.4%(+14.3)#13 | 6.2%(+14.5)#784 |
| 14. | Koosharem | 20.3% | 6.4%(+13.9)#14 | 6.2%(+14.1)#827 |
| 15. | Circleville | 20.1% | 6.4%(+13.7)#15 | 6.2%(+13.9)#839 |
| 16. | Cove | 19.9% | 6.4%(+13.5)#16 | 6.2%(+13.7)#865 |
| 17. | Montezuma Creek | 19.4% | 6.4%(+13.0)#17 | 6.2%(+13.2)#921 |
| 18. | Palmyra | 18.4% | 6.4%(+12.0)#18 | 6.2%(+12.2)#1,032 |
| 19. | Spring City | 18.2% | 6.4%(+11.9)#19 | 6.2%(+12.1)#1,055 |
| 20. | Ephraim | 16.9% | 6.4%(+10.6)#20 | 6.2%(+10.8)#1,260 |
| 21. | Leamington | 16.7% | 6.4%(+10.3)#21 | 6.2%(+10.5)#1,314 |
| 22. | Fayette | 16.3% | 6.4%(+9.87)#22 | 6.2%(+10.1)#1,410 |
| 23. | Cornish | 15.7% | 6.4%(+9.27)#23 | 6.2%(+9.47)#1,545 |
| 24. | Manti | 15.4% | 6.4%(+9.03)#24 | 6.2%(+9.22)#1,611 |
| 25. | Annabella | 14.8% | 6.4%(+8.39)#25 | 6.2%(+8.59)#1,770 |
| 26. | Erda | 14.1% | 6.4%(+7.70)#26 | 6.2%(+7.90)#2,007 |
| 27. | Hobble Creek | 12.7% | 6.4%(+6.37)#27 | 6.2%(+6.56)#2,552 |
| 28. | Spanish Valley | 12.7% | 6.4%(+6.29)#28 | 6.2%(+6.49)#2,583 |
| 29. | Nibley | 12.6% | 6.4%(+6.20)#29 | 6.2%(+6.39)#2,638 |
| 30. | Maeser | 12.6% | 6.4%(+6.20)#30 | 6.2%(+6.39)#2,639 |
| 31. | Glendale | 12.5% | 6.4%(+6.12)#31 | 6.2%(+6.32)#2,663 |
| 32. | Boulder | 12.4% | 6.4%(+6.01)#32 | 6.2%(+6.21)#2,723 |
| 33. | Panguitch | 12.1% | 6.4%(+5.72)#33 | 6.2%(+5.92)#2,871 |
| 34. | Vernon | 12.0% | 6.4%(+5.67)#34 | 6.2%(+5.86)#2,899 |
| 35. | Mayfield | 12.0% | 6.4%(+5.62)#35 | 6.2%(+5.82)#2,920 |
| 36. | Provo | 11.8% | 6.4%(+5.43)#36 | 6.2%(+5.63)#3,010 |
| 37. | Emigration Canyon | 11.6% | 6.4%(+5.18)#37 | 6.2%(+5.38)#3,176 |
| 38. | Castle Dale | 11.5% | 6.4%(+5.10)#38 | 6.2%(+5.30)#3,229 |
| 39. | Henefer | 11.4% | 6.4%(+5.00)#39 | 6.2%(+5.19)#3,306 |
| 40. | Manila | 11.3% | 6.4%(+4.97)#40 | 6.2%(+5.16)#3,332 |
| 41. | Deseret | 11.3% | 6.4%(+4.96)#41 | 6.2%(+5.16)#3,336 |
| 42. | Wendover | 11.2% | 6.4%(+4.87)#42 | 6.2%(+5.06)#3,415 |
| 43. | Morgan | 11.2% | 6.4%(+4.79)#43 | 6.2%(+4.99)#3,478 |
| 44. | Spring Lake | 10.9% | 6.4%(+4.55)#44 | 6.2%(+4.75)#3,676 |
| 45. | Hinckley | 10.9% | 6.4%(+4.48)#45 | 6.2%(+4.68)#3,719 |
| 46. | Ferron | 10.7% | 6.4%(+4.36)#46 | 6.2%(+4.56)#3,809 |
| 47. | Paradise | 10.7% | 6.4%(+4.35)#47 | 6.2%(+4.55)#3,814 |
| 48. | Mantua | 10.6% | 6.4%(+4.20)#48 | 6.2%(+4.39)#3,949 |
| 49. | Centerfield | 10.6% | 6.4%(+4.19)#49 | 6.2%(+4.38)#3,958 |
| 50. | Clarkston | 10.5% | 6.4%(+4.16)#50 | 6.2%(+4.36)#3,973 |
| 51. | Gunnison | 10.4% | 6.4%(+4.05)#51 | 6.2%(+4.25)#4,078 |
| 52. | Millville | 10.2% | 6.4%(+3.78)#52 | 6.2%(+3.97)#4,342 |
| 53. | Monroe | 10.0% | 6.4%(+3.61)#53 | 6.2%(+3.81)#4,540 |
| 54. | Scipio | 10.0% | 6.4%(+3.57)#54 | 6.2%(+3.77)#4,573 |
| 55. | Enoch | 9.8% | 6.4%(+3.44)#55 | 6.2%(+3.63)#4,733 |
| 56. | Emery | 9.7% | 6.4%(+3.34)#56 | 6.2%(+3.53)#4,851 |
| 57. | Huntsville | 9.7% | 6.4%(+3.31)#57 | 6.2%(+3.51)#4,870 |
| 58. | North Logan | 9.6% | 6.4%(+3.22)#58 | 6.2%(+3.41)#4,979 |
| 59. | Mendon | 9.6% | 6.4%(+3.20)#59 | 6.2%(+3.40)#4,998 |
| 60. | Highland | 9.5% | 6.4%(+3.12)#60 | 6.2%(+3.32)#5,083 |
| 61. | Santa Clara | 9.5% | 6.4%(+3.08)#61 | 6.2%(+3.27)#5,146 |
| 62. | Blanding | 9.4% | 6.4%(+3.03)#62 | 6.2%(+3.22)#5,202 |
| 63. | Randolph | 9.4% | 6.4%(+3.00)#63 | 6.2%(+3.19)#5,237 |
| 64. | Richmond | 9.3% | 6.4%(+2.96)#64 | 6.2%(+3.15)#5,283 |
| 65. | River Heights | 9.3% | 6.4%(+2.93)#65 | 6.2%(+3.13)#5,317 |
| 66. | Junction | 9.3% | 6.4%(+2.88)#66 | 6.2%(+3.08)#5,381 |
| 67. | Interlaken | 9.1% | 6.4%(+2.71)#67 | 6.2%(+2.91)#5,613 |
| 68. | Helper | 9.0% | 6.4%(+2.60)#68 | 6.2%(+2.80)#5,753 |
| 69. | Redmond | 8.9% | 6.4%(+2.55)#69 | 6.2%(+2.75)#5,816 |
| 70. | Woodland Hills | 8.9% | 6.4%(+2.51)#70 | 6.2%(+2.71)#5,870 |
| 71. | Nephi | 8.9% | 6.4%(+2.50)#71 | 6.2%(+2.70)#5,891 |
| 72. | Smithfield | 8.8% | 6.4%(+2.46)#72 | 6.2%(+2.66)#5,952 |
| 73. | Corinne | 8.8% | 6.4%(+2.46)#73 | 6.2%(+2.66)#5,958 |
| 74. | Mount Pleasant | 8.8% | 6.4%(+2.44)#74 | 6.2%(+2.63)#5,992 |
| 75. | Woods Cross | 8.8% | 6.4%(+2.43)#75 | 6.2%(+2.62)#6,005 |
| 76. | Rush Valley | 8.8% | 6.4%(+2.41)#76 | 6.2%(+2.61)#6,021 |
| 77. | Alpine | 8.8% | 6.4%(+2.41)#77 | 6.2%(+2.60)#6,028 |
| 78. | Delta | 8.8% | 6.4%(+2.39)#78 | 6.2%(+2.58)#6,072 |
| 79. | Heber | 8.7% | 6.4%(+2.32)#79 | 6.2%(+2.51)#6,158 |
| 80. | Kanab | 8.7% | 6.4%(+2.27)#80 | 6.2%(+2.47)#6,220 |
| 81. | Farmington | 8.5% | 6.4%(+2.13)#81 | 6.2%(+2.33)#6,457 |
| 82. | Mountain Green | 8.5% | 6.4%(+2.10)#82 | 6.2%(+2.29)#6,496 |
| 83. | Spanish Fork | 8.5% | 6.4%(+2.09)#83 | 6.2%(+2.29)#6,507 |
| 84. | Alton | 8.5% | 6.4%(+2.07)#84 | 6.2%(+2.27)#6,542 |
| 85. | Kaysville | 8.4% | 6.4%(+2.06)#85 | 6.2%(+2.25)#6,559 |
| 86. | Logan | 8.3% | 6.4%(+1.94)#86 | 6.2%(+2.13)#6,782 |
| 87. | West Haven | 8.3% | 6.4%(+1.88)#87 | 6.2%(+2.08)#6,861 |
| 88. | Aneth | 8.2% | 6.4%(+1.86)#88 | 6.2%(+2.05)#6,901 |
| 89. | Beaver | 8.2% | 6.4%(+1.81)#89 | 6.2%(+2.00)#6,991 |
| 90. | Providence | 8.2% | 6.4%(+1.79)#90 | 6.2%(+1.98)#7,030 |
| 91. | Hyde Park | 8.1% | 6.4%(+1.75)#91 | 6.2%(+1.95)#7,103 |
| 92. | Big Water | 8.0% | 6.4%(+1.65)#92 | 6.2%(+1.85)#7,295 |
| 93. | Holden | 7.9% | 6.4%(+1.56)#93 | 6.2%(+1.75)#7,468 |
| 94. | Sterling | 7.9% | 6.4%(+1.56)#94 | 6.2%(+1.75)#7,471 |
| 95. | Cedar City | 7.8% | 6.4%(+1.43)#95 | 6.2%(+1.63)#7,721 |
| 96. | Grantsville | 7.7% | 6.4%(+1.33)#96 | 6.2%(+1.53)#7,911 |
| 97. | Minersville | 7.7% | 6.4%(+1.29)#97 | 6.2%(+1.49)#8,011 |
| 98. | Eagle Mountain | 7.7% | 6.4%(+1.28)#98 | 6.2%(+1.47)#8,032 |
| 99. | Deweyville | 7.6% | 6.4%(+1.21)#99 | 6.2%(+1.40)#8,178 |
| 100. | West Mountain | 7.6% | 6.4%(+1.21)#100 | 6.2%(+1.40)#8,179 |
Common Questions
What are the Top 10 Cities with the Highest Percentage of Population Employed in Education Instruction & Library in Utah?
Top 10 Cities with the Highest Percentage of Population Employed in Education Instruction & Library in Utah are:
#1
100.0%
#2
100.0%
#3
42.0%
#4
38.5%
#5
37.3%
#6
35.1%
#7
34.6%
#8
30.4%
#9
26.5%
#10
25.9%
What city has the Highest Percentage of Population Employed in Education Instruction & Library in Utah?
Clear Creek has the Highest Percentage of Population Employed in Education Instruction & Library in Utah with 100.0%.
What is the Percentage of Population Employed in Education Instruction & Library in the State of Utah?
Percentage of Population Employed in Education Instruction & Library in Utah is 6.4%.
What is the Percentage of Population Employed in Education Instruction & Library in the United States?
Percentage of Population Employed in Education Instruction & Library in the United States is 6.2%.