Cities with the Highest Percentage of Population Employed in Education Instruction & Library in Massachusetts
RELATED REPORTS & OPTIONS
Education Instruction & Library
Massachusetts
Compare Cities
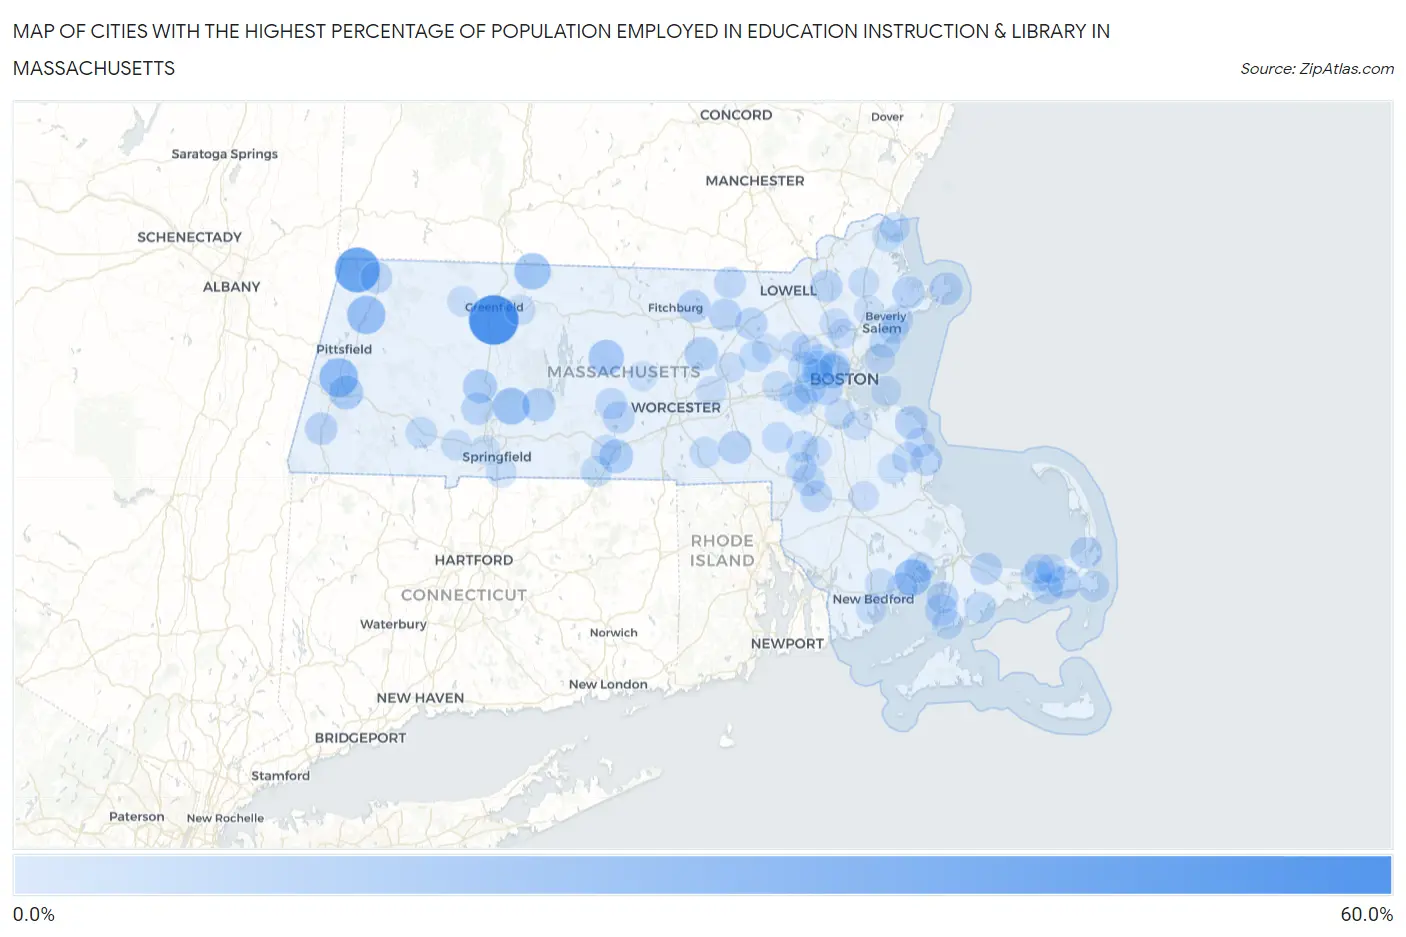
Map of Cities with the Highest Percentage of Population Employed in Education Instruction & Library in Massachusetts
0.0%
60.0%
Cities with the Highest Percentage of Population Employed in Education Instruction & Library in Massachusetts
| City | % Employed | vs State | vs National | |
| 1. | Deerfield | 50.5% | 7.5%(+43.0)#1 | 6.2%(+44.3)#89 |
| 2. | Williamstown | 39.7% | 7.5%(+32.2)#2 | 6.2%(+33.5)#172 |
| 3. | Lenox | 26.3% | 7.5%(+18.7)#3 | 6.2%(+20.1)#454 |
| 4. | Cheshire | 25.0% | 7.5%(+17.5)#4 | 6.2%(+18.8)#496 |
| 5. | West Warren | 23.5% | 7.5%(+16.0)#5 | 6.2%(+17.3)#580 |
| 6. | Granby | 22.2% | 7.5%(+14.7)#6 | 6.2%(+16.1)#666 |
| 7. | Marion Center | 21.6% | 7.5%(+14.1)#7 | 6.2%(+15.5)#719 |
| 8. | Northfield | 21.2% | 7.5%(+13.7)#8 | 6.2%(+15.0)#747 |
| 9. | Barre | 19.0% | 7.5%(+11.5)#9 | 6.2%(+12.9)#970 |
| 10. | Amherst | 18.5% | 7.5%(+11.0)#10 | 6.2%(+12.3)#1,019 |
| 11. | Cambridge | 16.7% | 7.5%(+9.18)#11 | 6.2%(+10.5)#1,300 |
| 12. | Lee | 16.6% | 7.5%(+9.12)#12 | 6.2%(+10.5)#1,337 |
| 13. | Sturbridge | 16.0% | 7.5%(+8.46)#13 | 6.2%(+9.80)#1,471 |
| 14. | Northampton | 15.9% | 7.5%(+8.37)#14 | 6.2%(+9.71)#1,491 |
| 15. | South Lancaster | 15.6% | 7.5%(+8.12)#15 | 6.2%(+9.47)#1,546 |
| 16. | Belchertown | 15.2% | 7.5%(+7.72)#16 | 6.2%(+9.06)#1,654 |
| 17. | Northwest Harwich | 14.3% | 7.5%(+6.76)#17 | 6.2%(+8.10)#1,893 |
| 18. | North Scituate | 13.9% | 7.5%(+6.40)#18 | 6.2%(+7.74)#2,055 |
| 19. | Cedar Crest | 13.7% | 7.5%(+6.22)#19 | 6.2%(+7.56)#2,123 |
| 20. | Hopedale | 13.7% | 7.5%(+6.17)#20 | 6.2%(+7.51)#2,142 |
| 21. | Ayer | 13.6% | 7.5%(+6.07)#21 | 6.2%(+7.41)#2,183 |
| 22. | Brookline | 13.5% | 7.5%(+5.98)#22 | 6.2%(+7.33)#2,215 |
| 23. | Rockport | 13.5% | 7.5%(+5.98)#23 | 6.2%(+7.32)#2,217 |
| 24. | Essex | 13.5% | 7.5%(+5.92)#24 | 6.2%(+7.27)#2,235 |
| 25. | Lunenburg | 13.4% | 7.5%(+5.87)#25 | 6.2%(+7.21)#2,262 |
| 26. | Great Barrington | 13.0% | 7.5%(+5.51)#26 | 6.2%(+6.85)#2,414 |
| 27. | Easthampton Town | 12.8% | 7.5%(+5.28)#27 | 6.2%(+6.62)#2,527 |
| 28. | West Falmouth | 12.8% | 7.5%(+5.24)#28 | 6.2%(+6.58)#2,545 |
| 29. | Littleton Common | 12.7% | 7.5%(+5.13)#29 | 6.2%(+6.47)#2,590 |
| 30. | Andover | 12.6% | 7.5%(+5.07)#30 | 6.2%(+6.41)#2,624 |
| 31. | North Adams | 12.1% | 7.5%(+4.53)#31 | 6.2%(+5.87)#2,894 |
| 32. | East Brookfield | 11.9% | 7.5%(+4.36)#32 | 6.2%(+5.71)#2,974 |
| 33. | Marshfield | 11.8% | 7.5%(+4.27)#33 | 6.2%(+5.62)#3,012 |
| 34. | East Sandwich | 11.8% | 7.5%(+4.23)#34 | 6.2%(+5.57)#3,053 |
| 35. | Mansfield Center | 11.7% | 7.5%(+4.21)#35 | 6.2%(+5.56)#3,063 |
| 36. | Newton | 11.6% | 7.5%(+4.09)#36 | 6.2%(+5.43)#3,145 |
| 37. | Orleans | 11.6% | 7.5%(+4.08)#37 | 6.2%(+5.42)#3,151 |
| 38. | North Falmouth | 11.6% | 7.5%(+4.06)#38 | 6.2%(+5.40)#3,167 |
| 39. | Norton Center | 11.4% | 7.5%(+3.91)#39 | 6.2%(+5.25)#3,258 |
| 40. | East Pepperell | 11.2% | 7.5%(+3.72)#40 | 6.2%(+5.06)#3,418 |
| 41. | North Brookfield | 11.2% | 7.5%(+3.66)#41 | 6.2%(+5.00)#3,467 |
| 42. | South Dennis | 11.1% | 7.5%(+3.60)#42 | 6.2%(+4.94)#3,509 |
| 43. | Arlington | 11.1% | 7.5%(+3.53)#43 | 6.2%(+4.88)#3,571 |
| 44. | West Dennis | 10.9% | 7.5%(+3.39)#44 | 6.2%(+4.74)#3,682 |
| 45. | Green Harbor | 10.8% | 7.5%(+3.28)#45 | 6.2%(+4.62)#3,764 |
| 46. | Maynard | 10.8% | 7.5%(+3.26)#46 | 6.2%(+4.61)#3,778 |
| 47. | Swampscott | 10.7% | 7.5%(+3.21)#47 | 6.2%(+4.55)#3,813 |
| 48. | Mashpee Neck | 10.7% | 7.5%(+3.16)#48 | 6.2%(+4.51)#3,848 |
| 49. | Blandford | 10.7% | 7.5%(+3.15)#49 | 6.2%(+4.49)#3,863 |
| 50. | Beverly | 10.6% | 7.5%(+3.12)#50 | 6.2%(+4.46)#3,886 |
| 51. | Yarmouth Port | 10.6% | 7.5%(+3.11)#51 | 6.2%(+4.46)#3,888 |
| 52. | Belmont | 10.6% | 7.5%(+3.04)#52 | 6.2%(+4.39)#3,951 |
| 53. | Needham | 10.5% | 7.5%(+3.02)#53 | 6.2%(+4.36)#3,970 |
| 54. | Walpole | 10.5% | 7.5%(+2.94)#54 | 6.2%(+4.29)#4,038 |
| 55. | Wellesley | 10.3% | 7.5%(+2.81)#55 | 6.2%(+4.15)#4,160 |
| 56. | Holland | 10.3% | 7.5%(+2.75)#56 | 6.2%(+4.10)#4,204 |
| 57. | Waltham | 10.2% | 7.5%(+2.69)#57 | 6.2%(+4.04)#4,260 |
| 58. | Somerville | 10.1% | 7.5%(+2.60)#58 | 6.2%(+3.94)#4,375 |
| 59. | Newburyport | 10.1% | 7.5%(+2.53)#59 | 6.2%(+3.88)#4,448 |
| 60. | Whitinsville | 10.0% | 7.5%(+2.49)#60 | 6.2%(+3.83)#4,487 |
| 61. | Foxborough | 9.9% | 7.5%(+2.38)#61 | 6.2%(+3.72)#4,610 |
| 62. | Chatham | 9.9% | 7.5%(+2.35)#62 | 6.2%(+3.69)#4,638 |
| 63. | Weweantic | 9.8% | 7.5%(+2.22)#63 | 6.2%(+3.57)#4,816 |
| 64. | Millis Clicquot | 9.6% | 7.5%(+2.04)#64 | 6.2%(+3.38)#5,014 |
| 65. | Watertown Town | 9.5% | 7.5%(+1.99)#65 | 6.2%(+3.34)#5,070 |
| 66. | Falmouth | 9.5% | 7.5%(+1.95)#66 | 6.2%(+3.30)#5,111 |
| 67. | Mattapoisett Center | 9.4% | 7.5%(+1.86)#67 | 6.2%(+3.21)#5,219 |
| 68. | Greenfield | 9.4% | 7.5%(+1.84)#68 | 6.2%(+3.19)#5,244 |
| 69. | Milton | 9.4% | 7.5%(+1.83)#69 | 6.2%(+3.17)#5,257 |
| 70. | Lexington | 9.3% | 7.5%(+1.82)#70 | 6.2%(+3.16)#5,272 |
| 71. | Northborough | 9.3% | 7.5%(+1.81)#71 | 6.2%(+3.16)#5,282 |
| 72. | Millers Falls | 9.3% | 7.5%(+1.80)#72 | 6.2%(+3.14)#5,290 |
| 73. | Longmeadow | 9.3% | 7.5%(+1.73)#73 | 6.2%(+3.07)#5,389 |
| 74. | Reading | 9.2% | 7.5%(+1.65)#74 | 6.2%(+2.99)#5,480 |
| 75. | North Pembroke | 9.1% | 7.5%(+1.56)#75 | 6.2%(+2.90)#5,624 |
| 76. | Salisbury | 9.0% | 7.5%(+1.52)#76 | 6.2%(+2.86)#5,665 |
| 77. | Shelburne Falls | 9.0% | 7.5%(+1.52)#77 | 6.2%(+2.86)#5,670 |
| 78. | Westfield | 9.0% | 7.5%(+1.47)#78 | 6.2%(+2.81)#5,730 |
| 79. | Fiskdale | 9.0% | 7.5%(+1.44)#79 | 6.2%(+2.79)#5,765 |
| 80. | Acushnet Center | 8.9% | 7.5%(+1.42)#80 | 6.2%(+2.76)#5,798 |
| 81. | Bliss Corner | 8.9% | 7.5%(+1.39)#81 | 6.2%(+2.73)#5,840 |
| 82. | Salem | 8.8% | 7.5%(+1.26)#82 | 6.2%(+2.60)#6,030 |
| 83. | Dennis | 8.8% | 7.5%(+1.23)#83 | 6.2%(+2.57)#6,086 |
| 84. | Boxford | 8.7% | 7.5%(+1.20)#84 | 6.2%(+2.55)#6,119 |
| 85. | Cochituate | 8.7% | 7.5%(+1.19)#85 | 6.2%(+2.53)#6,138 |
| 86. | Hudson | 8.7% | 7.5%(+1.16)#86 | 6.2%(+2.51)#6,182 |
| 87. | Sharon | 8.6% | 7.5%(+1.10)#87 | 6.2%(+2.44)#6,266 |
| 88. | Braintree Town | 8.6% | 7.5%(+1.04)#88 | 6.2%(+2.38)#6,375 |
| 89. | Hanscom Afb | 8.4% | 7.5%(+0.892)#89 | 6.2%(+2.24)#6,585 |
| 90. | Marshfield Hills | 8.3% | 7.5%(+0.774)#90 | 6.2%(+2.12)#6,803 |
| 91. | Bridgewater Town | 8.3% | 7.5%(+0.728)#91 | 6.2%(+2.07)#6,865 |
| 92. | Wakefield | 8.3% | 7.5%(+0.724)#92 | 6.2%(+2.07)#6,872 |
| 93. | Hull | 8.1% | 7.5%(+0.584)#93 | 6.2%(+1.93)#7,149 |
| 94. | Hanson | 8.1% | 7.5%(+0.555)#94 | 6.2%(+1.90)#7,200 |
| 95. | East Dennis | 8.0% | 7.5%(+0.436)#95 | 6.2%(+1.78)#7,419 |
| 96. | Rutland | 7.9% | 7.5%(+0.357)#96 | 6.2%(+1.70)#7,574 |
| 97. | West Springfield Town | 7.9% | 7.5%(+0.348)#97 | 6.2%(+1.69)#7,587 |
| 98. | Nahant | 7.8% | 7.5%(+0.315)#98 | 6.2%(+1.66)#7,646 |
| 99. | West Concord | 7.6% | 7.5%(+0.107)#99 | 6.2%(+1.45)#8,071 |
| 100. | Danvers | 7.6% | 7.5%(+0.085)#100 | 6.2%(+1.43)#8,117 |
Common Questions
What are the Top 10 Cities with the Highest Percentage of Population Employed in Education Instruction & Library in Massachusetts?
Top 10 Cities with the Highest Percentage of Population Employed in Education Instruction & Library in Massachusetts are:
#1
50.5%
#2
39.7%
#3
26.3%
#4
25.0%
#5
22.2%
#6
21.6%
#7
21.2%
#8
19.0%
#9
16.7%
#10
16.6%
What city has the Highest Percentage of Population Employed in Education Instruction & Library in Massachusetts?
Deerfield has the Highest Percentage of Population Employed in Education Instruction & Library in Massachusetts with 50.5%.
What is the Percentage of Population Employed in Education Instruction & Library in the State of Massachusetts?
Percentage of Population Employed in Education Instruction & Library in Massachusetts is 7.5%.
What is the Percentage of Population Employed in Education Instruction & Library in the United States?
Percentage of Population Employed in Education Instruction & Library in the United States is 6.2%.