Cities with the Highest Percentage of Population Employed in Education Instruction & Library in South Carolina
RELATED REPORTS & OPTIONS
Education Instruction & Library
South Carolina
Compare Cities
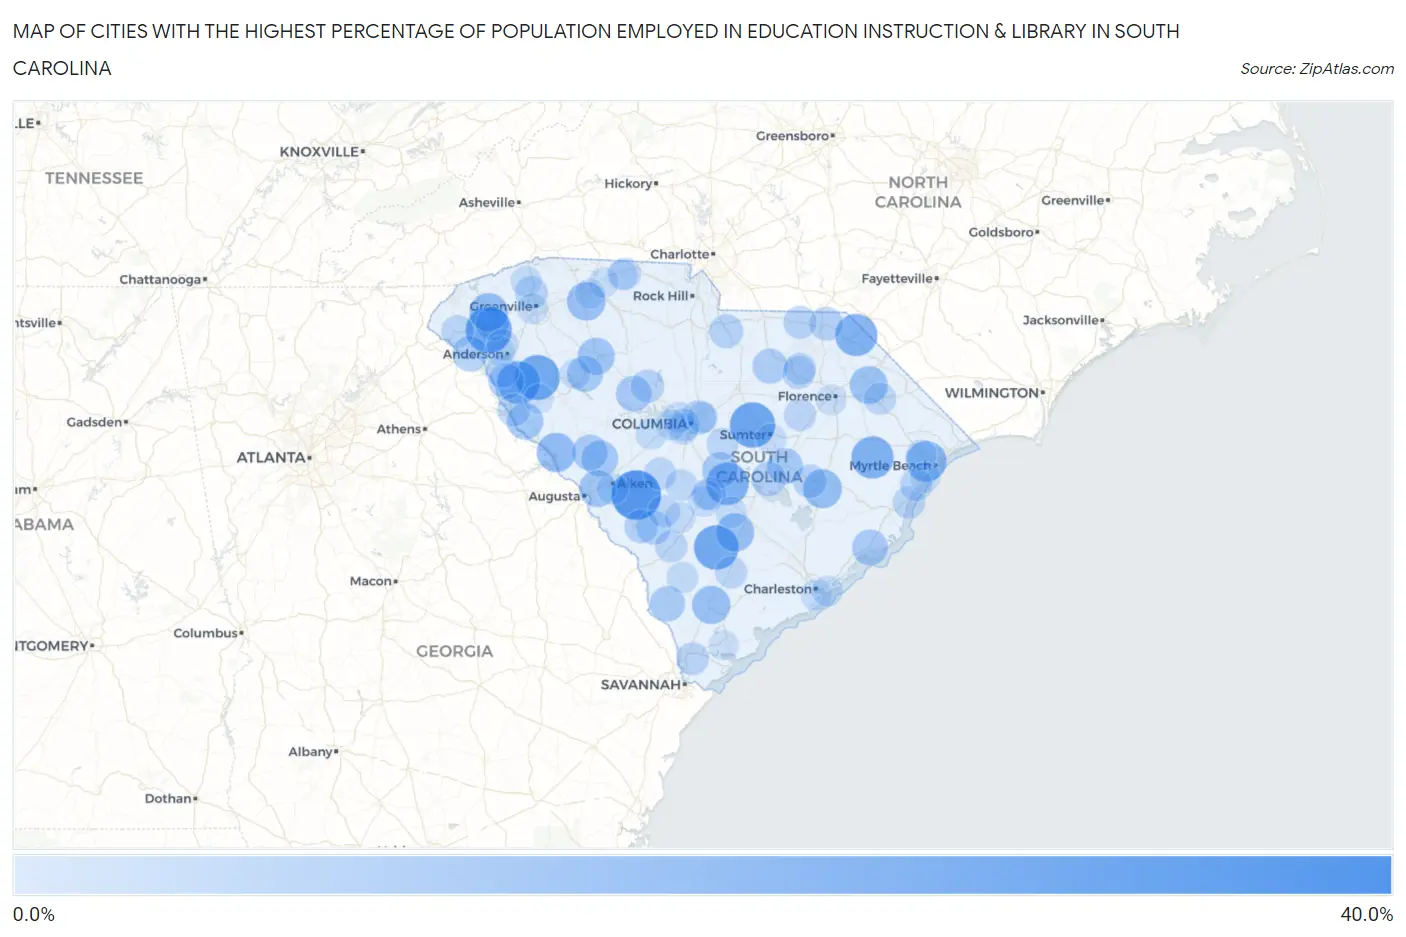
Map of Cities with the Highest Percentage of Population Employed in Education Instruction & Library in South Carolina
0.0%
40.0%
Cities with the Highest Percentage of Population Employed in Education Instruction & Library in South Carolina
| City | % Employed | vs State | vs National | |
| 1. | Adams Run | 31.2% | 6.2%(+25.1)#1 | 6.2%(+25.1)#303 |
| 2. | Windsor | 29.8% | 6.2%(+23.7)#2 | 6.2%(+23.6)#338 |
| 3. | Clemson | 25.6% | 6.2%(+19.5)#3 | 6.2%(+19.5)#478 |
| 4. | Oakland | 25.0% | 6.2%(+18.8)#4 | 6.2%(+18.8)#494 |
| 5. | South Union | 24.8% | 6.2%(+18.6)#5 | 6.2%(+18.6)#511 |
| 6. | Due West | 24.4% | 6.2%(+18.2)#6 | 6.2%(+18.2)#529 |
| 7. | Smoaks | 24.1% | 6.2%(+17.9)#7 | 6.2%(+17.9)#543 |
| 8. | Antreville | 22.4% | 6.2%(+16.2)#8 | 6.2%(+16.2)#660 |
| 9. | Cameron | 21.8% | 6.2%(+15.6)#9 | 6.2%(+15.6)#706 |
| 10. | Hemingway | 21.4% | 6.2%(+15.3)#10 | 6.2%(+15.2)#726 |
| 11. | Tatum | 21.4% | 6.2%(+15.3)#11 | 6.2%(+15.2)#728 |
| 12. | Forestbrook | 19.7% | 6.2%(+13.5)#12 | 6.2%(+13.5)#886 |
| 13. | Buford | 18.2% | 6.2%(+12.1)#13 | 6.2%(+12.0)#1,057 |
| 14. | Parksville | 17.9% | 6.2%(+11.8)#14 | 6.2%(+11.8)#1,094 |
| 15. | Lane | 17.8% | 6.2%(+11.6)#15 | 6.2%(+11.6)#1,128 |
| 16. | Six Mile | 17.6% | 6.2%(+11.4)#16 | 6.2%(+11.4)#1,148 |
| 17. | Roebuck | 17.3% | 6.2%(+11.2)#17 | 6.2%(+11.2)#1,182 |
| 18. | Reevesville | 17.2% | 6.2%(+11.1)#18 | 6.2%(+11.1)#1,202 |
| 19. | Yemassee | 16.9% | 6.2%(+10.8)#19 | 6.2%(+10.8)#1,261 |
| 20. | Sellers | 16.7% | 6.2%(+10.5)#20 | 6.2%(+10.5)#1,322 |
| 21. | Clinton | 15.7% | 6.2%(+9.57)#21 | 6.2%(+9.55)#1,528 |
| 22. | Burnettown | 15.5% | 6.2%(+9.30)#22 | 6.2%(+9.28)#1,599 |
| 23. | Mount Carmel | 15.1% | 6.2%(+8.93)#23 | 6.2%(+8.91)#1,692 |
| 24. | Trenton | 14.9% | 6.2%(+8.72)#24 | 6.2%(+8.70)#1,744 |
| 25. | Mountville | 14.4% | 6.2%(+8.27)#25 | 6.2%(+8.25)#1,862 |
| 26. | Manning | 14.4% | 6.2%(+8.21)#26 | 6.2%(+8.19)#1,879 |
| 27. | Mcclellanville | 14.3% | 6.2%(+8.12)#27 | 6.2%(+8.10)#1,899 |
| 28. | Edgefield | 14.3% | 6.2%(+8.09)#28 | 6.2%(+8.07)#1,950 |
| 29. | St Matthews | 14.2% | 6.2%(+8.06)#29 | 6.2%(+8.04)#1,961 |
| 30. | Prosperity | 14.1% | 6.2%(+7.94)#30 | 6.2%(+7.92)#1,998 |
| 31. | Iva | 13.8% | 6.2%(+7.67)#31 | 6.2%(+7.65)#2,084 |
| 32. | Fair Play | 13.7% | 6.2%(+7.57)#32 | 6.2%(+7.55)#2,130 |
| 33. | Scotia | 13.6% | 6.2%(+7.47)#33 | 6.2%(+7.45)#2,165 |
| 34. | Bethune | 13.5% | 6.2%(+7.35)#34 | 6.2%(+7.33)#2,212 |
| 35. | Unity | 12.9% | 6.2%(+6.75)#35 | 6.2%(+6.74)#2,470 |
| 36. | Danwood | 12.9% | 6.2%(+6.70)#36 | 6.2%(+6.68)#2,503 |
| 37. | Barnwell | 12.7% | 6.2%(+6.57)#37 | 6.2%(+6.55)#2,556 |
| 38. | Summerton | 12.7% | 6.2%(+6.50)#38 | 6.2%(+6.48)#2,586 |
| 39. | Forest Acres | 12.6% | 6.2%(+6.42)#39 | 6.2%(+6.40)#2,632 |
| 40. | Elgin | 12.4% | 6.2%(+6.22)#40 | 6.2%(+6.20)#2,730 |
| 41. | Snelling | 12.0% | 6.2%(+5.87)#41 | 6.2%(+5.85)#2,905 |
| 42. | Wallace | 11.8% | 6.2%(+5.68)#42 | 6.2%(+5.66)#2,998 |
| 43. | Greeleyville | 11.7% | 6.2%(+5.56)#43 | 6.2%(+5.54)#3,069 |
| 44. | Central | 11.7% | 6.2%(+5.55)#44 | 6.2%(+5.53)#3,073 |
| 45. | Pomaria | 11.6% | 6.2%(+5.46)#45 | 6.2%(+5.44)#3,135 |
| 46. | Chesterfield | 11.5% | 6.2%(+5.29)#46 | 6.2%(+5.27)#3,248 |
| 47. | Hartsville | 11.4% | 6.2%(+5.21)#47 | 6.2%(+5.19)#3,312 |
| 48. | Starr | 11.3% | 6.2%(+5.10)#48 | 6.2%(+5.08)#3,396 |
| 49. | Calhoun Falls | 11.2% | 6.2%(+5.06)#49 | 6.2%(+5.04)#3,432 |
| 50. | Travelers Rest | 11.1% | 6.2%(+4.97)#50 | 6.2%(+4.95)#3,500 |
| 51. | Hardeeville | 11.1% | 6.2%(+4.93)#51 | 6.2%(+4.91)#3,559 |
| 52. | Orangeburg | 11.0% | 6.2%(+4.80)#52 | 6.2%(+4.78)#3,647 |
| 53. | Westminster | 10.7% | 6.2%(+4.58)#53 | 6.2%(+4.56)#3,808 |
| 54. | Pawleys Island | 10.7% | 6.2%(+4.55)#54 | 6.2%(+4.53)#3,835 |
| 55. | West Columbia | 10.7% | 6.2%(+4.51)#55 | 6.2%(+4.49)#3,865 |
| 56. | Perry | 10.6% | 6.2%(+4.46)#56 | 6.2%(+4.44)#3,903 |
| 57. | Murrells Inlet | 10.6% | 6.2%(+4.40)#57 | 6.2%(+4.38)#3,963 |
| 58. | Lynchburg | 10.5% | 6.2%(+4.36)#58 | 6.2%(+4.34)#3,989 |
| 59. | Ulmer | 10.5% | 6.2%(+4.36)#59 | 6.2%(+4.34)#3,998 |
| 60. | Manville | 10.5% | 6.2%(+4.31)#60 | 6.2%(+4.29)#4,035 |
| 61. | Blackville | 10.4% | 6.2%(+4.22)#61 | 6.2%(+4.20)#4,115 |
| 62. | Walterboro | 10.4% | 6.2%(+4.21)#62 | 6.2%(+4.19)#4,126 |
| 63. | Marion | 10.2% | 6.2%(+4.05)#63 | 6.2%(+4.03)#4,266 |
| 64. | North Hartsville | 10.2% | 6.2%(+3.99)#64 | 6.2%(+3.97)#4,340 |
| 65. | Gadsden | 10.1% | 6.2%(+3.98)#65 | 6.2%(+3.96)#4,352 |
| 66. | Northlake | 10.1% | 6.2%(+3.90)#66 | 6.2%(+3.88)#4,444 |
| 67. | East Gaffney | 10.0% | 6.2%(+3.88)#67 | 6.2%(+3.86)#4,469 |
| 68. | Springdale | 9.8% | 6.2%(+3.66)#68 | 6.2%(+3.64)#4,716 |
| 69. | Livingston | 9.8% | 6.2%(+3.64)#69 | 6.2%(+3.62)#4,755 |
| 70. | Gilbert | 9.7% | 6.2%(+3.51)#70 | 6.2%(+3.49)#4,883 |
| 71. | Aiken | 9.7% | 6.2%(+3.50)#71 | 6.2%(+3.48)#4,911 |
| 72. | Hampton | 9.7% | 6.2%(+3.49)#72 | 6.2%(+3.47)#4,922 |
| 73. | North Santee | 9.5% | 6.2%(+3.36)#73 | 6.2%(+3.34)#5,058 |
| 74. | Cordova | 9.5% | 6.2%(+3.36)#74 | 6.2%(+3.34)#5,061 |
| 75. | Olympia | 9.4% | 6.2%(+3.27)#75 | 6.2%(+3.25)#5,170 |
| 76. | Clemson University | 9.3% | 6.2%(+3.18)#76 | 6.2%(+3.16)#5,278 |
| 77. | James Island | 9.3% | 6.2%(+3.10)#77 | 6.2%(+3.08)#5,369 |
| 78. | Slater Marietta | 9.2% | 6.2%(+3.02)#78 | 6.2%(+3.00)#5,463 |
| 79. | Bowman | 9.2% | 6.2%(+3.02)#79 | 6.2%(+3.00)#5,468 |
| 80. | Seven Oaks | 9.2% | 6.2%(+3.00)#80 | 6.2%(+2.98)#5,497 |
| 81. | Helena | 9.2% | 6.2%(+3.00)#81 | 6.2%(+2.98)#5,505 |
| 82. | Columbia | 9.1% | 6.2%(+2.98)#82 | 6.2%(+2.96)#5,532 |
| 83. | Denmark | 9.0% | 6.2%(+2.85)#83 | 6.2%(+2.83)#5,708 |
| 84. | Sullivan S Island | 9.0% | 6.2%(+2.80)#84 | 6.2%(+2.78)#5,778 |
| 85. | Judson | 9.0% | 6.2%(+2.79)#85 | 6.2%(+2.77)#5,796 |
| 86. | Red Hill | 8.9% | 6.2%(+2.78)#86 | 6.2%(+2.76)#5,799 |
| 87. | Lexington | 8.9% | 6.2%(+2.75)#87 | 6.2%(+2.73)#5,836 |
| 88. | Gaffney | 8.9% | 6.2%(+2.74)#88 | 6.2%(+2.72)#5,857 |
| 89. | Florence | 8.9% | 6.2%(+2.70)#89 | 6.2%(+2.68)#5,915 |
| 90. | Seabrook | 8.9% | 6.2%(+2.69)#90 | 6.2%(+2.67)#5,928 |
| 91. | Waterloo | 8.7% | 6.2%(+2.59)#91 | 6.2%(+2.57)#6,097 |
| 92. | South Sumter | 8.6% | 6.2%(+2.46)#92 | 6.2%(+2.44)#6,270 |
| 93. | Surfside Beach | 8.5% | 6.2%(+2.29)#93 | 6.2%(+2.27)#6,532 |
| 94. | White Knoll | 8.4% | 6.2%(+2.24)#94 | 6.2%(+2.22)#6,613 |
| 95. | Cowpens | 8.4% | 6.2%(+2.22)#95 | 6.2%(+2.20)#6,655 |
| 96. | Edisto | 8.3% | 6.2%(+2.11)#96 | 6.2%(+2.09)#6,834 |
| 97. | Shell Point | 8.1% | 6.2%(+1.93)#97 | 6.2%(+1.91)#7,178 |
| 98. | Spartanburg | 8.1% | 6.2%(+1.90)#98 | 6.2%(+1.88)#7,237 |
| 99. | Centerville | 8.0% | 6.2%(+1.81)#99 | 6.2%(+1.79)#7,398 |
| 100. | Abbeville | 8.0% | 6.2%(+1.81)#100 | 6.2%(+1.79)#7,400 |
Common Questions
What are the Top 10 Cities with the Highest Percentage of Population Employed in Education Instruction & Library in South Carolina?
Top 10 Cities with the Highest Percentage of Population Employed in Education Instruction & Library in South Carolina are:
#1
29.8%
#2
25.6%
#3
25.0%
#4
24.4%
#5
24.1%
#6
22.4%
#7
21.8%
#8
21.4%
#9
21.4%
#10
19.7%
What city has the Highest Percentage of Population Employed in Education Instruction & Library in South Carolina?
Windsor has the Highest Percentage of Population Employed in Education Instruction & Library in South Carolina with 29.8%.
What is the Percentage of Population Employed in Education Instruction & Library in the State of South Carolina?
Percentage of Population Employed in Education Instruction & Library in South Carolina is 6.2%.
What is the Percentage of Population Employed in Education Instruction & Library in the United States?
Percentage of Population Employed in Education Instruction & Library in the United States is 6.2%.