Cities with the Highest Percentage of Population Employed in Education Instruction & Library in Oregon
RELATED REPORTS & OPTIONS
Education Instruction & Library
Oregon
Compare Cities
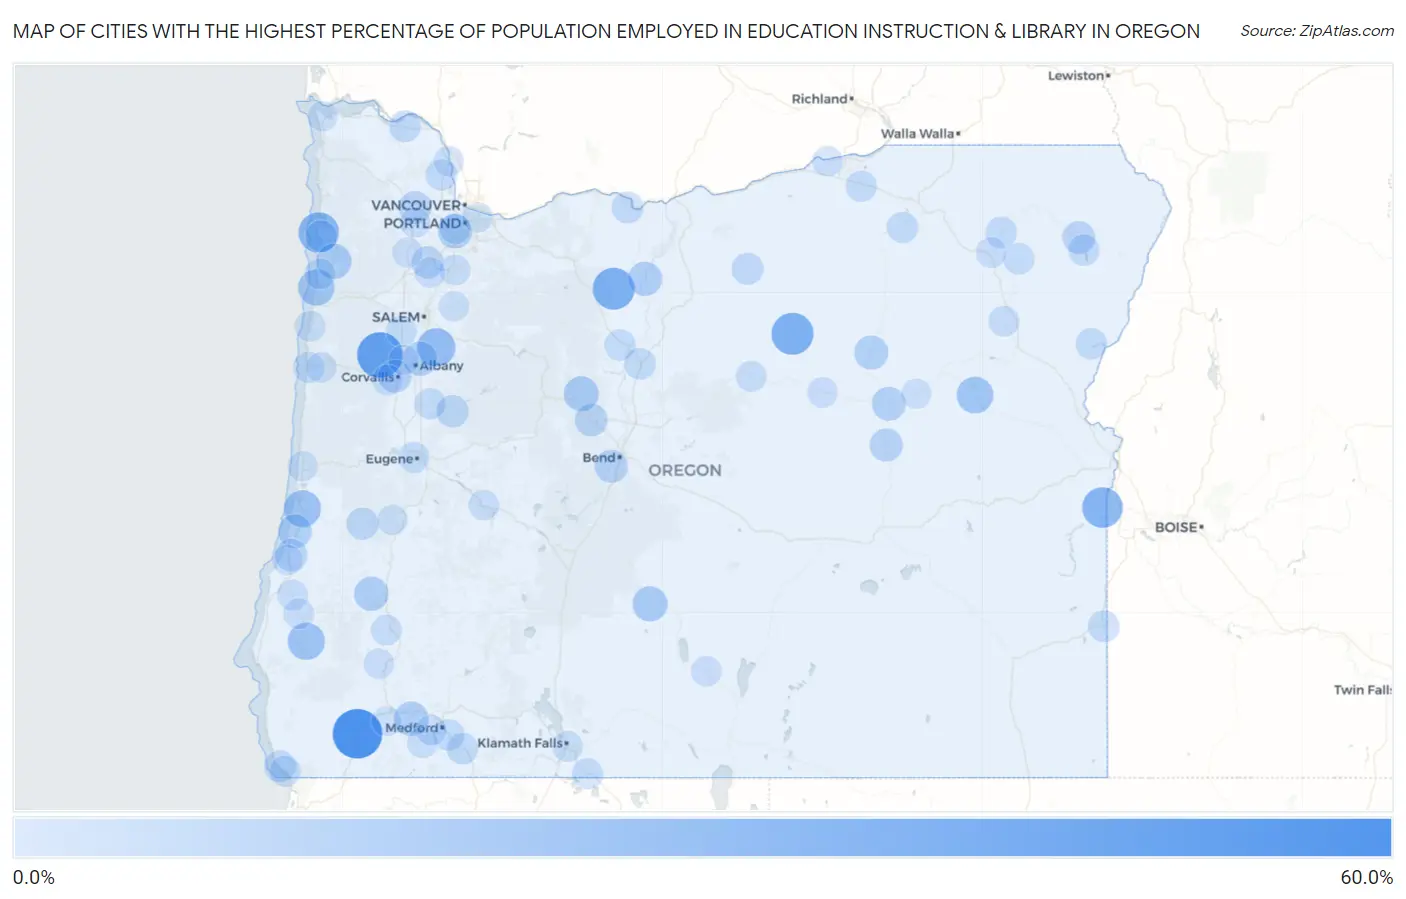
Map of Cities with the Highest Percentage of Population Employed in Education Instruction & Library in Oregon
0.0%
60.0%
Cities with the Highest Percentage of Population Employed in Education Instruction & Library in Oregon
| City | % Employed | vs State | vs National | |
| 1. | Selma | 55.3% | 5.6%(+49.6)#1 | 6.2%(+49.1)#68 |
| 2. | Kings Valley | 45.3% | 5.6%(+39.7)#2 | 6.2%(+39.1)#131 |
| 3. | Spray | 35.8% | 5.6%(+30.2)#3 | 6.2%(+29.7)#223 |
| 4. | Pine Grove | 35.7% | 5.6%(+30.1)#4 | 6.2%(+29.5)#227 |
| 5. | Oceanside | 32.3% | 5.6%(+26.6)#5 | 6.2%(+26.1)#282 |
| 6. | Adrian | 32.3% | 5.6%(+26.6)#6 | 6.2%(+26.1)#283 |
| 7. | Mckay | 27.7% | 5.6%(+22.1)#7 | 6.2%(+21.5)#394 |
| 8. | Marion | 27.0% | 5.6%(+21.4)#8 | 6.2%(+20.8)#421 |
| 9. | Powers | 23.9% | 5.6%(+18.3)#9 | 6.2%(+17.7)#553 |
| 10. | Gardiner | 23.5% | 5.6%(+17.9)#10 | 6.2%(+17.3)#575 |
| 11. | Unity | 22.2% | 5.6%(+16.6)#11 | 6.2%(+16.0)#672 |
| 12. | Neskowin | 21.8% | 5.6%(+16.2)#12 | 6.2%(+15.7)#704 |
| 13. | Trent | 21.3% | 5.6%(+15.6)#13 | 6.2%(+15.1)#739 |
| 14. | Neotsu | 20.1% | 5.6%(+14.5)#14 | 6.2%(+13.9)#843 |
| 15. | Beaver | 19.2% | 5.6%(+13.6)#15 | 6.2%(+13.0)#941 |
| 16. | Orient | 18.8% | 5.6%(+13.2)#16 | 6.2%(+12.6)#988 |
| 17. | Silver Lake | 18.7% | 5.6%(+13.0)#17 | 6.2%(+12.5)#1,004 |
| 18. | Camp Sherman | 18.2% | 5.6%(+12.5)#18 | 6.2%(+12.0)#1,060 |
| 19. | Foots Creek | 17.3% | 5.6%(+11.7)#19 | 6.2%(+11.1)#1,193 |
| 20. | Lookingglass | 17.0% | 5.6%(+11.4)#20 | 6.2%(+10.9)#1,245 |
| 21. | Millersburg | 17.0% | 5.6%(+11.3)#21 | 6.2%(+10.8)#1,256 |
| 22. | Garden Home Whitford | 16.6% | 5.6%(+11.0)#22 | 6.2%(+10.4)#1,343 |
| 23. | Maupin | 16.4% | 5.6%(+10.8)#23 | 6.2%(+10.2)#1,382 |
| 24. | Long Creek | 15.9% | 5.6%(+10.3)#24 | 6.2%(+9.73)#1,487 |
| 25. | Lakeside | 15.7% | 5.6%(+10.0)#25 | 6.2%(+9.50)#1,536 |
| 26. | Canyon City | 15.4% | 5.6%(+9.79)#26 | 6.2%(+9.24)#1,608 |
| 27. | Corvallis | 14.0% | 5.6%(+8.39)#27 | 6.2%(+7.84)#2,027 |
| 28. | Seneca | 13.8% | 5.6%(+8.16)#28 | 6.2%(+7.61)#2,106 |
| 29. | River Point | 13.7% | 5.6%(+8.06)#29 | 6.2%(+7.52)#2,140 |
| 30. | Seventh Mountain | 13.7% | 5.6%(+8.02)#30 | 6.2%(+7.48)#2,153 |
| 31. | Sisters | 13.2% | 5.6%(+7.60)#31 | 6.2%(+7.06)#2,326 |
| 32. | Banks | 13.1% | 5.6%(+7.49)#32 | 6.2%(+6.94)#2,369 |
| 33. | Enterprise | 13.0% | 5.6%(+7.36)#33 | 6.2%(+6.81)#2,430 |
| 34. | Glasgow | 12.3% | 5.6%(+6.70)#34 | 6.2%(+6.15)#2,752 |
| 35. | Dundee | 11.9% | 5.6%(+6.29)#35 | 6.2%(+5.74)#2,946 |
| 36. | Holley | 11.9% | 5.6%(+6.29)#36 | 6.2%(+5.74)#2,947 |
| 37. | River Road | 11.7% | 5.6%(+6.04)#37 | 6.2%(+5.49)#3,091 |
| 38. | Green Meadows | 11.6% | 5.6%(+5.95)#38 | 6.2%(+5.41)#3,164 |
| 39. | Elkton | 11.5% | 5.6%(+5.90)#39 | 6.2%(+5.36)#3,193 |
| 40. | Netarts | 11.2% | 5.6%(+5.52)#40 | 6.2%(+4.97)#3,488 |
| 41. | Chenoweth | 10.8% | 5.6%(+5.15)#41 | 6.2%(+4.60)#3,784 |
| 42. | Condon | 10.8% | 5.6%(+5.13)#42 | 6.2%(+4.59)#3,792 |
| 43. | Brookings | 10.7% | 5.6%(+5.08)#43 | 6.2%(+4.54)#3,823 |
| 44. | Clatskanie | 10.4% | 5.6%(+4.80)#44 | 6.2%(+4.26)#4,070 |
| 45. | Jordan Valley | 10.4% | 5.6%(+4.75)#45 | 6.2%(+4.21)#4,114 |
| 46. | Imbler | 10.3% | 5.6%(+4.71)#46 | 6.2%(+4.16)#4,148 |
| 47. | Madras | 10.2% | 5.6%(+4.57)#47 | 6.2%(+4.03)#4,272 |
| 48. | Jasper | 10.1% | 5.6%(+4.45)#48 | 6.2%(+3.90)#4,419 |
| 49. | Ashland | 10.0% | 5.6%(+4.38)#49 | 6.2%(+3.83)#4,488 |
| 50. | Phoenix | 10.0% | 5.6%(+4.37)#50 | 6.2%(+3.82)#4,494 |
| 51. | Prineville Lake Acres | 9.9% | 5.6%(+4.31)#51 | 6.2%(+3.76)#4,576 |
| 52. | Cheshire | 9.8% | 5.6%(+4.18)#52 | 6.2%(+3.64)#4,721 |
| 53. | Richland | 9.8% | 5.6%(+4.12)#53 | 6.2%(+3.57)#4,810 |
| 54. | Pilot Rock | 9.7% | 5.6%(+4.08)#54 | 6.2%(+3.53)#4,853 |
| 55. | Joseph | 9.7% | 5.6%(+4.05)#55 | 6.2%(+3.50)#4,877 |
| 56. | Warren | 9.6% | 5.6%(+3.96)#56 | 6.2%(+3.41)#4,980 |
| 57. | Eugene | 9.6% | 5.6%(+3.93)#57 | 6.2%(+3.39)#5,009 |
| 58. | Cove | 9.6% | 5.6%(+3.92)#58 | 6.2%(+3.38)#5,017 |
| 59. | Warm Springs | 9.5% | 5.6%(+3.91)#59 | 6.2%(+3.37)#5,031 |
| 60. | Brownsville | 9.4% | 5.6%(+3.73)#60 | 6.2%(+3.18)#5,245 |
| 61. | Harbor | 9.3% | 5.6%(+3.66)#61 | 6.2%(+3.11)#5,336 |
| 62. | Newport | 9.2% | 5.6%(+3.55)#62 | 6.2%(+3.00)#5,462 |
| 63. | Monmouth | 9.0% | 5.6%(+3.41)#63 | 6.2%(+2.86)#5,667 |
| 64. | Merrill | 9.0% | 5.6%(+3.34)#64 | 6.2%(+2.79)#5,755 |
| 65. | Echo | 8.9% | 5.6%(+3.25)#65 | 6.2%(+2.71)#5,877 |
| 66. | Heceta Beach | 8.7% | 5.6%(+3.07)#66 | 6.2%(+2.52)#6,152 |
| 67. | Klamath Falls | 8.5% | 5.6%(+2.86)#67 | 6.2%(+2.32)#6,464 |
| 68. | Riddle | 8.4% | 5.6%(+2.78)#68 | 6.2%(+2.23)#6,597 |
| 69. | Philomath | 8.4% | 5.6%(+2.74)#69 | 6.2%(+2.19)#6,663 |
| 70. | Pacific City | 8.4% | 5.6%(+2.72)#70 | 6.2%(+2.18)#6,689 |
| 71. | Haines | 8.3% | 5.6%(+2.70)#71 | 6.2%(+2.15)#6,751 |
| 72. | Mitchell | 8.3% | 5.6%(+2.70)#72 | 6.2%(+2.15)#6,754 |
| 73. | Coquille | 8.3% | 5.6%(+2.64)#73 | 6.2%(+2.10)#6,827 |
| 74. | Ruch | 8.2% | 5.6%(+2.54)#74 | 6.2%(+2.00)#7,004 |
| 75. | Raleigh Hills | 8.1% | 5.6%(+2.44)#75 | 6.2%(+1.90)#7,212 |
| 76. | Aurora | 8.1% | 5.6%(+2.42)#76 | 6.2%(+1.88)#7,254 |
| 77. | Falcon Heights | 8.0% | 5.6%(+2.33)#77 | 6.2%(+1.78)#7,421 |
| 78. | Lincoln Beach | 8.0% | 5.6%(+2.32)#78 | 6.2%(+1.77)#7,431 |
| 79. | Jacksonville | 7.9% | 5.6%(+2.27)#79 | 6.2%(+1.72)#7,540 |
| 80. | Island City | 7.9% | 5.6%(+2.26)#80 | 6.2%(+1.72)#7,545 |
| 81. | Westfir | 7.9% | 5.6%(+2.24)#81 | 6.2%(+1.69)#7,590 |
| 82. | Glendale | 7.9% | 5.6%(+2.23)#82 | 6.2%(+1.69)#7,597 |
| 83. | Myrtle Point | 7.9% | 5.6%(+2.23)#83 | 6.2%(+1.69)#7,599 |
| 84. | North Bend | 7.7% | 5.6%(+2.07)#84 | 6.2%(+1.52)#7,926 |
| 85. | Paisley | 7.7% | 5.6%(+2.06)#85 | 6.2%(+1.51)#7,959 |
| 86. | Dayville | 7.7% | 5.6%(+2.06)#86 | 6.2%(+1.51)#7,962 |
| 87. | Irrigon | 7.7% | 5.6%(+2.05)#87 | 6.2%(+1.50)#7,994 |
| 88. | Columbia City | 7.6% | 5.6%(+2.00)#88 | 6.2%(+1.45)#8,077 |
| 89. | Adair Village | 7.5% | 5.6%(+1.90)#89 | 6.2%(+1.35)#8,292 |
| 90. | Toledo | 7.5% | 5.6%(+1.89)#90 | 6.2%(+1.35)#8,312 |
| 91. | St Paul | 7.4% | 5.6%(+1.77)#91 | 6.2%(+1.22)#8,566 |
| 92. | Silverton | 7.4% | 5.6%(+1.76)#92 | 6.2%(+1.21)#8,596 |
| 93. | Drain | 7.3% | 5.6%(+1.70)#93 | 6.2%(+1.15)#8,702 |
| 94. | Yamhill | 7.3% | 5.6%(+1.65)#94 | 6.2%(+1.11)#8,788 |
| 95. | Forest Grove | 7.2% | 5.6%(+1.58)#95 | 6.2%(+1.04)#8,961 |
| 96. | Prairie City | 6.9% | 5.6%(+1.31)#96 | 6.2%(+0.766)#9,550 |
| 97. | Florence | 6.9% | 5.6%(+1.23)#97 | 6.2%(+0.679)#9,758 |
| 98. | Warrenton | 6.9% | 5.6%(+1.22)#98 | 6.2%(+0.669)#9,783 |
| 99. | Maywood Park | 6.8% | 5.6%(+1.19)#99 | 6.2%(+0.643)#9,850 |
| 100. | New Hope | 6.8% | 5.6%(+1.16)#100 | 6.2%(+0.610)#9,936 |
Common Questions
What are the Top 10 Cities with the Highest Percentage of Population Employed in Education Instruction & Library in Oregon?
Top 10 Cities with the Highest Percentage of Population Employed in Education Instruction & Library in Oregon are:
#1
55.3%
#2
45.3%
#3
35.8%
#4
35.7%
#5
32.3%
#6
32.3%
#7
27.0%
#8
23.9%
#9
23.5%
#10
22.2%
What city has the Highest Percentage of Population Employed in Education Instruction & Library in Oregon?
Selma has the Highest Percentage of Population Employed in Education Instruction & Library in Oregon with 55.3%.
What is the Percentage of Population Employed in Education Instruction & Library in the State of Oregon?
Percentage of Population Employed in Education Instruction & Library in Oregon is 5.6%.
What is the Percentage of Population Employed in Education Instruction & Library in the United States?
Percentage of Population Employed in Education Instruction & Library in the United States is 6.2%.