Zip Codes with the Highest Percentage of Population Employed in Computer & Mathematics in Puyallup, WA
RELATED REPORTS & OPTIONS
Computer & Mathematics
Puyallup
Compare Zip Codes
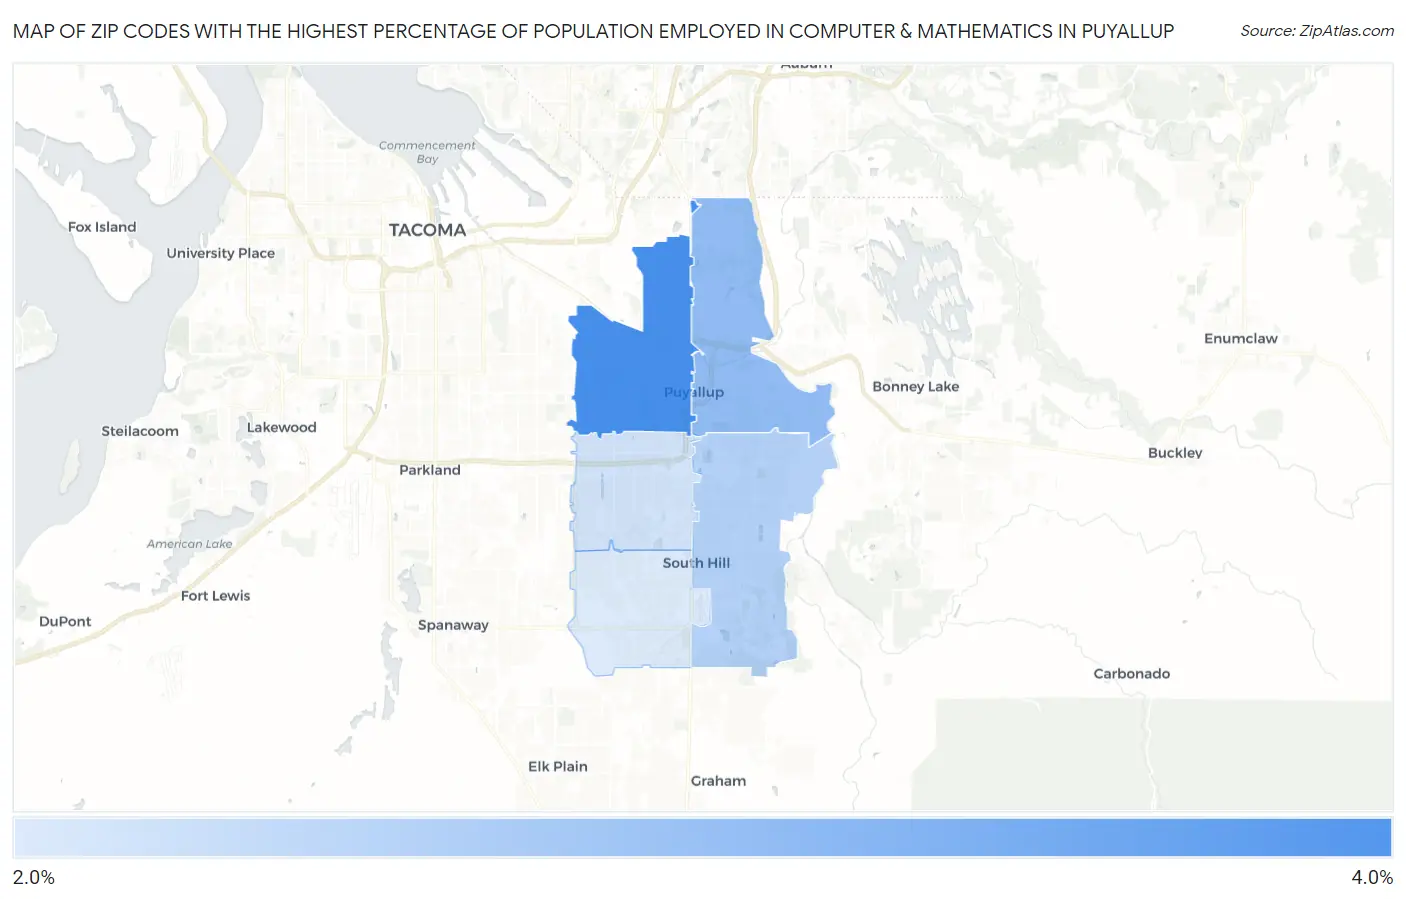
Map of Zip Codes with the Highest Percentage of Population Employed in Computer & Mathematics in Puyallup
2.5%
3.6%
Zip Codes with the Highest Percentage of Population Employed in Computer & Mathematics in Puyallup, WA
| Zip Code | % Employed | vs State | vs National | |
| 1. | 98371 | 3.6% | 6.1%(-2.43)#171 | 3.5%(+0.103)#5,900 |
| 2. | 98372 | 3.1% | 6.1%(-2.99)#211 | 3.5%(-0.452)#7,495 |
| 3. | 98374 | 2.8% | 6.1%(-3.25)#241 | 3.5%(-0.720)#8,428 |
| 4. | 98373 | 2.6% | 6.1%(-3.48)#253 | 3.5%(-0.943)#9,290 |
| 5. | 98375 | 2.5% | 6.1%(-3.57)#262 | 3.5%(-1.03)#9,679 |
1
Common Questions
What are the Top 3 Zip Codes with the Highest Percentage of Population Employed in Computer & Mathematics in Puyallup, WA?
Top 3 Zip Codes with the Highest Percentage of Population Employed in Computer & Mathematics in Puyallup, WA are:
What zip code has the Highest Percentage of Population Employed in Computer & Mathematics in Puyallup, WA?
98371 has the Highest Percentage of Population Employed in Computer & Mathematics in Puyallup, WA with 3.6%.
What is the Percentage of Population Employed in Computer & Mathematics in Puyallup, WA?
Percentage of Population Employed in Computer & Mathematics in Puyallup is 3.1%.
What is the Percentage of Population Employed in Computer & Mathematics in Washington?
Percentage of Population Employed in Computer & Mathematics in Washington is 6.1%.
What is the Percentage of Population Employed in Computer & Mathematics in the United States?
Percentage of Population Employed in Computer & Mathematics in the United States is 3.5%.