Zip Codes with the Highest Percentage of Population Employed in Computer & Mathematics in Redmond, WA
RELATED REPORTS & OPTIONS
Computer & Mathematics
Redmond
Compare Zip Codes
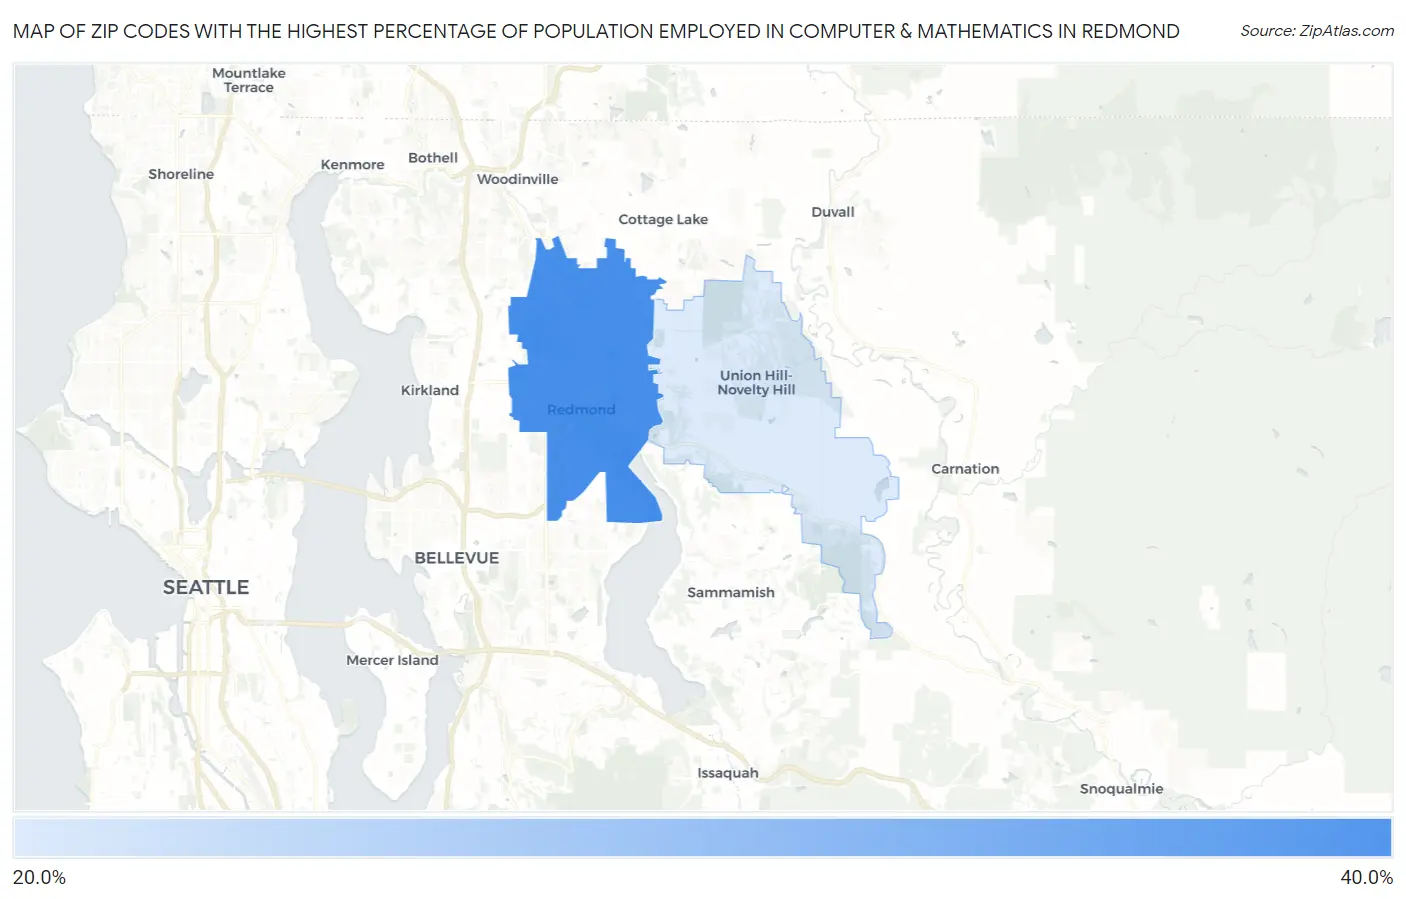
Map of Zip Codes with the Highest Percentage of Population Employed in Computer & Mathematics in Redmond
23.2%
33.5%
Zip Codes with the Highest Percentage of Population Employed in Computer & Mathematics in Redmond, WA
| Zip Code | % Employed | vs State | vs National | |
| 1. | 98052 | 33.5% | 6.1%(+27.4)#3 | 3.5%(+30.0)#35 |
| 2. | 98053 | 23.2% | 6.1%(+17.2)#9 | 3.5%(+19.7)#93 |
1
Common Questions
What are the Top Zip Codes with the Highest Percentage of Population Employed in Computer & Mathematics in Redmond, WA?
Top Zip Codes with the Highest Percentage of Population Employed in Computer & Mathematics in Redmond, WA are:
What zip code has the Highest Percentage of Population Employed in Computer & Mathematics in Redmond, WA?
98052 has the Highest Percentage of Population Employed in Computer & Mathematics in Redmond, WA with 33.5%.
What is the Percentage of Population Employed in Computer & Mathematics in Redmond, WA?
Percentage of Population Employed in Computer & Mathematics in Redmond is 34.1%.
What is the Percentage of Population Employed in Computer & Mathematics in Washington?
Percentage of Population Employed in Computer & Mathematics in Washington is 6.1%.
What is the Percentage of Population Employed in Computer & Mathematics in the United States?
Percentage of Population Employed in Computer & Mathematics in the United States is 3.5%.