Zip Codes with the Highest Percentage of Population Employed in Computer & Mathematics in Seattle, WA
RELATED REPORTS & OPTIONS
Computer & Mathematics
Seattle
Compare Zip Codes
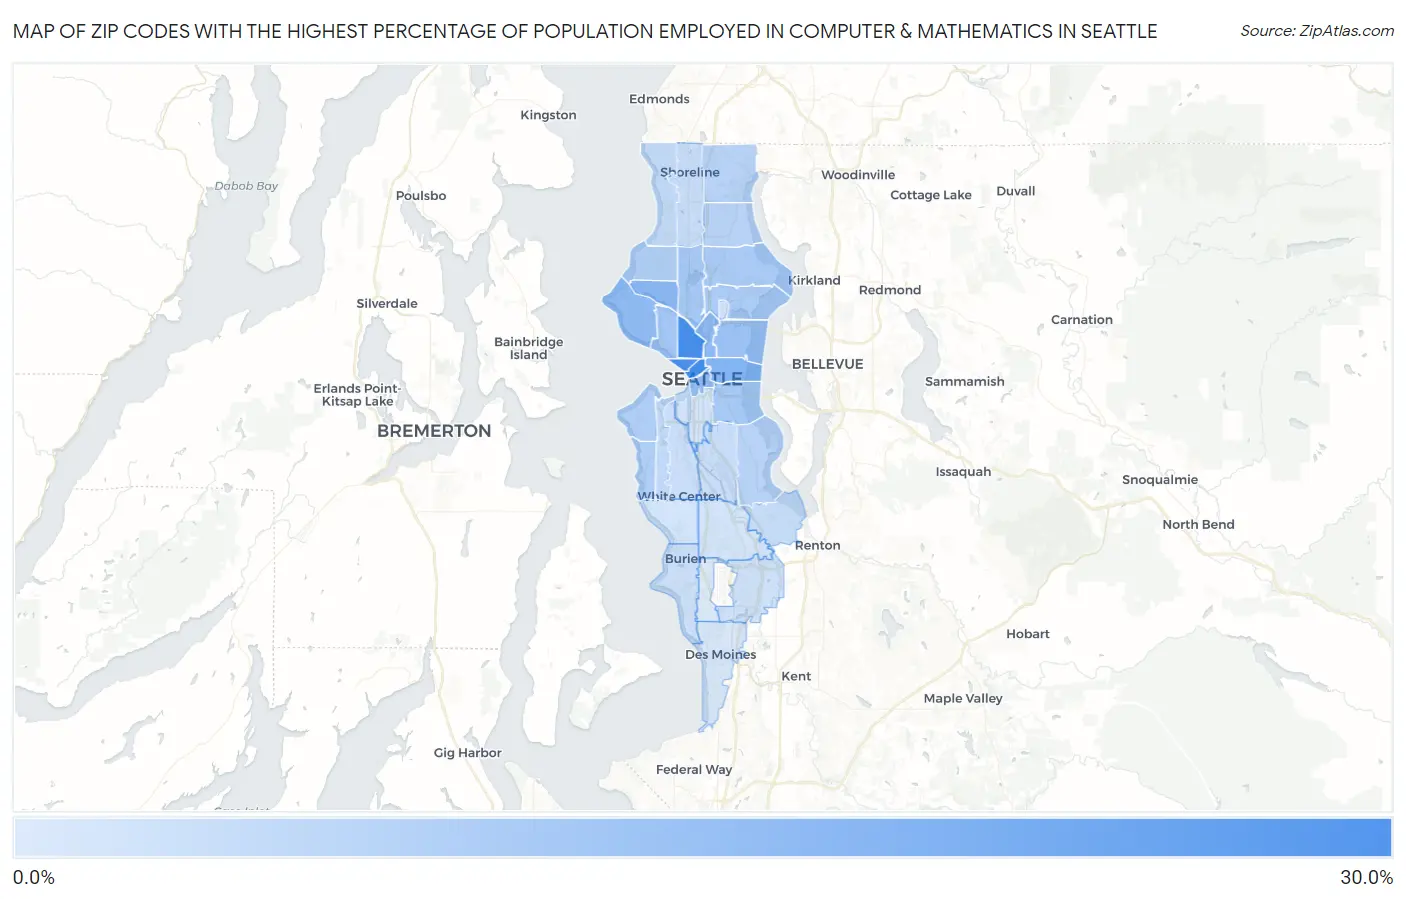
Map of Zip Codes with the Highest Percentage of Population Employed in Computer & Mathematics in Seattle
2.5%
29.0%
Zip Codes with the Highest Percentage of Population Employed in Computer & Mathematics in Seattle, WA
| Zip Code | % Employed | vs State | vs National | |
| 1. | 98109 | 29.0% | 6.1%(+22.9)#4 | 3.5%(+25.5)#56 |
| 2. | 98101 | 29.0% | 6.1%(+22.9)#5 | 3.5%(+25.5)#57 |
| 3. | 98121 | 27.2% | 6.1%(+21.1)#7 | 3.5%(+23.7)#66 |
| 4. | 98164 | 18.8% | 6.1%(+12.7)#13 | 3.5%(+15.3)#153 |
| 5. | 98122 | 17.6% | 6.1%(+11.6)#17 | 3.5%(+14.1)#184 |
| 6. | 98107 | 16.4% | 6.1%(+10.3)#18 | 3.5%(+12.9)#204 |
| 7. | 98102 | 15.4% | 6.1%(+9.37)#21 | 3.5%(+11.9)#233 |
| 8. | 98199 | 15.3% | 6.1%(+9.22)#22 | 3.5%(+11.8)#241 |
| 9. | 98104 | 14.7% | 6.1%(+8.61)#25 | 3.5%(+11.1)#270 |
| 10. | 98112 | 13.3% | 6.1%(+7.23)#29 | 3.5%(+9.76)#344 |
| 11. | 98119 | 11.9% | 6.1%(+5.82)#34 | 3.5%(+8.35)#451 |
| 12. | 98103 | 11.8% | 6.1%(+5.73)#36 | 3.5%(+8.27)#467 |
| 13. | 98144 | 11.4% | 6.1%(+5.31)#37 | 3.5%(+7.84)#512 |
| 14. | 98115 | 10.9% | 6.1%(+4.82)#41 | 3.5%(+7.36)#572 |
| 15. | 98105 | 10.4% | 6.1%(+4.35)#45 | 3.5%(+6.89)#648 |
| 16. | 98116 | 9.8% | 6.1%(+3.70)#49 | 3.5%(+6.23)#747 |
| 17. | 98117 | 9.7% | 6.1%(+3.61)#50 | 3.5%(+6.15)#759 |
| 18. | 98136 | 9.5% | 6.1%(+3.43)#51 | 3.5%(+5.97)#797 |
| 19. | 98125 | 8.5% | 6.1%(+2.45)#56 | 3.5%(+4.99)#1,049 |
| 20. | 98155 | 8.3% | 6.1%(+2.28)#58 | 3.5%(+4.82)#1,098 |
| 21. | 98118 | 8.3% | 6.1%(+2.27)#59 | 3.5%(+4.81)#1,108 |
| 22. | 98126 | 7.0% | 6.1%(+0.987)#69 | 3.5%(+3.52)#1,597 |
| 23. | 98177 | 6.7% | 6.1%(+0.624)#73 | 3.5%(+3.16)#1,804 |
| 24. | 98178 | 6.3% | 6.1%(+0.241)#78 | 3.5%(+2.77)#2,086 |
| 25. | 98133 | 5.9% | 6.1%(-0.177)#83 | 3.5%(+2.36)#2,425 |
| 26. | 98108 | 5.8% | 6.1%(-0.208)#85 | 3.5%(+2.33)#2,451 |
| 27. | 98106 | 5.6% | 6.1%(-0.500)#92 | 3.5%(+2.03)#2,719 |
| 28. | 98166 | 5.2% | 6.1%(-0.815)#99 | 3.5%(+1.72)#3,077 |
| 29. | 98188 | 4.7% | 6.1%(-1.36)#111 | 3.5%(+1.17)#3,798 |
| 30. | 98195 | 4.6% | 6.1%(-1.49)#118 | 3.5%(+1.04)#3,989 |
| 31. | 98134 | 4.3% | 6.1%(-1.75)#132 | 3.5%(+0.780)#4,424 |
| 32. | 98146 | 4.1% | 6.1%(-1.93)#140 | 3.5%(+0.606)#4,750 |
| 33. | 98168 | 4.0% | 6.1%(-2.06)#151 | 3.5%(+0.474)#5,053 |
| 34. | 98198 | 3.2% | 6.1%(-2.85)#201 | 3.5%(-0.318)#7,074 |
| 35. | 98148 | 2.5% | 6.1%(-3.52)#256 | 3.5%(-0.984)#9,458 |
1
Common Questions
What are the Top 10 Zip Codes with the Highest Percentage of Population Employed in Computer & Mathematics in Seattle, WA?
Top 10 Zip Codes with the Highest Percentage of Population Employed in Computer & Mathematics in Seattle, WA are:
What zip code has the Highest Percentage of Population Employed in Computer & Mathematics in Seattle, WA?
98109 has the Highest Percentage of Population Employed in Computer & Mathematics in Seattle, WA with 29.0%.
What is the Percentage of Population Employed in Computer & Mathematics in Seattle, WA?
Percentage of Population Employed in Computer & Mathematics in Seattle is 13.0%.
What is the Percentage of Population Employed in Computer & Mathematics in Washington?
Percentage of Population Employed in Computer & Mathematics in Washington is 6.1%.
What is the Percentage of Population Employed in Computer & Mathematics in the United States?
Percentage of Population Employed in Computer & Mathematics in the United States is 3.5%.