Otis Orchards East Farms, WA Map & Demographics
Otis Orchards East Farms Map
Otis Orchards East Farms Overview
$39,030
PER CAPITA INCOME
$88,118
AVG FAMILY INCOME
$87,572
AVG HOUSEHOLD INCOME
44.0%
WAGE / INCOME GAP [ % ]
56.0¢/ $1
WAGE / INCOME GAP [ $ ]
0.38
INEQUALITY / GINI INDEX
5,699
TOTAL POPULATION
2,850
MALE POPULATION
2,849
FEMALE POPULATION
100.04
MALES / 100 FEMALES
99.96
FEMALES / 100 MALES
41.9
MEDIAN AGE
2.9
AVG FAMILY SIZE
2.7
AVG HOUSEHOLD SIZE
2,760
LABOR FORCE [ PEOPLE ]
59.4%
PERCENT IN LABOR FORCE
5.0%
UNEMPLOYMENT RATE
Income in Otis Orchards East Farms
Income Overview in Otis Orchards East Farms
Per Capita Income in Otis Orchards East Farms is $39,030, while median incomes of families and households are $88,118 and $87,572 respectively.
| Characteristic | Number | Measure |
| Per Capita Income | 5,699 | $39,030 |
| Median Family Income | 1,671 | $88,118 |
| Mean Family Income | 1,671 | $103,617 |
| Median Household Income | 2,135 | $87,572 |
| Mean Household Income | 2,135 | $102,078 |
| Income Deficit | 1,671 | $0 |
| Wage / Income Gap (%) | 5,699 | 44.05% |
| Wage / Income Gap ($) | 5,699 | 55.95¢ per $1 |
| Gini / Inequality Index | 5,699 | 0.38 |
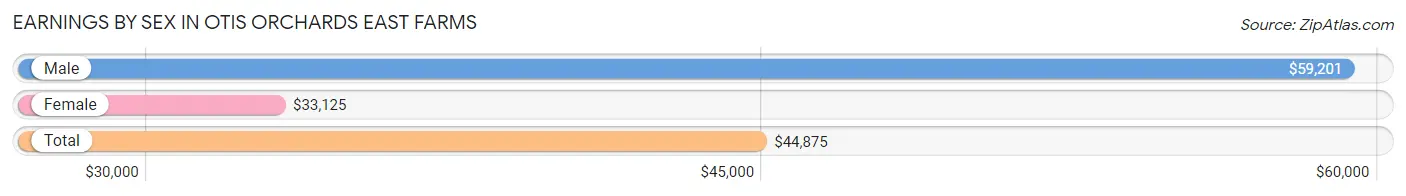
Earnings by Sex in Otis Orchards East Farms
Average Earnings in Otis Orchards East Farms are $44,875, $59,201 for men and $33,125 for women, a difference of 44.1%.
| Sex | Number | Average Earnings |
| Male | 1,597 (55.6%) | $59,201 |
| Female | 1,275 (44.4%) | $33,125 |
| Total | 2,872 (100.0%) | $44,875 |
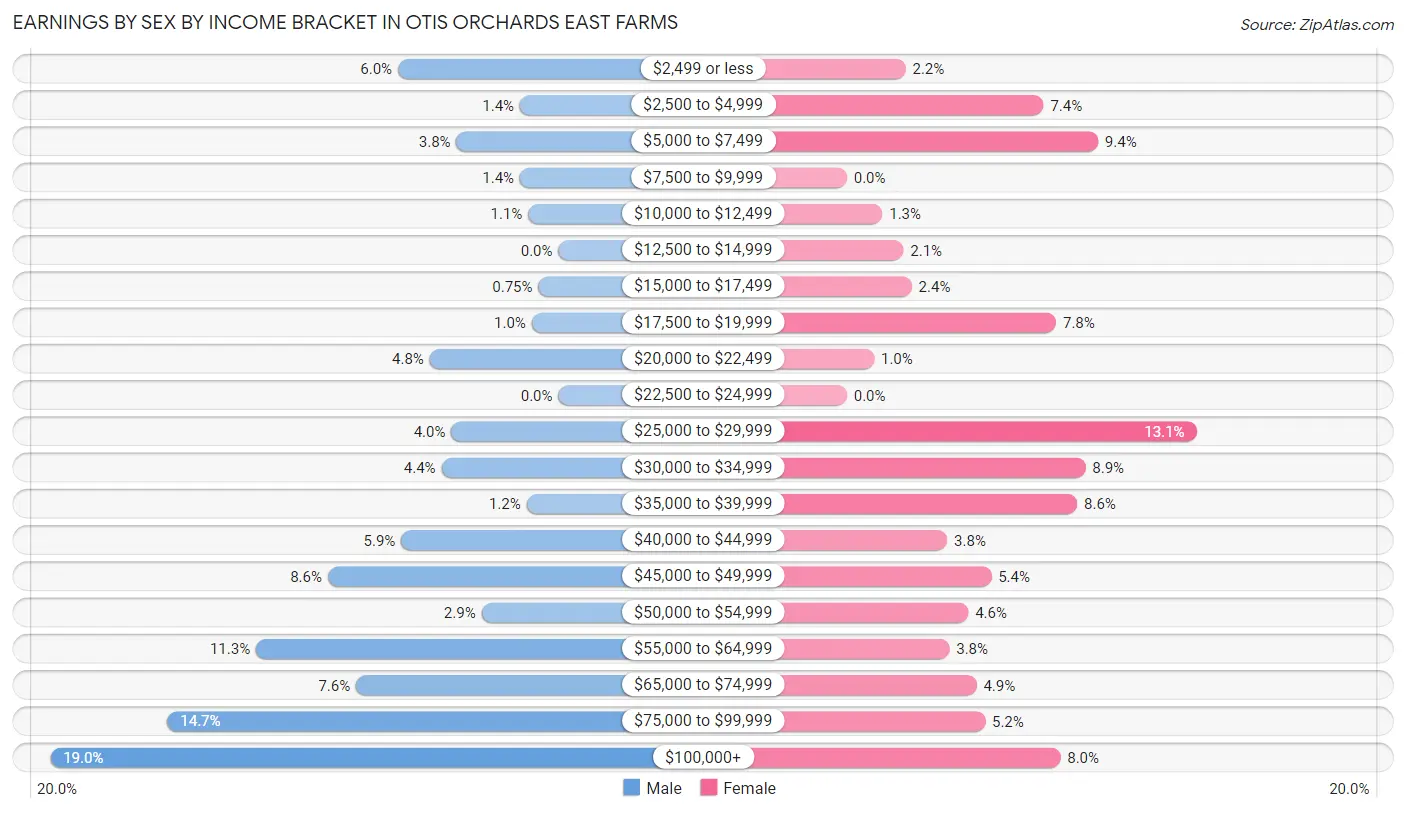
Earnings by Sex by Income Bracket in Otis Orchards East Farms
The most common earnings brackets in Otis Orchards East Farms are $100,000+ for men (304 | 19.0%) and $25,000 to $29,999 for women (167 | 13.1%).
| Income | Male | Female |
| $2,499 or less | 96 (6.0%) | 28 (2.2%) |
| $2,500 to $4,999 | 23 (1.4%) | 94 (7.4%) |
| $5,000 to $7,499 | 61 (3.8%) | 120 (9.4%) |
| $7,500 to $9,999 | 23 (1.4%) | 0 (0.0%) |
| $10,000 to $12,499 | 18 (1.1%) | 17 (1.3%) |
| $12,500 to $14,999 | 0 (0.0%) | 27 (2.1%) |
| $15,000 to $17,499 | 12 (0.7%) | 31 (2.4%) |
| $17,500 to $19,999 | 16 (1.0%) | 100 (7.8%) |
| $20,000 to $22,499 | 77 (4.8%) | 13 (1.0%) |
| $22,500 to $24,999 | 0 (0.0%) | 0 (0.0%) |
| $25,000 to $29,999 | 64 (4.0%) | 167 (13.1%) |
| $30,000 to $34,999 | 70 (4.4%) | 114 (8.9%) |
| $35,000 to $39,999 | 19 (1.2%) | 110 (8.6%) |
| $40,000 to $44,999 | 94 (5.9%) | 48 (3.8%) |
| $45,000 to $49,999 | 138 (8.6%) | 69 (5.4%) |
| $50,000 to $54,999 | 46 (2.9%) | 58 (4.5%) |
| $55,000 to $64,999 | 181 (11.3%) | 49 (3.8%) |
| $65,000 to $74,999 | 121 (7.6%) | 62 (4.9%) |
| $75,000 to $99,999 | 234 (14.6%) | 66 (5.2%) |
| $100,000+ | 304 (19.0%) | 102 (8.0%) |
| Total | 1,597 (100.0%) | 1,275 (100.0%) |
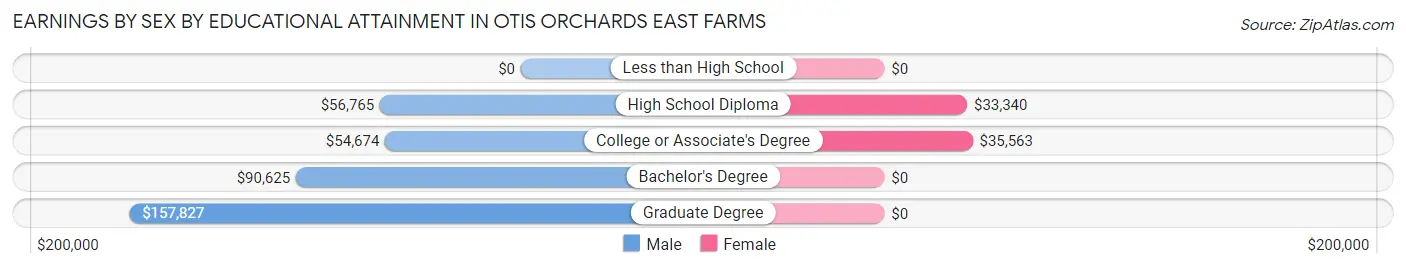
Earnings by Sex by Educational Attainment in Otis Orchards East Farms
Average earnings in Otis Orchards East Farms are $60,788 for men and $34,694 for women, a difference of 42.9%. Men with an educational attainment of graduate degree enjoy the highest average annual earnings of $157,827, while those with college or associate's degree education earn the least with $54,674. Women with an educational attainment of college or associate's degree earn the most with the average annual earnings of $35,563, while those with high school diploma education have the smallest earnings of $33,340.
| Educational Attainment | Male Income | Female Income |
| Less than High School | - | - |
| High School Diploma | $56,765 | $33,340 |
| College or Associate's Degree | $54,674 | $35,563 |
| Bachelor's Degree | $90,625 | $0 |
| Graduate Degree | $157,827 | $0 |
| Total | $60,788 | $34,694 |
Family Income in Otis Orchards East Farms
Family Income Brackets in Otis Orchards East Farms
According to the Otis Orchards East Farms family income data, there are 521 families falling into the $100,000 to $149,999 income range, which is the most common income bracket and makes up 31.2% of all families. Conversely, the less than $10,000 income bracket is the least frequent group with only 12 families (0.7%) belonging to this category.
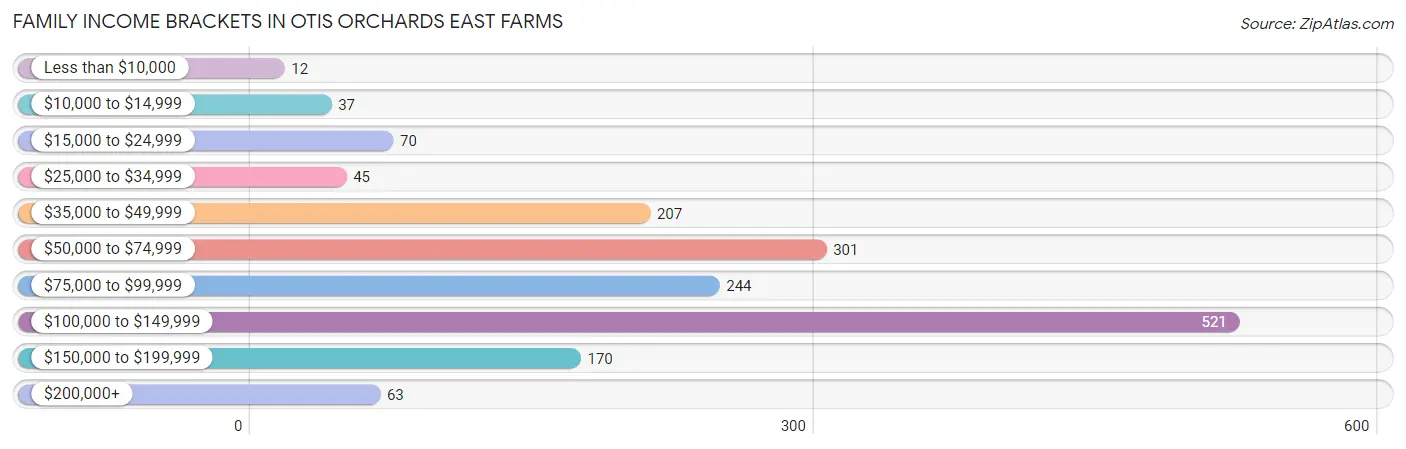
| Income Bracket | # Families | % Families |
| Less than $10,000 | 12 | 0.7% |
| $10,000 to $14,999 | 37 | 2.2% |
| $15,000 to $24,999 | 70 | 4.2% |
| $25,000 to $34,999 | 45 | 2.7% |
| $35,000 to $49,999 | 207 | 12.4% |
| $50,000 to $74,999 | 301 | 18.0% |
| $75,000 to $99,999 | 244 | 14.6% |
| $100,000 to $149,999 | 521 | 31.2% |
| $150,000 to $199,999 | 170 | 10.2% |
| $200,000+ | 63 | 3.8% |
Family Income by Famaliy Size in Otis Orchards East Farms
5-person families (145 | 8.7%) account for the highest median family income in Otis Orchards East Farms with $120,434 per family, while 2-person families (1,026 | 61.4%) have the highest median income of $37,656 per family member.
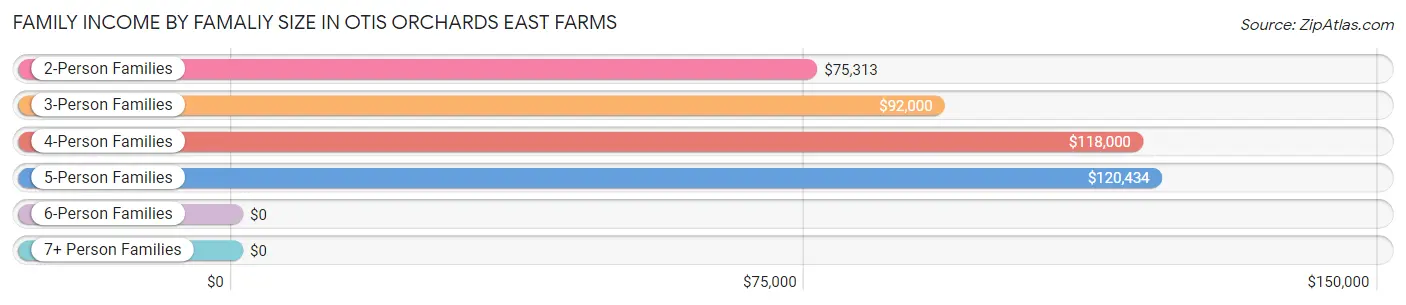
| Income Bracket | # Families | Median Income |
| 2-Person Families | 1,026 (61.4%) | $75,313 |
| 3-Person Families | 180 (10.8%) | $92,000 |
| 4-Person Families | 254 (15.2%) | $118,000 |
| 5-Person Families | 145 (8.7%) | $120,434 |
| 6-Person Families | 66 (4.0%) | $0 |
| 7+ Person Families | 0 (0.0%) | $0 |
| Total | 1,671 (100.0%) | $88,118 |
Family Income by Number of Earners in Otis Orchards East Farms
The median family income in Otis Orchards East Farms is $88,118, with families comprising 3+ earners (198) having the highest median family income of $135,769, while families with no earners (353) have the lowest median family income of $42,596, accounting for 11.8% and 21.1% of families, respectively.
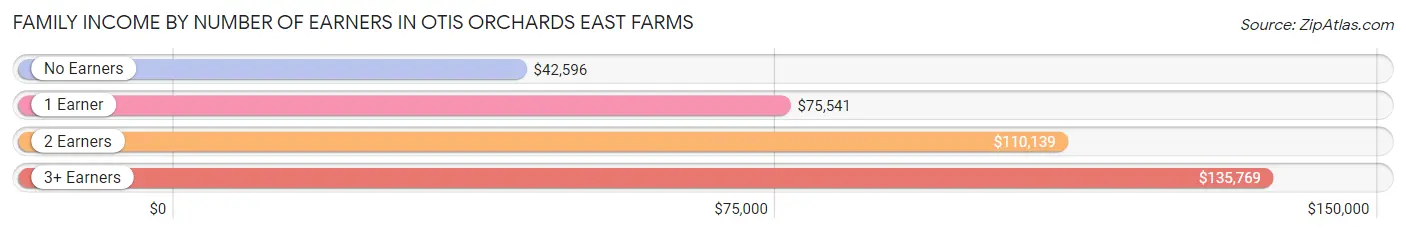
| Number of Earners | # Families | Median Income |
| No Earners | 353 (21.1%) | $42,596 |
| 1 Earner | 714 (42.7%) | $75,541 |
| 2 Earners | 406 (24.3%) | $110,139 |
| 3+ Earners | 198 (11.8%) | $135,769 |
| Total | 1,671 (100.0%) | $88,118 |
Household Income in Otis Orchards East Farms
Household Income Brackets in Otis Orchards East Farms
With 532 households falling in the category, the $100,000 to $149,999 income range is the most frequent in Otis Orchards East Farms, accounting for 24.9% of all households. In contrast, only 13 households (0.6%) fall into the less than $10,000 income bracket, making it the least populous group.
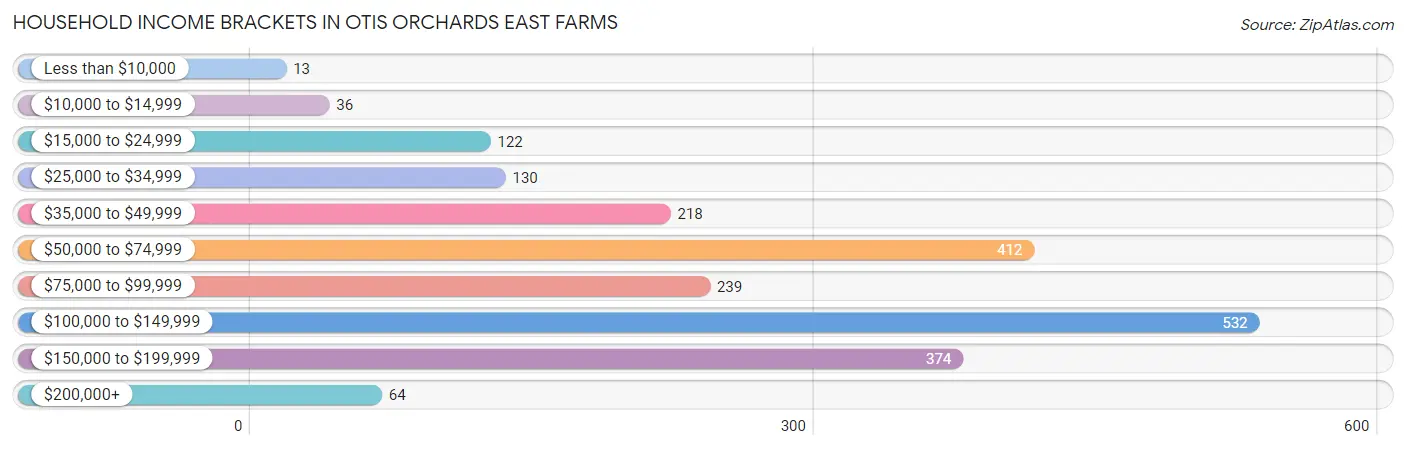
| Income Bracket | # Households | % Households |
| Less than $10,000 | 13 | 0.6% |
| $10,000 to $14,999 | 36 | 1.7% |
| $15,000 to $24,999 | 122 | 5.7% |
| $25,000 to $34,999 | 130 | 6.1% |
| $35,000 to $49,999 | 218 | 10.2% |
| $50,000 to $74,999 | 412 | 19.3% |
| $75,000 to $99,999 | 239 | 11.2% |
| $100,000 to $149,999 | 532 | 24.9% |
| $150,000 to $199,999 | 374 | 17.5% |
| $200,000+ | 64 | 3.0% |
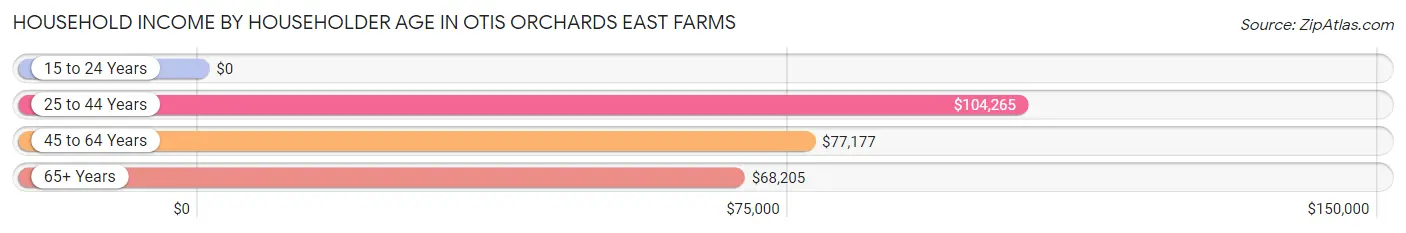
Household Income by Householder Age in Otis Orchards East Farms
The median household income in Otis Orchards East Farms is $87,572, with the highest median household income of $104,265 found in the 25 to 44 years age bracket for the primary householder. A total of 588 households (27.5%) fall into this category.
| Income Bracket | # Households | Median Income |
| 15 to 24 Years | 0 (0.0%) | $0 |
| 25 to 44 Years | 588 (27.5%) | $104,265 |
| 45 to 64 Years | 879 (41.2%) | $77,177 |
| 65+ Years | 668 (31.3%) | $68,205 |
| Total | 2,135 (100.0%) | $87,572 |
Poverty in Otis Orchards East Farms
Income Below Poverty by Sex and Age in Otis Orchards East Farms
With 2.6% poverty level for males and 4.9% for females among the residents of Otis Orchards East Farms, 15 year old males and 25 to 34 year old females are the most vulnerable to poverty, with 17 males (100.0%) and 71 females (18.6%) in their respective age groups living below the poverty level.
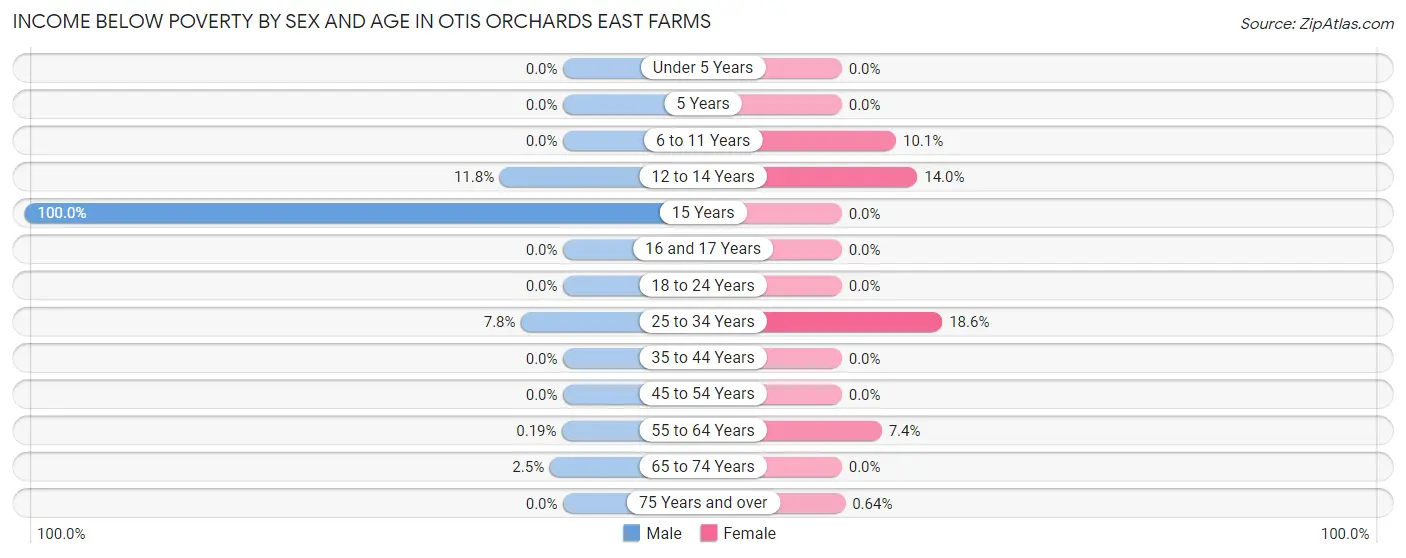
| Age Bracket | Male | Female |
| Under 5 Years | 0 (0.0%) | 0 (0.0%) |
| 5 Years | 0 (0.0%) | 0 (0.0%) |
| 6 to 11 Years | 0 (0.0%) | 15 (10.1%) |
| 12 to 14 Years | 14 (11.8%) | 15 (14.0%) |
| 15 Years | 17 (100.0%) | 0 (0.0%) |
| 16 and 17 Years | 0 (0.0%) | 0 (0.0%) |
| 18 to 24 Years | 0 (0.0%) | 0 (0.0%) |
| 25 to 34 Years | 30 (7.8%) | 71 (18.6%) |
| 35 to 44 Years | 0 (0.0%) | 0 (0.0%) |
| 45 to 54 Years | 0 (0.0%) | 0 (0.0%) |
| 55 to 64 Years | 1 (0.2%) | 37 (7.4%) |
| 65 to 74 Years | 13 (2.5%) | 0 (0.0%) |
| 75 Years and over | 0 (0.0%) | 1 (0.6%) |
| Total | 75 (2.6%) | 139 (4.9%) |
Income Above Poverty by Sex and Age in Otis Orchards East Farms
According to the poverty statistics in Otis Orchards East Farms, males aged under 5 years and females aged under 5 years are the age groups that are most secure financially, with 100.0% of males and 100.0% of females in these age groups living above the poverty line.
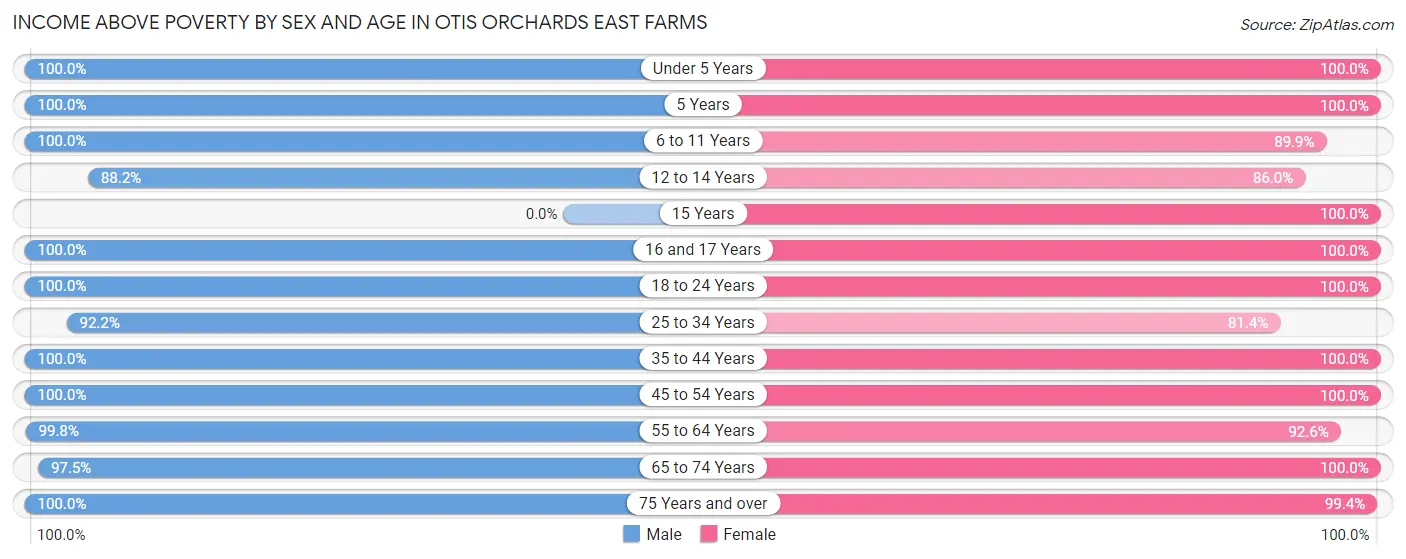
| Age Bracket | Male | Female |
| Under 5 Years | 114 (100.0%) | 245 (100.0%) |
| 5 Years | 27 (100.0%) | 15 (100.0%) |
| 6 to 11 Years | 211 (100.0%) | 134 (89.9%) |
| 12 to 14 Years | 105 (88.2%) | 92 (86.0%) |
| 15 Years | 0 (0.0%) | 30 (100.0%) |
| 16 and 17 Years | 66 (100.0%) | 130 (100.0%) |
| 18 to 24 Years | 76 (100.0%) | 87 (100.0%) |
| 25 to 34 Years | 355 (92.2%) | 310 (81.4%) |
| 35 to 44 Years | 350 (100.0%) | 453 (100.0%) |
| 45 to 54 Years | 307 (100.0%) | 171 (100.0%) |
| 55 to 64 Years | 521 (99.8%) | 462 (92.6%) |
| 65 to 74 Years | 512 (97.5%) | 408 (100.0%) |
| 75 Years and over | 131 (100.0%) | 155 (99.4%) |
| Total | 2,775 (97.4%) | 2,692 (95.1%) |
Income Below Poverty Among Married-Couple Families in Otis Orchards East Farms
The poverty statistics for married-couple families in Otis Orchards East Farms show that 1.0% or 12 of the total 1,246 families live below the poverty line. Families with no children have the highest poverty rate of 1.4%, comprising of 12 families. On the other hand, families with 1 or 2 children have the lowest poverty rate of 0.0%, which includes 0 families.
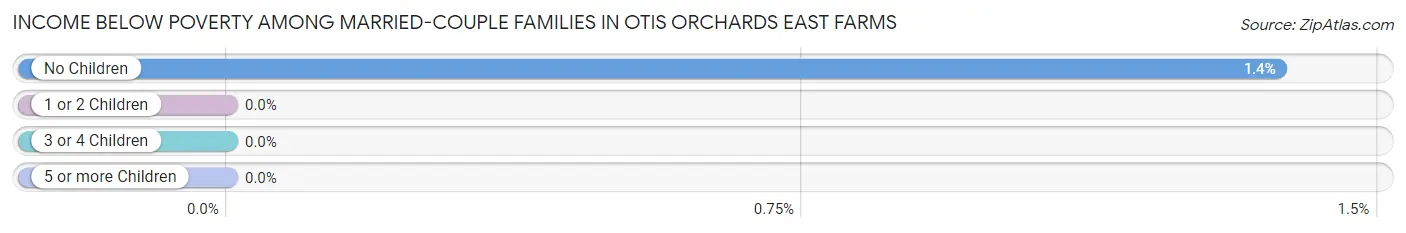
| Children | Above Poverty | Below Poverty |
| No Children | 865 (98.6%) | 12 (1.4%) |
| 1 or 2 Children | 269 (100.0%) | 0 (0.0%) |
| 3 or 4 Children | 100 (100.0%) | 0 (0.0%) |
| 5 or more Children | 0 (0.0%) | 0 (0.0%) |
| Total | 1,234 (99.0%) | 12 (1.0%) |
Income Below Poverty Among Single-Parent Households in Otis Orchards East Farms
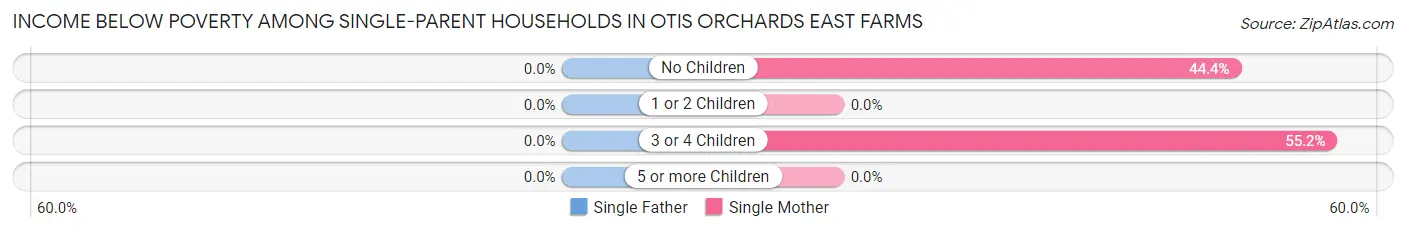
| Children | Single Father | Single Mother |
| No Children | 0 (0.0%) | 20 (44.4%) |
| 1 or 2 Children | 0 (0.0%) | 0 (0.0%) |
| 3 or 4 Children | 0 (0.0%) | 16 (55.2%) |
| 5 or more Children | 0 (0.0%) | 0 (0.0%) |
| Total | 0 (0.0%) | 36 (24.2%) |
Income Below Poverty Among Married-Couple vs Single-Parent Households in Otis Orchards East Farms
The poverty data for Otis Orchards East Farms shows that 12 of the married-couple family households (1.0%) and 36 of the single-parent households (8.5%) are living below the poverty level. Within the married-couple family households, those with no children have the highest poverty rate, with 12 households (1.4%) falling below the poverty line. Among the single-parent households, those with 3 or 4 children have the highest poverty rate, with 16 household (20.5%) living below poverty.
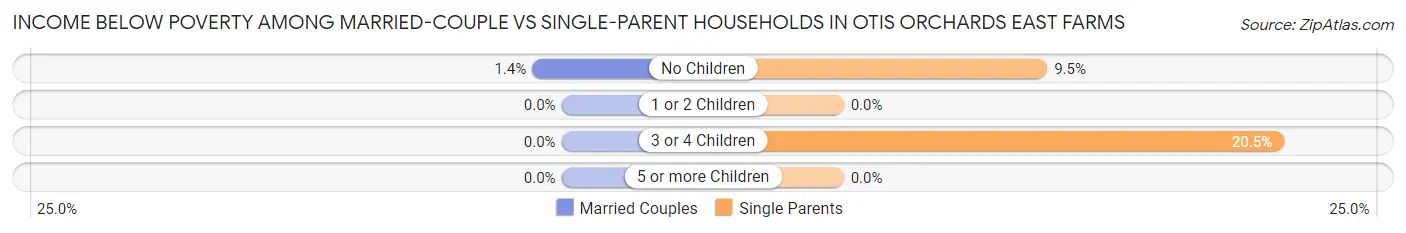
| Children | Married-Couple Families | Single-Parent Households |
| No Children | 12 (1.4%) | 20 (9.5%) |
| 1 or 2 Children | 0 (0.0%) | 0 (0.0%) |
| 3 or 4 Children | 0 (0.0%) | 16 (20.5%) |
| 5 or more Children | 0 (0.0%) | 0 (0.0%) |
| Total | 12 (1.0%) | 36 (8.5%) |
Race in Otis Orchards East Farms
The most populous races in Otis Orchards East Farms are White / Caucasian (4,931 | 86.5%), Two or more Races (448 | 7.9%), and Hispanic or Latino (427 | 7.5%).
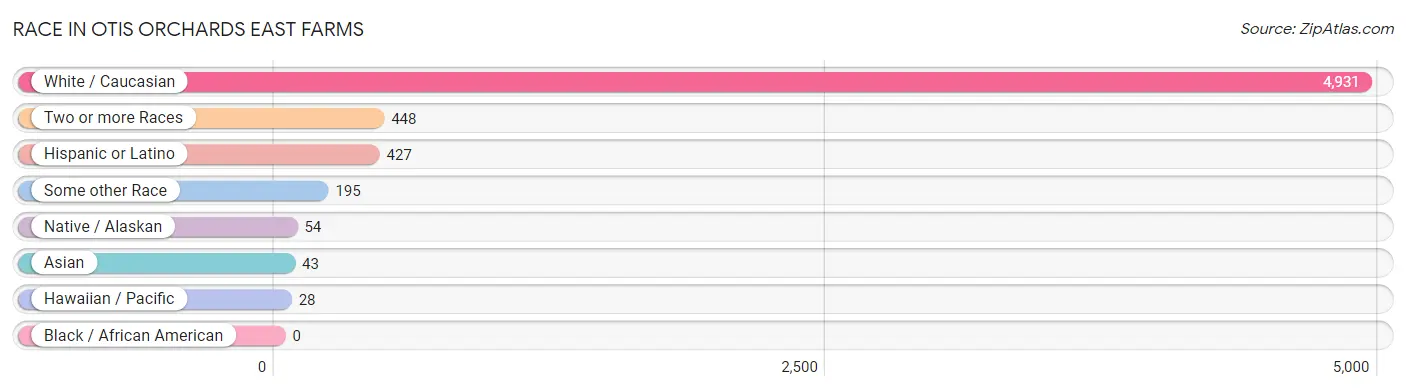
| Race | # Population | % Population |
| Asian | 43 | 0.7% |
| Black / African American | 0 | 0.0% |
| Hawaiian / Pacific | 28 | 0.5% |
| Hispanic or Latino | 427 | 7.5% |
| Native / Alaskan | 54 | 0.9% |
| White / Caucasian | 4,931 | 86.5% |
| Two or more Races | 448 | 7.9% |
| Some other Race | 195 | 3.4% |
| Total | 5,699 | 100.0% |
Ancestry in Otis Orchards East Farms
The most populous ancestries reported in Otis Orchards East Farms are German (1,402 | 24.6%), Irish (1,000 | 17.5%), English (669 | 11.7%), American (629 | 11.0%), and Scottish (460 | 8.1%), together accounting for 73.0% of all Otis Orchards East Farms residents.
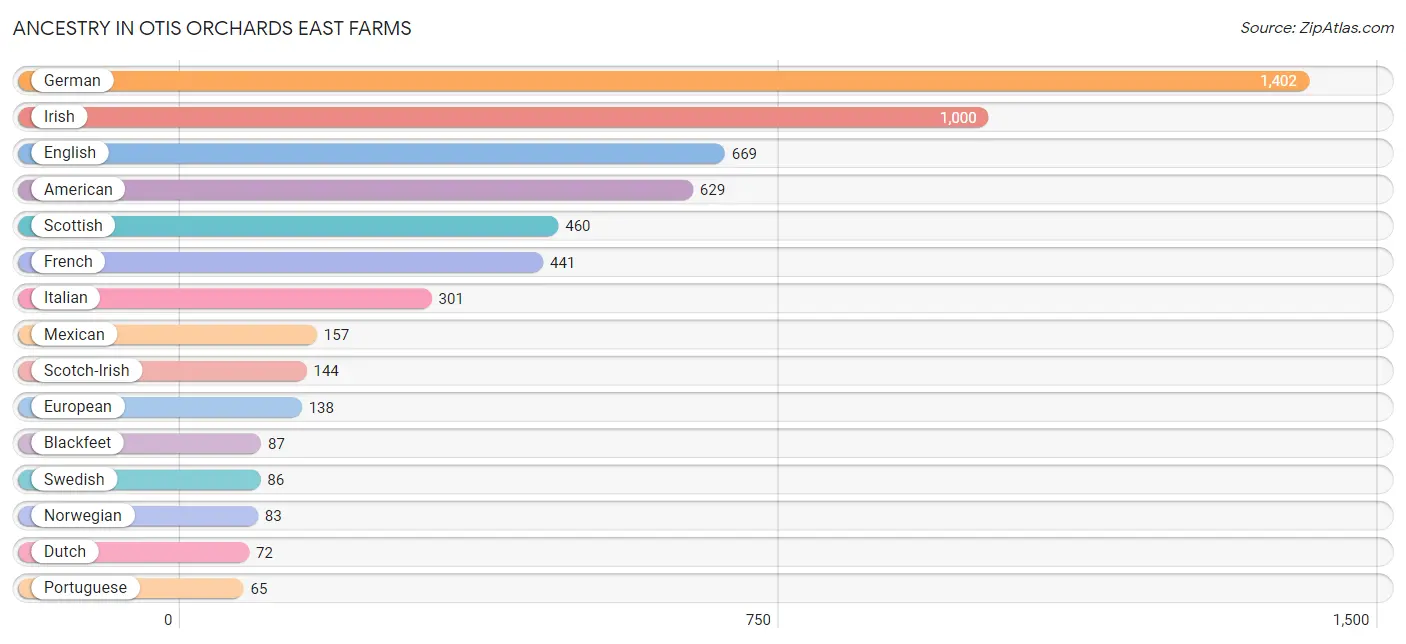
| Ancestry | # Population | % Population |
| American | 629 | 11.0% |
| Austrian | 43 | 0.7% |
| Blackfeet | 87 | 1.5% |
| British | 31 | 0.5% |
| Cuban | 13 | 0.2% |
| Czech | 17 | 0.3% |
| Danish | 57 | 1.0% |
| Dutch | 72 | 1.3% |
| English | 669 | 11.7% |
| European | 138 | 2.4% |
| Finnish | 19 | 0.3% |
| French | 441 | 7.7% |
| German | 1,402 | 24.6% |
| Greek | 30 | 0.5% |
| Indian (Asian) | 28 | 0.5% |
| Irish | 1,000 | 17.5% |
| Italian | 301 | 5.3% |
| Lithuanian | 42 | 0.7% |
| Luxembourger | 16 | 0.3% |
| Mexican | 157 | 2.8% |
| Native Hawaiian | 28 | 0.5% |
| Norwegian | 83 | 1.5% |
| Polish | 15 | 0.3% |
| Portuguese | 65 | 1.1% |
| Puerto Rican | 24 | 0.4% |
| Scotch-Irish | 144 | 2.5% |
| Scottish | 460 | 8.1% |
| South African | 18 | 0.3% |
| South American Indian | 13 | 0.2% |
| Spanish | 56 | 1.0% |
| Sri Lankan | 1 | 0.0% |
| Subsaharan African | 18 | 0.3% |
| Swedish | 86 | 1.5% |
| Tlingit-Haida | 13 | 0.2% |
| Welsh | 43 | 0.7% | View All 35 Rows |
Immigrants in Otis Orchards East Farms
The most numerous immigrant groups reported in Otis Orchards East Farms came from Europe (92 | 1.6%), Northern Europe (67 | 1.2%), Asia (29 | 0.5%), China (28 | 0.5%), and Eastern Asia (28 | 0.5%), together accounting for 4.3% of all Otis Orchards East Farms residents.
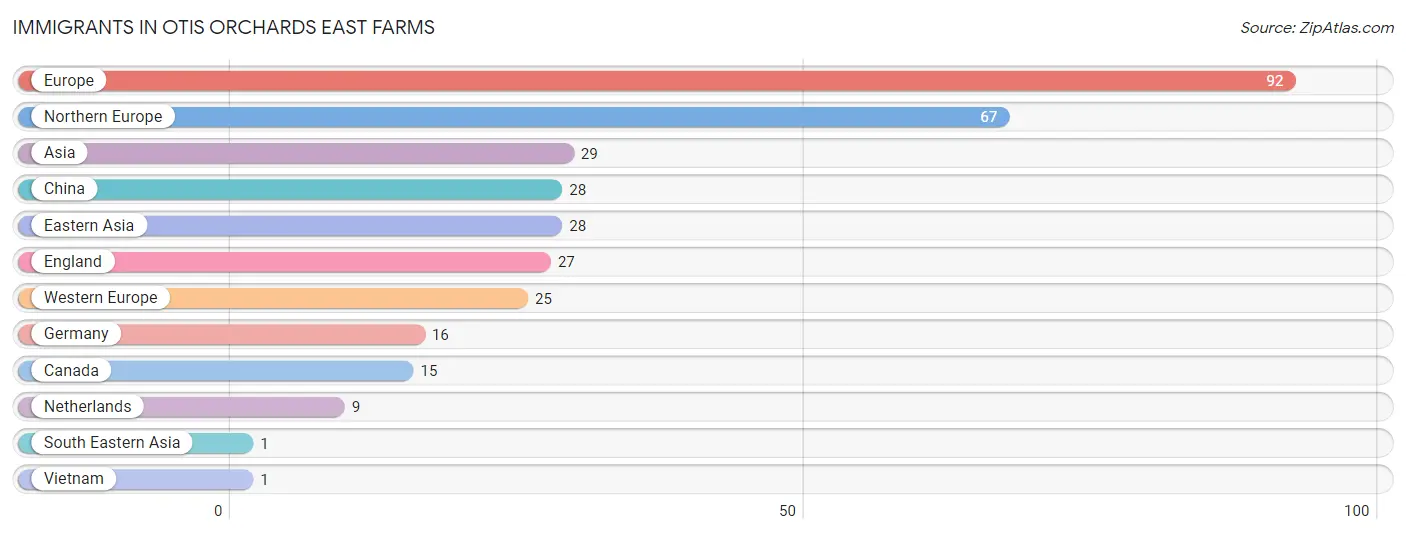
| Immigration Origin | # Population | % Population |
| Asia | 29 | 0.5% |
| Canada | 15 | 0.3% |
| China | 28 | 0.5% |
| Eastern Asia | 28 | 0.5% |
| England | 27 | 0.5% |
| Europe | 92 | 1.6% |
| Germany | 16 | 0.3% |
| Netherlands | 9 | 0.2% |
| Northern Europe | 67 | 1.2% |
| South Eastern Asia | 1 | 0.0% |
| Vietnam | 1 | 0.0% |
| Western Europe | 25 | 0.4% | View All 12 Rows |
Sex and Age in Otis Orchards East Farms
Sex and Age in Otis Orchards East Farms
The most populous age groups in Otis Orchards East Farms are 55 to 59 Years (367 | 12.9%) for men and 35 to 39 Years (294 | 10.3%) for women.
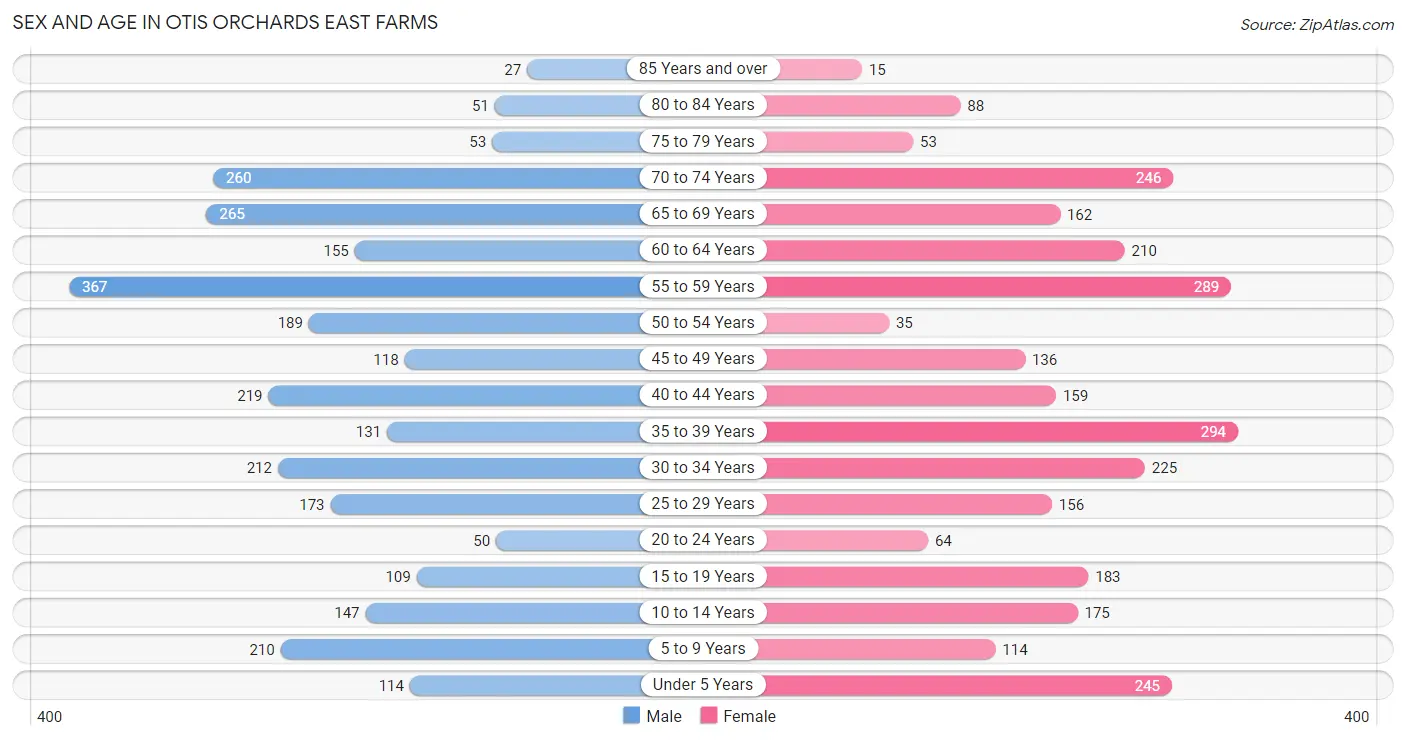
| Age Bracket | Male | Female |
| Under 5 Years | 114 (4.0%) | 245 (8.6%) |
| 5 to 9 Years | 210 (7.4%) | 114 (4.0%) |
| 10 to 14 Years | 147 (5.2%) | 175 (6.1%) |
| 15 to 19 Years | 109 (3.8%) | 183 (6.4%) |
| 20 to 24 Years | 50 (1.8%) | 64 (2.2%) |
| 25 to 29 Years | 173 (6.1%) | 156 (5.5%) |
| 30 to 34 Years | 212 (7.4%) | 225 (7.9%) |
| 35 to 39 Years | 131 (4.6%) | 294 (10.3%) |
| 40 to 44 Years | 219 (7.7%) | 159 (5.6%) |
| 45 to 49 Years | 118 (4.1%) | 136 (4.8%) |
| 50 to 54 Years | 189 (6.6%) | 35 (1.2%) |
| 55 to 59 Years | 367 (12.9%) | 289 (10.1%) |
| 60 to 64 Years | 155 (5.4%) | 210 (7.4%) |
| 65 to 69 Years | 265 (9.3%) | 162 (5.7%) |
| 70 to 74 Years | 260 (9.1%) | 246 (8.6%) |
| 75 to 79 Years | 53 (1.9%) | 53 (1.9%) |
| 80 to 84 Years | 51 (1.8%) | 88 (3.1%) |
| 85 Years and over | 27 (0.9%) | 15 (0.5%) |
| Total | 2,850 (100.0%) | 2,849 (100.0%) |
Families and Households in Otis Orchards East Farms
Median Family Size in Otis Orchards East Farms
The median family size in Otis Orchards East Farms is 2.91 persons per family, with single female/mother families (149 | 8.9%) accounting for the largest median family size of 3.05 persons per family. On the other hand, single male/father families (276 | 16.5%) represent the smallest median family size with 2.75 persons per family.
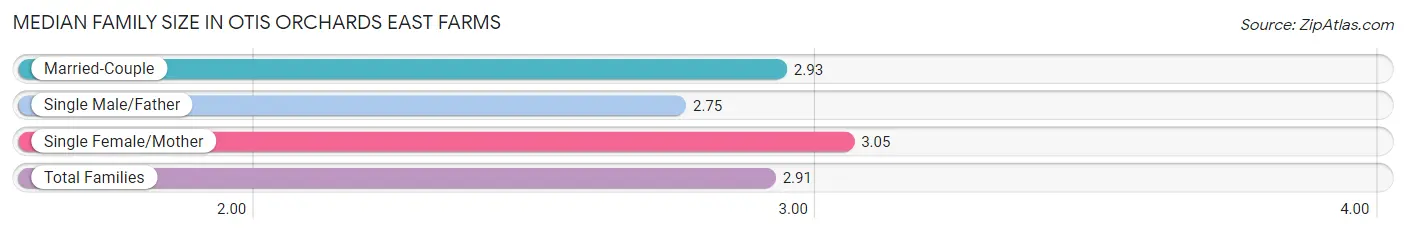
| Family Type | # Families | Family Size |
| Married-Couple | 1,246 (74.6%) | 2.93 |
| Single Male/Father | 276 (16.5%) | 2.75 |
| Single Female/Mother | 149 (8.9%) | 3.05 |
| Total Families | 1,671 (100.0%) | 2.91 |
Median Household Size in Otis Orchards East Farms
The median household size in Otis Orchards East Farms is 2.67 persons per household, with single male/father households (276 | 12.9%) accounting for the largest median household size of 3.58 persons per household. non-family households (464 | 21.7%) represent the smallest median household size with 1.25 persons per household.
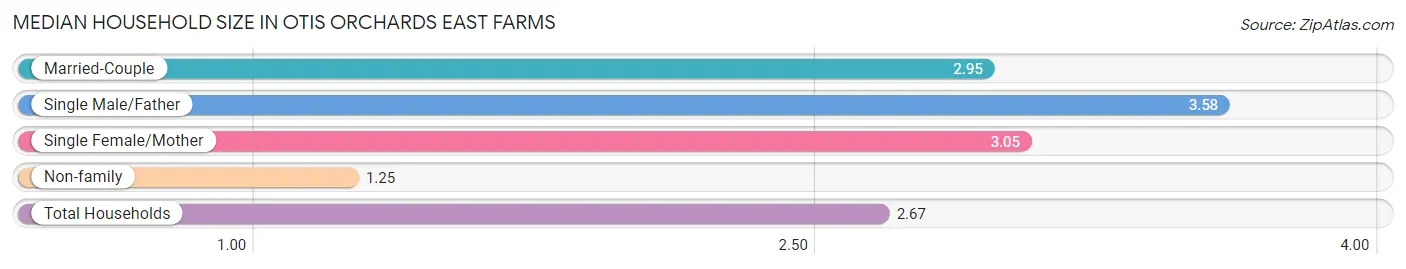
| Household Type | # Households | Household Size |
| Married-Couple | 1,246 (58.4%) | 2.95 |
| Single Male/Father | 276 (12.9%) | 3.58 |
| Single Female/Mother | 149 (7.0%) | 3.05 |
| Non-family | 464 (21.7%) | 1.25 |
| Total Households | 2,135 (100.0%) | 2.67 |
Household Size by Marriage Status in Otis Orchards East Farms
Out of a total of 2,135 households in Otis Orchards East Farms, 1,671 (78.3%) are family households, while 464 (21.7%) are nonfamily households. The most numerous type of family households are 2-person households, comprising 911, and the most common type of nonfamily households are 1-person households, comprising 377.
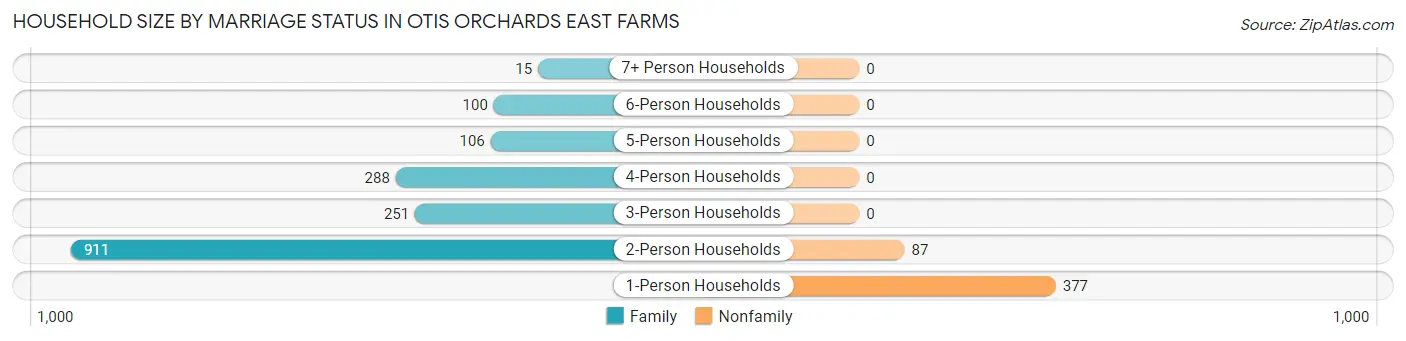
| Household Size | Family Households | Nonfamily Households |
| 1-Person Households | - | 377 (17.7%) |
| 2-Person Households | 911 (42.7%) | 87 (4.1%) |
| 3-Person Households | 251 (11.8%) | 0 (0.0%) |
| 4-Person Households | 288 (13.5%) | 0 (0.0%) |
| 5-Person Households | 106 (5.0%) | 0 (0.0%) |
| 6-Person Households | 100 (4.7%) | 0 (0.0%) |
| 7+ Person Households | 15 (0.7%) | 0 (0.0%) |
| Total | 1,671 (78.3%) | 464 (21.7%) |
Female Fertility in Otis Orchards East Farms
Fertility by Age in Otis Orchards East Farms
Average fertility rate in Otis Orchards East Farms is 25.0 births per 1,000 women. Women in the age bracket of 20 to 34 years have the highest fertility rate with 70.0 births per 1,000 women. Women in the age bracket of 20 to 34 years acount for 100.0% of all women with births.
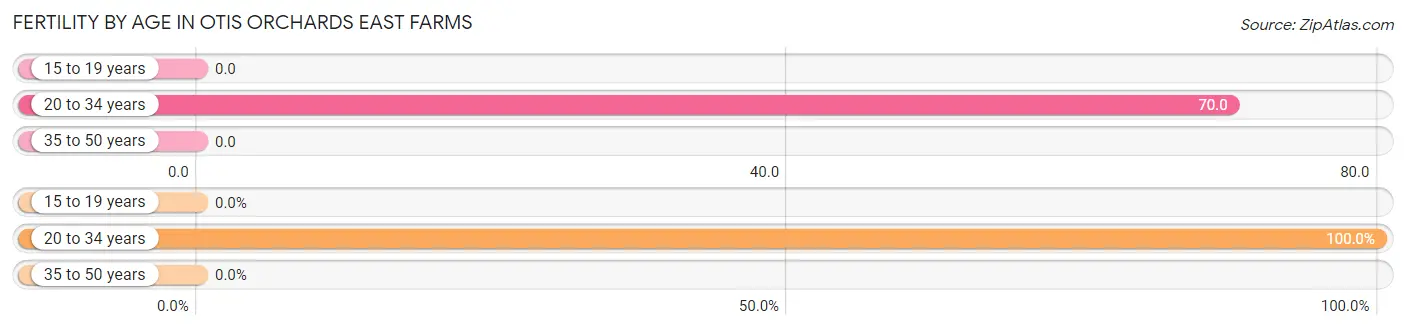
| Age Bracket | Women with Births | Births / 1,000 Women |
| 15 to 19 years | 0 (0.0%) | 0.0 |
| 20 to 34 years | 31 (100.0%) | 70.0 |
| 35 to 50 years | 0 (0.0%) | 0.0 |
| Total | 31 (100.0%) | 25.0 |
Fertility by Age by Marriage Status in Otis Orchards East Farms
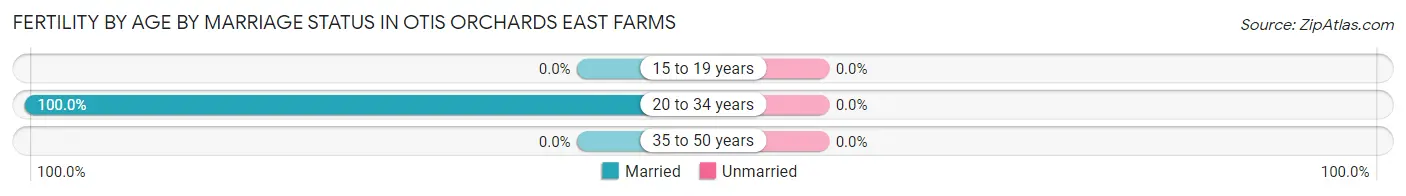
| Age Bracket | Married | Unmarried |
| 15 to 19 years | 0 (0.0%) | 0 (0.0%) |
| 20 to 34 years | 31 (100.0%) | 0 (0.0%) |
| 35 to 50 years | 0 (0.0%) | 0 (0.0%) |
| Total | 31 (100.0%) | 0 (0.0%) |
Fertility by Education in Otis Orchards East Farms
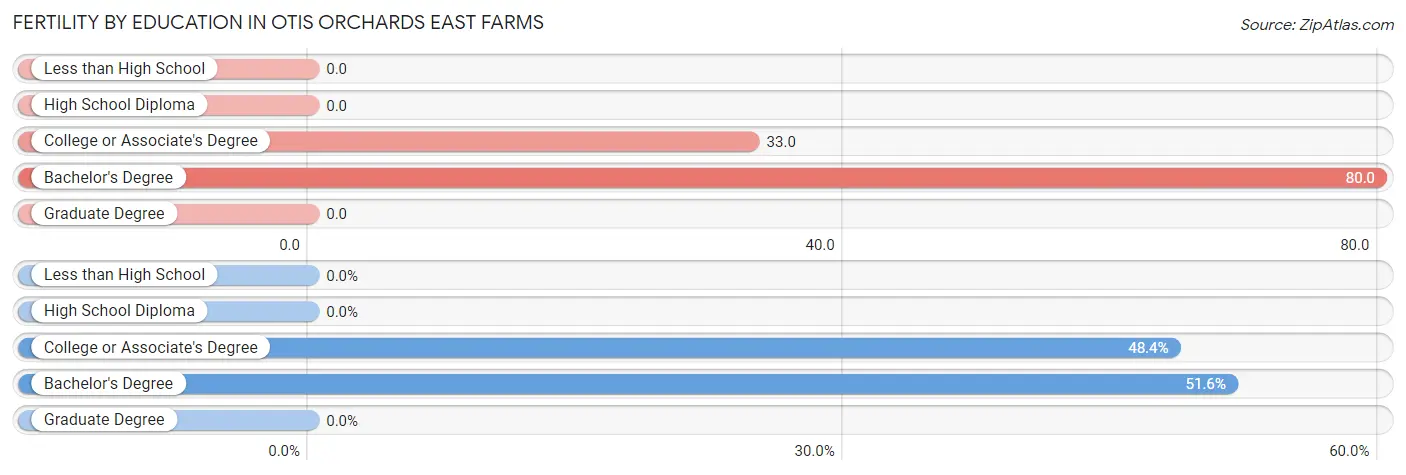
| Educational Attainment | Women with Births | Births / 1,000 Women |
| Less than High School | 0 (0.0%) | 0.0 |
| High School Diploma | 0 (0.0%) | 0.0 |
| College or Associate's Degree | 15 (48.4%) | 33.0 |
| Bachelor's Degree | 16 (51.6%) | 80.0 |
| Graduate Degree | 0 (0.0%) | 0.0 |
| Total | 31 (100.0%) | 25.0 |
Fertility by Education by Marriage Status in Otis Orchards East Farms
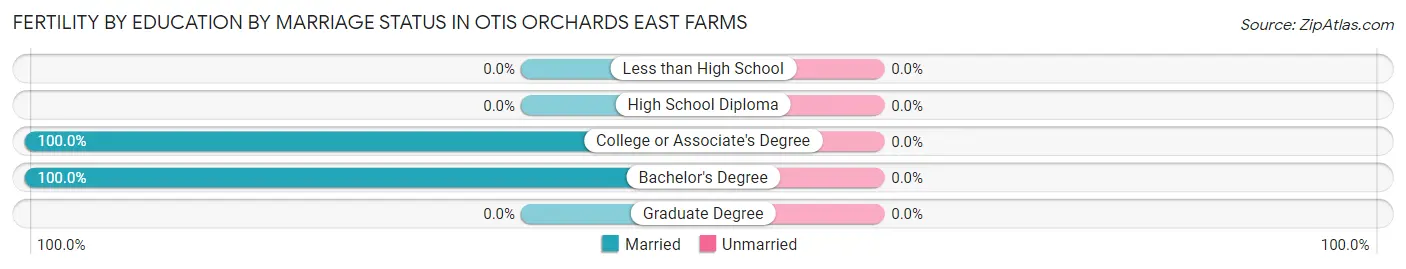
| Educational Attainment | Married | Unmarried |
| Less than High School | 0 (0.0%) | 0 (0.0%) |
| High School Diploma | 0 (0.0%) | 0 (0.0%) |
| College or Associate's Degree | 15 (100.0%) | 0 (0.0%) |
| Bachelor's Degree | 16 (100.0%) | 0 (0.0%) |
| Graduate Degree | 0 (0.0%) | 0 (0.0%) |
| Total | 31 (100.0%) | 0 (0.0%) |
Employment Characteristics in Otis Orchards East Farms
Employment by Class of Employer in Otis Orchards East Farms
Among the 2,608 employed individuals in Otis Orchards East Farms, private company employees (2,035 | 78.0%), not-for-profit organizations (189 | 7.2%), and local government employees (115 | 4.4%) make up the most common classes of employment.
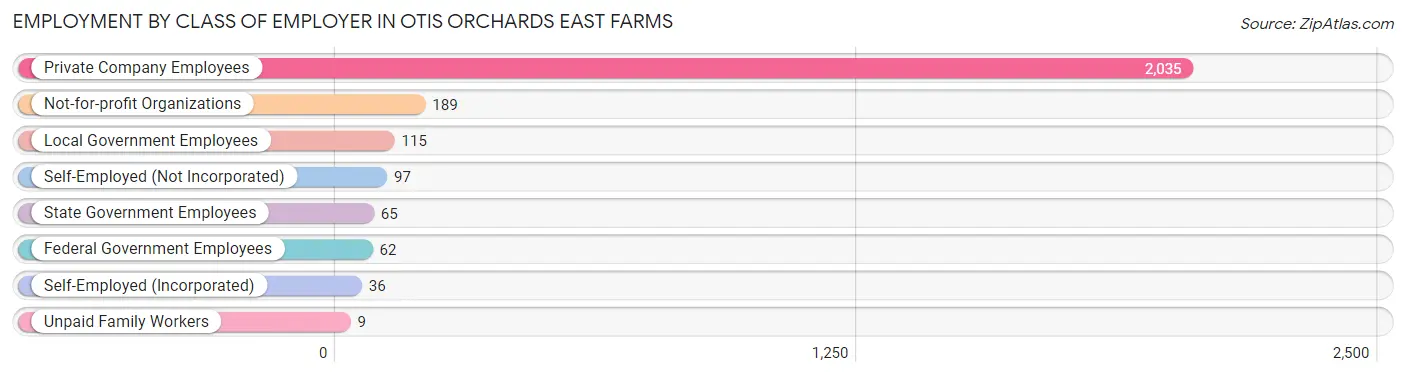
| Employer Class | # Employees | % Employees |
| Private Company Employees | 2,035 | 78.0% |
| Self-Employed (Incorporated) | 36 | 1.4% |
| Self-Employed (Not Incorporated) | 97 | 3.7% |
| Not-for-profit Organizations | 189 | 7.2% |
| Local Government Employees | 115 | 4.4% |
| State Government Employees | 65 | 2.5% |
| Federal Government Employees | 62 | 2.4% |
| Unpaid Family Workers | 9 | 0.4% |
| Total | 2,608 | 100.0% |
Employment Status by Age in Otis Orchards East Farms
According to the labor force statistics for Otis Orchards East Farms, out of the total population over 16 years of age (4,647), 59.4% or 2,760 individuals are in the labor force, with 5.0% or 138 of them unemployed. The age group with the highest labor force participation rate is 45 to 54 years, with 92.1% or 440 individuals in the labor force. Within the labor force, the 16 to 19 years age range has the highest percentage of unemployed individuals, with 57.8% or 59 of them being unemployed.
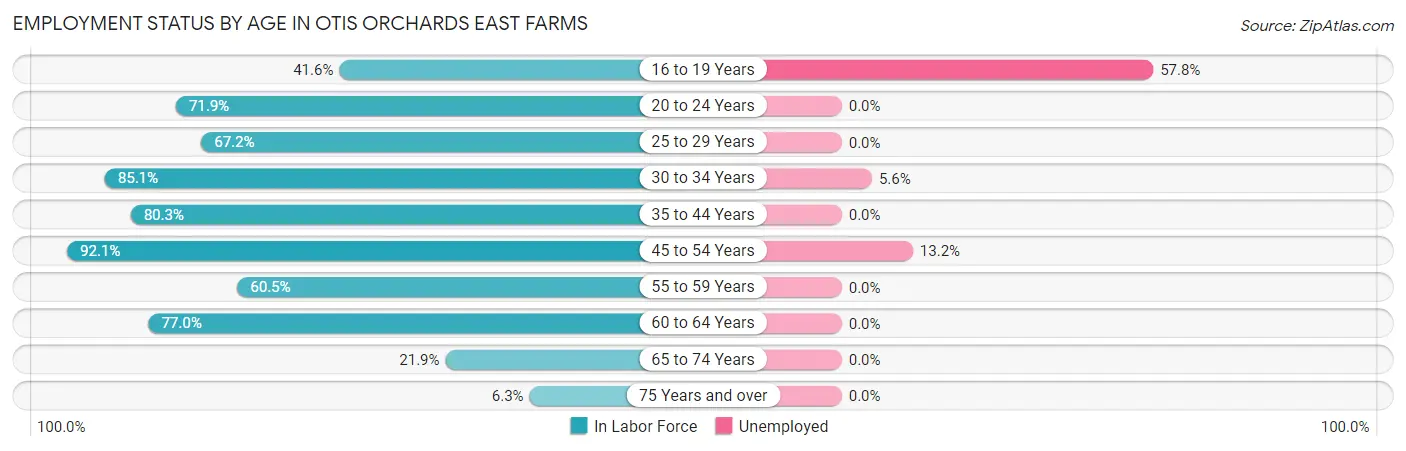
| Age Bracket | In Labor Force | Unemployed |
| 16 to 19 Years | 102 (41.6%) | 59 (57.8%) |
| 20 to 24 Years | 82 (71.9%) | 0 (0.0%) |
| 25 to 29 Years | 221 (67.2%) | 0 (0.0%) |
| 30 to 34 Years | 372 (85.1%) | 21 (5.6%) |
| 35 to 44 Years | 645 (80.3%) | 0 (0.0%) |
| 45 to 54 Years | 440 (92.1%) | 58 (13.2%) |
| 55 to 59 Years | 397 (60.5%) | 0 (0.0%) |
| 60 to 64 Years | 281 (77.0%) | 0 (0.0%) |
| 65 to 74 Years | 204 (21.9%) | 0 (0.0%) |
| 75 Years and over | 18 (6.3%) | 0 (0.0%) |
| Total | 2,760 (59.4%) | 138 (5.0%) |
Employment Status by Educational Attainment in Otis Orchards East Farms
According to labor force statistics for Otis Orchards East Farms, 76.8% of individuals (2,356) out of the total population between 25 and 64 years of age (3,068) are in the labor force, with 3.4% or 80 of them being unemployed. The group with the highest labor force participation rate are those with the educational attainment of bachelor's degree or higher, with 89.0% or 654 individuals in the labor force. Within the labor force, individuals with college / associate degree education have the highest percentage of unemployment, with 8.9% or 79 of them being unemployed.
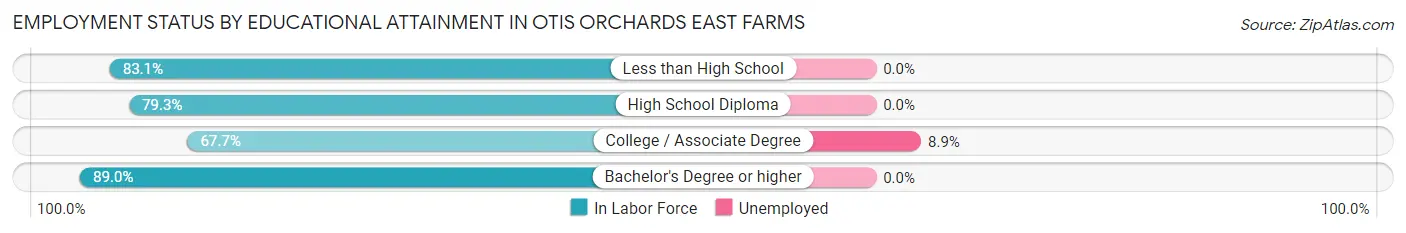
| Educational Attainment | In Labor Force | Unemployed |
| Less than High School | 103 (83.1%) | 0 (0.0%) |
| High School Diploma | 707 (79.3%) | 0 (0.0%) |
| College / Associate Degree | 892 (67.7%) | 117 (8.9%) |
| Bachelor's Degree or higher | 654 (89.0%) | 0 (0.0%) |
| Total | 2,356 (76.8%) | 104 (3.4%) |
Employment Occupations by Sex in Otis Orchards East Farms
Management, Business, Science and Arts Occupations
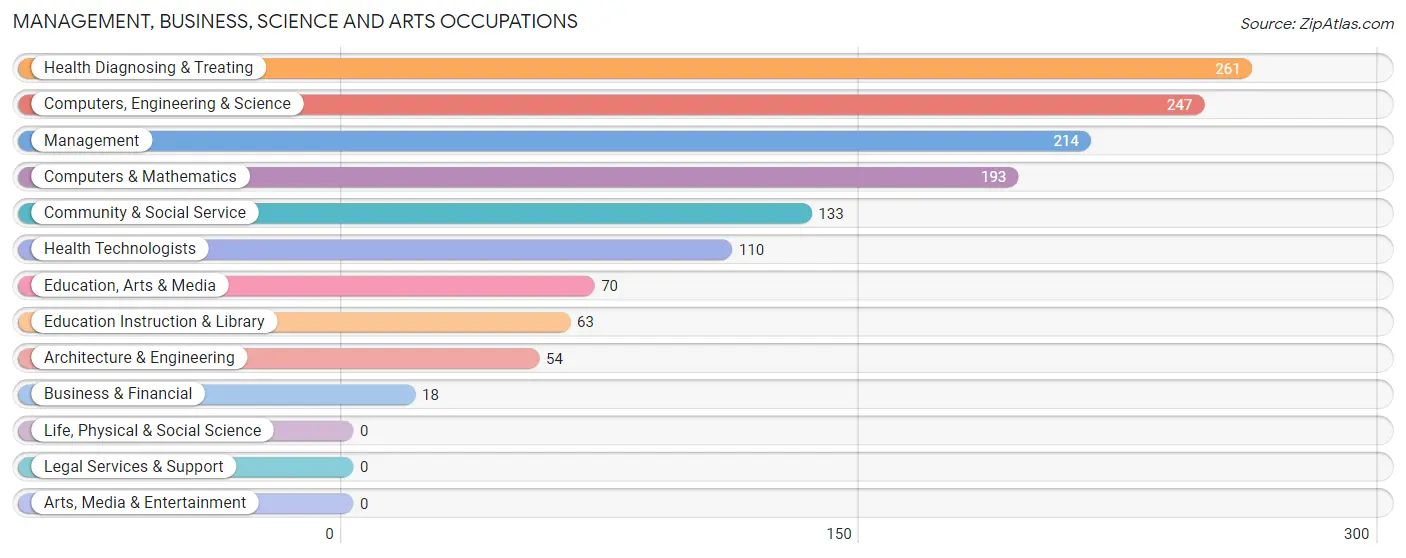
The most common Management, Business, Science and Arts occupations in Otis Orchards East Farms are Health Diagnosing & Treating (261 | 10.0%), Computers, Engineering & Science (247 | 9.4%), Management (214 | 8.2%), Computers & Mathematics (193 | 7.4%), and Community & Social Service (133 | 5.1%).
Management, Business, Science and Arts Occupations by Sex
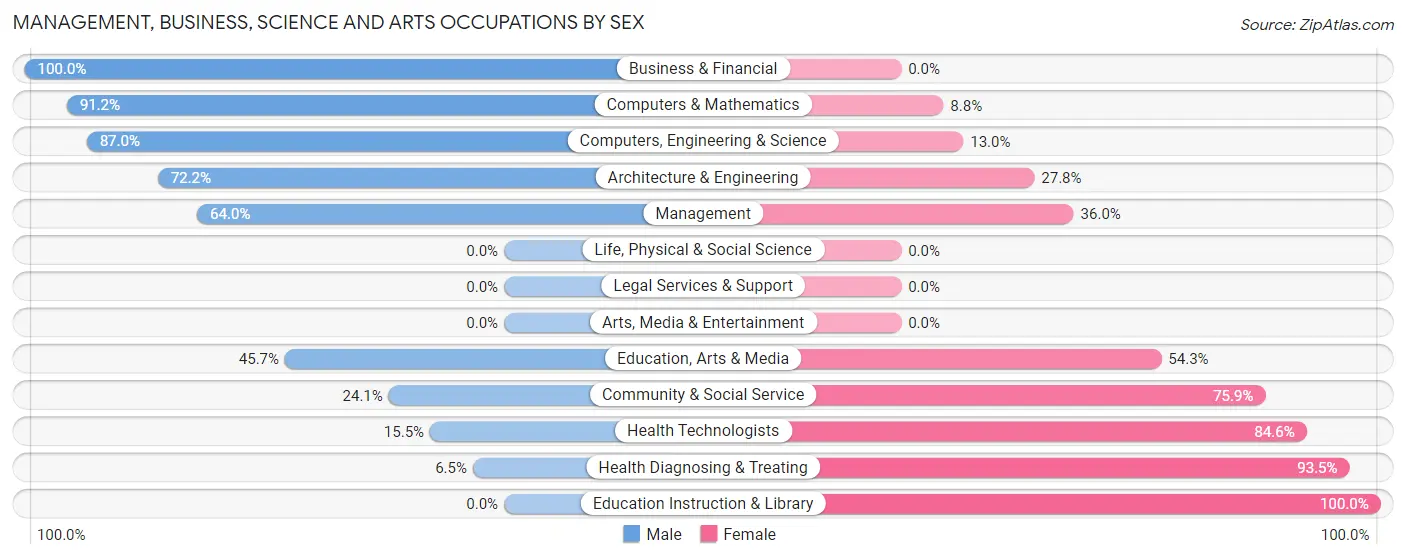
Within the Management, Business, Science and Arts occupations in Otis Orchards East Farms, the most male-oriented occupations are Business & Financial (100.0%), Computers & Mathematics (91.2%), and Computers, Engineering & Science (87.0%), while the most female-oriented occupations are Education Instruction & Library (100.0%), Health Diagnosing & Treating (93.5%), and Health Technologists (84.6%).
| Occupation | Male | Female |
| Management | 137 (64.0%) | 77 (36.0%) |
| Business & Financial | 18 (100.0%) | 0 (0.0%) |
| Computers, Engineering & Science | 215 (87.0%) | 32 (13.0%) |
| Computers & Mathematics | 176 (91.2%) | 17 (8.8%) |
| Architecture & Engineering | 39 (72.2%) | 15 (27.8%) |
| Life, Physical & Social Science | 0 (0.0%) | 0 (0.0%) |
| Community & Social Service | 32 (24.1%) | 101 (75.9%) |
| Education, Arts & Media | 32 (45.7%) | 38 (54.3%) |
| Legal Services & Support | 0 (0.0%) | 0 (0.0%) |
| Education Instruction & Library | 0 (0.0%) | 63 (100.0%) |
| Arts, Media & Entertainment | 0 (0.0%) | 0 (0.0%) |
| Health Diagnosing & Treating | 17 (6.5%) | 244 (93.5%) |
| Health Technologists | 17 (15.4%) | 93 (84.6%) |
| Total (Category) | 419 (48.0%) | 454 (52.0%) |
| Total (Overall) | 1,443 (55.0%) | 1,181 (45.0%) |
Services Occupations
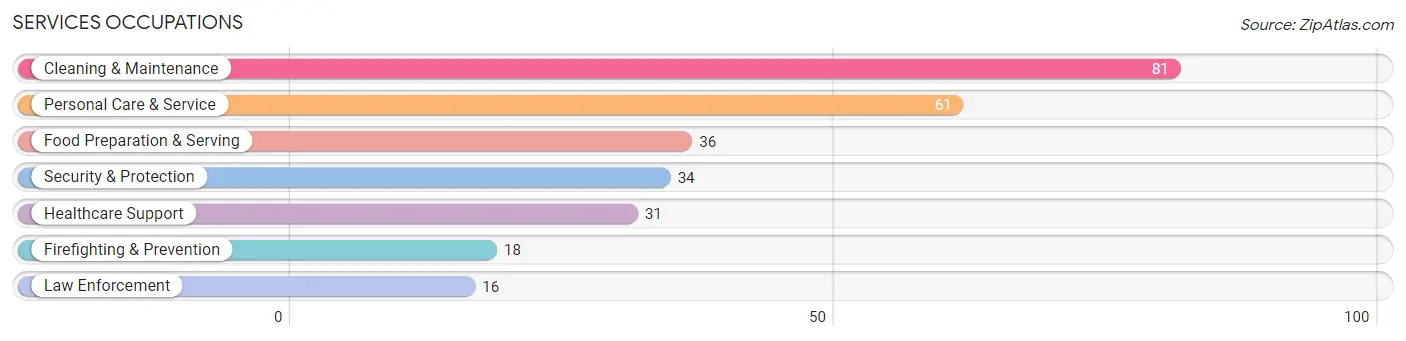
The most common Services occupations in Otis Orchards East Farms are Cleaning & Maintenance (81 | 3.1%), Personal Care & Service (61 | 2.3%), Food Preparation & Serving (36 | 1.4%), Security & Protection (34 | 1.3%), and Healthcare Support (31 | 1.2%).
Services Occupations by Sex
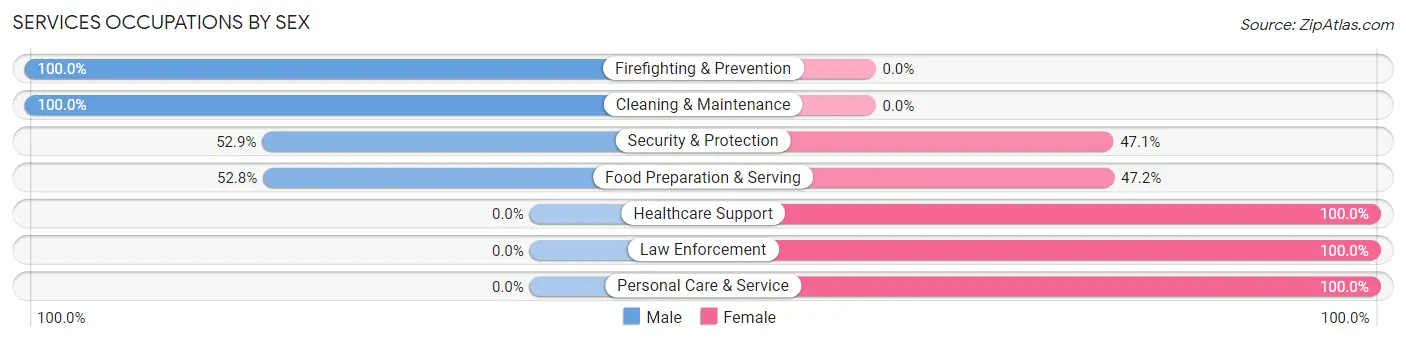
Within the Services occupations in Otis Orchards East Farms, the most male-oriented occupations are Firefighting & Prevention (100.0%), Cleaning & Maintenance (100.0%), and Security & Protection (52.9%), while the most female-oriented occupations are Healthcare Support (100.0%), Law Enforcement (100.0%), and Personal Care & Service (100.0%).
| Occupation | Male | Female |
| Healthcare Support | 0 (0.0%) | 31 (100.0%) |
| Security & Protection | 18 (52.9%) | 16 (47.1%) |
| Firefighting & Prevention | 18 (100.0%) | 0 (0.0%) |
| Law Enforcement | 0 (0.0%) | 16 (100.0%) |
| Food Preparation & Serving | 19 (52.8%) | 17 (47.2%) |
| Cleaning & Maintenance | 81 (100.0%) | 0 (0.0%) |
| Personal Care & Service | 0 (0.0%) | 61 (100.0%) |
| Total (Category) | 118 (48.6%) | 125 (51.4%) |
| Total (Overall) | 1,443 (55.0%) | 1,181 (45.0%) |
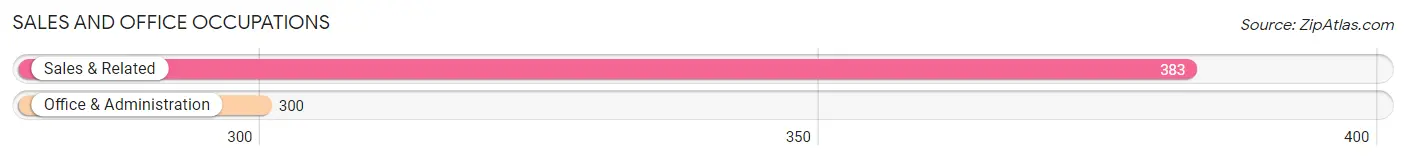
Sales and Office Occupations
The most common Sales and Office occupations in Otis Orchards East Farms are Sales & Related (383 | 14.6%), and Office & Administration (300 | 11.4%).
Sales and Office Occupations by Sex
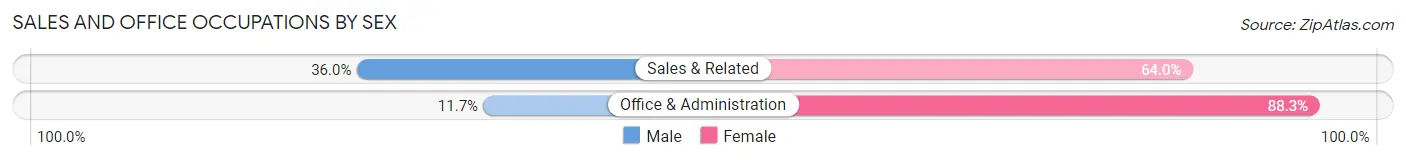
| Occupation | Male | Female |
| Sales & Related | 138 (36.0%) | 245 (64.0%) |
| Office & Administration | 35 (11.7%) | 265 (88.3%) |
| Total (Category) | 173 (25.3%) | 510 (74.7%) |
| Total (Overall) | 1,443 (55.0%) | 1,181 (45.0%) |
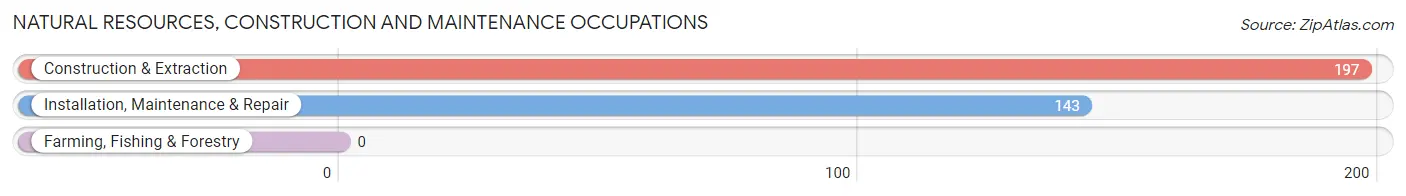
Natural Resources, Construction and Maintenance Occupations
The most common Natural Resources, Construction and Maintenance occupations in Otis Orchards East Farms are Construction & Extraction (197 | 7.5%), and Installation, Maintenance & Repair (143 | 5.4%).
Natural Resources, Construction and Maintenance Occupations by Sex
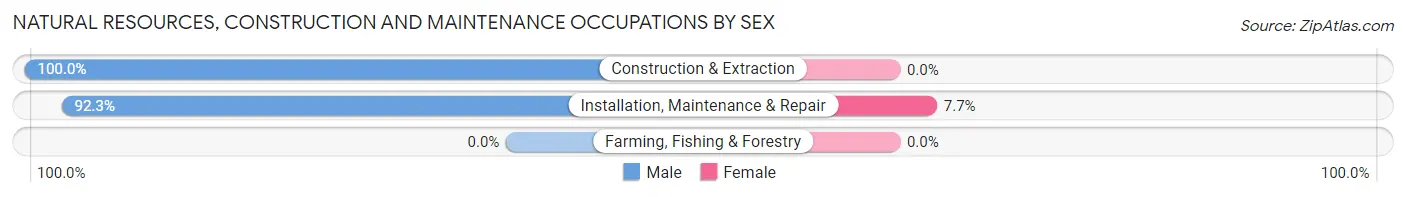
| Occupation | Male | Female |
| Farming, Fishing & Forestry | 0 (0.0%) | 0 (0.0%) |
| Construction & Extraction | 197 (100.0%) | 0 (0.0%) |
| Installation, Maintenance & Repair | 132 (92.3%) | 11 (7.7%) |
| Total (Category) | 329 (96.8%) | 11 (3.2%) |
| Total (Overall) | 1,443 (55.0%) | 1,181 (45.0%) |
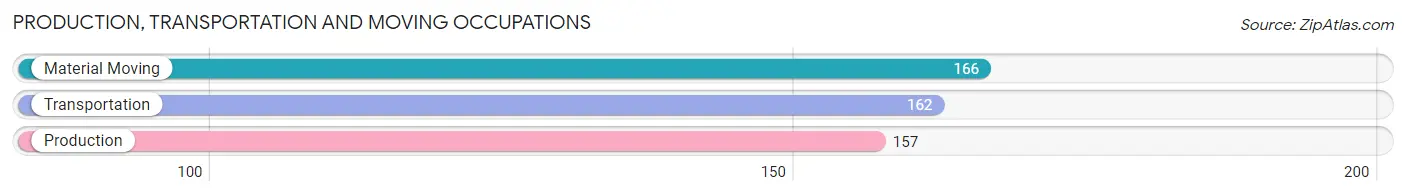
Production, Transportation and Moving Occupations
The most common Production, Transportation and Moving occupations in Otis Orchards East Farms are Material Moving (166 | 6.3%), Transportation (162 | 6.2%), and Production (157 | 6.0%).
Production, Transportation and Moving Occupations by Sex
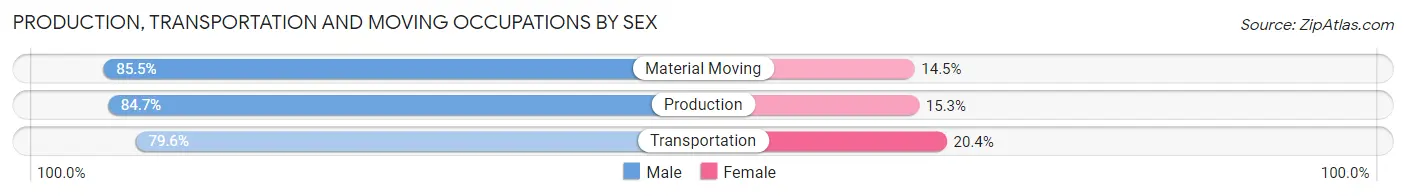
| Occupation | Male | Female |
| Production | 133 (84.7%) | 24 (15.3%) |
| Transportation | 129 (79.6%) | 33 (20.4%) |
| Material Moving | 142 (85.5%) | 24 (14.5%) |
| Total (Category) | 404 (83.3%) | 81 (16.7%) |
| Total (Overall) | 1,443 (55.0%) | 1,181 (45.0%) |
Employment Industries by Sex in Otis Orchards East Farms
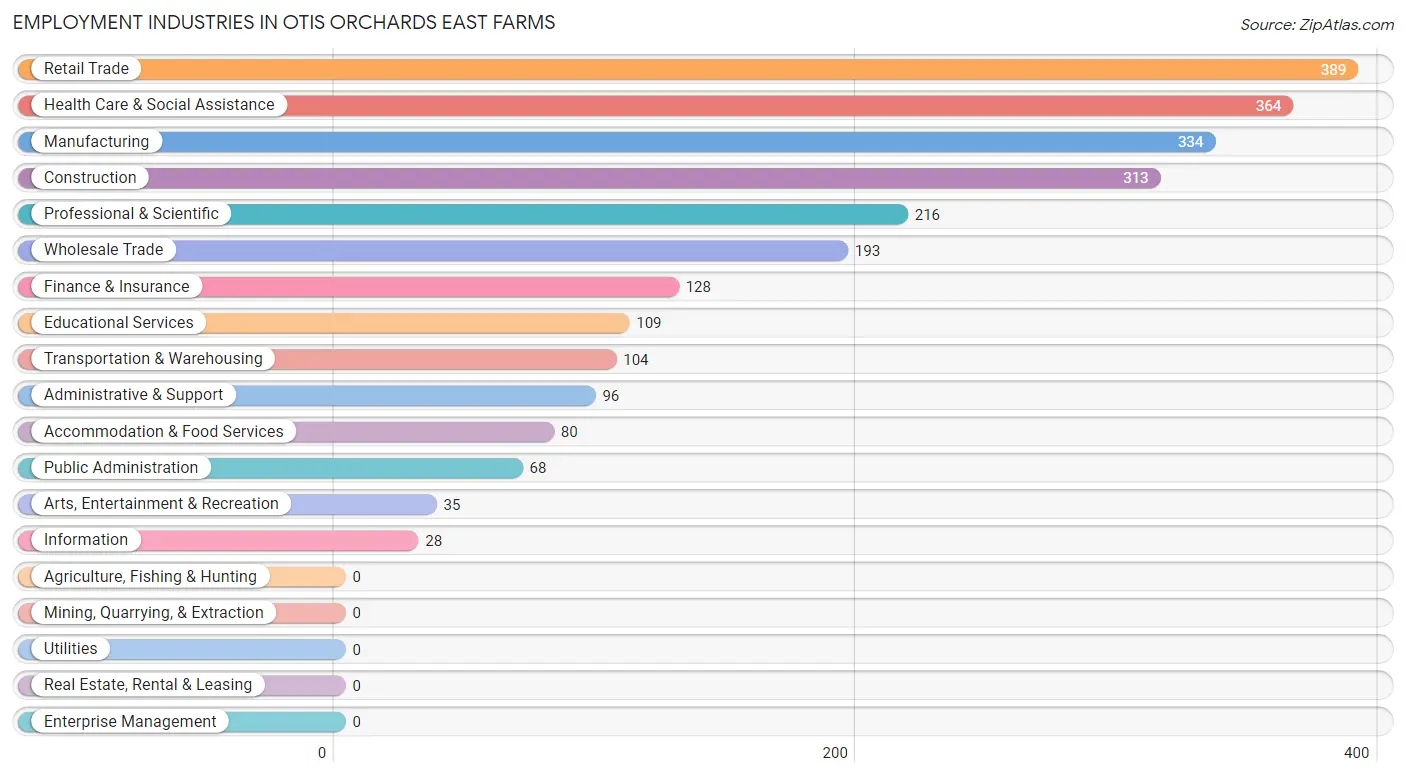
Employment Industries in Otis Orchards East Farms
The major employment industries in Otis Orchards East Farms include Retail Trade (389 | 14.8%), Health Care & Social Assistance (364 | 13.9%), Manufacturing (334 | 12.7%), Construction (313 | 11.9%), and Professional & Scientific (216 | 8.2%).
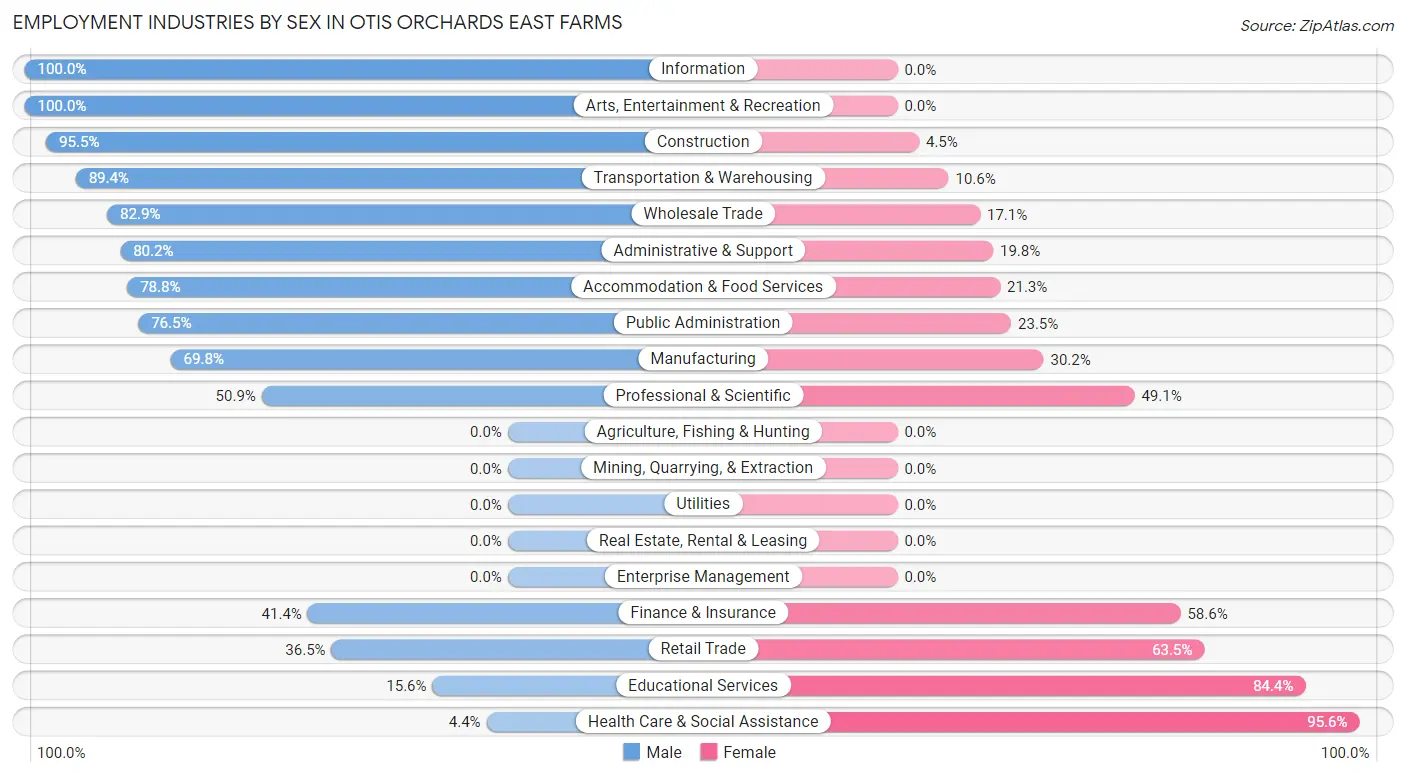
Employment Industries by Sex in Otis Orchards East Farms
The Otis Orchards East Farms industries that see more men than women are Information (100.0%), Arts, Entertainment & Recreation (100.0%), and Construction (95.5%), whereas the industries that tend to have a higher number of women are Health Care & Social Assistance (95.6%), Educational Services (84.4%), and Retail Trade (63.5%).
| Industry | Male | Female |
| Agriculture, Fishing & Hunting | 0 (0.0%) | 0 (0.0%) |
| Mining, Quarrying, & Extraction | 0 (0.0%) | 0 (0.0%) |
| Construction | 299 (95.5%) | 14 (4.5%) |
| Manufacturing | 233 (69.8%) | 101 (30.2%) |
| Wholesale Trade | 160 (82.9%) | 33 (17.1%) |
| Retail Trade | 142 (36.5%) | 247 (63.5%) |
| Transportation & Warehousing | 93 (89.4%) | 11 (10.6%) |
| Utilities | 0 (0.0%) | 0 (0.0%) |
| Information | 28 (100.0%) | 0 (0.0%) |
| Finance & Insurance | 53 (41.4%) | 75 (58.6%) |
| Real Estate, Rental & Leasing | 0 (0.0%) | 0 (0.0%) |
| Professional & Scientific | 110 (50.9%) | 106 (49.1%) |
| Enterprise Management | 0 (0.0%) | 0 (0.0%) |
| Administrative & Support | 77 (80.2%) | 19 (19.8%) |
| Educational Services | 17 (15.6%) | 92 (84.4%) |
| Health Care & Social Assistance | 16 (4.4%) | 348 (95.6%) |
| Arts, Entertainment & Recreation | 35 (100.0%) | 0 (0.0%) |
| Accommodation & Food Services | 63 (78.7%) | 17 (21.2%) |
| Public Administration | 52 (76.5%) | 16 (23.5%) |
| Total | 1,443 (55.0%) | 1,181 (45.0%) |
Education in Otis Orchards East Farms
School Enrollment in Otis Orchards East Farms
The most common levels of schooling among the 1,310 students in Otis Orchards East Farms are high school (322 | 24.6%), elementary school (284 | 21.7%), and college / undergraduate (271 | 20.7%).
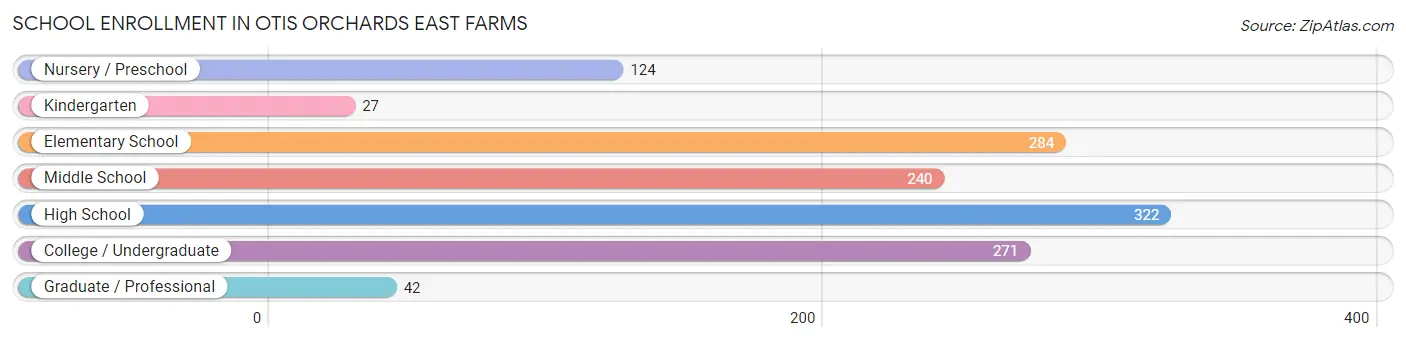
| School Level | # Students | % Students |
| Nursery / Preschool | 124 | 9.5% |
| Kindergarten | 27 | 2.1% |
| Elementary School | 284 | 21.7% |
| Middle School | 240 | 18.3% |
| High School | 322 | 24.6% |
| College / Undergraduate | 271 | 20.7% |
| Graduate / Professional | 42 | 3.2% |
| Total | 1,310 | 100.0% |
School Enrollment by Age by Funding Source in Otis Orchards East Farms
Out of a total of 1,310 students who are enrolled in schools in Otis Orchards East Farms, 303 (23.1%) attend a private institution, while the remaining 1,007 (76.9%) are enrolled in public schools. The age group of 5 to 9 year old has the highest likelihood of being enrolled in private schools, with 107 (34.4% in the age bracket) enrolled. Conversely, the age group of 20 to 24 year olds has the lowest likelihood of being enrolled in a private school, with 16 (100.0% in the age bracket) attending a public institution.
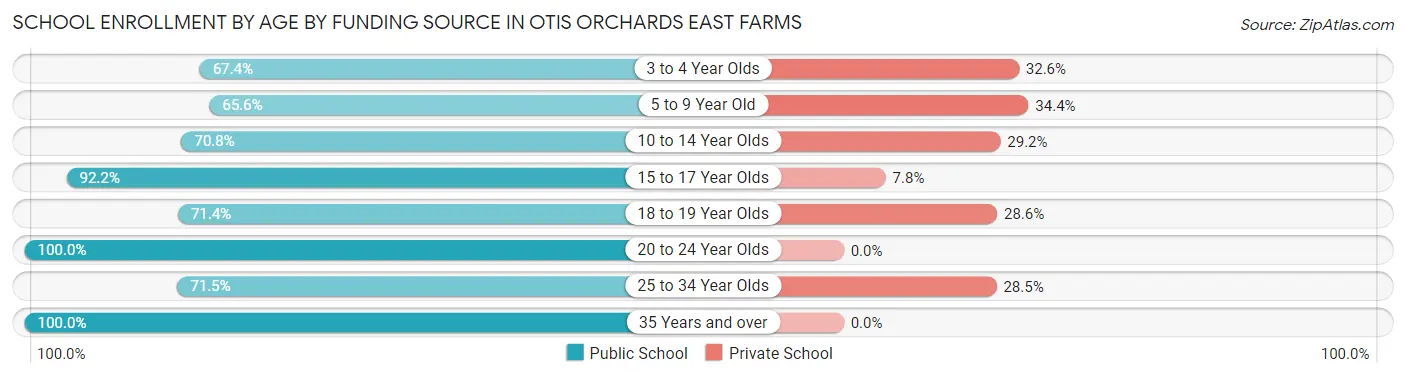
| Age Bracket | Public School | Private School |
| 3 to 4 Year Olds | 64 (67.4%) | 31 (32.6%) |
| 5 to 9 Year Old | 204 (65.6%) | 107 (34.4%) |
| 10 to 14 Year Olds | 228 (70.8%) | 94 (29.2%) |
| 15 to 17 Year Olds | 224 (92.2%) | 19 (7.8%) |
| 18 to 19 Year Olds | 35 (71.4%) | 14 (28.6%) |
| 20 to 24 Year Olds | 16 (100.0%) | 0 (0.0%) |
| 25 to 34 Year Olds | 93 (71.5%) | 37 (28.5%) |
| 35 Years and over | 144 (100.0%) | 0 (0.0%) |
| Total | 1,007 (76.9%) | 303 (23.1%) |
Educational Attainment by Field of Study in Otis Orchards East Farms
Science & technology (181 | 19.2%), business (156 | 16.5%), engineering (136 | 14.4%), education (125 | 13.2%), and physical & health sciences (66 | 7.0%) are the most common fields of study among 944 individuals in Otis Orchards East Farms who have obtained a bachelor's degree or higher.
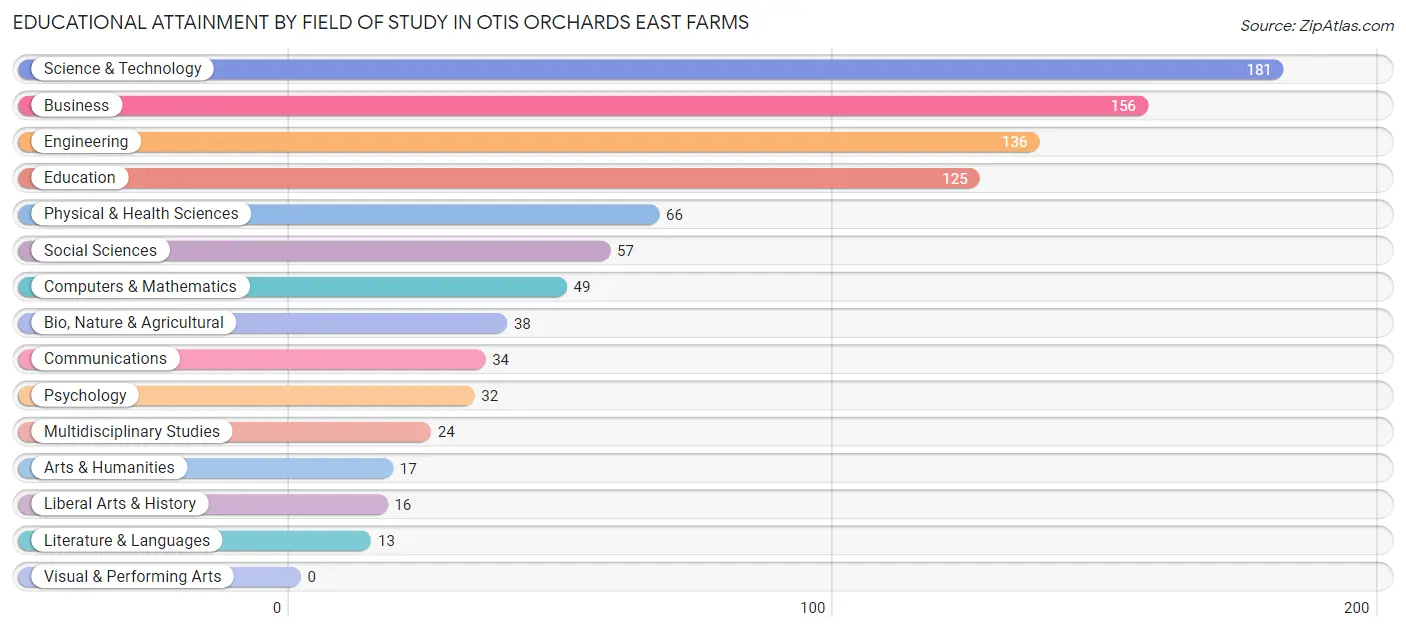
| Field of Study | # Graduates | % Graduates |
| Computers & Mathematics | 49 | 5.2% |
| Bio, Nature & Agricultural | 38 | 4.0% |
| Physical & Health Sciences | 66 | 7.0% |
| Psychology | 32 | 3.4% |
| Social Sciences | 57 | 6.0% |
| Engineering | 136 | 14.4% |
| Multidisciplinary Studies | 24 | 2.5% |
| Science & Technology | 181 | 19.2% |
| Business | 156 | 16.5% |
| Education | 125 | 13.2% |
| Literature & Languages | 13 | 1.4% |
| Liberal Arts & History | 16 | 1.7% |
| Visual & Performing Arts | 0 | 0.0% |
| Communications | 34 | 3.6% |
| Arts & Humanities | 17 | 1.8% |
| Total | 944 | 100.0% |
Transportation & Commute in Otis Orchards East Farms
Vehicle Availability by Sex in Otis Orchards East Farms
The most prevalent vehicle ownership categories in Otis Orchards East Farms are males with 2 vehicles (515, accounting for 35.7%) and females with 2 vehicles (273, making up 44.2%).
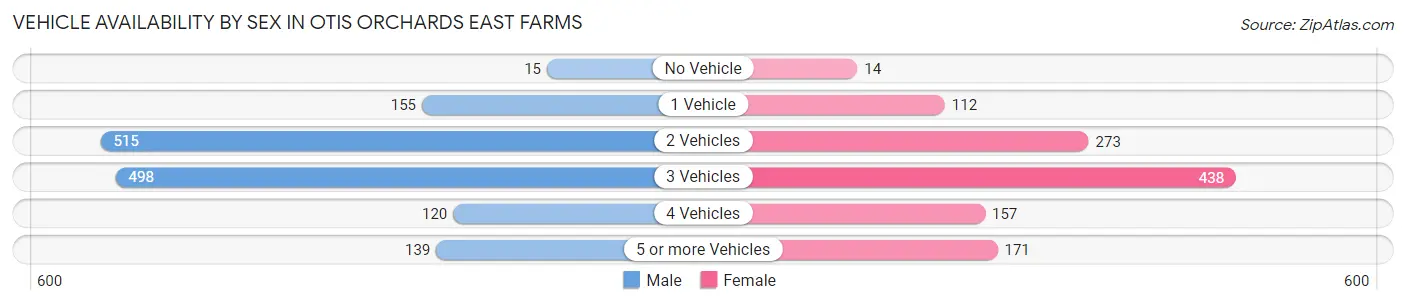
| Vehicles Available | Male | Female |
| No Vehicle | 15 (1.0%) | 14 (1.2%) |
| 1 Vehicle | 155 (10.7%) | 112 (9.6%) |
| 2 Vehicles | 515 (35.7%) | 273 (23.4%) |
| 3 Vehicles | 498 (34.5%) | 438 (37.6%) |
| 4 Vehicles | 120 (8.3%) | 157 (13.5%) |
| 5 or more Vehicles | 139 (9.6%) | 171 (14.7%) |
| Total | 1,442 (100.0%) | 1,165 (100.0%) |
Commute Time in Otis Orchards East Farms
The most frequently occuring commute durations in Otis Orchards East Farms are 15 to 19 minutes (469 commuters, 19.8%), 20 to 24 minutes (459 commuters, 19.4%), and 25 to 29 minutes (270 commuters, 11.4%).
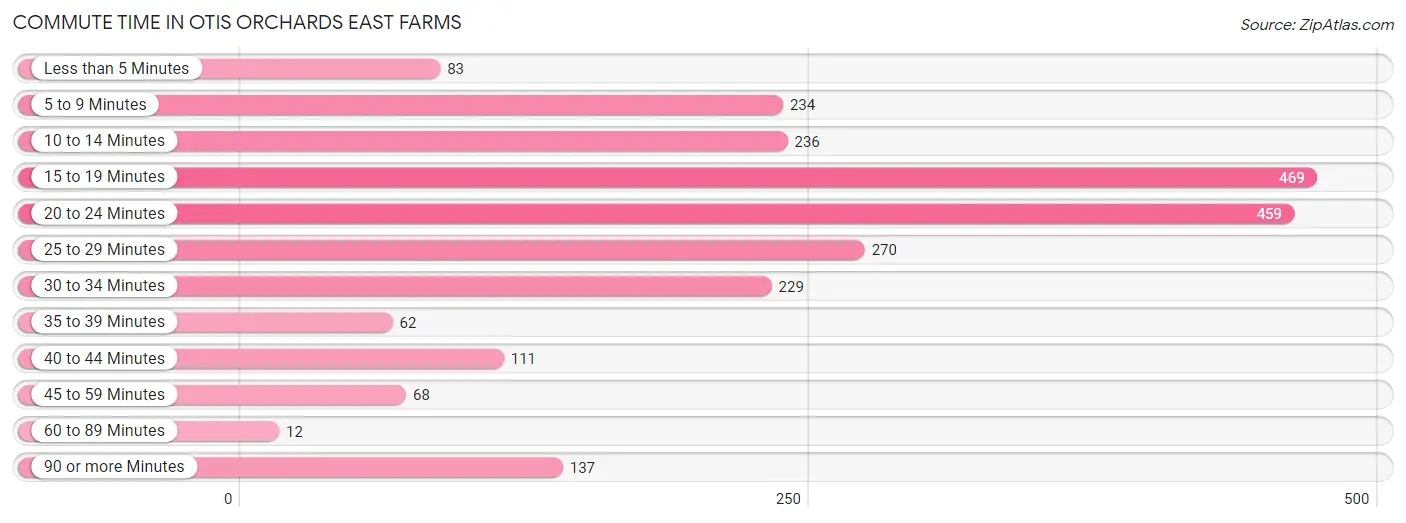
| Commute Time | # Commuters | % Commuters |
| Less than 5 Minutes | 83 | 3.5% |
| 5 to 9 Minutes | 234 | 9.9% |
| 10 to 14 Minutes | 236 | 10.0% |
| 15 to 19 Minutes | 469 | 19.8% |
| 20 to 24 Minutes | 459 | 19.4% |
| 25 to 29 Minutes | 270 | 11.4% |
| 30 to 34 Minutes | 229 | 9.7% |
| 35 to 39 Minutes | 62 | 2.6% |
| 40 to 44 Minutes | 111 | 4.7% |
| 45 to 59 Minutes | 68 | 2.9% |
| 60 to 89 Minutes | 12 | 0.5% |
| 90 or more Minutes | 137 | 5.8% |
Commute Time by Sex in Otis Orchards East Farms
The most common commute times in Otis Orchards East Farms are 15 to 19 minutes (286 commuters, 21.8%) for males and 20 to 24 minutes (317 commuters, 29.9%) for females.
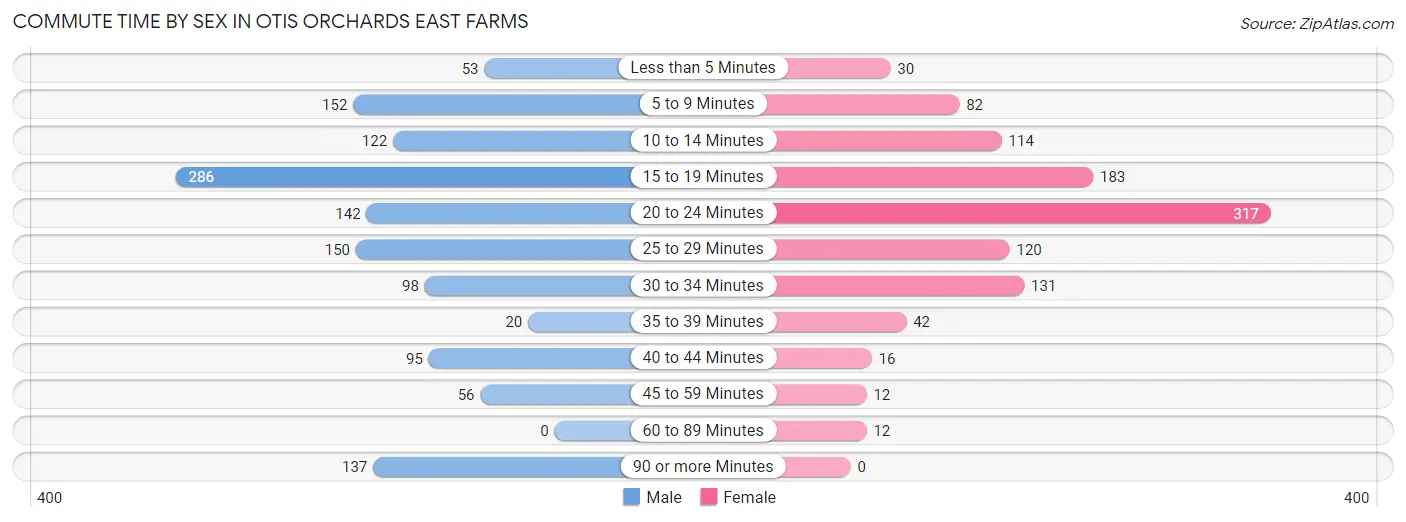
| Commute Time | Male | Female |
| Less than 5 Minutes | 53 (4.0%) | 30 (2.8%) |
| 5 to 9 Minutes | 152 (11.6%) | 82 (7.7%) |
| 10 to 14 Minutes | 122 (9.3%) | 114 (10.8%) |
| 15 to 19 Minutes | 286 (21.8%) | 183 (17.3%) |
| 20 to 24 Minutes | 142 (10.8%) | 317 (29.9%) |
| 25 to 29 Minutes | 150 (11.4%) | 120 (11.3%) |
| 30 to 34 Minutes | 98 (7.5%) | 131 (12.4%) |
| 35 to 39 Minutes | 20 (1.5%) | 42 (4.0%) |
| 40 to 44 Minutes | 95 (7.2%) | 16 (1.5%) |
| 45 to 59 Minutes | 56 (4.3%) | 12 (1.1%) |
| 60 to 89 Minutes | 0 (0.0%) | 12 (1.1%) |
| 90 or more Minutes | 137 (10.4%) | 0 (0.0%) |
Time of Departure to Work by Sex in Otis Orchards East Farms
The most frequent times of departure to work in Otis Orchards East Farms are 6:30 AM to 6:59 AM (301, 23.0%) for males and 6:30 AM to 6:59 AM (172, 16.2%) for females.
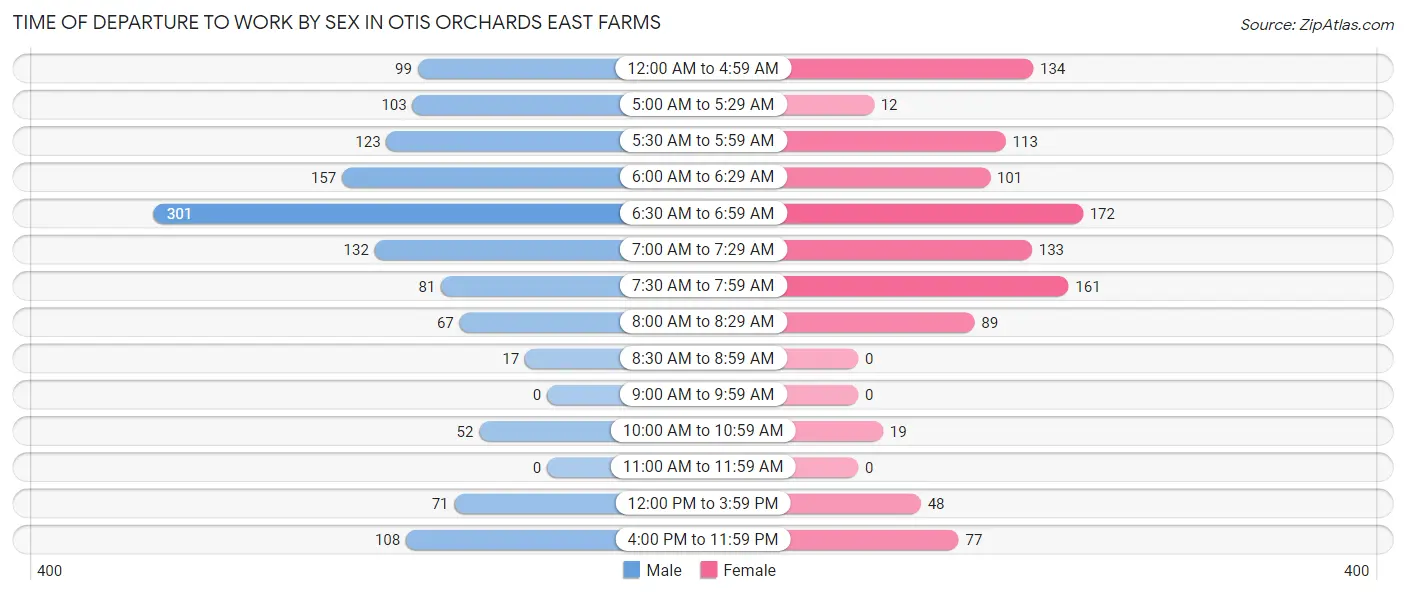
| Time of Departure | Male | Female |
| 12:00 AM to 4:59 AM | 99 (7.5%) | 134 (12.7%) |
| 5:00 AM to 5:29 AM | 103 (7.9%) | 12 (1.1%) |
| 5:30 AM to 5:59 AM | 123 (9.4%) | 113 (10.7%) |
| 6:00 AM to 6:29 AM | 157 (12.0%) | 101 (9.5%) |
| 6:30 AM to 6:59 AM | 301 (23.0%) | 172 (16.2%) |
| 7:00 AM to 7:29 AM | 132 (10.1%) | 133 (12.6%) |
| 7:30 AM to 7:59 AM | 81 (6.2%) | 161 (15.2%) |
| 8:00 AM to 8:29 AM | 67 (5.1%) | 89 (8.4%) |
| 8:30 AM to 8:59 AM | 17 (1.3%) | 0 (0.0%) |
| 9:00 AM to 9:59 AM | 0 (0.0%) | 0 (0.0%) |
| 10:00 AM to 10:59 AM | 52 (4.0%) | 19 (1.8%) |
| 11:00 AM to 11:59 AM | 0 (0.0%) | 0 (0.0%) |
| 12:00 PM to 3:59 PM | 71 (5.4%) | 48 (4.5%) |
| 4:00 PM to 11:59 PM | 108 (8.2%) | 77 (7.3%) |
| Total | 1,311 (100.0%) | 1,059 (100.0%) |
Housing Occupancy in Otis Orchards East Farms
Occupancy by Ownership in Otis Orchards East Farms
Of the total 2,135 dwellings in Otis Orchards East Farms, owner-occupied units account for 1,986 (93.0%), while renter-occupied units make up 149 (7.0%).
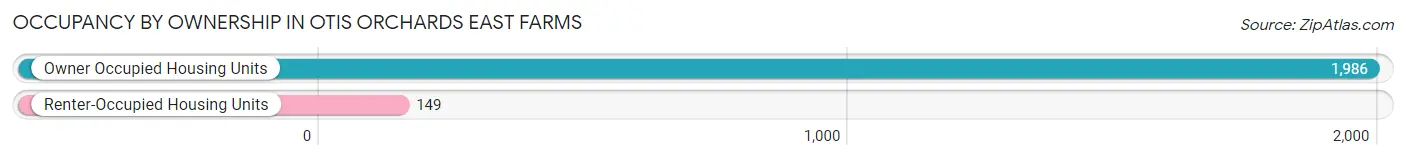
| Occupancy | # Housing Units | % Housing Units |
| Owner Occupied Housing Units | 1,986 | 93.0% |
| Renter-Occupied Housing Units | 149 | 7.0% |
| Total Occupied Housing Units | 2,135 | 100.0% |
Occupancy by Household Size in Otis Orchards East Farms
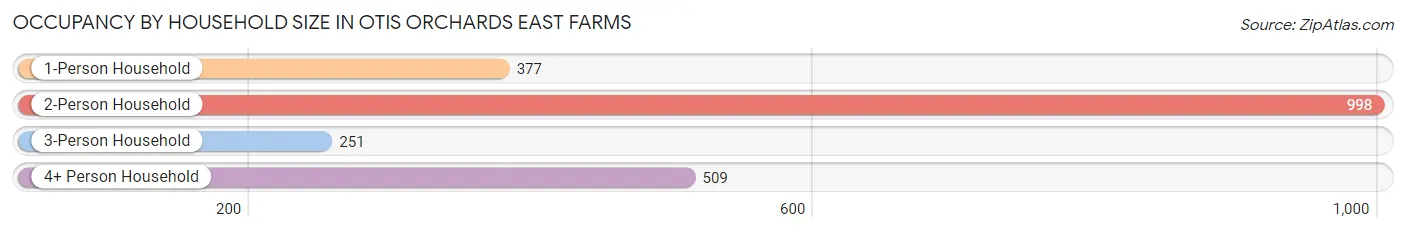
| Household Size | # Housing Units | % Housing Units |
| 1-Person Household | 377 | 17.7% |
| 2-Person Household | 998 | 46.7% |
| 3-Person Household | 251 | 11.8% |
| 4+ Person Household | 509 | 23.8% |
| Total Housing Units | 2,135 | 100.0% |
Occupancy by Ownership by Household Size in Otis Orchards East Farms
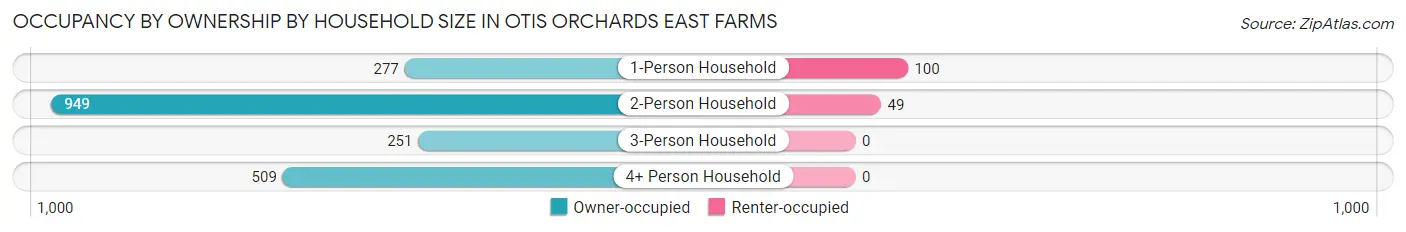
| Household Size | Owner-occupied | Renter-occupied |
| 1-Person Household | 277 (73.5%) | 100 (26.5%) |
| 2-Person Household | 949 (95.1%) | 49 (4.9%) |
| 3-Person Household | 251 (100.0%) | 0 (0.0%) |
| 4+ Person Household | 509 (100.0%) | 0 (0.0%) |
| Total Housing Units | 1,986 (93.0%) | 149 (7.0%) |
Occupancy by Educational Attainment in Otis Orchards East Farms
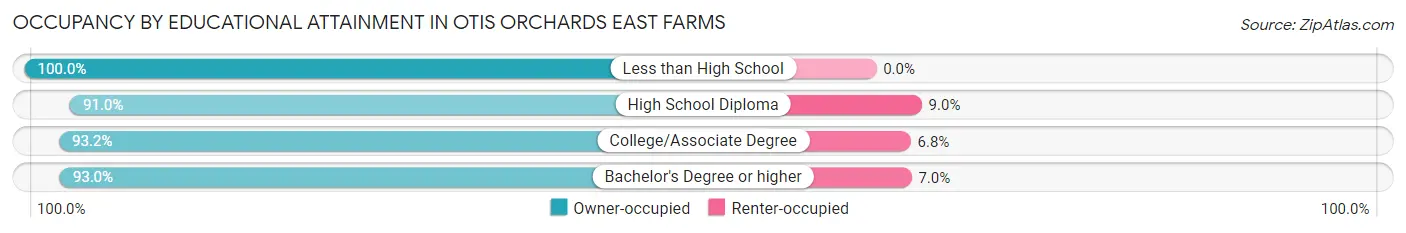
| Household Size | Owner-occupied | Renter-occupied |
| Less than High School | 143 (100.0%) | 0 (0.0%) |
| High School Diploma | 494 (91.0%) | 49 (9.0%) |
| College/Associate Degree | 791 (93.2%) | 58 (6.8%) |
| Bachelor's Degree or higher | 558 (93.0%) | 42 (7.0%) |
Occupancy by Age of Householder in Otis Orchards East Farms
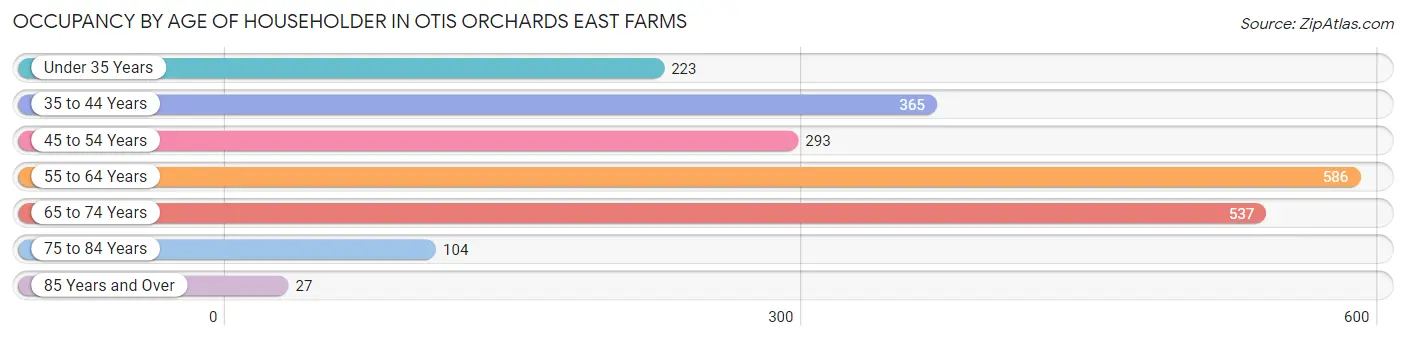
| Age Bracket | # Households | % Households |
| Under 35 Years | 223 | 10.4% |
| 35 to 44 Years | 365 | 17.1% |
| 45 to 54 Years | 293 | 13.7% |
| 55 to 64 Years | 586 | 27.5% |
| 65 to 74 Years | 537 | 25.2% |
| 75 to 84 Years | 104 | 4.9% |
| 85 Years and Over | 27 | 1.3% |
| Total | 2,135 | 100.0% |
Housing Finances in Otis Orchards East Farms
Median Income by Occupancy in Otis Orchards East Farms
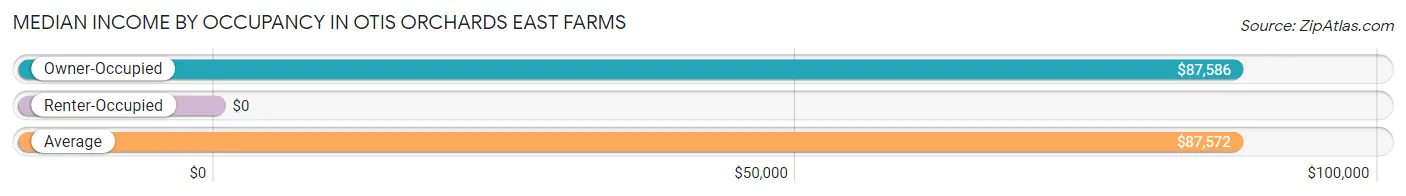
| Occupancy Type | # Households | Median Income |
| Owner-Occupied | 1,986 (93.0%) | $87,586 |
| Renter-Occupied | 149 (7.0%) | $0 |
| Average | 2,135 (100.0%) | $87,572 |
Occupancy by Householder Income Bracket in Otis Orchards East Farms
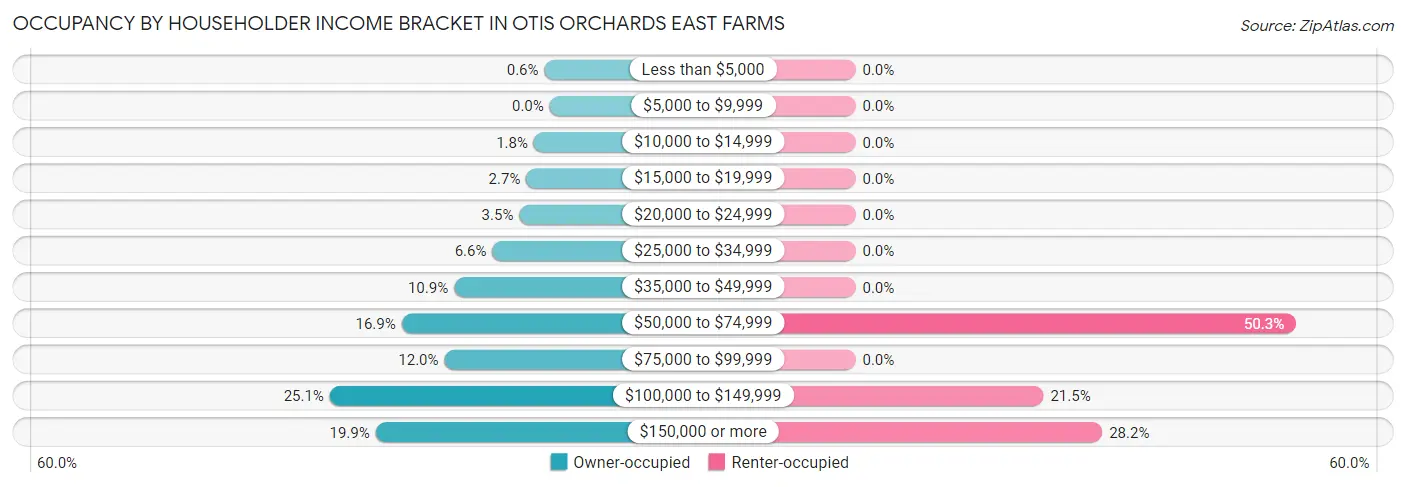
| Income Bracket | Owner-occupied | Renter-occupied |
| Less than $5,000 | 12 (0.6%) | 0 (0.0%) |
| $5,000 to $9,999 | 0 (0.0%) | 0 (0.0%) |
| $10,000 to $14,999 | 36 (1.8%) | 0 (0.0%) |
| $15,000 to $19,999 | 53 (2.7%) | 0 (0.0%) |
| $20,000 to $24,999 | 69 (3.5%) | 0 (0.0%) |
| $25,000 to $34,999 | 130 (6.6%) | 0 (0.0%) |
| $35,000 to $49,999 | 217 (10.9%) | 0 (0.0%) |
| $50,000 to $74,999 | 336 (16.9%) | 75 (50.3%) |
| $75,000 to $99,999 | 239 (12.0%) | 0 (0.0%) |
| $100,000 to $149,999 | 499 (25.1%) | 32 (21.5%) |
| $150,000 or more | 395 (19.9%) | 42 (28.2%) |
| Total | 1,986 (100.0%) | 149 (100.0%) |
Monthly Housing Cost Tiers in Otis Orchards East Farms
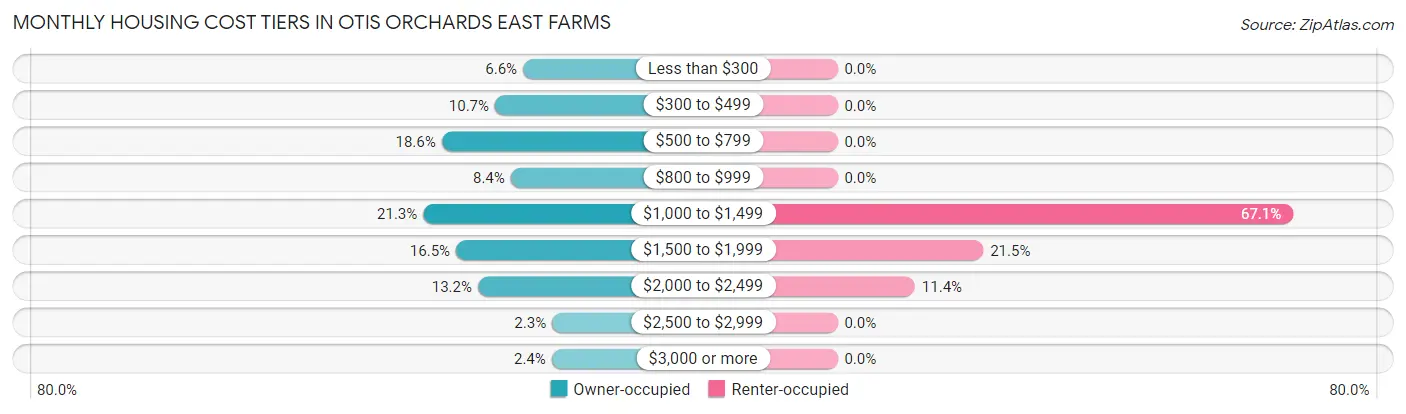
| Monthly Cost | Owner-occupied | Renter-occupied |
| Less than $300 | 131 (6.6%) | 0 (0.0%) |
| $300 to $499 | 213 (10.7%) | 0 (0.0%) |
| $500 to $799 | 369 (18.6%) | 0 (0.0%) |
| $800 to $999 | 167 (8.4%) | 0 (0.0%) |
| $1,000 to $1,499 | 423 (21.3%) | 100 (67.1%) |
| $1,500 to $1,999 | 327 (16.5%) | 32 (21.5%) |
| $2,000 to $2,499 | 263 (13.2%) | 17 (11.4%) |
| $2,500 to $2,999 | 46 (2.3%) | 0 (0.0%) |
| $3,000 or more | 47 (2.4%) | 0 (0.0%) |
| Total | 1,986 (100.0%) | 149 (100.0%) |
Physical Housing Characteristics in Otis Orchards East Farms
Housing Structures in Otis Orchards East Farms
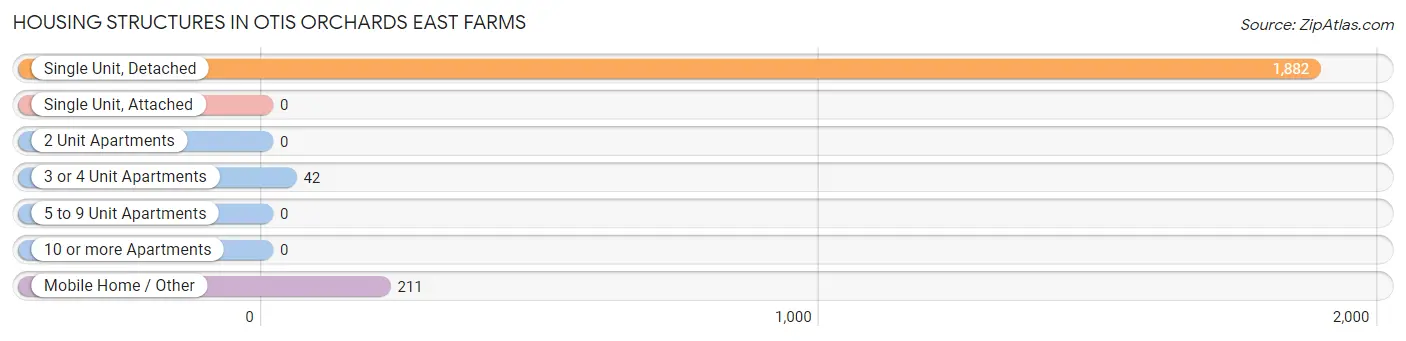
| Structure Type | # Housing Units | % Housing Units |
| Single Unit, Detached | 1,882 | 88.1% |
| Single Unit, Attached | 0 | 0.0% |
| 2 Unit Apartments | 0 | 0.0% |
| 3 or 4 Unit Apartments | 42 | 2.0% |
| 5 to 9 Unit Apartments | 0 | 0.0% |
| 10 or more Apartments | 0 | 0.0% |
| Mobile Home / Other | 211 | 9.9% |
| Total | 2,135 | 100.0% |
Housing Structures by Occupancy in Otis Orchards East Farms
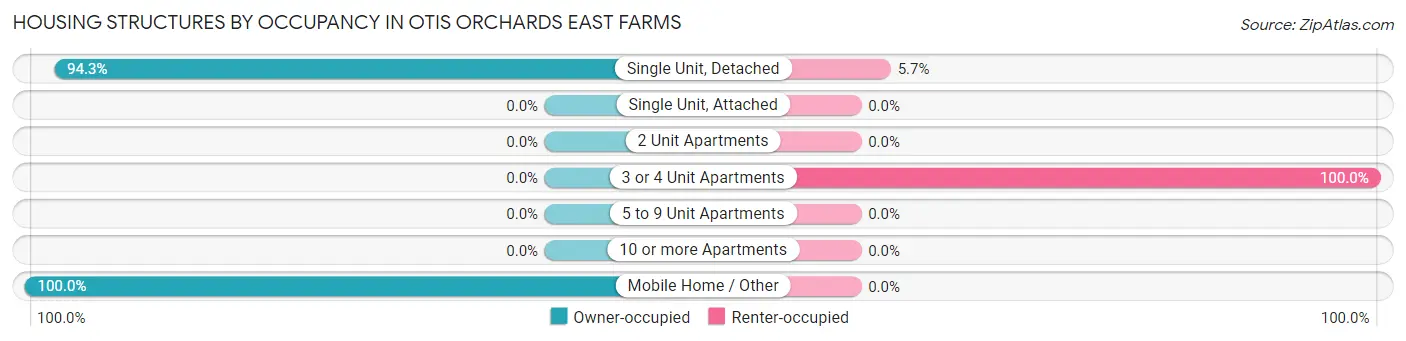
| Structure Type | Owner-occupied | Renter-occupied |
| Single Unit, Detached | 1,775 (94.3%) | 107 (5.7%) |
| Single Unit, Attached | 0 (0.0%) | 0 (0.0%) |
| 2 Unit Apartments | 0 (0.0%) | 0 (0.0%) |
| 3 or 4 Unit Apartments | 0 (0.0%) | 42 (100.0%) |
| 5 to 9 Unit Apartments | 0 (0.0%) | 0 (0.0%) |
| 10 or more Apartments | 0 (0.0%) | 0 (0.0%) |
| Mobile Home / Other | 211 (100.0%) | 0 (0.0%) |
| Total | 1,986 (93.0%) | 149 (7.0%) |
Housing Structures by Number of Rooms in Otis Orchards East Farms
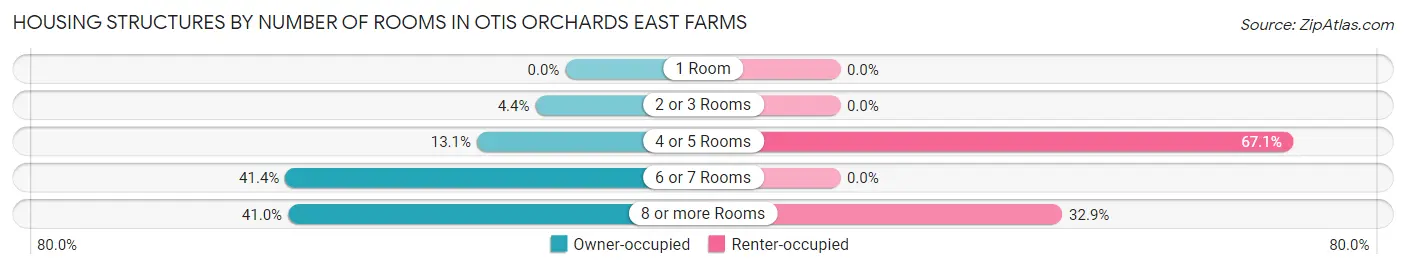
| Number of Rooms | Owner-occupied | Renter-occupied |
| 1 Room | 0 (0.0%) | 0 (0.0%) |
| 2 or 3 Rooms | 88 (4.4%) | 0 (0.0%) |
| 4 or 5 Rooms | 260 (13.1%) | 100 (67.1%) |
| 6 or 7 Rooms | 823 (41.4%) | 0 (0.0%) |
| 8 or more Rooms | 815 (41.0%) | 49 (32.9%) |
| Total | 1,986 (100.0%) | 149 (100.0%) |
Housing Structure by Heating Type in Otis Orchards East Farms
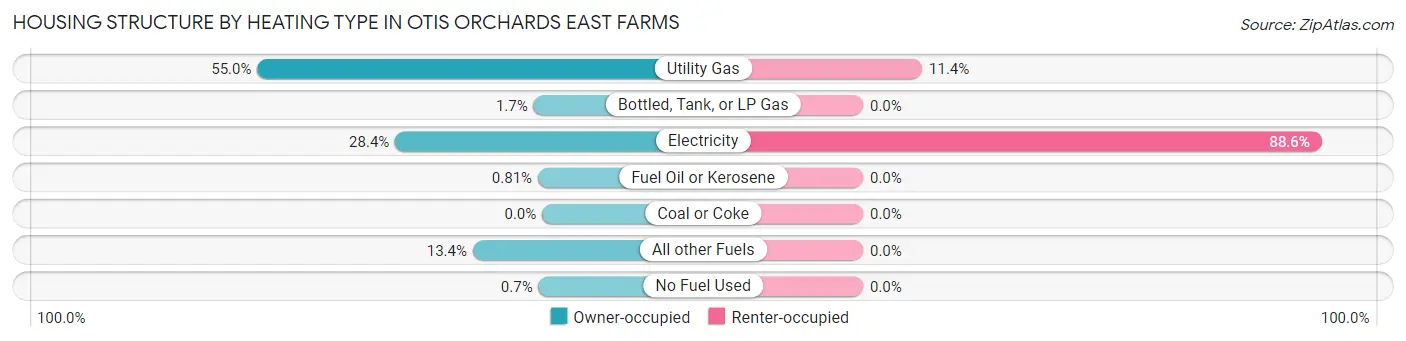
| Heating Type | Owner-occupied | Renter-occupied |
| Utility Gas | 1,093 (55.0%) | 17 (11.4%) |
| Bottled, Tank, or LP Gas | 33 (1.7%) | 0 (0.0%) |
| Electricity | 564 (28.4%) | 132 (88.6%) |
| Fuel Oil or Kerosene | 16 (0.8%) | 0 (0.0%) |
| Coal or Coke | 0 (0.0%) | 0 (0.0%) |
| All other Fuels | 266 (13.4%) | 0 (0.0%) |
| No Fuel Used | 14 (0.7%) | 0 (0.0%) |
| Total | 1,986 (100.0%) | 149 (100.0%) |
Household Vehicle Usage in Otis Orchards East Farms
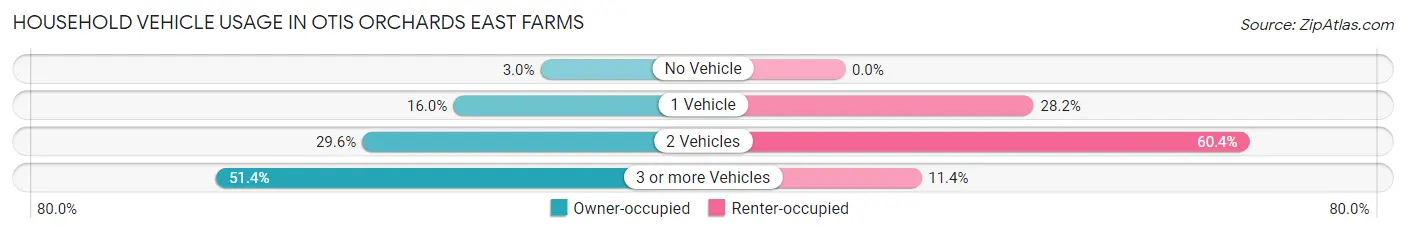
| Vehicles per Household | Owner-occupied | Renter-occupied |
| No Vehicle | 59 (3.0%) | 0 (0.0%) |
| 1 Vehicle | 318 (16.0%) | 42 (28.2%) |
| 2 Vehicles | 588 (29.6%) | 90 (60.4%) |
| 3 or more Vehicles | 1,021 (51.4%) | 17 (11.4%) |
| Total | 1,986 (100.0%) | 149 (100.0%) |
Real Estate & Mortgages in Otis Orchards East Farms
Real Estate and Mortgage Overview in Otis Orchards East Farms
| Characteristic | Without Mortgage | With Mortgage |
| Housing Units | 757 | 1,229 |
| Median Property Value | $295,600 | $338,800 |
| Median Household Income | $67,866 | $273 |
| Monthly Housing Costs | $524 | $47 |
| Real Estate Taxes | $2,997 | $60 |
Property Value by Mortgage Status in Otis Orchards East Farms
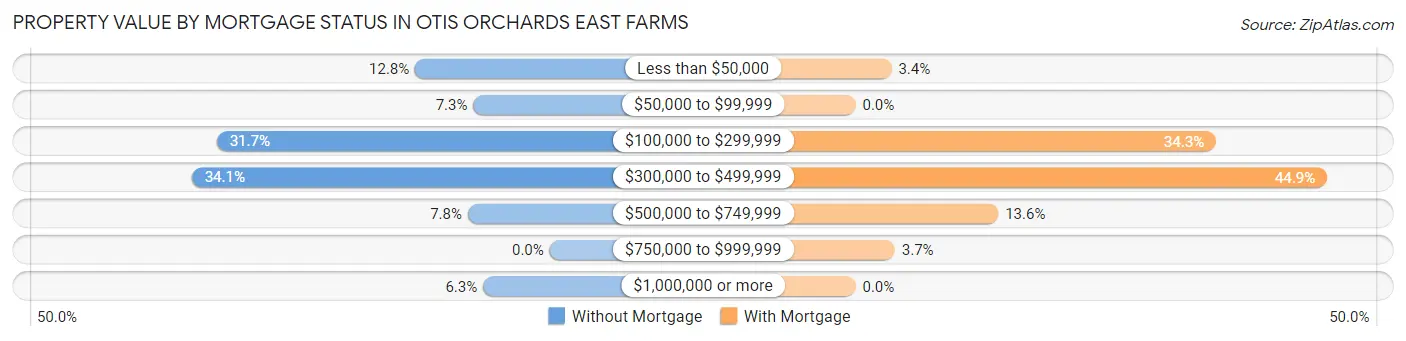
| Property Value | Without Mortgage | With Mortgage |
| Less than $50,000 | 97 (12.8%) | 42 (3.4%) |
| $50,000 to $99,999 | 55 (7.3%) | 0 (0.0%) |
| $100,000 to $299,999 | 240 (31.7%) | 422 (34.3%) |
| $300,000 to $499,999 | 258 (34.1%) | 552 (44.9%) |
| $500,000 to $749,999 | 59 (7.8%) | 167 (13.6%) |
| $750,000 to $999,999 | 0 (0.0%) | 46 (3.7%) |
| $1,000,000 or more | 48 (6.3%) | 0 (0.0%) |
| Total | 757 (100.0%) | 1,229 (100.0%) |
Household Income by Mortgage Status in Otis Orchards East Farms
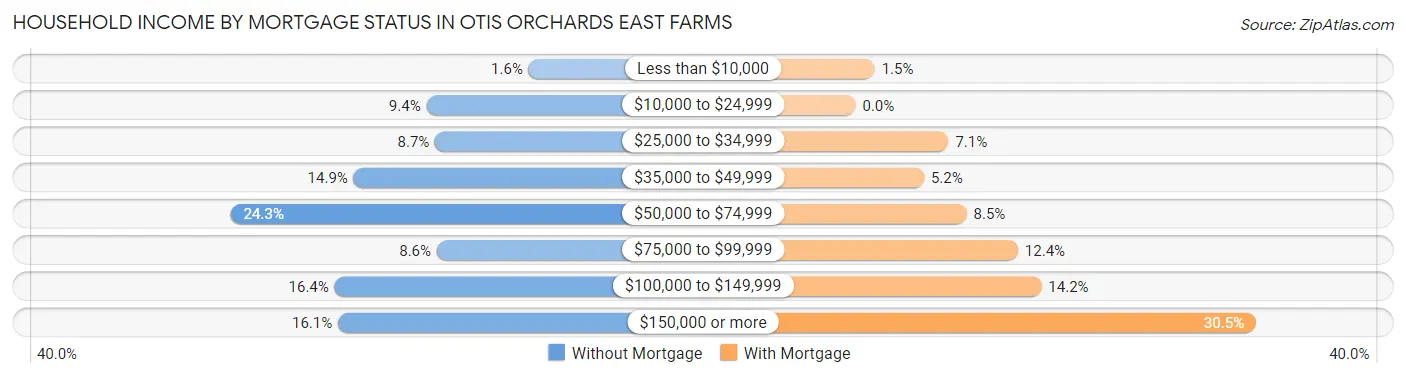
| Household Income | Without Mortgage | With Mortgage |
| Less than $10,000 | 12 (1.6%) | 18 (1.5%) |
| $10,000 to $24,999 | 71 (9.4%) | 0 (0.0%) |
| $25,000 to $34,999 | 66 (8.7%) | 87 (7.1%) |
| $35,000 to $49,999 | 113 (14.9%) | 64 (5.2%) |
| $50,000 to $74,999 | 184 (24.3%) | 104 (8.5%) |
| $75,000 to $99,999 | 65 (8.6%) | 152 (12.4%) |
| $100,000 to $149,999 | 124 (16.4%) | 174 (14.2%) |
| $150,000 or more | 122 (16.1%) | 375 (30.5%) |
| Total | 757 (100.0%) | 1,229 (100.0%) |
Property Value to Household Income Ratio in Otis Orchards East Farms
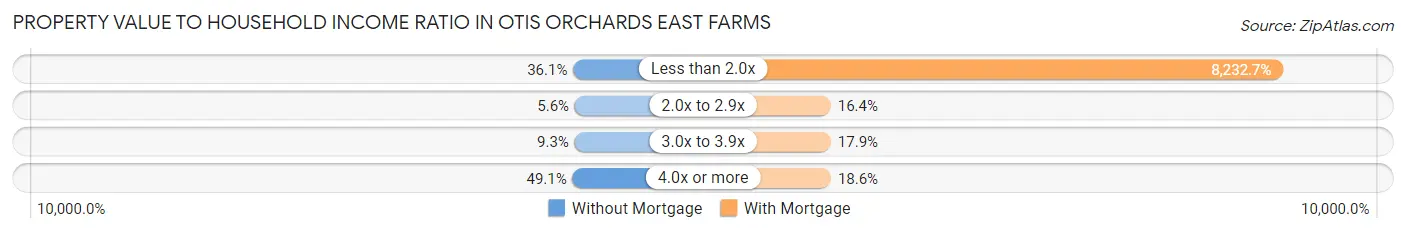
| Value-to-Income Ratio | Without Mortgage | With Mortgage |
| Less than 2.0x | 273 (36.1%) | 101,180 (8,232.7%) |
| 2.0x to 2.9x | 42 (5.6%) | 202 (16.4%) |
| 3.0x to 3.9x | 70 (9.2%) | 220 (17.9%) |
| 4.0x or more | 372 (49.1%) | 229 (18.6%) |
| Total | 757 (100.0%) | 1,229 (100.0%) |
Real Estate Taxes by Mortgage Status in Otis Orchards East Farms
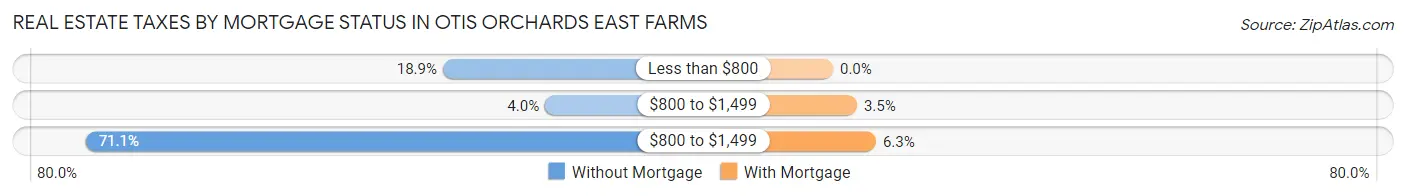
| Property Taxes | Without Mortgage | With Mortgage |
| Less than $800 | 143 (18.9%) | 0 (0.0%) |
| $800 to $1,499 | 30 (4.0%) | 43 (3.5%) |
| $800 to $1,499 | 538 (71.1%) | 77 (6.3%) |
| Total | 757 (100.0%) | 1,229 (100.0%) |
Health & Disability in Otis Orchards East Farms
Health Insurance Coverage by Age in Otis Orchards East Farms
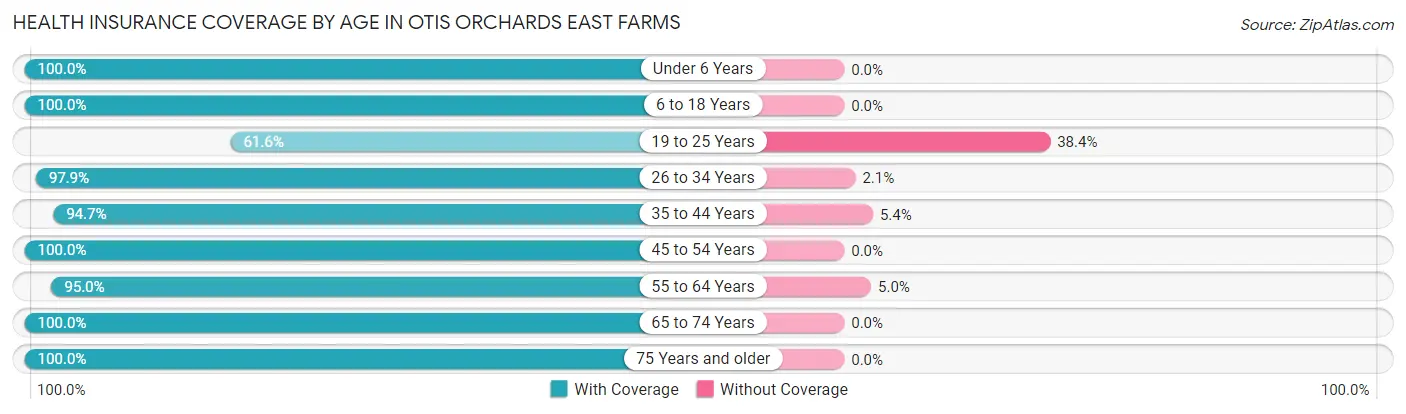
| Age Bracket | With Coverage | Without Coverage |
| Under 6 Years | 401 (100.0%) | 0 (0.0%) |
| 6 to 18 Years | 885 (100.0%) | 0 (0.0%) |
| 19 to 25 Years | 77 (61.6%) | 48 (38.4%) |
| 26 to 34 Years | 750 (97.9%) | 16 (2.1%) |
| 35 to 44 Years | 760 (94.7%) | 43 (5.3%) |
| 45 to 54 Years | 478 (100.0%) | 0 (0.0%) |
| 55 to 64 Years | 970 (95.0%) | 51 (5.0%) |
| 65 to 74 Years | 933 (100.0%) | 0 (0.0%) |
| 75 Years and older | 287 (100.0%) | 0 (0.0%) |
| Total | 5,541 (97.2%) | 158 (2.8%) |
Health Insurance Coverage by Citizenship Status in Otis Orchards East Farms
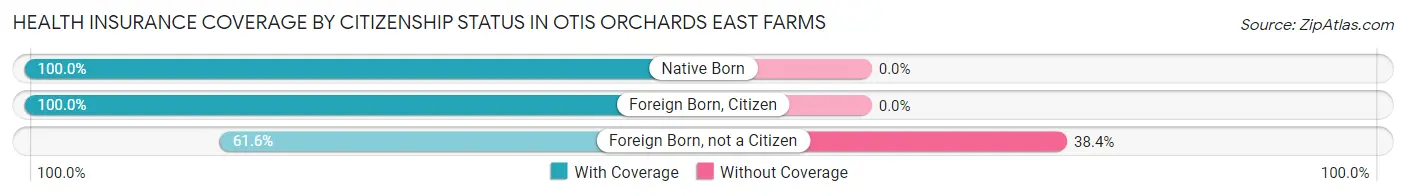
| Citizenship Status | With Coverage | Without Coverage |
| Native Born | 401 (100.0%) | 0 (0.0%) |
| Foreign Born, Citizen | 885 (100.0%) | 0 (0.0%) |
| Foreign Born, not a Citizen | 77 (61.6%) | 48 (38.4%) |
Health Insurance Coverage by Household Income in Otis Orchards East Farms
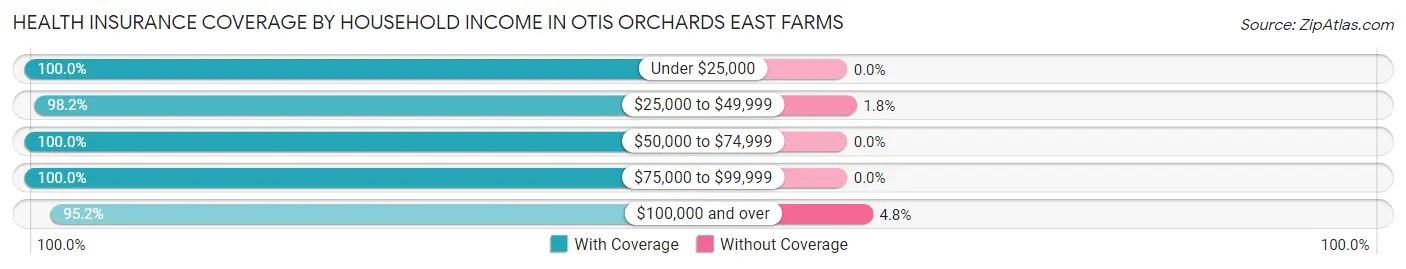
| Household Income | With Coverage | Without Coverage |
| Under $25,000 | 352 (100.0%) | 0 (0.0%) |
| $25,000 to $49,999 | 862 (98.2%) | 16 (1.8%) |
| $50,000 to $74,999 | 831 (100.0%) | 0 (0.0%) |
| $75,000 to $99,999 | 684 (100.0%) | 0 (0.0%) |
| $100,000 and over | 2,806 (95.2%) | 142 (4.8%) |
Public vs Private Health Insurance Coverage by Age in Otis Orchards East Farms
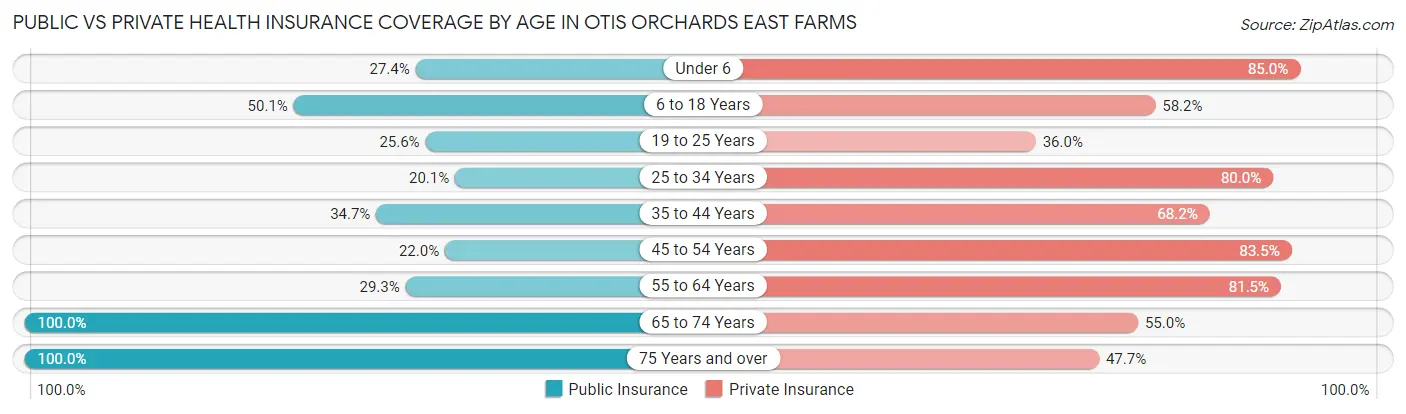
| Age Bracket | Public Insurance | Private Insurance |
| Under 6 | 110 (27.4%) | 341 (85.0%) |
| 6 to 18 Years | 443 (50.1%) | 515 (58.2%) |
| 19 to 25 Years | 32 (25.6%) | 45 (36.0%) |
| 25 to 34 Years | 154 (20.1%) | 613 (80.0%) |
| 35 to 44 Years | 279 (34.7%) | 548 (68.2%) |
| 45 to 54 Years | 105 (22.0%) | 399 (83.5%) |
| 55 to 64 Years | 299 (29.3%) | 832 (81.5%) |
| 65 to 74 Years | 933 (100.0%) | 513 (55.0%) |
| 75 Years and over | 287 (100.0%) | 137 (47.7%) |
| Total | 2,642 (46.4%) | 3,943 (69.2%) |
Disability Status by Sex by Age in Otis Orchards East Farms
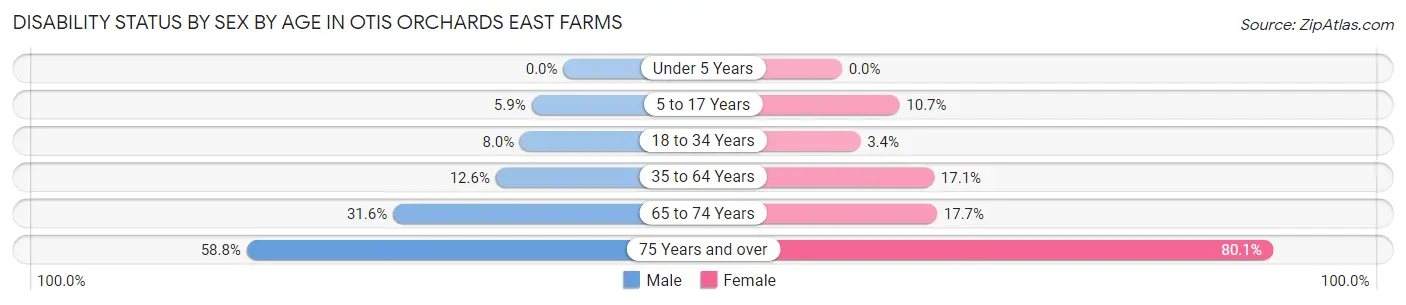
| Age Bracket | Male | Female |
| Under 5 Years | 0 (0.0%) | 0 (0.0%) |
| 5 to 17 Years | 26 (5.9%) | 48 (10.7%) |
| 18 to 34 Years | 37 (8.0%) | 16 (3.4%) |
| 35 to 64 Years | 148 (12.6%) | 192 (17.1%) |
| 65 to 74 Years | 166 (31.6%) | 72 (17.6%) |
| 75 Years and over | 77 (58.8%) | 125 (80.1%) |
Disability Class by Sex by Age in Otis Orchards East Farms
Disability Class: Hearing Difficulty
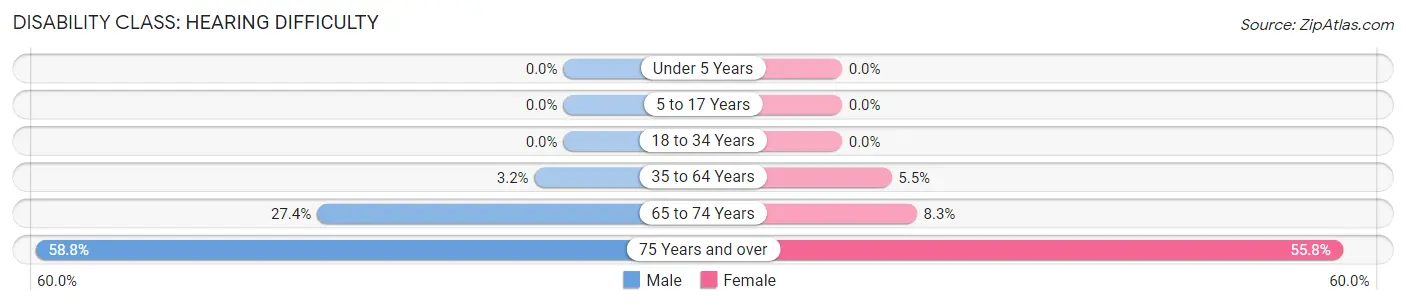
| Age Bracket | Male | Female |
| Under 5 Years | 0 (0.0%) | 0 (0.0%) |
| 5 to 17 Years | 0 (0.0%) | 0 (0.0%) |
| 18 to 34 Years | 0 (0.0%) | 0 (0.0%) |
| 35 to 64 Years | 38 (3.2%) | 62 (5.5%) |
| 65 to 74 Years | 144 (27.4%) | 34 (8.3%) |
| 75 Years and over | 77 (58.8%) | 87 (55.8%) |
Disability Class: Vision Difficulty
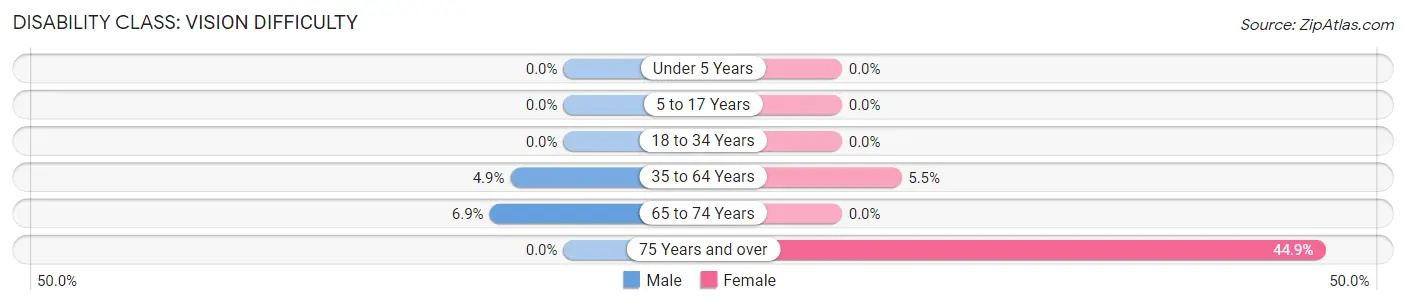
| Age Bracket | Male | Female |
| Under 5 Years | 0 (0.0%) | 0 (0.0%) |
| 5 to 17 Years | 0 (0.0%) | 0 (0.0%) |
| 18 to 34 Years | 0 (0.0%) | 0 (0.0%) |
| 35 to 64 Years | 58 (4.9%) | 62 (5.5%) |
| 65 to 74 Years | 36 (6.9%) | 0 (0.0%) |
| 75 Years and over | 0 (0.0%) | 70 (44.9%) |
Disability Class: Cognitive Difficulty
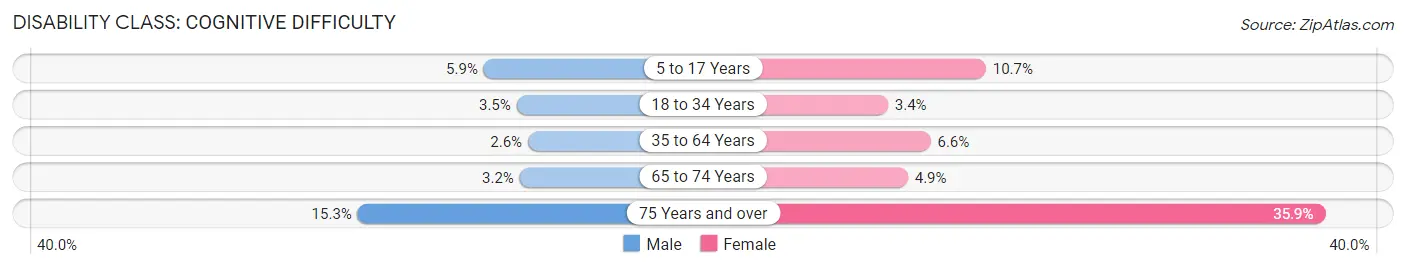
| Age Bracket | Male | Female |
| 5 to 17 Years | 26 (5.9%) | 48 (10.7%) |
| 18 to 34 Years | 16 (3.5%) | 16 (3.4%) |
| 35 to 64 Years | 31 (2.6%) | 74 (6.6%) |
| 65 to 74 Years | 17 (3.2%) | 20 (4.9%) |
| 75 Years and over | 20 (15.3%) | 56 (35.9%) |
Disability Class: Ambulatory Difficulty
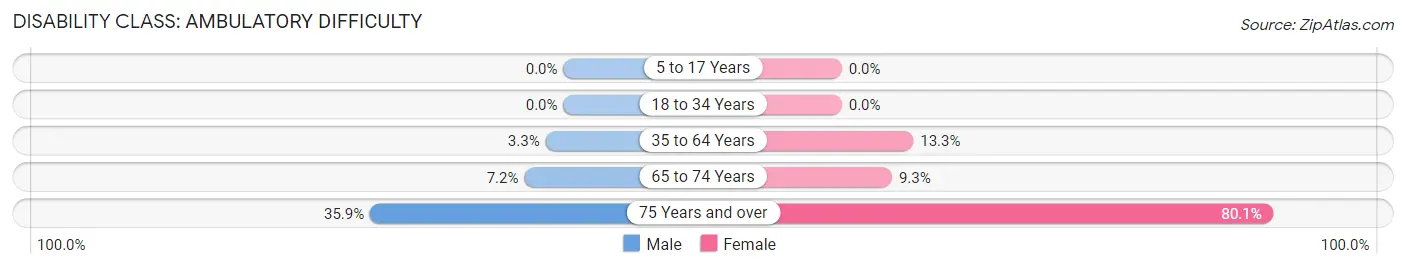
| Age Bracket | Male | Female |
| 5 to 17 Years | 0 (0.0%) | 0 (0.0%) |
| 18 to 34 Years | 0 (0.0%) | 0 (0.0%) |
| 35 to 64 Years | 39 (3.3%) | 149 (13.3%) |
| 65 to 74 Years | 38 (7.2%) | 38 (9.3%) |
| 75 Years and over | 47 (35.9%) | 125 (80.1%) |
Disability Class: Self-Care Difficulty
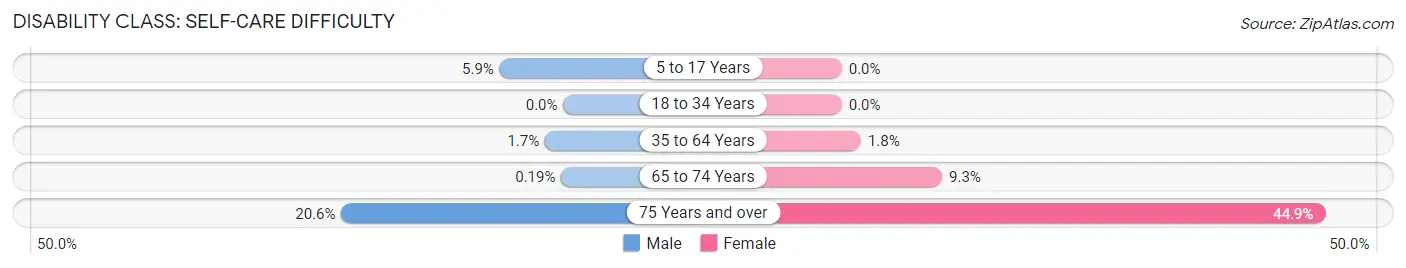
| Age Bracket | Male | Female |
| 5 to 17 Years | 26 (5.9%) | 0 (0.0%) |
| 18 to 34 Years | 0 (0.0%) | 0 (0.0%) |
| 35 to 64 Years | 20 (1.7%) | 20 (1.8%) |
| 65 to 74 Years | 1 (0.2%) | 38 (9.3%) |
| 75 Years and over | 27 (20.6%) | 70 (44.9%) |
Technology Access in Otis Orchards East Farms
Computing Device Access in Otis Orchards East Farms
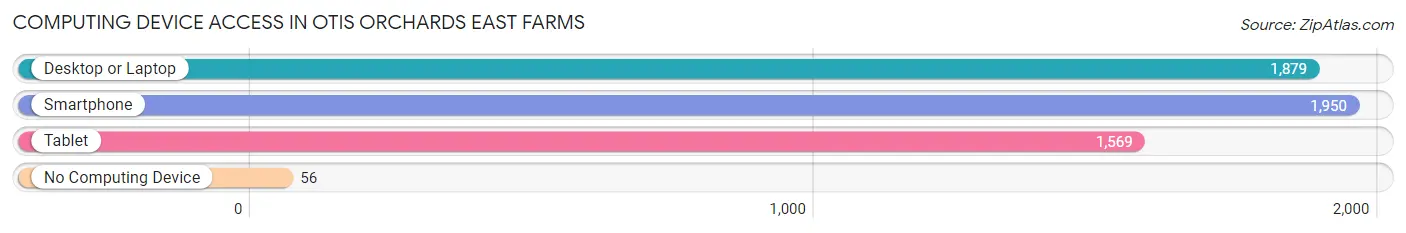
| Device Type | # Households | % Households |
| Desktop or Laptop | 1,879 | 88.0% |
| Smartphone | 1,950 | 91.3% |
| Tablet | 1,569 | 73.5% |
| No Computing Device | 56 | 2.6% |
| Total | 2,135 | 100.0% |
Internet Access in Otis Orchards East Farms
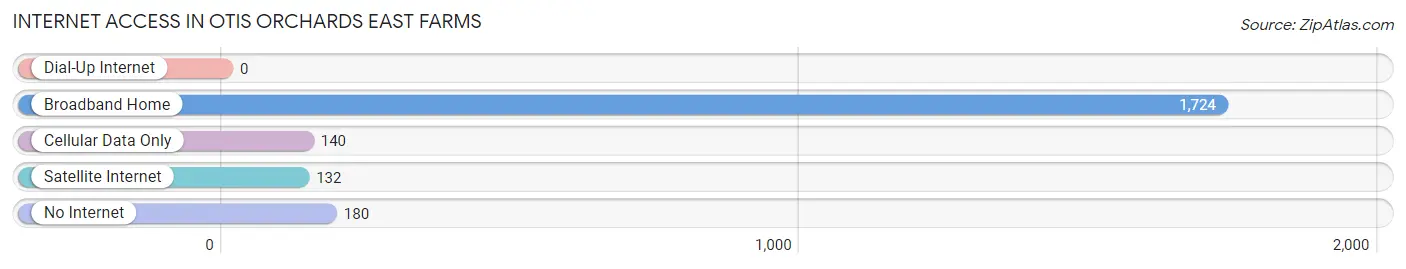
| Internet Type | # Households | % Households |
| Dial-Up Internet | 0 | 0.0% |
| Broadband Home | 1,724 | 80.7% |
| Cellular Data Only | 140 | 6.6% |
| Satellite Internet | 132 | 6.2% |
| No Internet | 180 | 8.4% |
| Total | 2,135 | 100.0% |
Otis Orchards East Farms Summary
Otis Orchards East Farms is a small unincorporated community located in Spokane County, Washington. It is situated in the Spokane Valley, approximately 15 miles east of downtown Spokane. The community is bordered by the cities of Spokane Valley, Liberty Lake, and Millwood. The population of Otis Orchards East Farms was estimated to be 2,845 in 2019.
History
Otis Orchards East Farms was first settled in the late 1800s by homesteaders who were attracted to the area by its fertile soil and abundant water. The community was named after the Otis family, who were among the first settlers in the area. The Otis family established a large farm and orchard, which became the center of the community.
In the early 1900s, the community began to grow as more settlers moved to the area. The Otis family opened a general store, which served as the community’s first post office. The store also served as a gathering place for the community, and it was here that the first school was established.
In the 1920s, the community began to expand as more businesses opened in the area. The Otis family opened a second store, and a gas station was built. The community also had a blacksmith shop, a barber shop, and a livery stable.
In the 1950s, the community began to experience rapid growth as more people moved to the area. The Otis family opened a third store, and a number of other businesses opened in the area. The community also had a library, a fire station, and a community center.
Geography
Otis Orchards East Farms is located in the Spokane Valley, approximately 15 miles east of downtown Spokane. The community is bordered by the cities of Spokane Valley, Liberty Lake, and Millwood. The area is characterized by rolling hills and open fields, with the Spokane River running through the center of the community.
The climate in Otis Orchards East Farms is typical of the Pacific Northwest, with mild winters and warm summers. The average annual temperature is around 50 degrees Fahrenheit, with an average annual precipitation of around 20 inches.
Economy
The economy of Otis Orchards East Farms is largely based on agriculture. The area is home to a number of farms and orchards, which produce a variety of fruits and vegetables. The community also has a number of small businesses, including restaurants, retail stores, and service providers.
Demographics
The population of Otis Orchards East Farms was estimated to be 2,845 in 2019. The population is largely white (90.3%), with a small percentage of African Americans (2.2%), Asians (2.1%), and Native Americans (1.2%). The median household income in the community is $50,945, and the median home value is $220,000. The unemployment rate in the community is 4.2%.
Common Questions
What is Per Capita Income in Otis Orchards East Farms?
Per Capita income in Otis Orchards East Farms is $39,030.
What is the Median Family Income in Otis Orchards East Farms?
Median Family Income in Otis Orchards East Farms is $88,118.
What is the Median Household income in Otis Orchards East Farms?
Median Household Income in Otis Orchards East Farms is $87,572.
What is Income or Wage Gap in Otis Orchards East Farms?
Income or Wage Gap in Otis Orchards East Farms is 44.0%.
Women in Otis Orchards East Farms earn 56.0 cents for every dollar earned by a man.
What is Inequality or Gini Index in Otis Orchards East Farms?
Inequality or Gini Index in Otis Orchards East Farms is 0.38.
What is the Total Population of Otis Orchards East Farms?
Total Population of Otis Orchards East Farms is 5,699.
What is the Total Male Population of Otis Orchards East Farms?
Total Male Population of Otis Orchards East Farms is 2,850.
What is the Total Female Population of Otis Orchards East Farms?
Total Female Population of Otis Orchards East Farms is 2,849.
What is the Ratio of Males per 100 Females in Otis Orchards East Farms?
There are 100.04 Males per 100 Females in Otis Orchards East Farms.
What is the Ratio of Females per 100 Males in Otis Orchards East Farms?
There are 99.96 Females per 100 Males in Otis Orchards East Farms.
What is the Median Population Age in Otis Orchards East Farms?
Median Population Age in Otis Orchards East Farms is 41.9 Years.
What is the Average Family Size in Otis Orchards East Farms
Average Family Size in Otis Orchards East Farms is 2.9 People.
What is the Average Household Size in Otis Orchards East Farms
Average Household Size in Otis Orchards East Farms is 2.7 People.
How Large is the Labor Force in Otis Orchards East Farms?
There are 2,760 People in the Labor Forcein in Otis Orchards East Farms.
What is the Percentage of People in the Labor Force in Otis Orchards East Farms?
59.4% of People are in the Labor Force in Otis Orchards East Farms.
What is the Unemployment Rate in Otis Orchards East Farms?
Unemployment Rate in Otis Orchards East Farms is 5.0%.