Zip Codes with the Highest Percentage of Population Employed in Computer & Mathematics in Bellingham, WA
RELATED REPORTS & OPTIONS
Computer & Mathematics
Bellingham
Compare Zip Codes
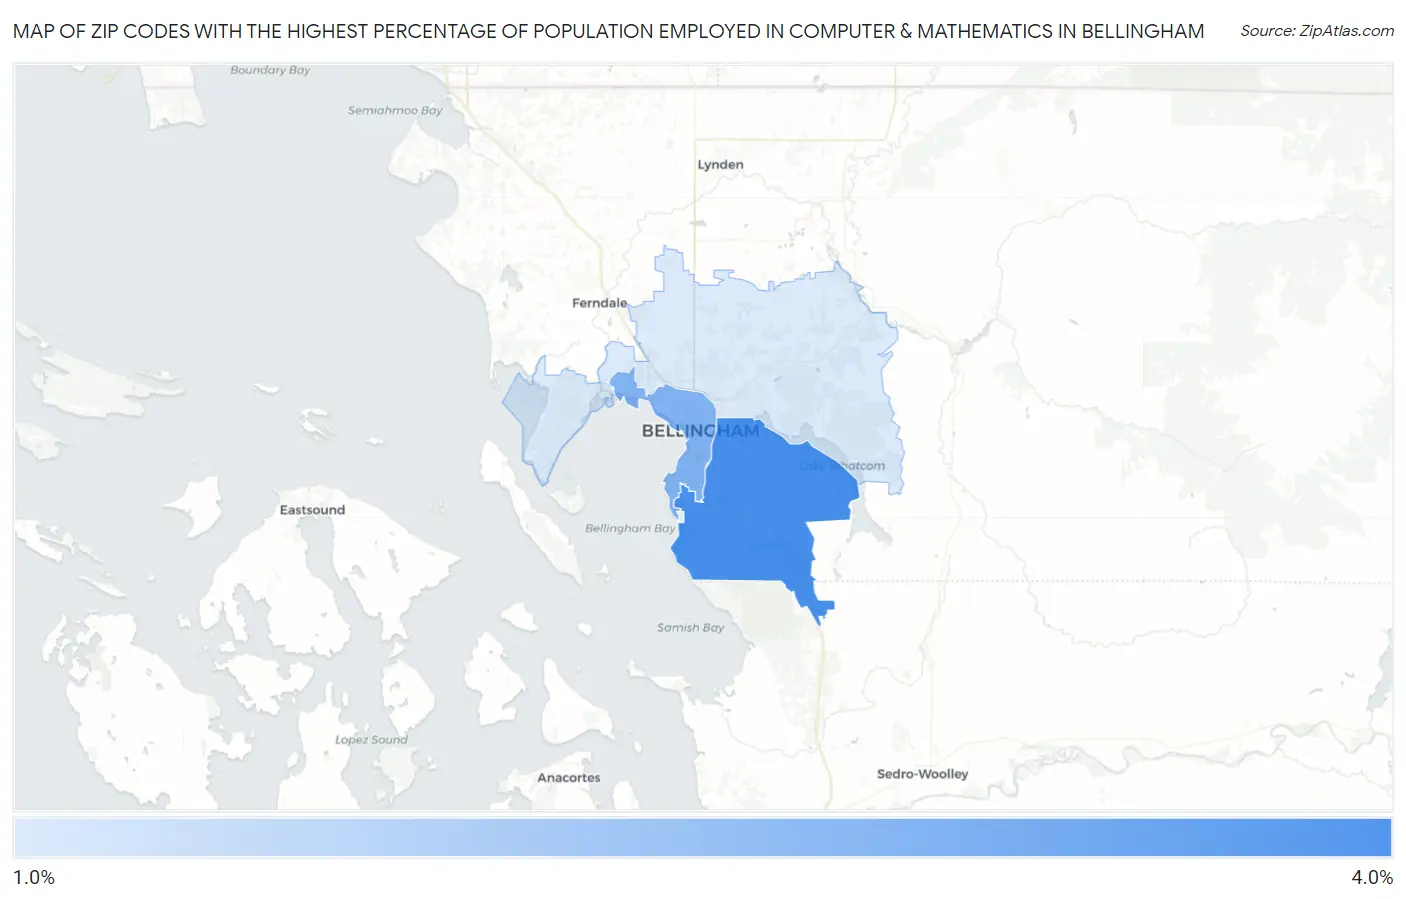
Map of Zip Codes with the Highest Percentage of Population Employed in Computer & Mathematics in Bellingham
1.9%
3.8%
Zip Codes with the Highest Percentage of Population Employed in Computer & Mathematics in Bellingham, WA
| Zip Code | % Employed | vs State | vs National | |
| 1. | 98229 | 3.8% | 6.1%(-2.24)#163 | 3.5%(+0.290)#5,445 |
| 2. | 98225 | 3.1% | 6.1%(-3.00)#214 | 3.5%(-0.468)#7,543 |
| 3. | 98226 | 1.9% | 6.1%(-4.17)#308 | 3.5%(-1.64)#12,376 |
1
Common Questions
What are the Top Zip Codes with the Highest Percentage of Population Employed in Computer & Mathematics in Bellingham, WA?
Top Zip Codes with the Highest Percentage of Population Employed in Computer & Mathematics in Bellingham, WA are:
What zip code has the Highest Percentage of Population Employed in Computer & Mathematics in Bellingham, WA?
98229 has the Highest Percentage of Population Employed in Computer & Mathematics in Bellingham, WA with 3.8%.
What is the Percentage of Population Employed in Computer & Mathematics in Bellingham, WA?
Percentage of Population Employed in Computer & Mathematics in Bellingham is 2.7%.
What is the Percentage of Population Employed in Computer & Mathematics in Washington?
Percentage of Population Employed in Computer & Mathematics in Washington is 6.1%.
What is the Percentage of Population Employed in Computer & Mathematics in the United States?
Percentage of Population Employed in Computer & Mathematics in the United States is 3.5%.