Geneva, WA Map & Demographics
Geneva Map
Geneva Overview
$52,963
PER CAPITA INCOME
$137,615
AVG FAMILY INCOME
$102,386
AVG HOUSEHOLD INCOME
23.5%
WAGE / INCOME GAP [ % ]
76.5¢/ $1
WAGE / INCOME GAP [ $ ]
0.37
INEQUALITY / GINI INDEX
2,096
TOTAL POPULATION
980
MALE POPULATION
1,116
FEMALE POPULATION
87.81
MALES / 100 FEMALES
113.88
FEMALES / 100 MALES
51.8
MEDIAN AGE
2.5
AVG FAMILY SIZE
2.3
AVG HOUSEHOLD SIZE
1,205
LABOR FORCE [ PEOPLE ]
65.3%
PERCENT IN LABOR FORCE
11.1%
UNEMPLOYMENT RATE
Income in Geneva
Income Overview in Geneva
Per Capita Income in Geneva is $52,963, while median incomes of families and households are $137,615 and $102,386 respectively.
| Characteristic | Number | Measure |
| Per Capita Income | 2,096 | $52,963 |
| Median Family Income | 717 | $137,615 |
| Mean Family Income | 717 | $131,215 |
| Median Household Income | 912 | $102,386 |
| Mean Household Income | 912 | $121,920 |
| Income Deficit | 717 | $0 |
| Wage / Income Gap (%) | 2,096 | 23.46% |
| Wage / Income Gap ($) | 2,096 | 76.54¢ per $1 |
| Gini / Inequality Index | 2,096 | 0.37 |
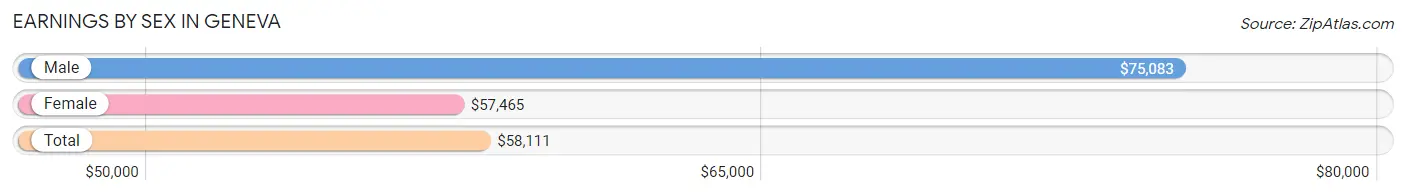
Earnings by Sex in Geneva
Average Earnings in Geneva are $58,111, $75,083 for men and $57,465 for women, a difference of 23.5%.
| Sex | Number | Average Earnings |
| Male | 669 (51.7%) | $75,083 |
| Female | 624 (48.3%) | $57,465 |
| Total | 1,293 (100.0%) | $58,111 |
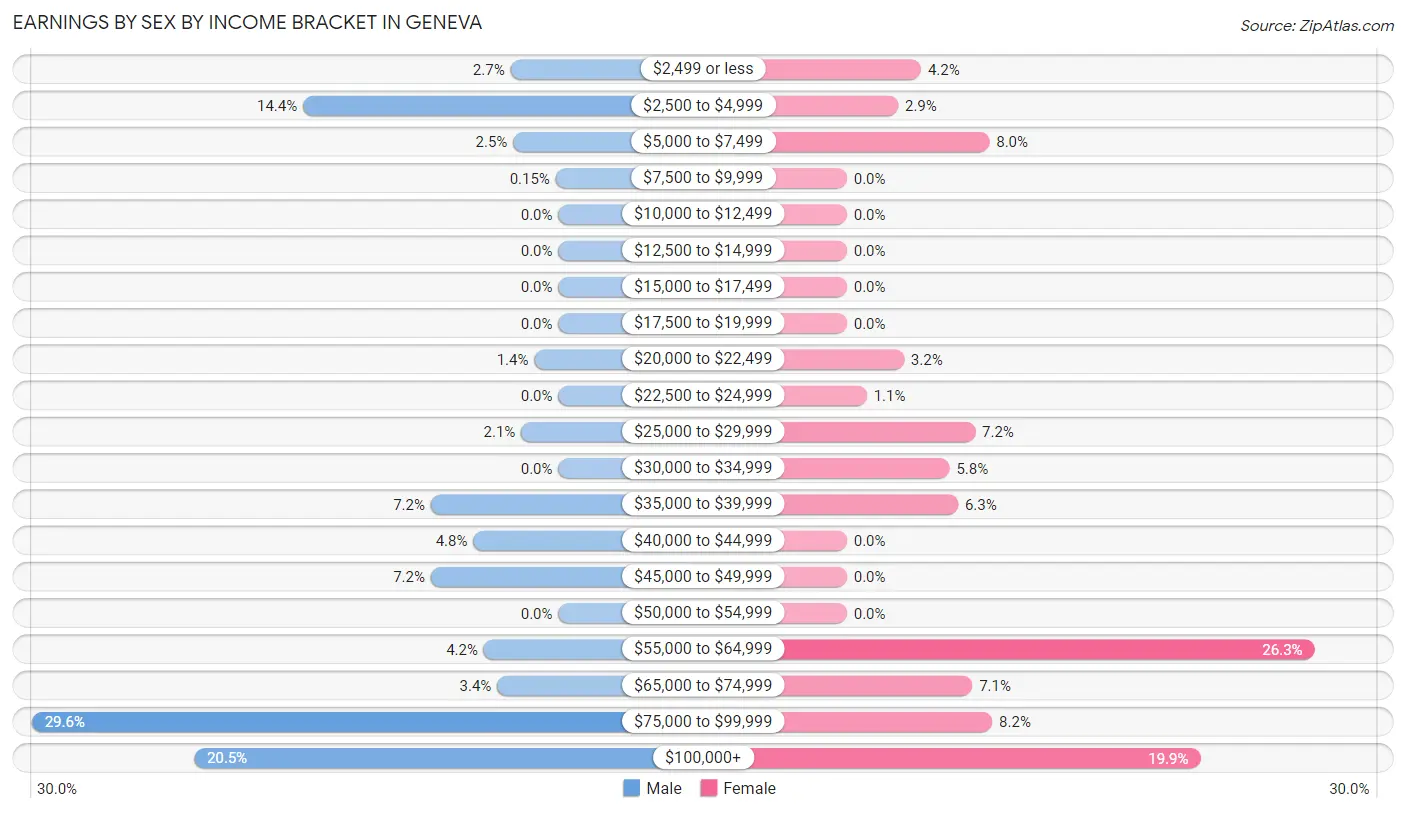
Earnings by Sex by Income Bracket in Geneva
The most common earnings brackets in Geneva are $75,000 to $99,999 for men (198 | 29.6%) and $55,000 to $64,999 for women (164 | 26.3%).
| Income | Male | Female |
| $2,499 or less | 18 (2.7%) | 26 (4.2%) |
| $2,500 to $4,999 | 96 (14.3%) | 18 (2.9%) |
| $5,000 to $7,499 | 17 (2.5%) | 50 (8.0%) |
| $7,500 to $9,999 | 1 (0.2%) | 0 (0.0%) |
| $10,000 to $12,499 | 0 (0.0%) | 0 (0.0%) |
| $12,500 to $14,999 | 0 (0.0%) | 0 (0.0%) |
| $15,000 to $17,499 | 0 (0.0%) | 0 (0.0%) |
| $17,500 to $19,999 | 0 (0.0%) | 0 (0.0%) |
| $20,000 to $22,499 | 9 (1.3%) | 20 (3.2%) |
| $22,500 to $24,999 | 0 (0.0%) | 7 (1.1%) |
| $25,000 to $29,999 | 14 (2.1%) | 45 (7.2%) |
| $30,000 to $34,999 | 0 (0.0%) | 36 (5.8%) |
| $35,000 to $39,999 | 48 (7.2%) | 39 (6.2%) |
| $40,000 to $44,999 | 32 (4.8%) | 0 (0.0%) |
| $45,000 to $49,999 | 48 (7.2%) | 0 (0.0%) |
| $50,000 to $54,999 | 0 (0.0%) | 0 (0.0%) |
| $55,000 to $64,999 | 28 (4.2%) | 164 (26.3%) |
| $65,000 to $74,999 | 23 (3.4%) | 44 (7.0%) |
| $75,000 to $99,999 | 198 (29.6%) | 51 (8.2%) |
| $100,000+ | 137 (20.5%) | 124 (19.9%) |
| Total | 669 (100.0%) | 624 (100.0%) |
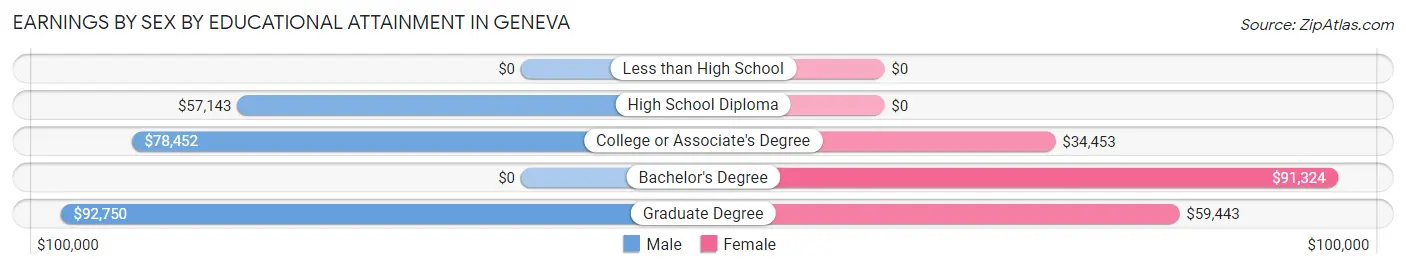
Earnings by Sex by Educational Attainment in Geneva
Average earnings in Geneva are $78,028 for men and $58,207 for women, a difference of 25.4%. Men with an educational attainment of graduate degree enjoy the highest average annual earnings of $92,750, while those with high school diploma education earn the least with $57,143. Women with an educational attainment of bachelor's degree earn the most with the average annual earnings of $91,324, while those with college or associate's degree education have the smallest earnings of $34,453.
| Educational Attainment | Male Income | Female Income |
| Less than High School | - | - |
| High School Diploma | $57,143 | $0 |
| College or Associate's Degree | $78,452 | $34,453 |
| Bachelor's Degree | - | - |
| Graduate Degree | $92,750 | $59,443 |
| Total | $78,028 | $58,207 |
Family Income in Geneva
Family Income Brackets in Geneva
According to the Geneva family income data, there are 149 families falling into the $150,000 to $199,999 income range, which is the most common income bracket and makes up 20.8% of all families.
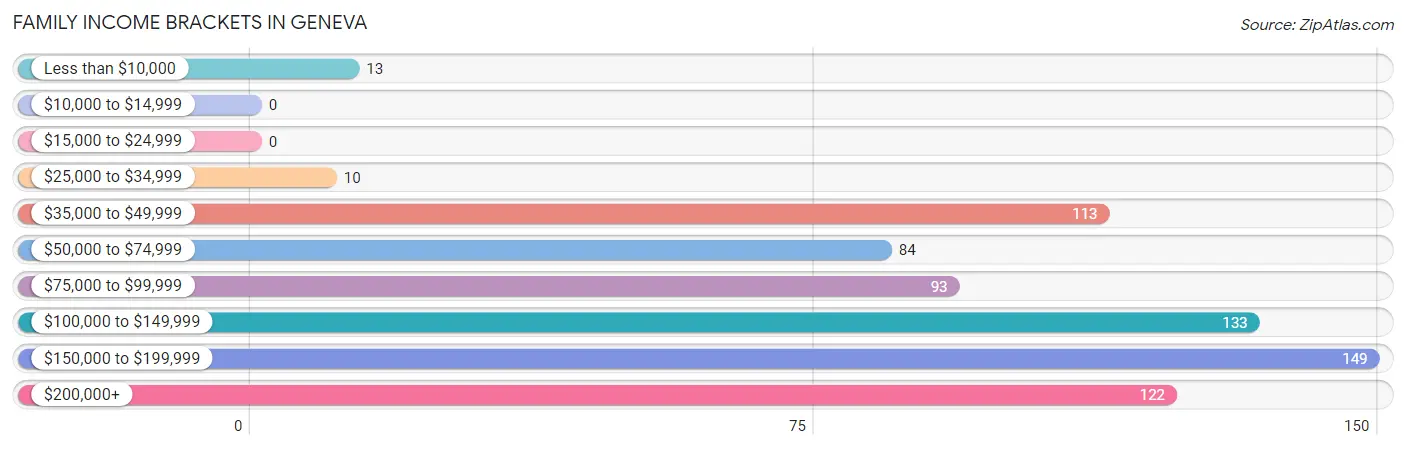
| Income Bracket | # Families | % Families |
| Less than $10,000 | 13 | 1.8% |
| $10,000 to $14,999 | 0 | 0.0% |
| $15,000 to $24,999 | 0 | 0.0% |
| $25,000 to $34,999 | 10 | 1.4% |
| $35,000 to $49,999 | 113 | 15.8% |
| $50,000 to $74,999 | 84 | 11.7% |
| $75,000 to $99,999 | 93 | 13.0% |
| $100,000 to $149,999 | 133 | 18.5% |
| $150,000 to $199,999 | 149 | 20.8% |
| $200,000+ | 122 | 17.0% |
Family Income by Famaliy Size in Geneva
3-person families (110 | 15.3%) account for the highest median family income in Geneva with $217,738 per family, while 3-person families (110 | 15.3%) have the highest median income of $72,579 per family member.
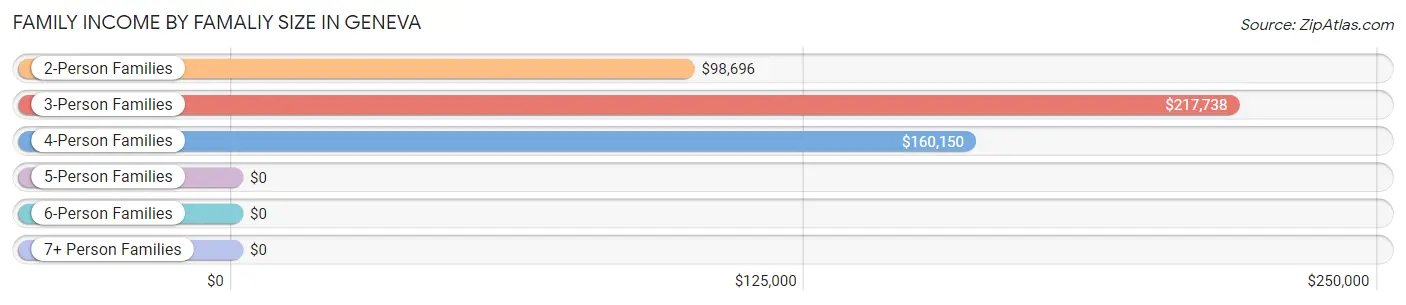
| Income Bracket | # Families | Median Income |
| 2-Person Families | 502 (70.0%) | $98,696 |
| 3-Person Families | 110 (15.3%) | $217,738 |
| 4-Person Families | 105 (14.6%) | $160,150 |
| 5-Person Families | 0 (0.0%) | $0 |
| 6-Person Families | 0 (0.0%) | $0 |
| 7+ Person Families | 0 (0.0%) | $0 |
| Total | 717 (100.0%) | $137,615 |
Family Income by Number of Earners in Geneva
The median family income in Geneva is $137,615, with families comprising 2 earners (334) having the highest median family income of $160,100, while families with 1 earner (229) have the lowest median family income of $56,652, accounting for 46.6% and 31.9% of families, respectively.
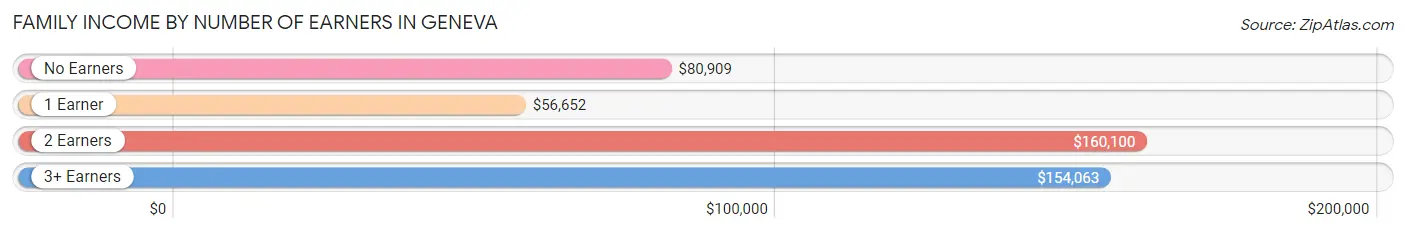
| Number of Earners | # Families | Median Income |
| No Earners | 108 (15.1%) | $80,909 |
| 1 Earner | 229 (31.9%) | $56,652 |
| 2 Earners | 334 (46.6%) | $160,100 |
| 3+ Earners | 46 (6.4%) | $154,063 |
| Total | 717 (100.0%) | $137,615 |
Household Income in Geneva
Household Income Brackets in Geneva
With 190 households falling in the category, the $150,000 to $199,999 income range is the most frequent in Geneva, accounting for 20.8% of all households.
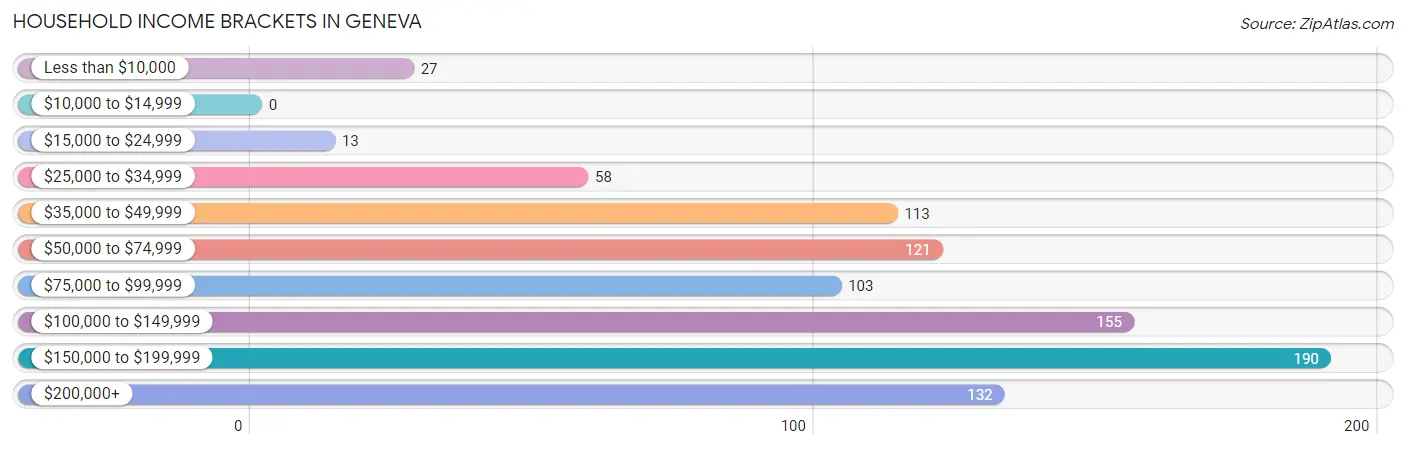
| Income Bracket | # Households | % Households |
| Less than $10,000 | 27 | 3.0% |
| $10,000 to $14,999 | 0 | 0.0% |
| $15,000 to $24,999 | 13 | 1.4% |
| $25,000 to $34,999 | 58 | 6.4% |
| $35,000 to $49,999 | 113 | 12.4% |
| $50,000 to $74,999 | 121 | 13.3% |
| $75,000 to $99,999 | 103 | 11.3% |
| $100,000 to $149,999 | 155 | 17.0% |
| $150,000 to $199,999 | 190 | 20.8% |
| $200,000+ | 132 | 14.5% |
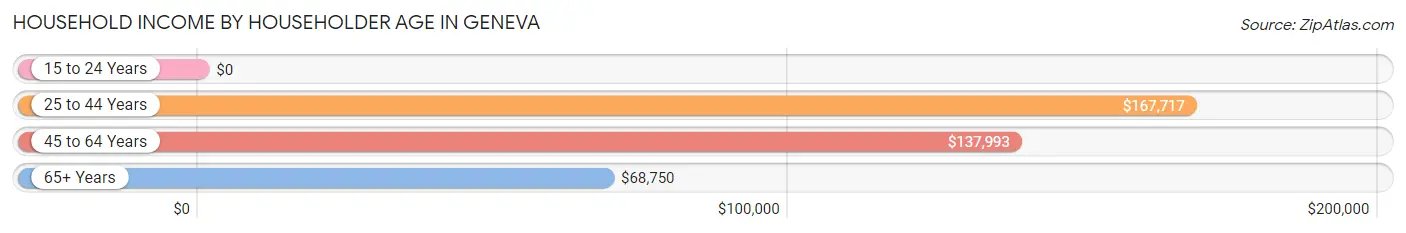
Household Income by Householder Age in Geneva
The median household income in Geneva is $102,386, with the highest median household income of $167,717 found in the 25 to 44 years age bracket for the primary householder. A total of 238 households (26.1%) fall into this category.
| Income Bracket | # Households | Median Income |
| 15 to 24 Years | 0 (0.0%) | $0 |
| 25 to 44 Years | 238 (26.1%) | $167,717 |
| 45 to 64 Years | 398 (43.6%) | $137,993 |
| 65+ Years | 276 (30.3%) | $68,750 |
| Total | 912 (100.0%) | $102,386 |
Poverty in Geneva
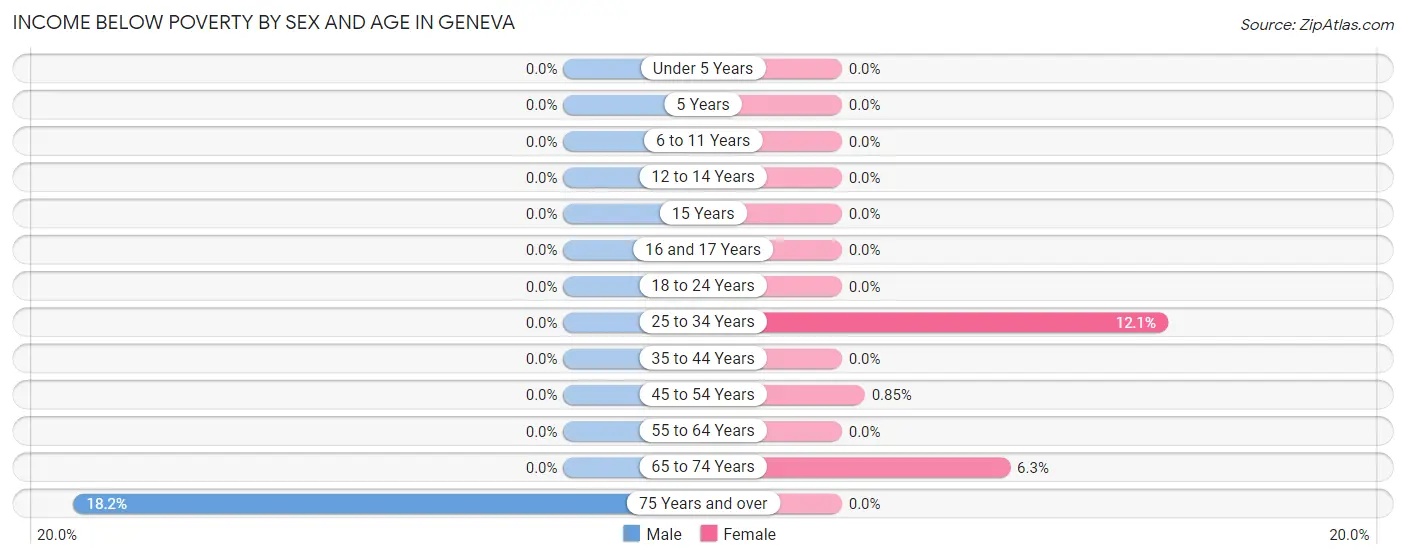
Income Below Poverty by Sex and Age in Geneva
With 1.2% poverty level for males and 2.6% for females among the residents of Geneva, 75 year old and over males and 25 to 34 year old females are the most vulnerable to poverty, with 12 males (18.2%) and 15 females (12.1%) in their respective age groups living below the poverty level.
| Age Bracket | Male | Female |
| Under 5 Years | 0 (0.0%) | 0 (0.0%) |
| 5 Years | 0 (0.0%) | 0 (0.0%) |
| 6 to 11 Years | 0 (0.0%) | 0 (0.0%) |
| 12 to 14 Years | 0 (0.0%) | 0 (0.0%) |
| 15 Years | 0 (0.0%) | 0 (0.0%) |
| 16 and 17 Years | 0 (0.0%) | 0 (0.0%) |
| 18 to 24 Years | 0 (0.0%) | 0 (0.0%) |
| 25 to 34 Years | 0 (0.0%) | 15 (12.1%) |
| 35 to 44 Years | 0 (0.0%) | 0 (0.0%) |
| 45 to 54 Years | 0 (0.0%) | 1 (0.9%) |
| 55 to 64 Years | 0 (0.0%) | 0 (0.0%) |
| 65 to 74 Years | 0 (0.0%) | 13 (6.2%) |
| 75 Years and over | 12 (18.2%) | 0 (0.0%) |
| Total | 12 (1.2%) | 29 (2.6%) |
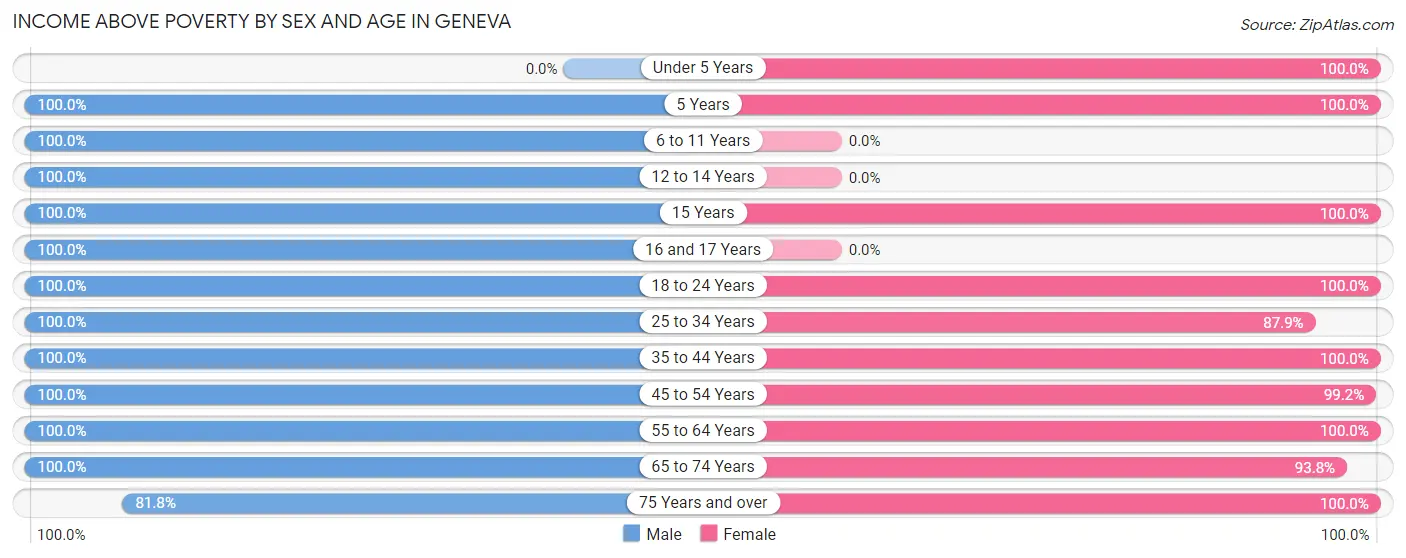
Income Above Poverty by Sex and Age in Geneva
According to the poverty statistics in Geneva, males aged 5 years and females aged under 5 years are the age groups that are most secure financially, with 100.0% of males and 100.0% of females in these age groups living above the poverty line.
| Age Bracket | Male | Female |
| Under 5 Years | 0 (0.0%) | 64 (100.0%) |
| 5 Years | 26 (100.0%) | 15 (100.0%) |
| 6 to 11 Years | 43 (100.0%) | 0 (0.0%) |
| 12 to 14 Years | 62 (100.0%) | 0 (0.0%) |
| 15 Years | 12 (100.0%) | 28 (100.0%) |
| 16 and 17 Years | 6 (100.0%) | 0 (0.0%) |
| 18 to 24 Years | 87 (100.0%) | 48 (100.0%) |
| 25 to 34 Years | 23 (100.0%) | 109 (87.9%) |
| 35 to 44 Years | 132 (100.0%) | 184 (100.0%) |
| 45 to 54 Years | 147 (100.0%) | 117 (99.2%) |
| 55 to 64 Years | 257 (100.0%) | 208 (100.0%) |
| 65 to 74 Years | 117 (100.0%) | 195 (93.8%) |
| 75 Years and over | 54 (81.8%) | 112 (100.0%) |
| Total | 966 (98.8%) | 1,080 (97.4%) |
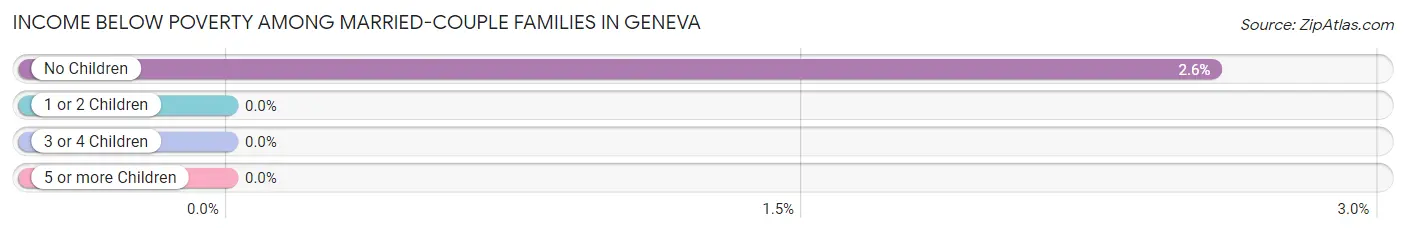
Income Below Poverty Among Married-Couple Families in Geneva
The poverty statistics for married-couple families in Geneva show that 1.9% or 13 of the total 691 families live below the poverty line. Families with no children have the highest poverty rate of 2.6%, comprising of 13 families. On the other hand, families with 1 or 2 children have the lowest poverty rate of 0.0%, which includes 0 families.
| Children | Above Poverty | Below Poverty |
| No Children | 492 (97.4%) | 13 (2.6%) |
| 1 or 2 Children | 186 (100.0%) | 0 (0.0%) |
| 3 or 4 Children | 0 (0.0%) | 0 (0.0%) |
| 5 or more Children | 0 (0.0%) | 0 (0.0%) |
| Total | 678 (98.1%) | 13 (1.9%) |
Income Below Poverty Among Single-Parent Households in Geneva
| Children | Single Father | Single Mother |
| No Children | 0 (0.0%) | 0 (0.0%) |
| 1 or 2 Children | 0 (0.0%) | 0 (0.0%) |
| 3 or 4 Children | 0 (0.0%) | 0 (0.0%) |
| 5 or more Children | 0 (0.0%) | 0 (0.0%) |
| Total | 0 (0.0%) | 0 (0.0%) |
Income Below Poverty Among Married-Couple vs Single-Parent Households in Geneva
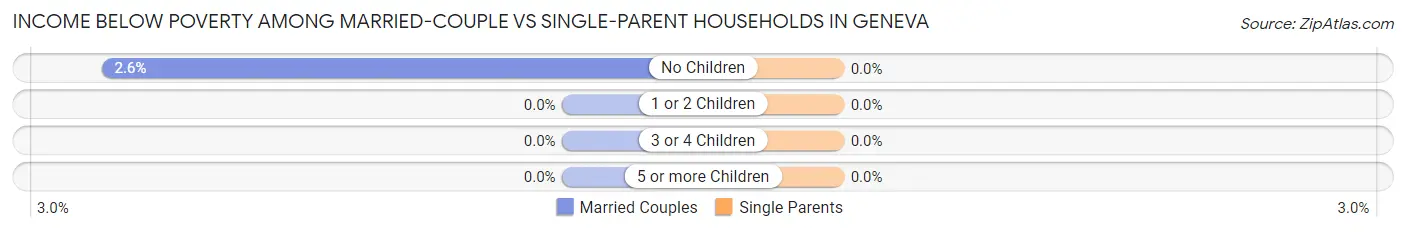
| Children | Married-Couple Families | Single-Parent Households |
| No Children | 13 (2.6%) | 0 (0.0%) |
| 1 or 2 Children | 0 (0.0%) | 0 (0.0%) |
| 3 or 4 Children | 0 (0.0%) | 0 (0.0%) |
| 5 or more Children | 0 (0.0%) | 0 (0.0%) |
| Total | 13 (1.9%) | 0 (0.0%) |
Race in Geneva
The most populous races in Geneva are White / Caucasian (1,836 | 87.6%), Two or more Races (213 | 10.2%), and Hispanic or Latino (71 | 3.4%).
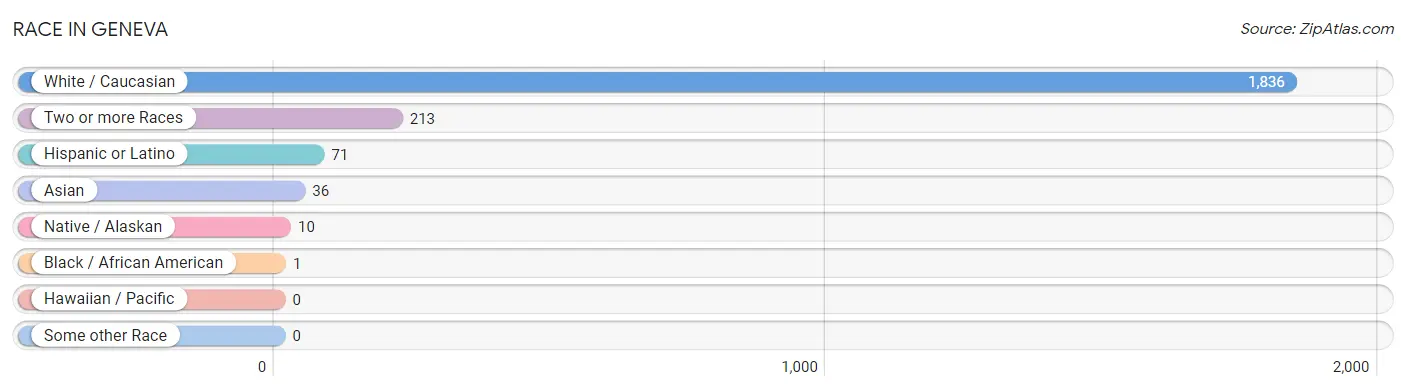
| Race | # Population | % Population |
| Asian | 36 | 1.7% |
| Black / African American | 1 | 0.1% |
| Hawaiian / Pacific | 0 | 0.0% |
| Hispanic or Latino | 71 | 3.4% |
| Native / Alaskan | 10 | 0.5% |
| White / Caucasian | 1,836 | 87.6% |
| Two or more Races | 213 | 10.2% |
| Some other Race | 0 | 0.0% |
| Total | 2,096 | 100.0% |
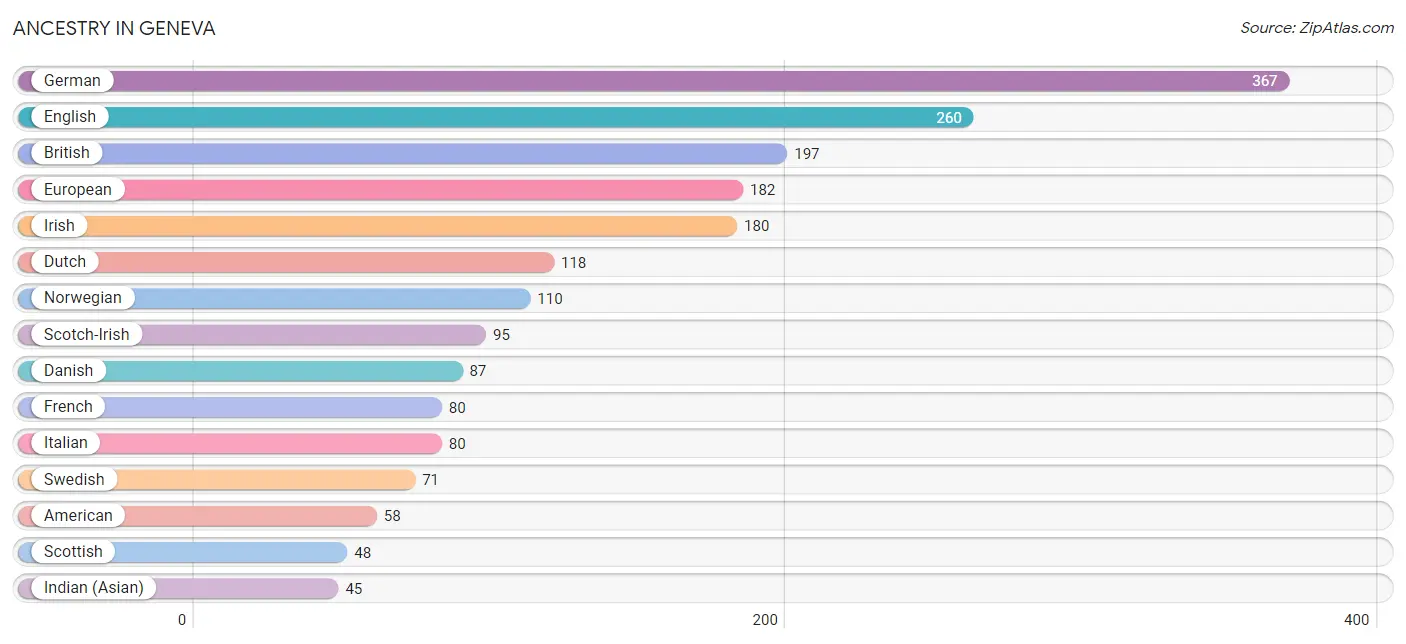
Ancestry in Geneva
The most populous ancestries reported in Geneva are German (367 | 17.5%), English (260 | 12.4%), British (197 | 9.4%), European (182 | 8.7%), and Irish (180 | 8.6%), together accounting for 56.6% of all Geneva residents.
| Ancestry | # Population | % Population |
| Aleut | 18 | 0.9% |
| American | 58 | 2.8% |
| Austrian | 11 | 0.5% |
| British | 197 | 9.4% |
| Canadian | 9 | 0.4% |
| Cherokee | 5 | 0.2% |
| Chinese | 8 | 0.4% |
| Chippewa | 10 | 0.5% |
| Choctaw | 1 | 0.1% |
| Cuban | 12 | 0.6% |
| Czech | 20 | 0.9% |
| Danish | 87 | 4.2% |
| Dutch | 118 | 5.6% |
| Eastern European | 22 | 1.1% |
| Ecuadorian | 27 | 1.3% |
| English | 260 | 12.4% |
| European | 182 | 8.7% |
| Finnish | 17 | 0.8% |
| French | 80 | 3.8% |
| German | 367 | 17.5% |
| Indian (Asian) | 45 | 2.1% |
| Irish | 180 | 8.6% |
| Italian | 80 | 3.8% |
| Korean | 1 | 0.1% |
| Luxembourger | 16 | 0.8% |
| Mexican | 7 | 0.3% |
| Native Hawaiian | 9 | 0.4% |
| Norwegian | 110 | 5.2% |
| Polish | 43 | 2.1% |
| Portuguese | 25 | 1.2% |
| Romanian | 1 | 0.1% |
| Scandinavian | 25 | 1.2% |
| Scotch-Irish | 95 | 4.5% |
| Scottish | 48 | 2.3% |
| South American | 27 | 1.3% |
| Spaniard | 25 | 1.2% |
| Swedish | 71 | 3.4% |
| Swiss | 9 | 0.4% |
| Ukrainian | 9 | 0.4% |
| Welsh | 10 | 0.5% |
| Yugoslavian | 16 | 0.8% | View All 41 Rows |
Immigrants in Geneva
The most numerous immigrant groups reported in Geneva came from Canada (41 | 2.0%), Asia (23 | 1.1%), China (23 | 1.1%), Eastern Asia (23 | 1.1%), and Taiwan (23 | 1.1%), together accounting for 6.4% of all Geneva residents.
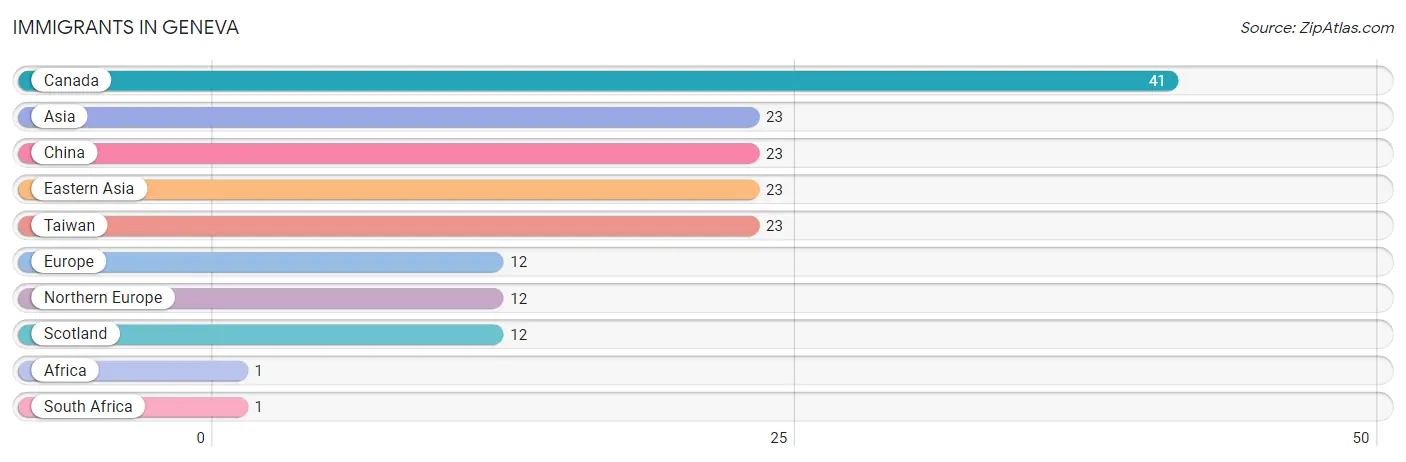
| Immigration Origin | # Population | % Population |
| Africa | 1 | 0.1% |
| Asia | 23 | 1.1% |
| Canada | 41 | 2.0% |
| China | 23 | 1.1% |
| Eastern Asia | 23 | 1.1% |
| Europe | 12 | 0.6% |
| Northern Europe | 12 | 0.6% |
| Scotland | 12 | 0.6% |
| South Africa | 1 | 0.1% |
| Taiwan | 23 | 1.1% | View All 10 Rows |
Sex and Age in Geneva
Sex and Age in Geneva
The most populous age groups in Geneva are 60 to 64 Years (176 | 18.0%) for men and 40 to 44 Years (126 | 11.3%) for women.
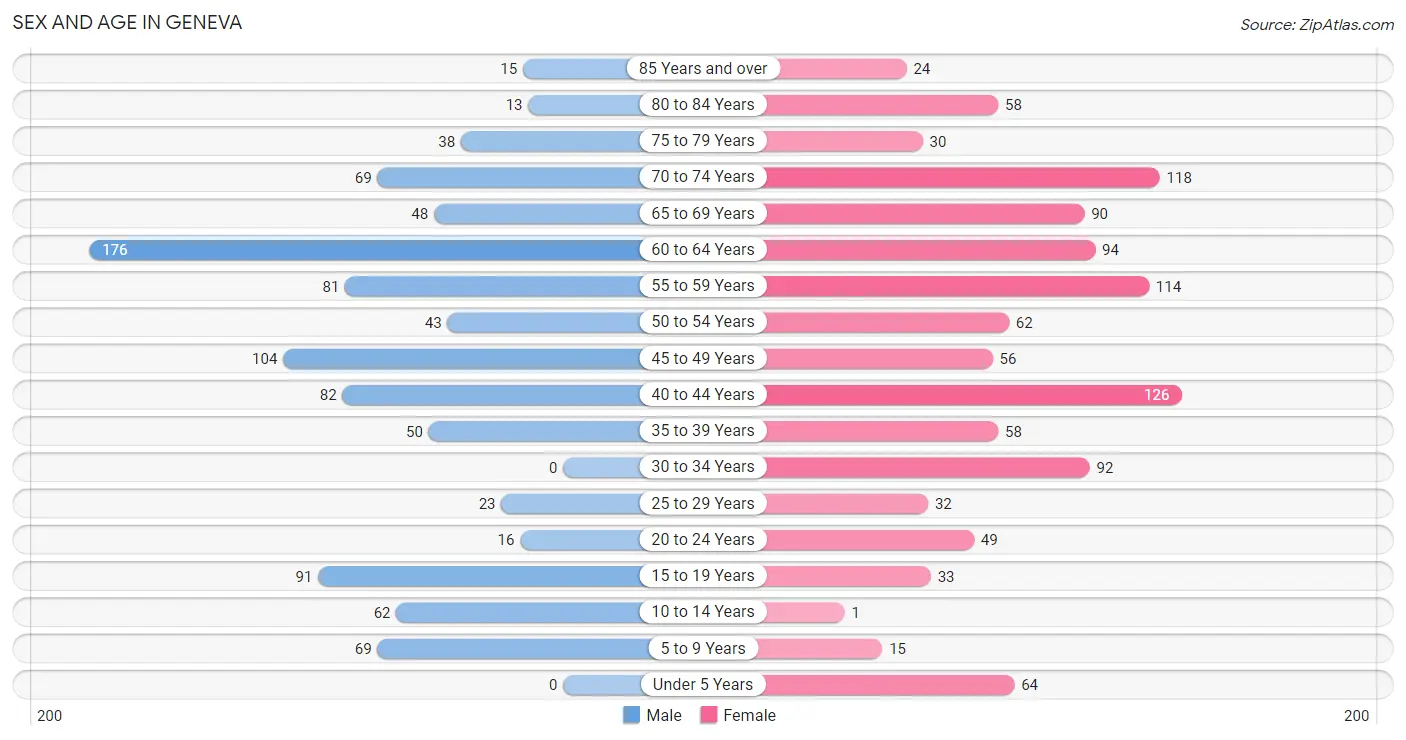
| Age Bracket | Male | Female |
| Under 5 Years | 0 (0.0%) | 64 (5.7%) |
| 5 to 9 Years | 69 (7.0%) | 15 (1.3%) |
| 10 to 14 Years | 62 (6.3%) | 1 (0.1%) |
| 15 to 19 Years | 91 (9.3%) | 33 (3.0%) |
| 20 to 24 Years | 16 (1.6%) | 49 (4.4%) |
| 25 to 29 Years | 23 (2.4%) | 32 (2.9%) |
| 30 to 34 Years | 0 (0.0%) | 92 (8.2%) |
| 35 to 39 Years | 50 (5.1%) | 58 (5.2%) |
| 40 to 44 Years | 82 (8.4%) | 126 (11.3%) |
| 45 to 49 Years | 104 (10.6%) | 56 (5.0%) |
| 50 to 54 Years | 43 (4.4%) | 62 (5.6%) |
| 55 to 59 Years | 81 (8.3%) | 114 (10.2%) |
| 60 to 64 Years | 176 (18.0%) | 94 (8.4%) |
| 65 to 69 Years | 48 (4.9%) | 90 (8.1%) |
| 70 to 74 Years | 69 (7.0%) | 118 (10.6%) |
| 75 to 79 Years | 38 (3.9%) | 30 (2.7%) |
| 80 to 84 Years | 13 (1.3%) | 58 (5.2%) |
| 85 Years and over | 15 (1.5%) | 24 (2.1%) |
| Total | 980 (100.0%) | 1,116 (100.0%) |
Families and Households in Geneva
Median Family Size in Geneva
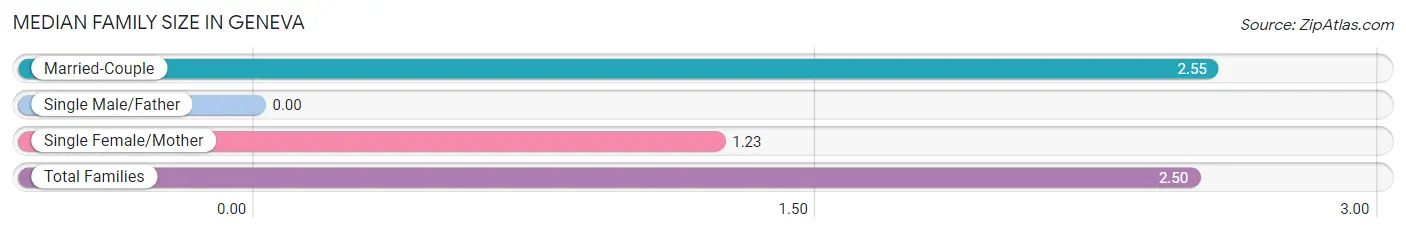
| Family Type | # Families | Family Size |
| Married-Couple | 691 (96.4%) | 2.55 |
| Single Male/Father | 0 (0.0%) | - |
| Single Female/Mother | 26 (3.6%) | 1.23 |
| Total Families | 717 (100.0%) | 2.50 |
Median Household Size in Geneva
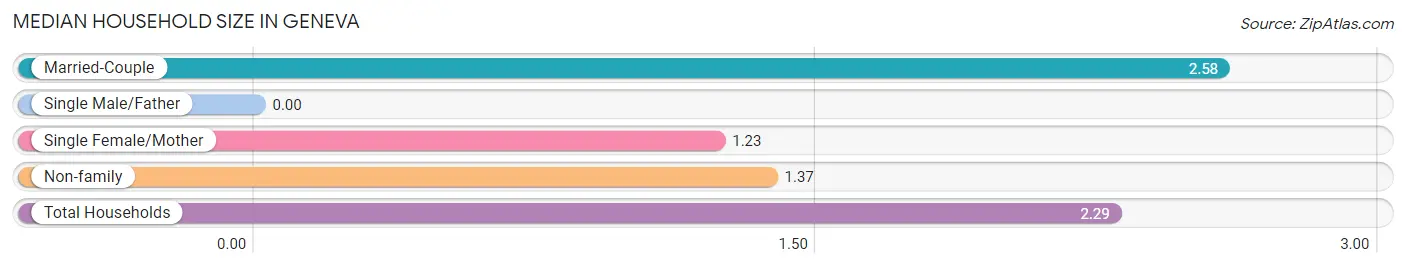
| Household Type | # Households | Household Size |
| Married-Couple | 691 (75.8%) | 2.58 |
| Single Male/Father | 0 (0.0%) | - |
| Single Female/Mother | 26 (2.9%) | 1.23 |
| Non-family | 195 (21.4%) | 1.37 |
| Total Households | 912 (100.0%) | 2.29 |
Household Size by Marriage Status in Geneva
Out of a total of 912 households in Geneva, 717 (78.6%) are family households, while 195 (21.4%) are nonfamily households. The most numerous type of family households are 2-person households, comprising 480, and the most common type of nonfamily households are 1-person households, comprising 144.
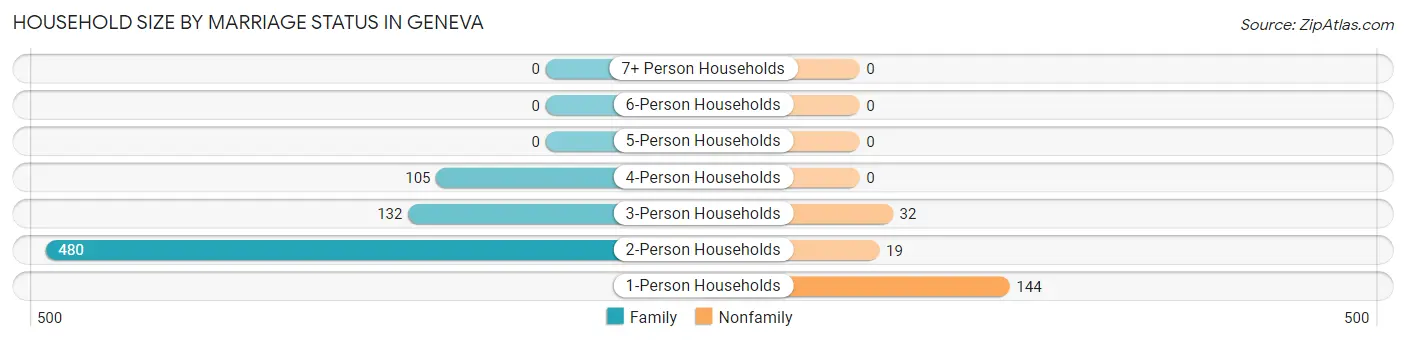
| Household Size | Family Households | Nonfamily Households |
| 1-Person Households | - | 144 (15.8%) |
| 2-Person Households | 480 (52.6%) | 19 (2.1%) |
| 3-Person Households | 132 (14.5%) | 32 (3.5%) |
| 4-Person Households | 105 (11.5%) | 0 (0.0%) |
| 5-Person Households | 0 (0.0%) | 0 (0.0%) |
| 6-Person Households | 0 (0.0%) | 0 (0.0%) |
| 7+ Person Households | 0 (0.0%) | 0 (0.0%) |
| Total | 717 (78.6%) | 195 (21.4%) |
Female Fertility in Geneva
Fertility by Age in Geneva
Average fertility rate in Geneva is 2.0 births per 1,000 women. Women in the age bracket of 20 to 34 years have the highest fertility rate with 6.0 births per 1,000 women. Women in the age bracket of 20 to 34 years acount for 100.0% of all women with births.
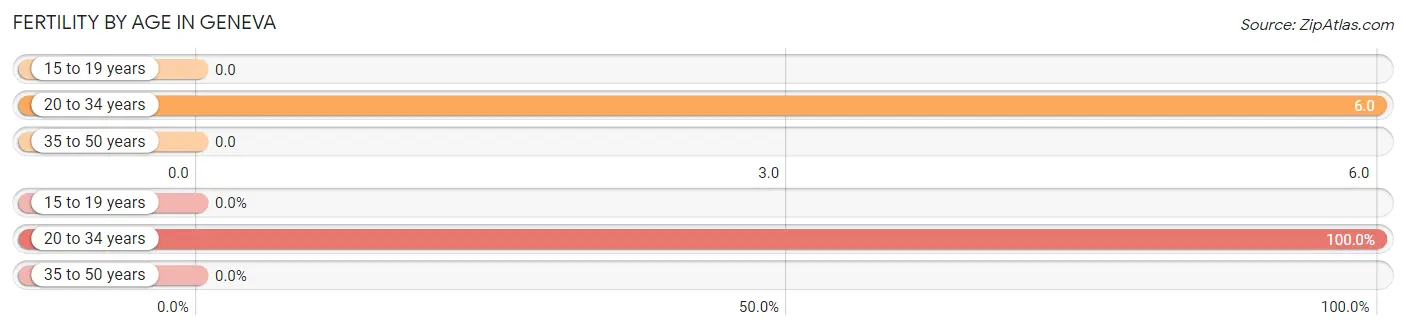
| Age Bracket | Women with Births | Births / 1,000 Women |
| 15 to 19 years | 0 (0.0%) | 0.0 |
| 20 to 34 years | 1 (100.0%) | 6.0 |
| 35 to 50 years | 0 (0.0%) | 0.0 |
| Total | 1 (100.0%) | 2.0 |
Fertility by Age by Marriage Status in Geneva
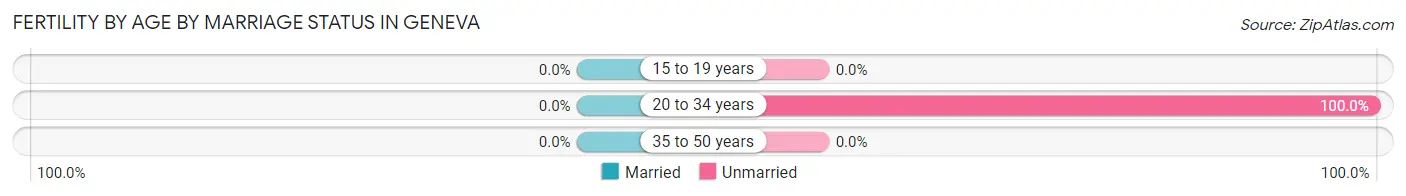
| Age Bracket | Married | Unmarried |
| 15 to 19 years | 0 (0.0%) | 0 (0.0%) |
| 20 to 34 years | 0 (0.0%) | 1 (100.0%) |
| 35 to 50 years | 0 (0.0%) | 0 (0.0%) |
| Total | 0 (0.0%) | 1 (100.0%) |
Fertility by Education in Geneva
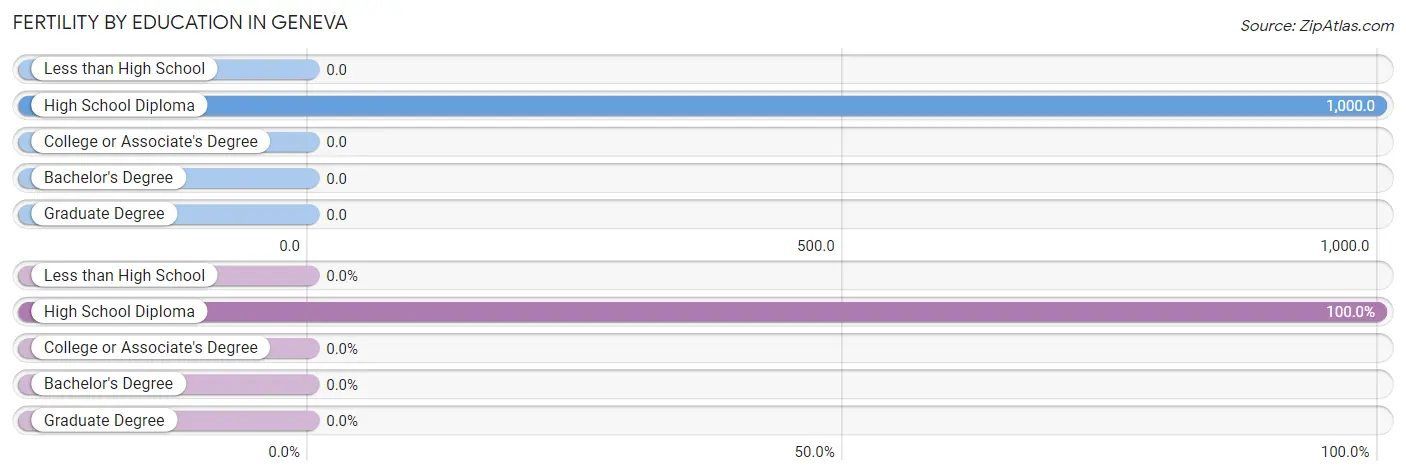
| Educational Attainment | Women with Births | Births / 1,000 Women |
| Less than High School | 0 (0.0%) | 0.0 |
| High School Diploma | 1 (100.0%) | 1,000.0 |
| College or Associate's Degree | 0 (0.0%) | 0.0 |
| Bachelor's Degree | 0 (0.0%) | 0.0 |
| Graduate Degree | 0 (0.0%) | 0.0 |
| Total | 1 (100.0%) | 2.0 |
Fertility by Education by Marriage Status in Geneva
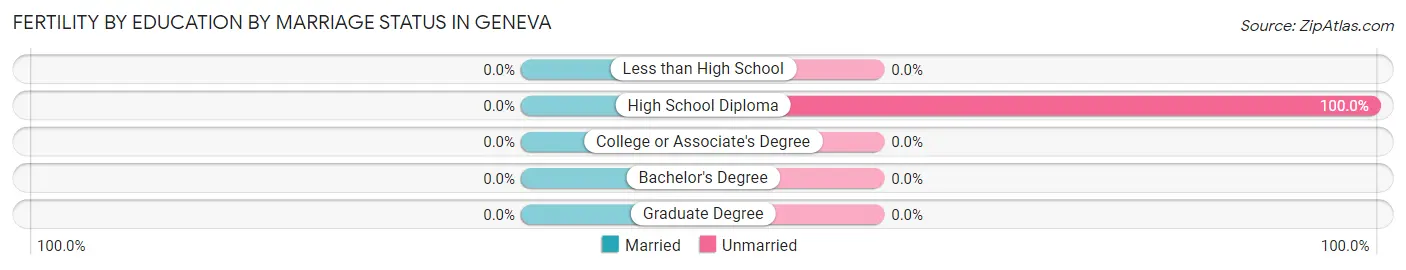
| Educational Attainment | Married | Unmarried |
| Less than High School | 0 (0.0%) | 0 (0.0%) |
| High School Diploma | 0 (0.0%) | 1 (100.0%) |
| College or Associate's Degree | 0 (0.0%) | 0 (0.0%) |
| Bachelor's Degree | 0 (0.0%) | 0 (0.0%) |
| Graduate Degree | 0 (0.0%) | 0 (0.0%) |
| Total | 0 (0.0%) | 1 (100.0%) |
Employment Characteristics in Geneva
Employment by Class of Employer in Geneva
Among the 1,070 employed individuals in Geneva, private company employees (391 | 36.5%), state government employees (190 | 17.8%), and self-employed (incorporated) (127 | 11.9%) make up the most common classes of employment.
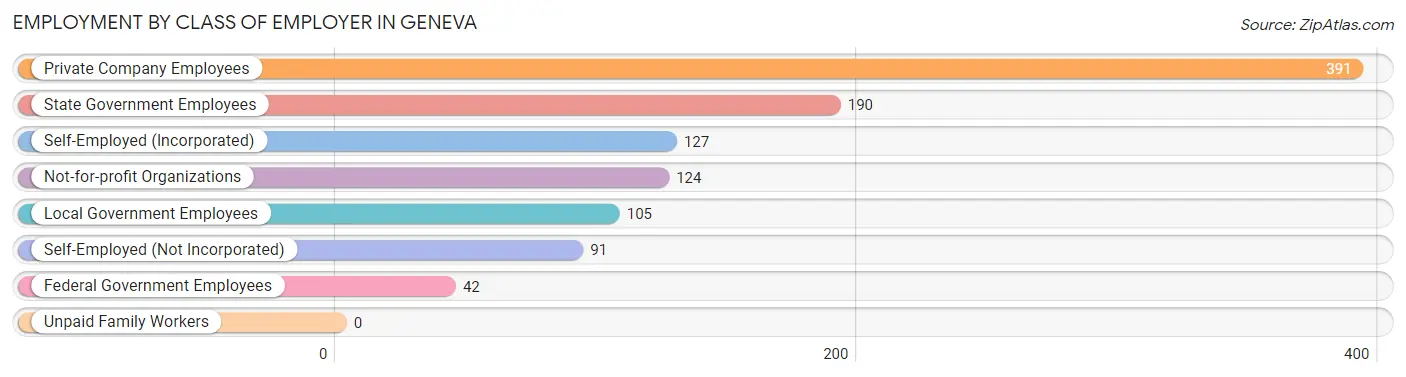
| Employer Class | # Employees | % Employees |
| Private Company Employees | 391 | 36.5% |
| Self-Employed (Incorporated) | 127 | 11.9% |
| Self-Employed (Not Incorporated) | 91 | 8.5% |
| Not-for-profit Organizations | 124 | 11.6% |
| Local Government Employees | 105 | 9.8% |
| State Government Employees | 190 | 17.8% |
| Federal Government Employees | 42 | 3.9% |
| Unpaid Family Workers | 0 | 0.0% |
| Total | 1,070 | 100.0% |
Employment Status by Age in Geneva
According to the labor force statistics for Geneva, out of the total population over 16 years of age (1,845), 65.3% or 1,205 individuals are in the labor force, with 11.1% or 134 of them unemployed. The age group with the highest labor force participation rate is 25 to 29 years, with 100.0% or 55 individuals in the labor force. Within the labor force, the 16 to 19 years age range has the highest percentage of unemployed individuals, with 96.1% or 73 of them being unemployed.
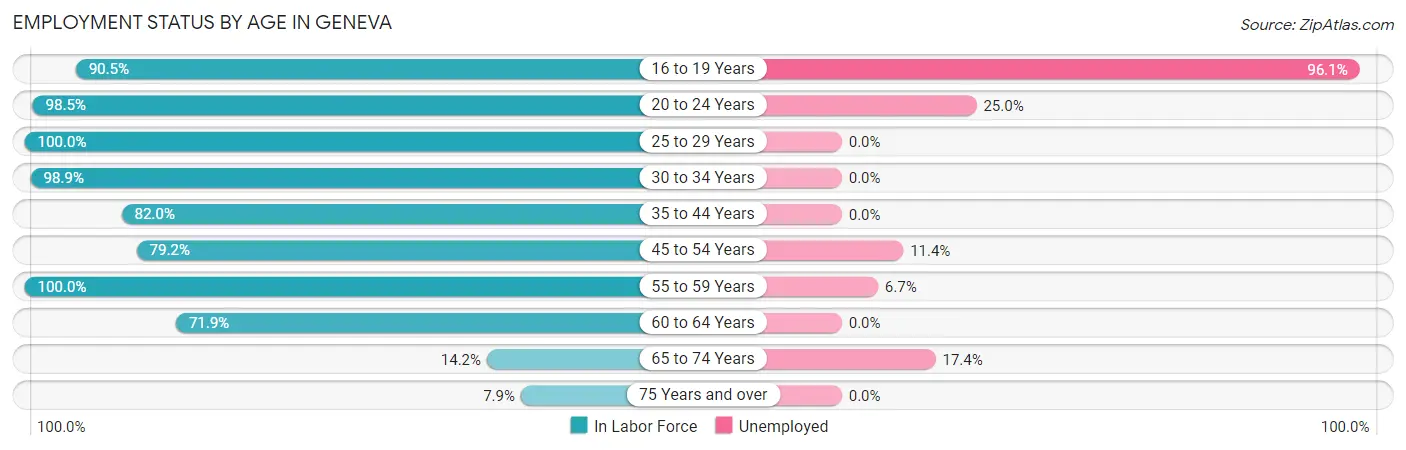
| Age Bracket | In Labor Force | Unemployed |
| 16 to 19 Years | 76 (90.5%) | 73 (96.1%) |
| 20 to 24 Years | 64 (98.5%) | 16 (25.0%) |
| 25 to 29 Years | 55 (100.0%) | 0 (0.0%) |
| 30 to 34 Years | 91 (98.9%) | 0 (0.0%) |
| 35 to 44 Years | 259 (82.0%) | 0 (0.0%) |
| 45 to 54 Years | 210 (79.2%) | 24 (11.4%) |
| 55 to 59 Years | 195 (100.0%) | 13 (6.7%) |
| 60 to 64 Years | 194 (71.9%) | 0 (0.0%) |
| 65 to 74 Years | 46 (14.2%) | 8 (17.4%) |
| 75 Years and over | 14 (7.9%) | 0 (0.0%) |
| Total | 1,205 (65.3%) | 134 (11.1%) |
Employment Status by Educational Attainment in Geneva
According to labor force statistics for Geneva, 84.2% of individuals (1,005) out of the total population between 25 and 64 years of age (1,193) are in the labor force, with 3.7% or 37 of them being unemployed. The group with the highest labor force participation rate are those with the educational attainment of college / associate degree, with 89.4% or 278 individuals in the labor force. Within the labor force, individuals with college / associate degree education have the highest percentage of unemployment, with 5.0% or 14 of them being unemployed.
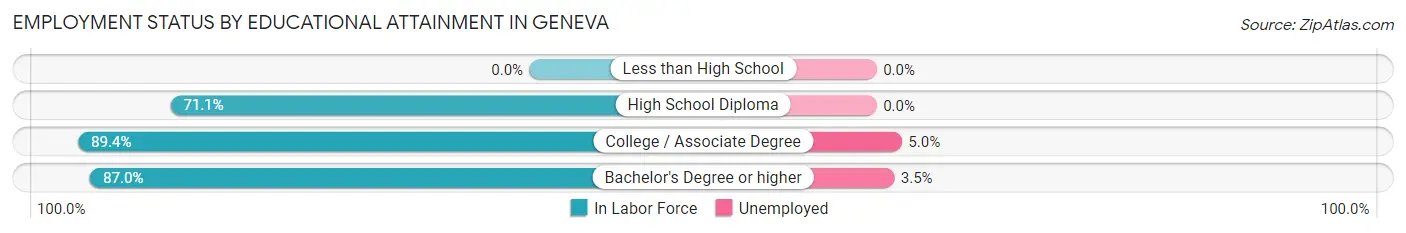
| Educational Attainment | In Labor Force | Unemployed |
| Less than High School | 0 (0.0%) | 0 (0.0%) |
| High School Diploma | 64 (71.1%) | 0 (0.0%) |
| College / Associate Degree | 278 (89.4%) | 16 (5.0%) |
| Bachelor's Degree or higher | 662 (87.0%) | 27 (3.5%) |
| Total | 1,005 (84.2%) | 44 (3.7%) |
Employment Occupations by Sex in Geneva
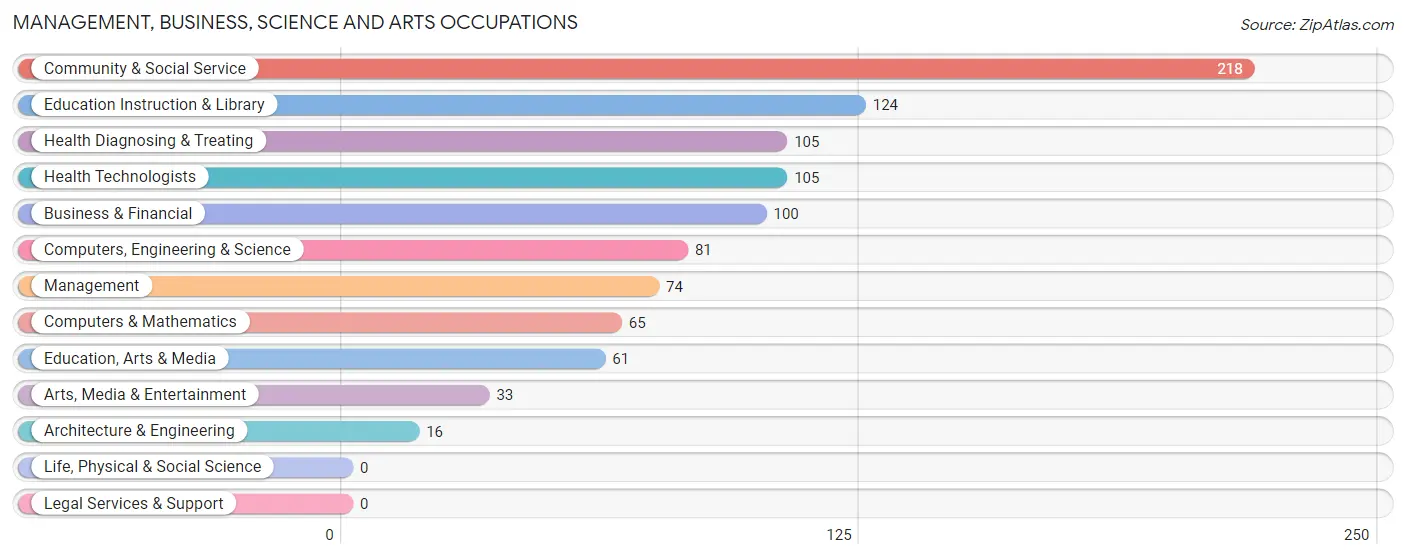
Management, Business, Science and Arts Occupations
The most common Management, Business, Science and Arts occupations in Geneva are Community & Social Service (218 | 20.4%), Education Instruction & Library (124 | 11.6%), Health Diagnosing & Treating (105 | 9.8%), Health Technologists (105 | 9.8%), and Business & Financial (100 | 9.3%).
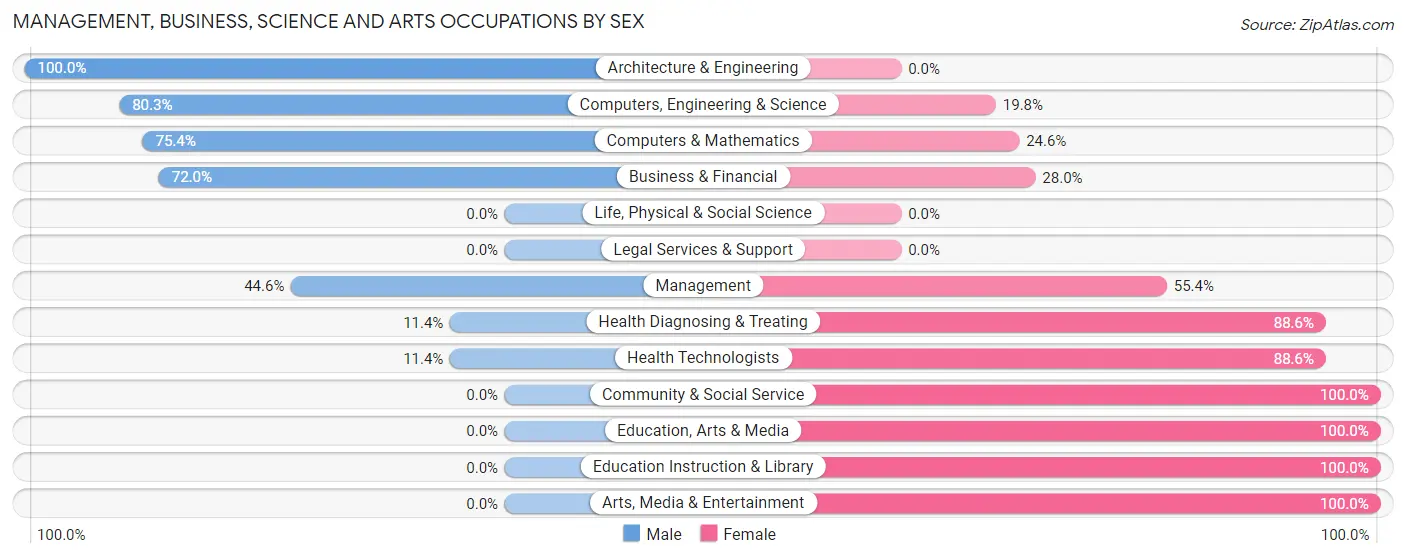
Management, Business, Science and Arts Occupations by Sex
Within the Management, Business, Science and Arts occupations in Geneva, the most male-oriented occupations are Architecture & Engineering (100.0%), Computers, Engineering & Science (80.2%), and Computers & Mathematics (75.4%), while the most female-oriented occupations are Community & Social Service (100.0%), Education, Arts & Media (100.0%), and Education Instruction & Library (100.0%).
| Occupation | Male | Female |
| Management | 33 (44.6%) | 41 (55.4%) |
| Business & Financial | 72 (72.0%) | 28 (28.0%) |
| Computers, Engineering & Science | 65 (80.2%) | 16 (19.8%) |
| Computers & Mathematics | 49 (75.4%) | 16 (24.6%) |
| Architecture & Engineering | 16 (100.0%) | 0 (0.0%) |
| Life, Physical & Social Science | 0 (0.0%) | 0 (0.0%) |
| Community & Social Service | 0 (0.0%) | 218 (100.0%) |
| Education, Arts & Media | 0 (0.0%) | 61 (100.0%) |
| Legal Services & Support | 0 (0.0%) | 0 (0.0%) |
| Education Instruction & Library | 0 (0.0%) | 124 (100.0%) |
| Arts, Media & Entertainment | 0 (0.0%) | 33 (100.0%) |
| Health Diagnosing & Treating | 12 (11.4%) | 93 (88.6%) |
| Health Technologists | 12 (11.4%) | 93 (88.6%) |
| Total (Category) | 182 (31.5%) | 396 (68.5%) |
| Total (Overall) | 511 (47.8%) | 559 (52.2%) |
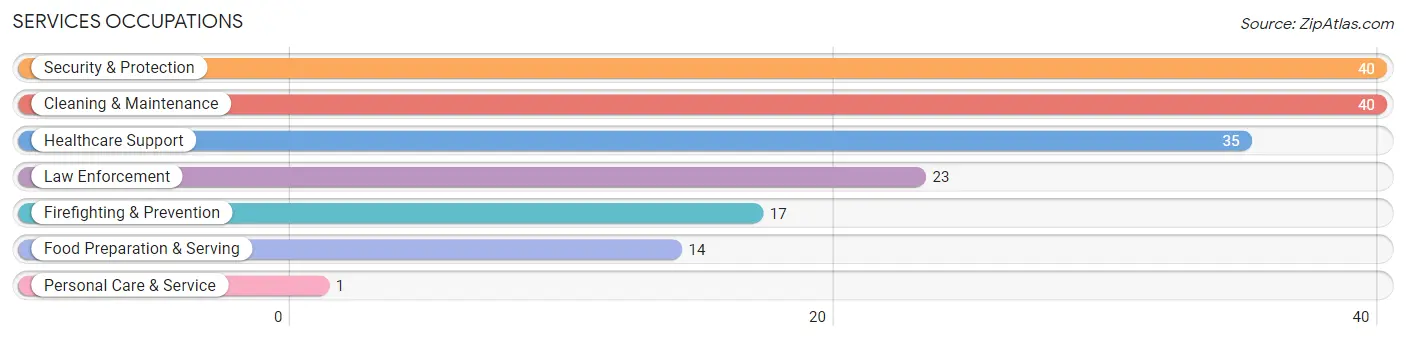
Services Occupations
The most common Services occupations in Geneva are Security & Protection (40 | 3.7%), Cleaning & Maintenance (40 | 3.7%), Healthcare Support (35 | 3.3%), Law Enforcement (23 | 2.1%), and Firefighting & Prevention (17 | 1.6%).
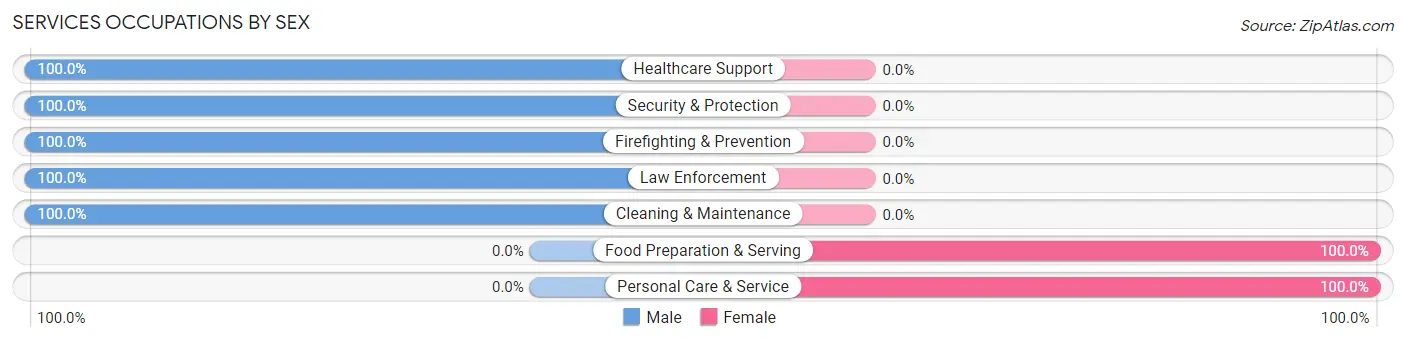
Services Occupations by Sex
Within the Services occupations in Geneva, the most male-oriented occupations are Healthcare Support (100.0%), Security & Protection (100.0%), and Firefighting & Prevention (100.0%), while the most female-oriented occupations are Food Preparation & Serving (100.0%), and Personal Care & Service (100.0%).
| Occupation | Male | Female |
| Healthcare Support | 35 (100.0%) | 0 (0.0%) |
| Security & Protection | 40 (100.0%) | 0 (0.0%) |
| Firefighting & Prevention | 17 (100.0%) | 0 (0.0%) |
| Law Enforcement | 23 (100.0%) | 0 (0.0%) |
| Food Preparation & Serving | 0 (0.0%) | 14 (100.0%) |
| Cleaning & Maintenance | 40 (100.0%) | 0 (0.0%) |
| Personal Care & Service | 0 (0.0%) | 1 (100.0%) |
| Total (Category) | 115 (88.5%) | 15 (11.5%) |
| Total (Overall) | 511 (47.8%) | 559 (52.2%) |
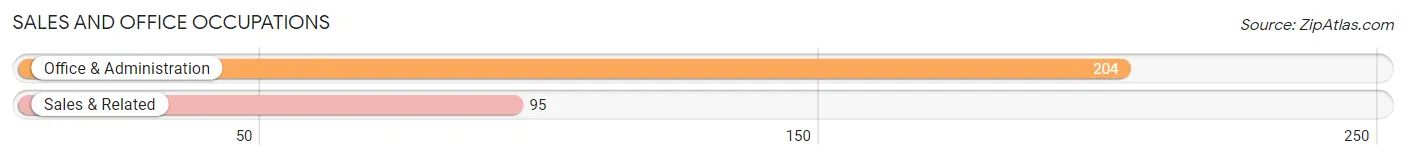
Sales and Office Occupations
The most common Sales and Office occupations in Geneva are Office & Administration (204 | 19.1%), and Sales & Related (95 | 8.9%).
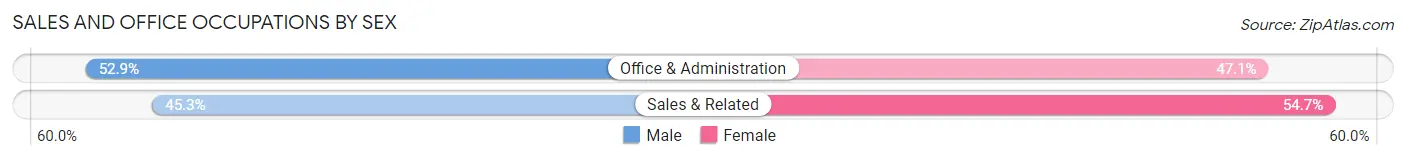
Sales and Office Occupations by Sex
| Occupation | Male | Female |
| Sales & Related | 43 (45.3%) | 52 (54.7%) |
| Office & Administration | 108 (52.9%) | 96 (47.1%) |
| Total (Category) | 151 (50.5%) | 148 (49.5%) |
| Total (Overall) | 511 (47.8%) | 559 (52.2%) |
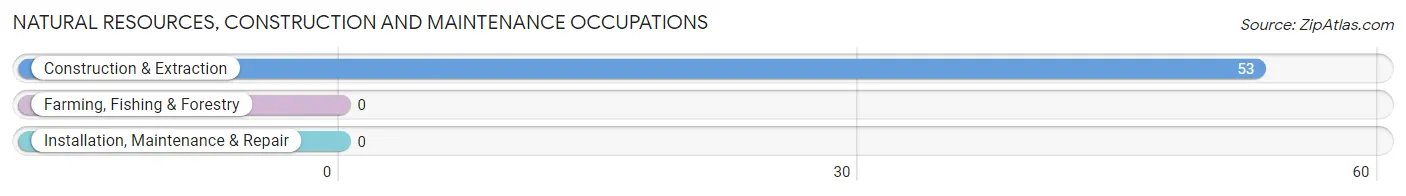
Natural Resources, Construction and Maintenance Occupations
The most common Natural Resources, Construction and Maintenance occupations in Geneva are , and Construction & Extraction (53 | 5.0%).
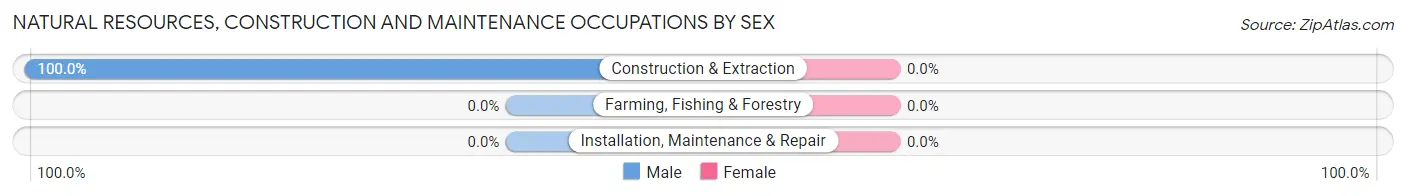
Natural Resources, Construction and Maintenance Occupations by Sex
| Occupation | Male | Female |
| Farming, Fishing & Forestry | 0 (0.0%) | 0 (0.0%) |
| Construction & Extraction | 53 (100.0%) | 0 (0.0%) |
| Installation, Maintenance & Repair | 0 (0.0%) | 0 (0.0%) |
| Total (Category) | 53 (100.0%) | 0 (0.0%) |
| Total (Overall) | 511 (47.8%) | 559 (52.2%) |
Production, Transportation and Moving Occupations
The most common Production, Transportation and Moving occupations in Geneva are Transportation (9 | 0.8%), and Material Moving (1 | 0.1%).
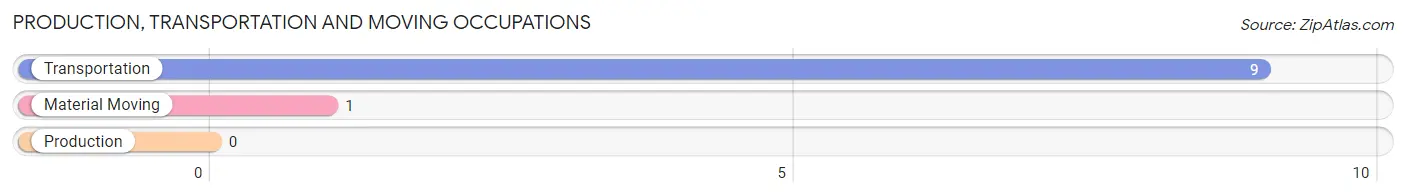
Production, Transportation and Moving Occupations by Sex
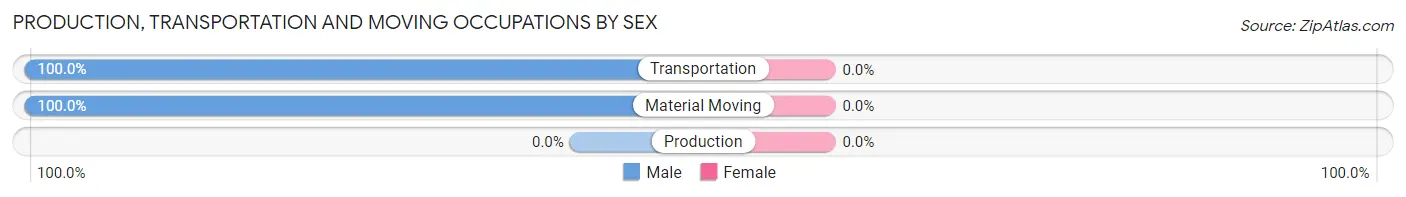
| Occupation | Male | Female |
| Production | 0 (0.0%) | 0 (0.0%) |
| Transportation | 9 (100.0%) | 0 (0.0%) |
| Material Moving | 1 (100.0%) | 0 (0.0%) |
| Total (Category) | 10 (100.0%) | 0 (0.0%) |
| Total (Overall) | 511 (47.8%) | 559 (52.2%) |
Employment Industries by Sex in Geneva
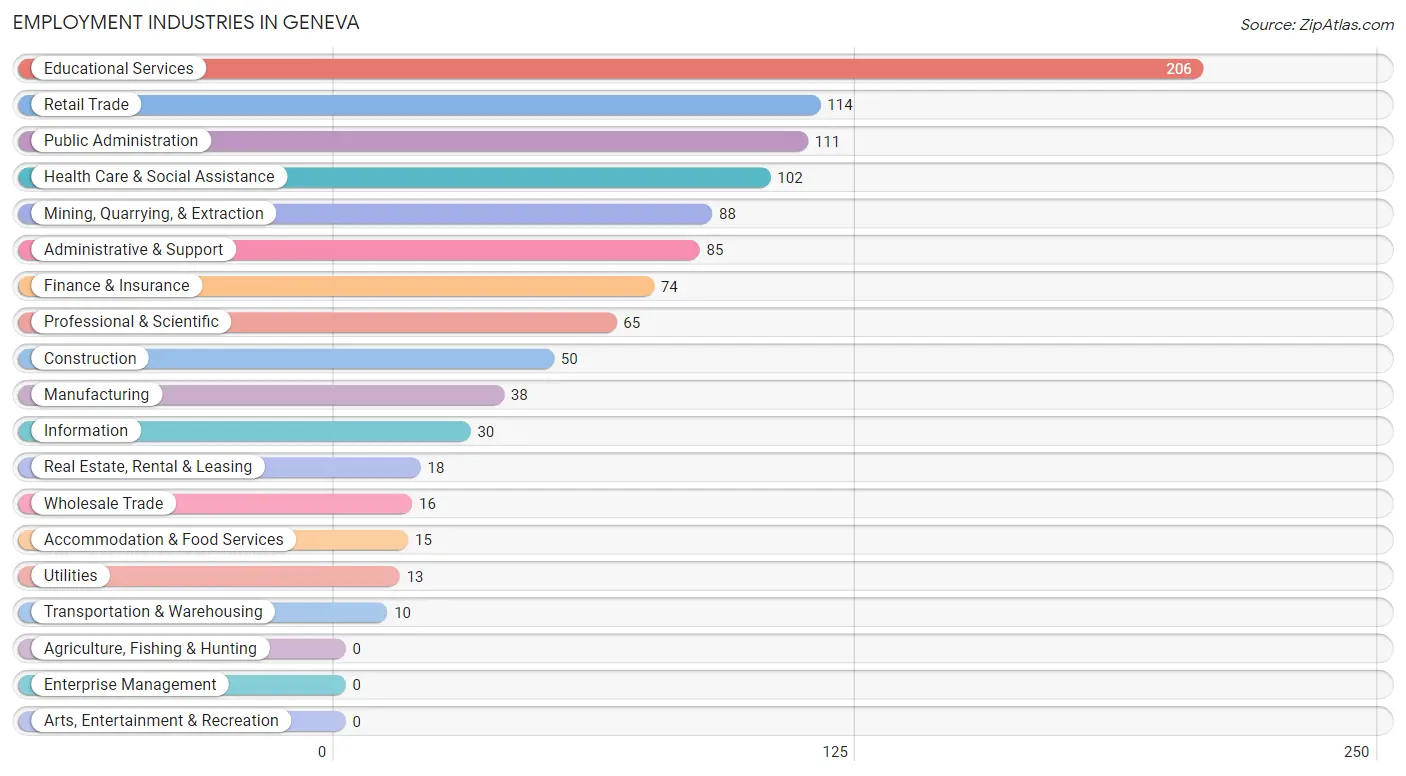
Employment Industries in Geneva
The major employment industries in Geneva include Educational Services (206 | 19.3%), Retail Trade (114 | 10.6%), Public Administration (111 | 10.4%), Health Care & Social Assistance (102 | 9.5%), and Mining, Quarrying, & Extraction (88 | 8.2%).
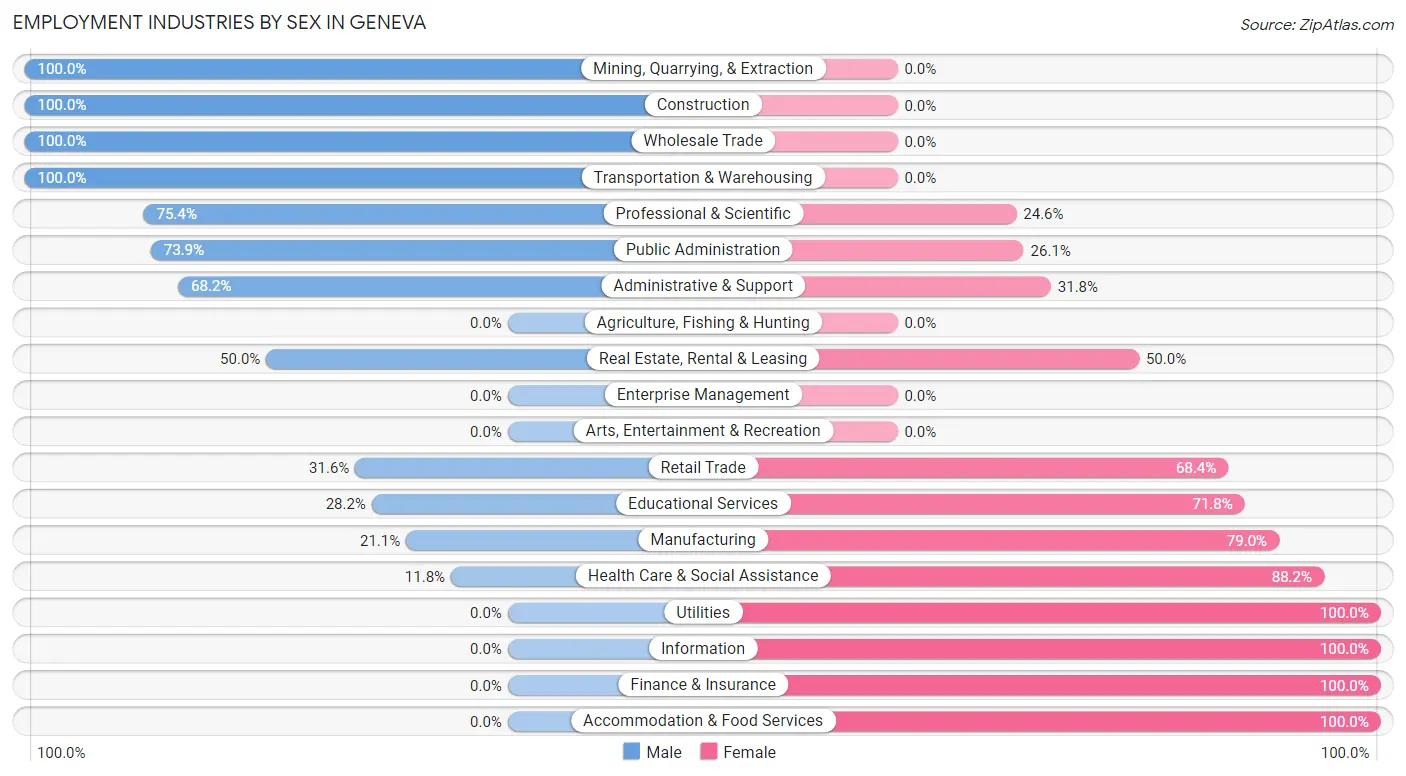
Employment Industries by Sex in Geneva
The Geneva industries that see more men than women are Mining, Quarrying, & Extraction (100.0%), Construction (100.0%), and Wholesale Trade (100.0%), whereas the industries that tend to have a higher number of women are Utilities (100.0%), Information (100.0%), and Finance & Insurance (100.0%).
| Industry | Male | Female |
| Agriculture, Fishing & Hunting | 0 (0.0%) | 0 (0.0%) |
| Mining, Quarrying, & Extraction | 88 (100.0%) | 0 (0.0%) |
| Construction | 50 (100.0%) | 0 (0.0%) |
| Manufacturing | 8 (21.0%) | 30 (78.9%) |
| Wholesale Trade | 16 (100.0%) | 0 (0.0%) |
| Retail Trade | 36 (31.6%) | 78 (68.4%) |
| Transportation & Warehousing | 10 (100.0%) | 0 (0.0%) |
| Utilities | 0 (0.0%) | 13 (100.0%) |
| Information | 0 (0.0%) | 30 (100.0%) |
| Finance & Insurance | 0 (0.0%) | 74 (100.0%) |
| Real Estate, Rental & Leasing | 9 (50.0%) | 9 (50.0%) |
| Professional & Scientific | 49 (75.4%) | 16 (24.6%) |
| Enterprise Management | 0 (0.0%) | 0 (0.0%) |
| Administrative & Support | 58 (68.2%) | 27 (31.8%) |
| Educational Services | 58 (28.2%) | 148 (71.8%) |
| Health Care & Social Assistance | 12 (11.8%) | 90 (88.2%) |
| Arts, Entertainment & Recreation | 0 (0.0%) | 0 (0.0%) |
| Accommodation & Food Services | 0 (0.0%) | 15 (100.0%) |
| Public Administration | 82 (73.9%) | 29 (26.1%) |
| Total | 511 (47.8%) | 559 (52.2%) |
Education in Geneva
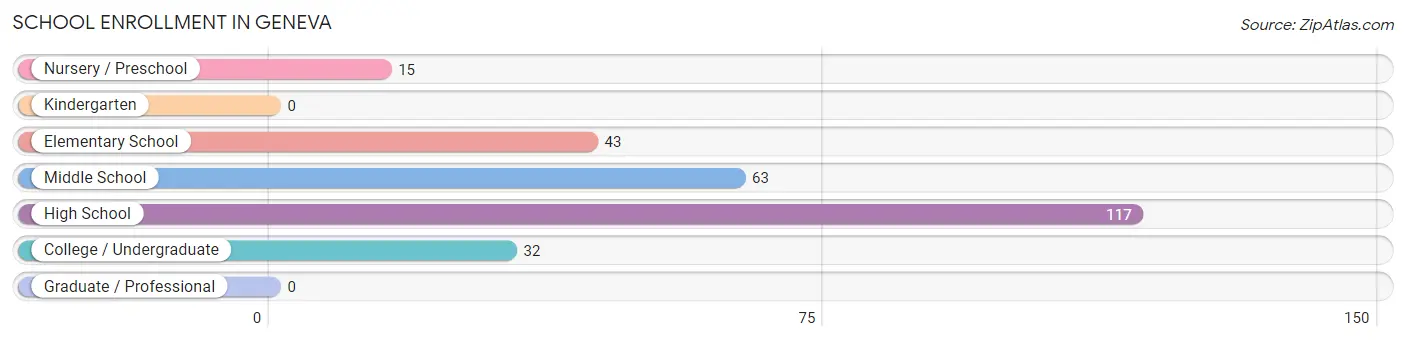
School Enrollment in Geneva
The most common levels of schooling among the 270 students in Geneva are high school (117 | 43.3%), middle school (63 | 23.3%), and elementary school (43 | 15.9%).
| School Level | # Students | % Students |
| Nursery / Preschool | 15 | 5.6% |
| Kindergarten | 0 | 0.0% |
| Elementary School | 43 | 15.9% |
| Middle School | 63 | 23.3% |
| High School | 117 | 43.3% |
| College / Undergraduate | 32 | 11.8% |
| Graduate / Professional | 0 | 0.0% |
| Total | 270 | 100.0% |
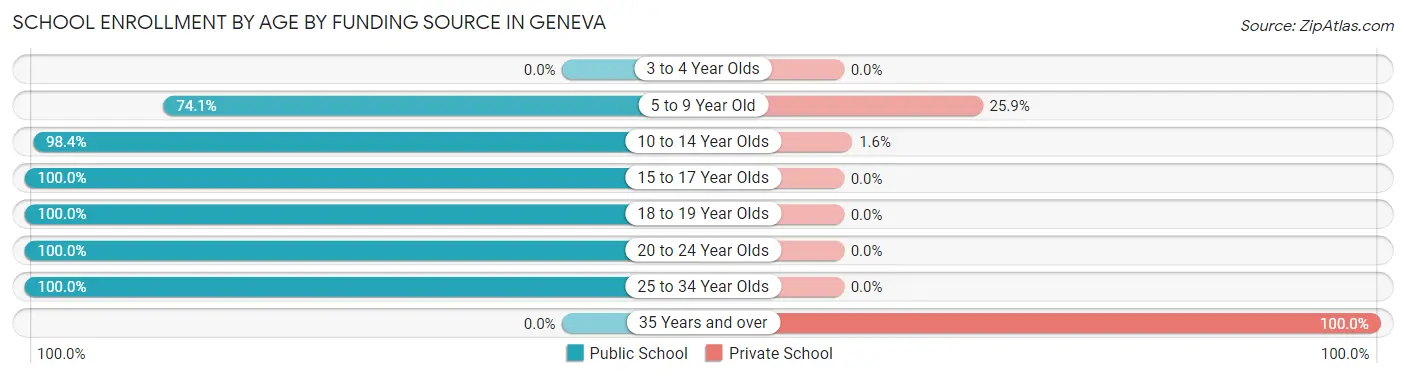
School Enrollment by Age by Funding Source in Geneva
Out of a total of 270 students who are enrolled in schools in Geneva, 26 (9.6%) attend a private institution, while the remaining 244 (90.4%) are enrolled in public schools. The age group of 35 years and over has the highest likelihood of being enrolled in private schools, with 10 (100.0% in the age bracket) enrolled. Conversely, the age group of 15 to 17 year olds has the lowest likelihood of being enrolled in a private school, with 46 (100.0% in the age bracket) attending a public institution.
| Age Bracket | Public School | Private School |
| 3 to 4 Year Olds | 0 (0.0%) | 0 (0.0%) |
| 5 to 9 Year Old | 43 (74.1%) | 15 (25.9%) |
| 10 to 14 Year Olds | 62 (98.4%) | 1 (1.6%) |
| 15 to 17 Year Olds | 46 (100.0%) | 0 (0.0%) |
| 18 to 19 Year Olds | 78 (100.0%) | 0 (0.0%) |
| 20 to 24 Year Olds | 1 (100.0%) | 0 (0.0%) |
| 25 to 34 Year Olds | 14 (100.0%) | 0 (0.0%) |
| 35 Years and over | 0 (0.0%) | 10 (100.0%) |
| Total | 244 (90.4%) | 26 (9.6%) |
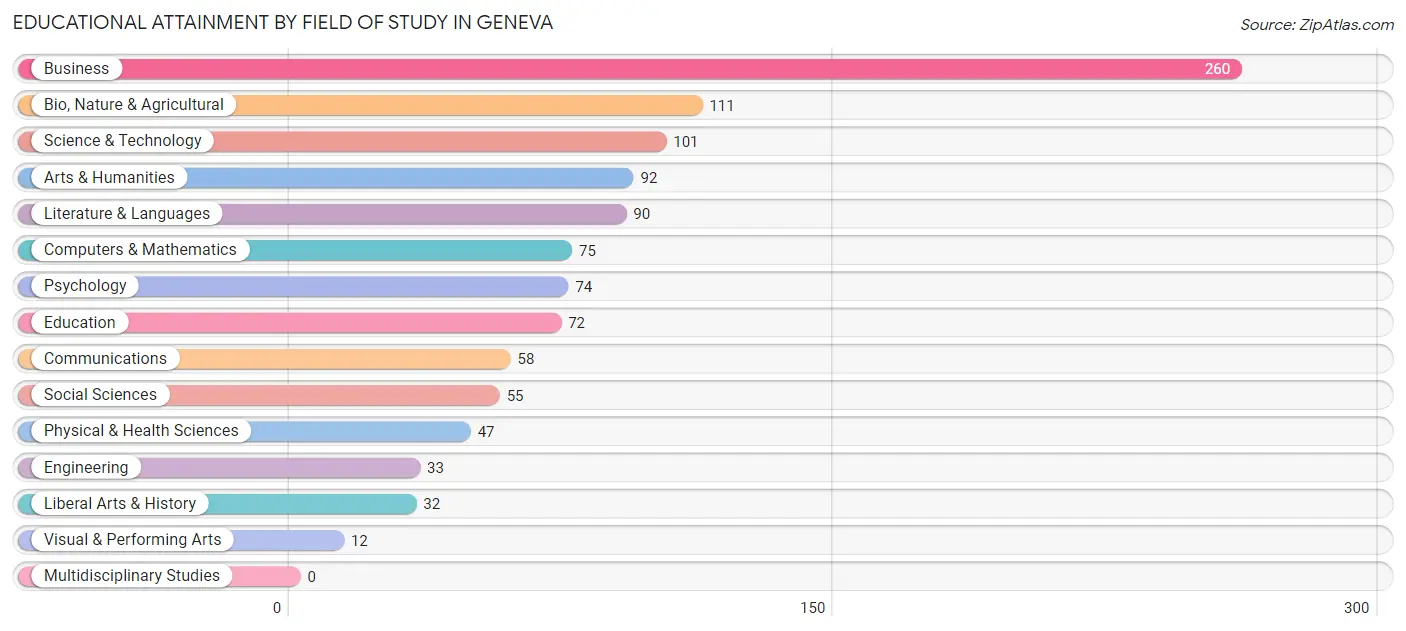
Educational Attainment by Field of Study in Geneva
Business (260 | 23.4%), bio, nature & agricultural (111 | 10.0%), science & technology (101 | 9.1%), arts & humanities (92 | 8.3%), and literature & languages (90 | 8.1%) are the most common fields of study among 1,112 individuals in Geneva who have obtained a bachelor's degree or higher.
| Field of Study | # Graduates | % Graduates |
| Computers & Mathematics | 75 | 6.7% |
| Bio, Nature & Agricultural | 111 | 10.0% |
| Physical & Health Sciences | 47 | 4.2% |
| Psychology | 74 | 6.7% |
| Social Sciences | 55 | 5.0% |
| Engineering | 33 | 3.0% |
| Multidisciplinary Studies | 0 | 0.0% |
| Science & Technology | 101 | 9.1% |
| Business | 260 | 23.4% |
| Education | 72 | 6.5% |
| Literature & Languages | 90 | 8.1% |
| Liberal Arts & History | 32 | 2.9% |
| Visual & Performing Arts | 12 | 1.1% |
| Communications | 58 | 5.2% |
| Arts & Humanities | 92 | 8.3% |
| Total | 1,112 | 100.0% |
Transportation & Commute in Geneva
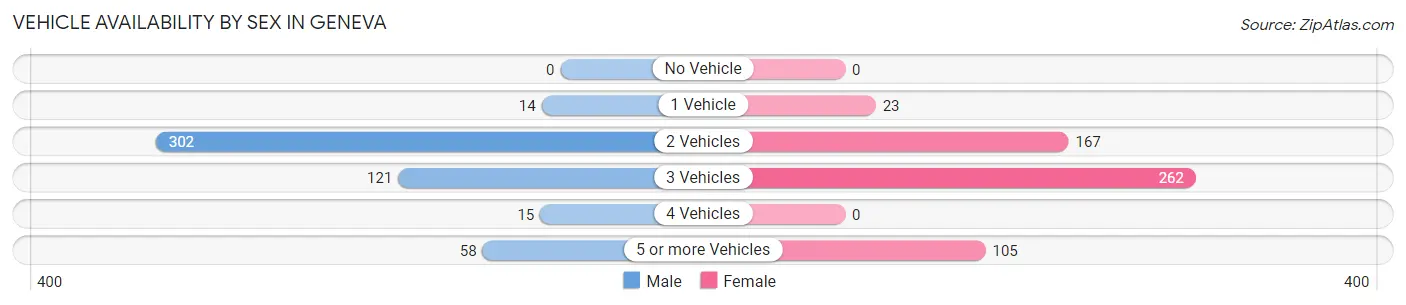
Vehicle Availability by Sex in Geneva
The most prevalent vehicle ownership categories in Geneva are males with 2 vehicles (302, accounting for 59.2%) and females with 2 vehicles (167, making up 54.2%).
| Vehicles Available | Male | Female |
| No Vehicle | 0 (0.0%) | 0 (0.0%) |
| 1 Vehicle | 14 (2.8%) | 23 (4.1%) |
| 2 Vehicles | 302 (59.2%) | 167 (30.0%) |
| 3 Vehicles | 121 (23.7%) | 262 (47.0%) |
| 4 Vehicles | 15 (2.9%) | 0 (0.0%) |
| 5 or more Vehicles | 58 (11.4%) | 105 (18.9%) |
| Total | 510 (100.0%) | 557 (100.0%) |
Commute Time in Geneva
The most frequently occuring commute durations in Geneva are 15 to 19 minutes (234 commuters, 32.8%), 20 to 24 minutes (144 commuters, 20.2%), and less than 5 minutes (91 commuters, 12.8%).
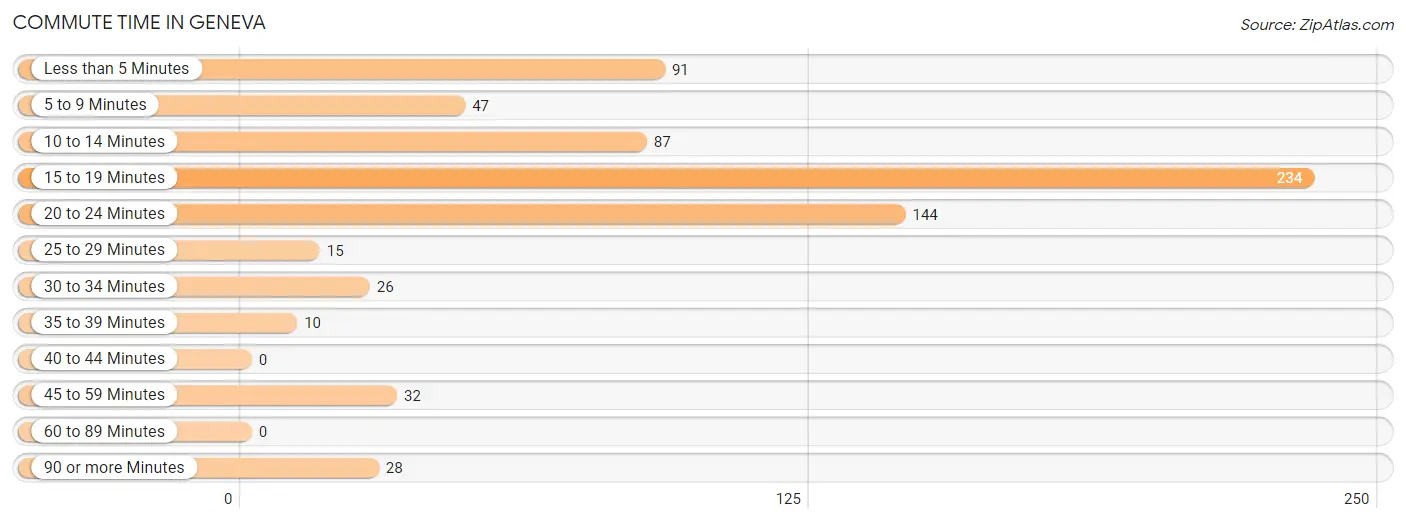
| Commute Time | # Commuters | % Commuters |
| Less than 5 Minutes | 91 | 12.8% |
| 5 to 9 Minutes | 47 | 6.6% |
| 10 to 14 Minutes | 87 | 12.2% |
| 15 to 19 Minutes | 234 | 32.8% |
| 20 to 24 Minutes | 144 | 20.2% |
| 25 to 29 Minutes | 15 | 2.1% |
| 30 to 34 Minutes | 26 | 3.6% |
| 35 to 39 Minutes | 10 | 1.4% |
| 40 to 44 Minutes | 0 | 0.0% |
| 45 to 59 Minutes | 32 | 4.5% |
| 60 to 89 Minutes | 0 | 0.0% |
| 90 or more Minutes | 28 | 3.9% |
Commute Time by Sex in Geneva
The most common commute times in Geneva are 15 to 19 minutes (170 commuters, 46.2%) for males and 20 to 24 minutes (129 commuters, 37.3%) for females.
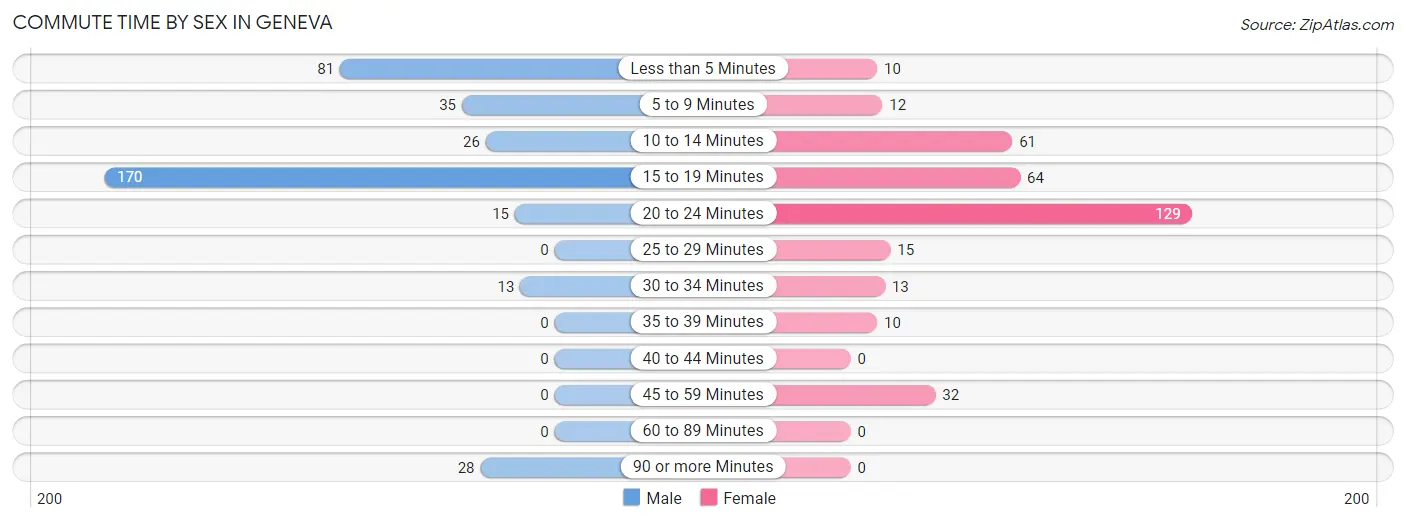
| Commute Time | Male | Female |
| Less than 5 Minutes | 81 (22.0%) | 10 (2.9%) |
| 5 to 9 Minutes | 35 (9.5%) | 12 (3.5%) |
| 10 to 14 Minutes | 26 (7.1%) | 61 (17.6%) |
| 15 to 19 Minutes | 170 (46.2%) | 64 (18.5%) |
| 20 to 24 Minutes | 15 (4.1%) | 129 (37.3%) |
| 25 to 29 Minutes | 0 (0.0%) | 15 (4.3%) |
| 30 to 34 Minutes | 13 (3.5%) | 13 (3.8%) |
| 35 to 39 Minutes | 0 (0.0%) | 10 (2.9%) |
| 40 to 44 Minutes | 0 (0.0%) | 0 (0.0%) |
| 45 to 59 Minutes | 0 (0.0%) | 32 (9.2%) |
| 60 to 89 Minutes | 0 (0.0%) | 0 (0.0%) |
| 90 or more Minutes | 28 (7.6%) | 0 (0.0%) |
Time of Departure to Work by Sex in Geneva
The most frequent times of departure to work in Geneva are 7:30 AM to 7:59 AM (233, 63.3%) for males and 8:00 AM to 8:29 AM (116, 33.5%) for females.
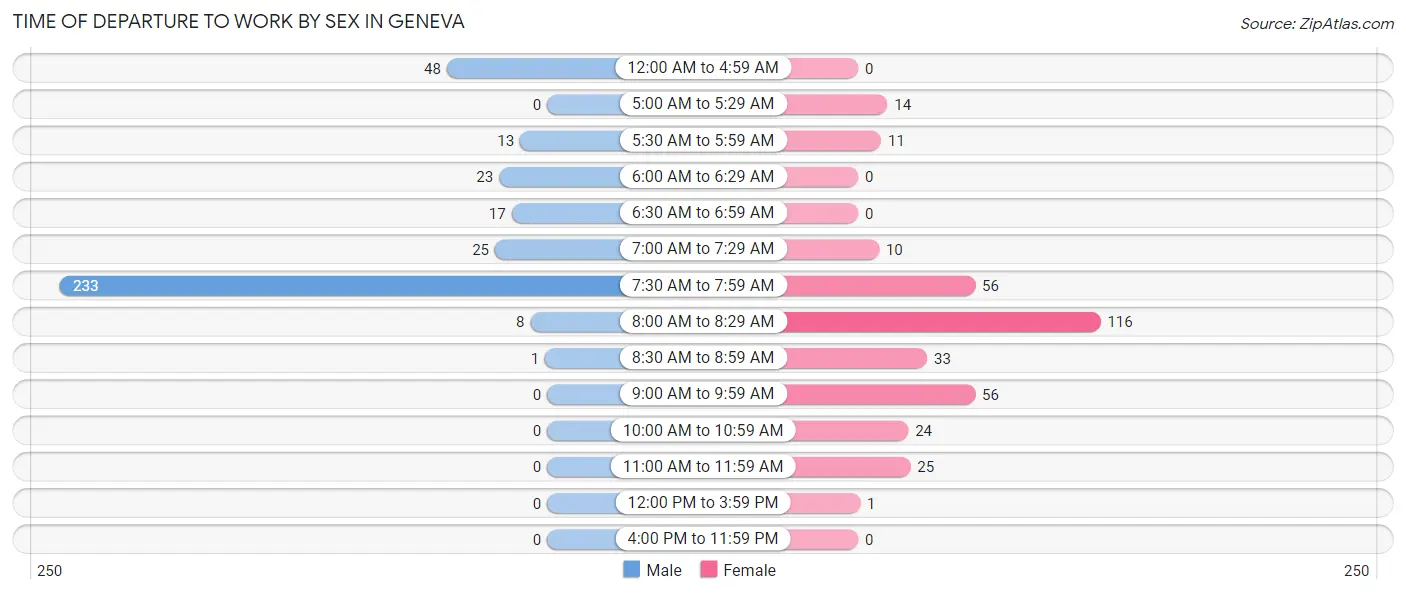
| Time of Departure | Male | Female |
| 12:00 AM to 4:59 AM | 48 (13.0%) | 0 (0.0%) |
| 5:00 AM to 5:29 AM | 0 (0.0%) | 14 (4.1%) |
| 5:30 AM to 5:59 AM | 13 (3.5%) | 11 (3.2%) |
| 6:00 AM to 6:29 AM | 23 (6.2%) | 0 (0.0%) |
| 6:30 AM to 6:59 AM | 17 (4.6%) | 0 (0.0%) |
| 7:00 AM to 7:29 AM | 25 (6.8%) | 10 (2.9%) |
| 7:30 AM to 7:59 AM | 233 (63.3%) | 56 (16.2%) |
| 8:00 AM to 8:29 AM | 8 (2.2%) | 116 (33.5%) |
| 8:30 AM to 8:59 AM | 1 (0.3%) | 33 (9.5%) |
| 9:00 AM to 9:59 AM | 0 (0.0%) | 56 (16.2%) |
| 10:00 AM to 10:59 AM | 0 (0.0%) | 24 (6.9%) |
| 11:00 AM to 11:59 AM | 0 (0.0%) | 25 (7.2%) |
| 12:00 PM to 3:59 PM | 0 (0.0%) | 1 (0.3%) |
| 4:00 PM to 11:59 PM | 0 (0.0%) | 0 (0.0%) |
| Total | 368 (100.0%) | 346 (100.0%) |
Housing Occupancy in Geneva
Occupancy by Ownership in Geneva
Of the total 912 dwellings in Geneva, owner-occupied units account for 851 (93.3%), while renter-occupied units make up 61 (6.7%).
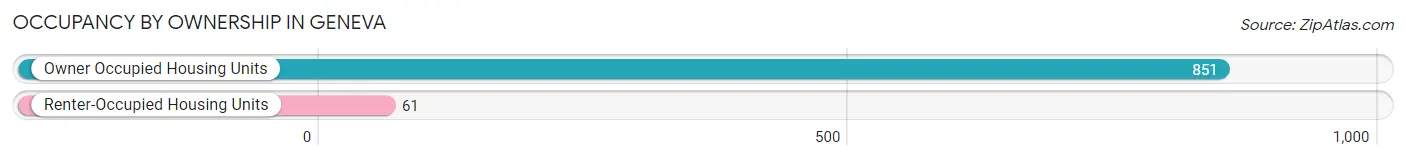
| Occupancy | # Housing Units | % Housing Units |
| Owner Occupied Housing Units | 851 | 93.3% |
| Renter-Occupied Housing Units | 61 | 6.7% |
| Total Occupied Housing Units | 912 | 100.0% |
Occupancy by Household Size in Geneva
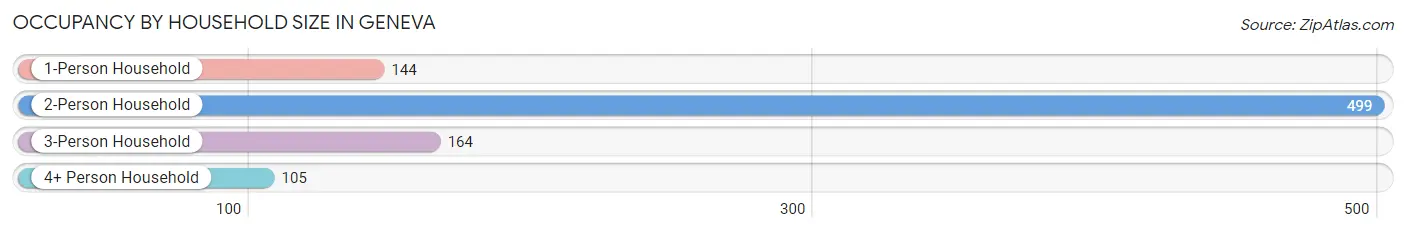
| Household Size | # Housing Units | % Housing Units |
| 1-Person Household | 144 | 15.8% |
| 2-Person Household | 499 | 54.7% |
| 3-Person Household | 164 | 18.0% |
| 4+ Person Household | 105 | 11.5% |
| Total Housing Units | 912 | 100.0% |
Occupancy by Ownership by Household Size in Geneva
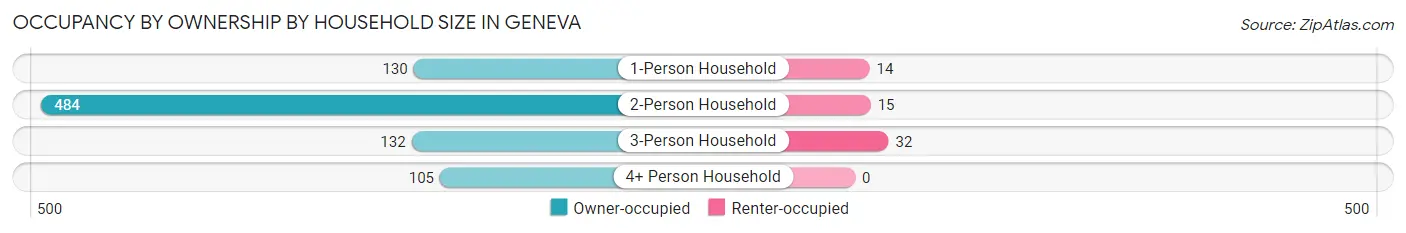
| Household Size | Owner-occupied | Renter-occupied |
| 1-Person Household | 130 (90.3%) | 14 (9.7%) |
| 2-Person Household | 484 (97.0%) | 15 (3.0%) |
| 3-Person Household | 132 (80.5%) | 32 (19.5%) |
| 4+ Person Household | 105 (100.0%) | 0 (0.0%) |
| Total Housing Units | 851 (93.3%) | 61 (6.7%) |
Occupancy by Educational Attainment in Geneva
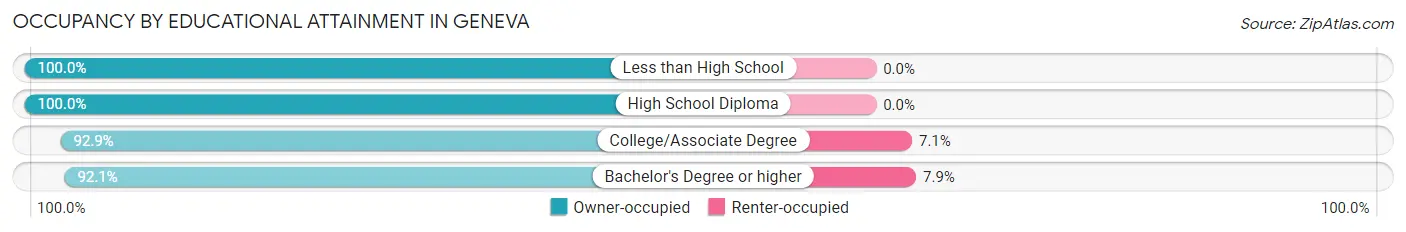
| Household Size | Owner-occupied | Renter-occupied |
| Less than High School | 15 (100.0%) | 0 (0.0%) |
| High School Diploma | 106 (100.0%) | 0 (0.0%) |
| College/Associate Degree | 183 (92.9%) | 14 (7.1%) |
| Bachelor's Degree or higher | 547 (92.1%) | 47 (7.9%) |
Occupancy by Age of Householder in Geneva
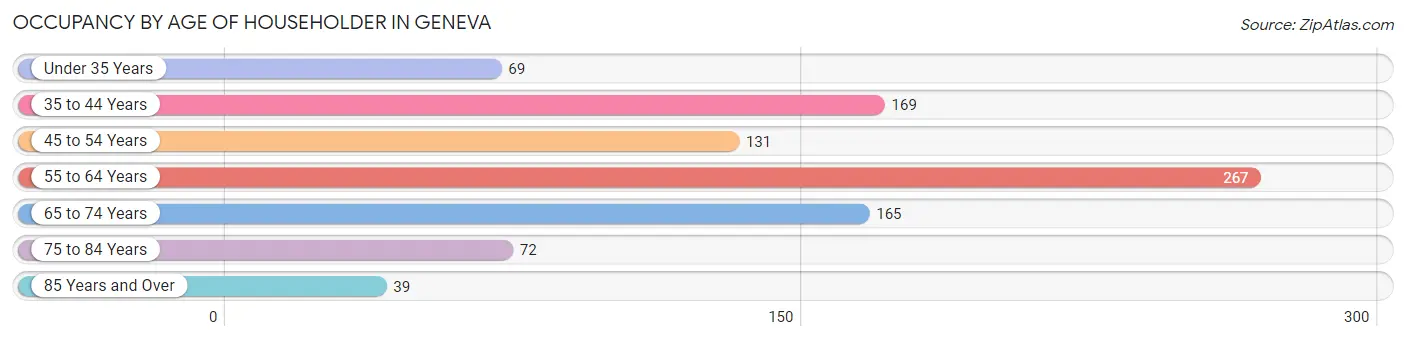
| Age Bracket | # Households | % Households |
| Under 35 Years | 69 | 7.6% |
| 35 to 44 Years | 169 | 18.5% |
| 45 to 54 Years | 131 | 14.4% |
| 55 to 64 Years | 267 | 29.3% |
| 65 to 74 Years | 165 | 18.1% |
| 75 to 84 Years | 72 | 7.9% |
| 85 Years and Over | 39 | 4.3% |
| Total | 912 | 100.0% |
Housing Finances in Geneva
Median Income by Occupancy in Geneva
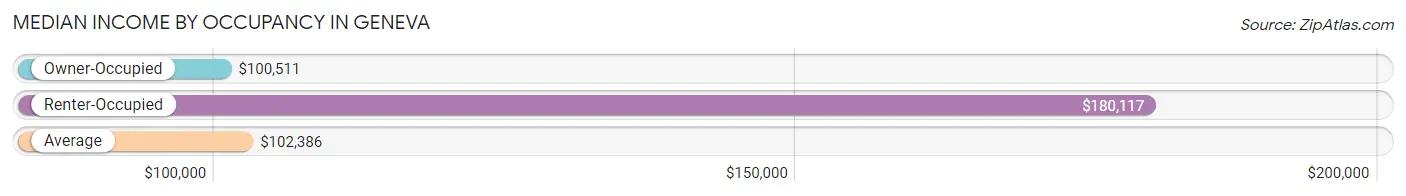
| Occupancy Type | # Households | Median Income |
| Owner-Occupied | 851 (93.3%) | $100,511 |
| Renter-Occupied | 61 (6.7%) | $180,117 |
| Average | 912 (100.0%) | $102,386 |
Occupancy by Householder Income Bracket in Geneva
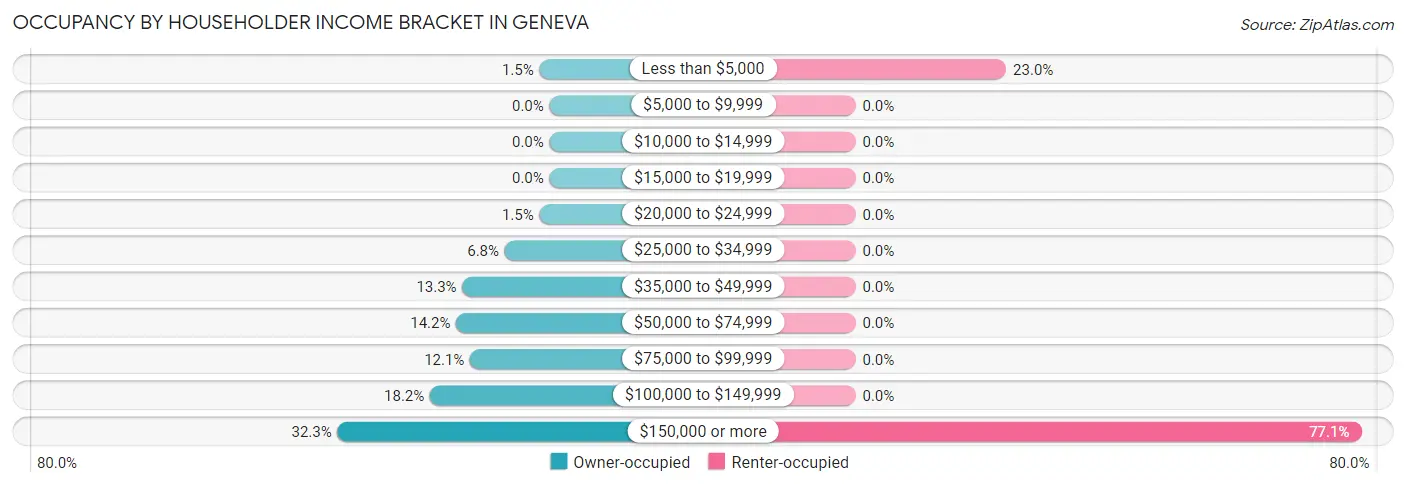
| Income Bracket | Owner-occupied | Renter-occupied |
| Less than $5,000 | 13 (1.5%) | 14 (23.0%) |
| $5,000 to $9,999 | 0 (0.0%) | 0 (0.0%) |
| $10,000 to $14,999 | 0 (0.0%) | 0 (0.0%) |
| $15,000 to $19,999 | 0 (0.0%) | 0 (0.0%) |
| $20,000 to $24,999 | 13 (1.5%) | 0 (0.0%) |
| $25,000 to $34,999 | 58 (6.8%) | 0 (0.0%) |
| $35,000 to $49,999 | 113 (13.3%) | 0 (0.0%) |
| $50,000 to $74,999 | 121 (14.2%) | 0 (0.0%) |
| $75,000 to $99,999 | 103 (12.1%) | 0 (0.0%) |
| $100,000 to $149,999 | 155 (18.2%) | 0 (0.0%) |
| $150,000 or more | 275 (32.3%) | 47 (77.0%) |
| Total | 851 (100.0%) | 61 (100.0%) |
Monthly Housing Cost Tiers in Geneva
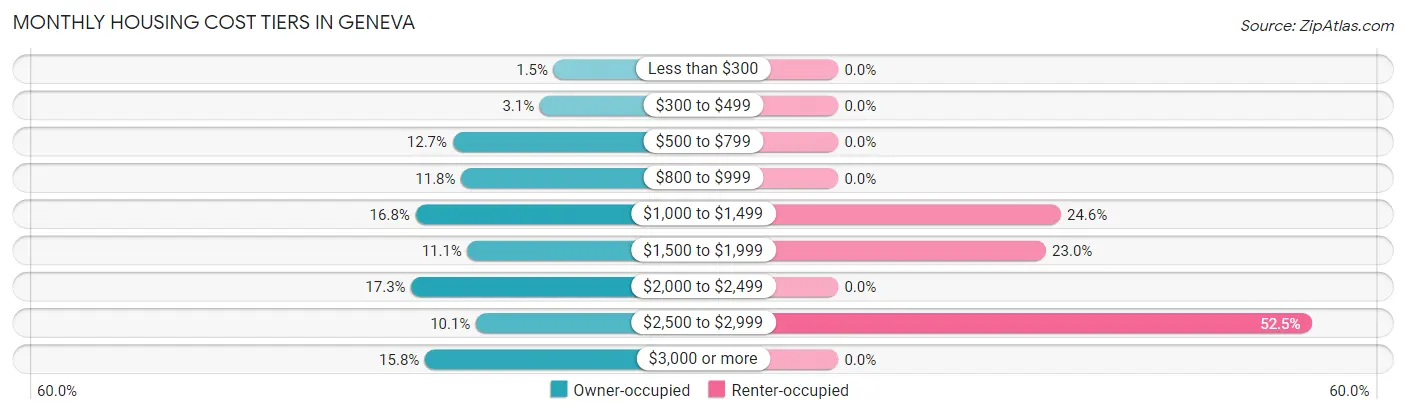
| Monthly Cost | Owner-occupied | Renter-occupied |
| Less than $300 | 13 (1.5%) | 0 (0.0%) |
| $300 to $499 | 26 (3.1%) | 0 (0.0%) |
| $500 to $799 | 108 (12.7%) | 0 (0.0%) |
| $800 to $999 | 100 (11.7%) | 0 (0.0%) |
| $1,000 to $1,499 | 143 (16.8%) | 15 (24.6%) |
| $1,500 to $1,999 | 94 (11.1%) | 14 (23.0%) |
| $2,000 to $2,499 | 147 (17.3%) | 0 (0.0%) |
| $2,500 to $2,999 | 86 (10.1%) | 32 (52.5%) |
| $3,000 or more | 134 (15.8%) | 0 (0.0%) |
| Total | 851 (100.0%) | 61 (100.0%) |
Physical Housing Characteristics in Geneva
Housing Structures in Geneva
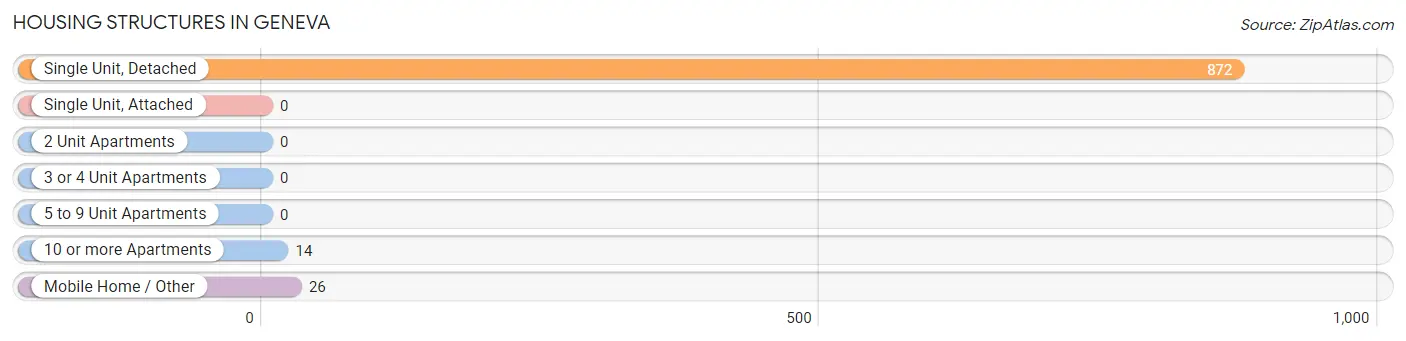
| Structure Type | # Housing Units | % Housing Units |
| Single Unit, Detached | 872 | 95.6% |
| Single Unit, Attached | 0 | 0.0% |
| 2 Unit Apartments | 0 | 0.0% |
| 3 or 4 Unit Apartments | 0 | 0.0% |
| 5 to 9 Unit Apartments | 0 | 0.0% |
| 10 or more Apartments | 14 | 1.5% |
| Mobile Home / Other | 26 | 2.9% |
| Total | 912 | 100.0% |
Housing Structures by Occupancy in Geneva
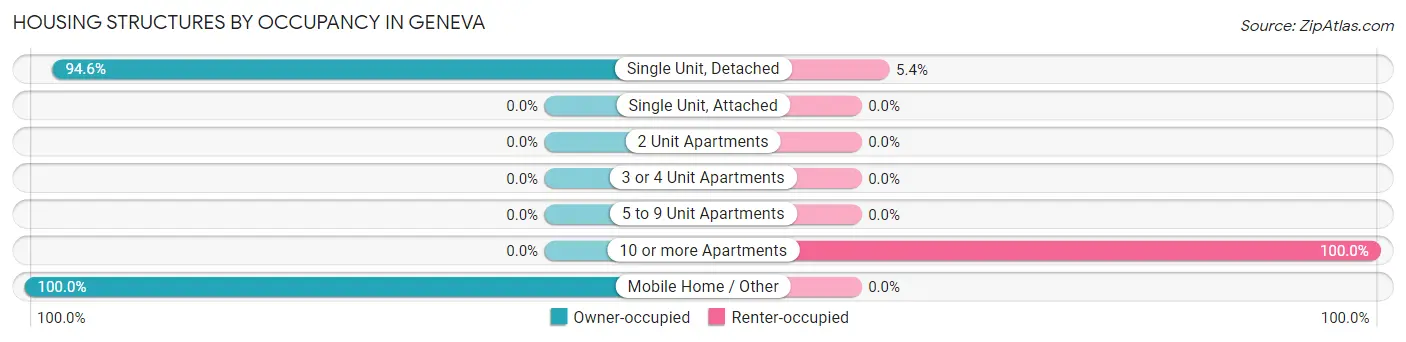
| Structure Type | Owner-occupied | Renter-occupied |
| Single Unit, Detached | 825 (94.6%) | 47 (5.4%) |
| Single Unit, Attached | 0 (0.0%) | 0 (0.0%) |
| 2 Unit Apartments | 0 (0.0%) | 0 (0.0%) |
| 3 or 4 Unit Apartments | 0 (0.0%) | 0 (0.0%) |
| 5 to 9 Unit Apartments | 0 (0.0%) | 0 (0.0%) |
| 10 or more Apartments | 0 (0.0%) | 14 (100.0%) |
| Mobile Home / Other | 26 (100.0%) | 0 (0.0%) |
| Total | 851 (93.3%) | 61 (6.7%) |
Housing Structures by Number of Rooms in Geneva
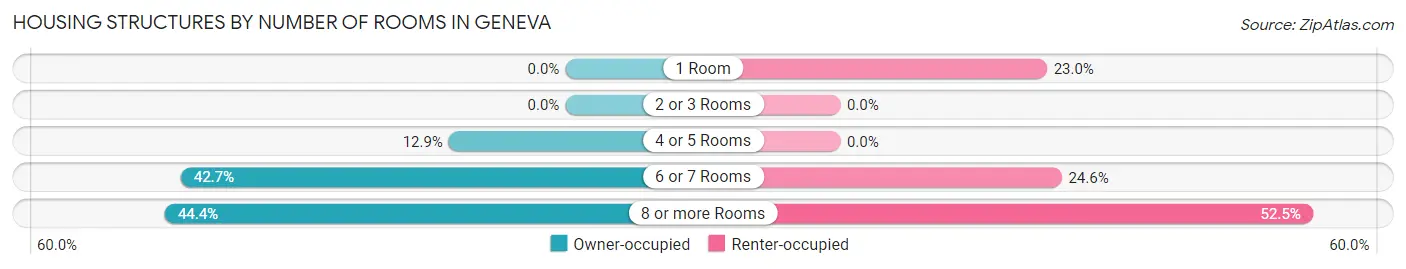
| Number of Rooms | Owner-occupied | Renter-occupied |
| 1 Room | 0 (0.0%) | 14 (23.0%) |
| 2 or 3 Rooms | 0 (0.0%) | 0 (0.0%) |
| 4 or 5 Rooms | 110 (12.9%) | 0 (0.0%) |
| 6 or 7 Rooms | 363 (42.7%) | 15 (24.6%) |
| 8 or more Rooms | 378 (44.4%) | 32 (52.5%) |
| Total | 851 (100.0%) | 61 (100.0%) |
Housing Structure by Heating Type in Geneva
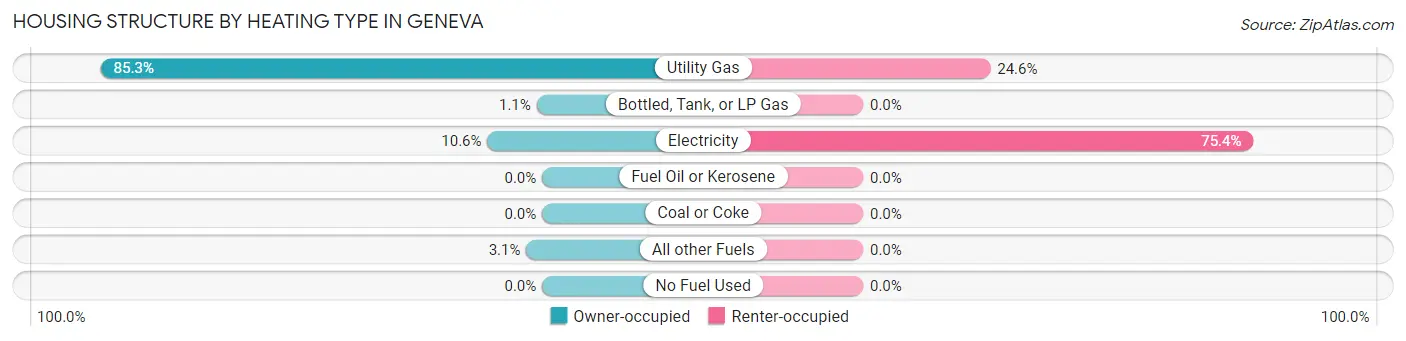
| Heating Type | Owner-occupied | Renter-occupied |
| Utility Gas | 726 (85.3%) | 15 (24.6%) |
| Bottled, Tank, or LP Gas | 9 (1.1%) | 0 (0.0%) |
| Electricity | 90 (10.6%) | 46 (75.4%) |
| Fuel Oil or Kerosene | 0 (0.0%) | 0 (0.0%) |
| Coal or Coke | 0 (0.0%) | 0 (0.0%) |
| All other Fuels | 26 (3.1%) | 0 (0.0%) |
| No Fuel Used | 0 (0.0%) | 0 (0.0%) |
| Total | 851 (100.0%) | 61 (100.0%) |
Household Vehicle Usage in Geneva
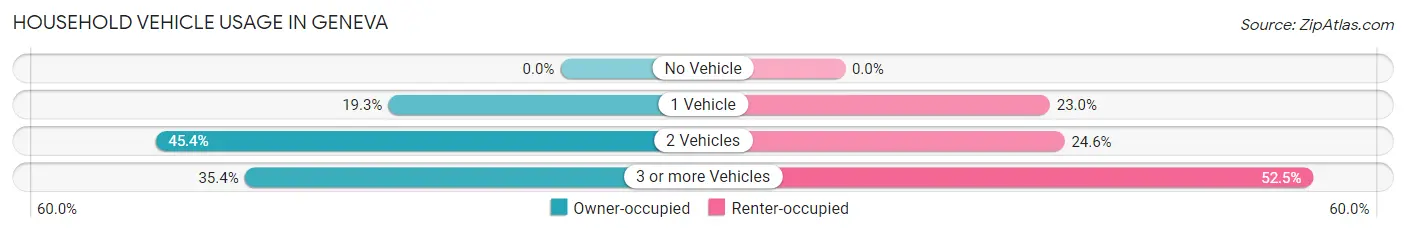
| Vehicles per Household | Owner-occupied | Renter-occupied |
| No Vehicle | 0 (0.0%) | 0 (0.0%) |
| 1 Vehicle | 164 (19.3%) | 14 (23.0%) |
| 2 Vehicles | 386 (45.4%) | 15 (24.6%) |
| 3 or more Vehicles | 301 (35.4%) | 32 (52.5%) |
| Total | 851 (100.0%) | 61 (100.0%) |
Real Estate & Mortgages in Geneva
Real Estate and Mortgage Overview in Geneva
| Characteristic | Without Mortgage | With Mortgage |
| Housing Units | 317 | 534 |
| Median Property Value | $491,900 | $704,500 |
| Median Household Income | $137,582 | $190 |
| Monthly Housing Costs | $814 | $134 |
| Real Estate Taxes | $4,931 | $0 |
Property Value by Mortgage Status in Geneva
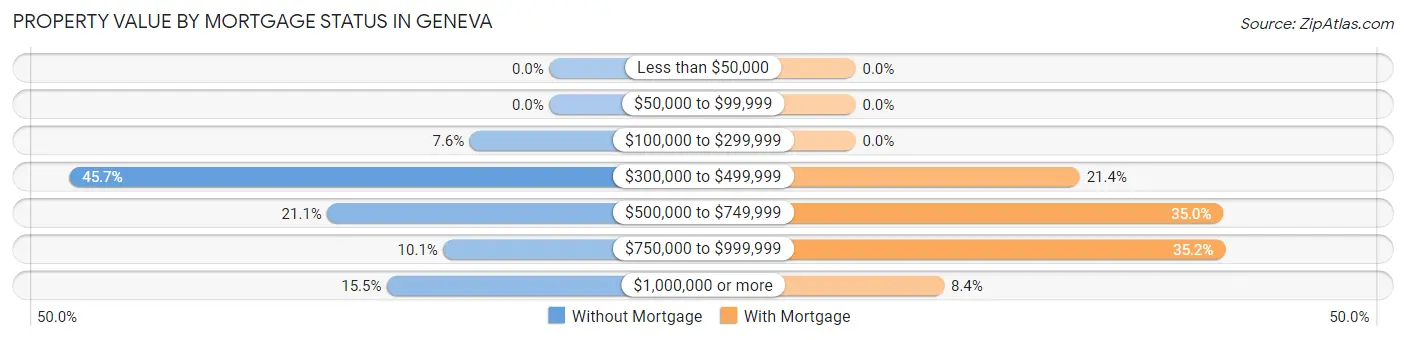
| Property Value | Without Mortgage | With Mortgage |
| Less than $50,000 | 0 (0.0%) | 0 (0.0%) |
| $50,000 to $99,999 | 0 (0.0%) | 0 (0.0%) |
| $100,000 to $299,999 | 24 (7.6%) | 0 (0.0%) |
| $300,000 to $499,999 | 145 (45.7%) | 114 (21.3%) |
| $500,000 to $749,999 | 67 (21.1%) | 187 (35.0%) |
| $750,000 to $999,999 | 32 (10.1%) | 188 (35.2%) |
| $1,000,000 or more | 49 (15.5%) | 45 (8.4%) |
| Total | 317 (100.0%) | 534 (100.0%) |
Household Income by Mortgage Status in Geneva
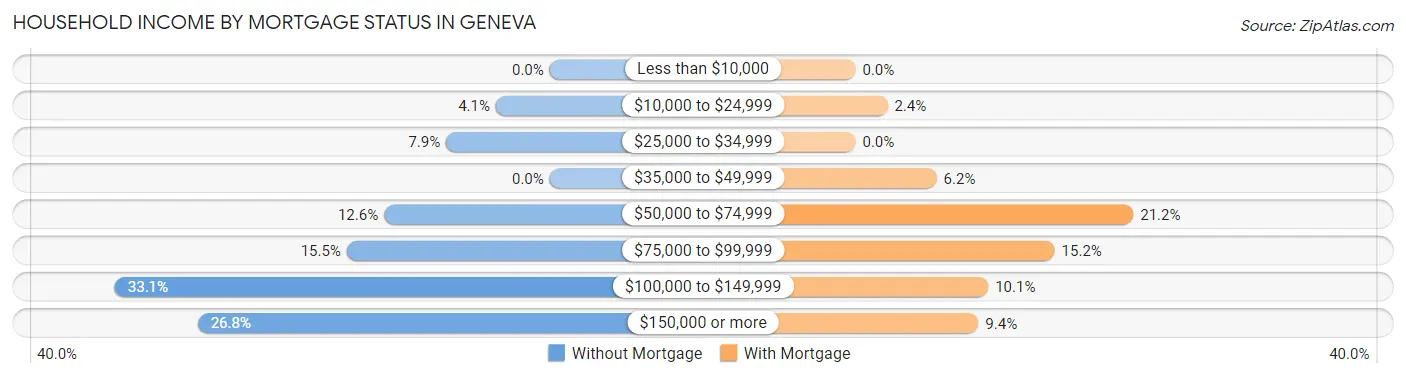
| Household Income | Without Mortgage | With Mortgage |
| Less than $10,000 | 0 (0.0%) | 0 (0.0%) |
| $10,000 to $24,999 | 13 (4.1%) | 13 (2.4%) |
| $25,000 to $34,999 | 25 (7.9%) | 0 (0.0%) |
| $35,000 to $49,999 | 0 (0.0%) | 33 (6.2%) |
| $50,000 to $74,999 | 40 (12.6%) | 113 (21.2%) |
| $75,000 to $99,999 | 49 (15.5%) | 81 (15.2%) |
| $100,000 to $149,999 | 105 (33.1%) | 54 (10.1%) |
| $150,000 or more | 85 (26.8%) | 50 (9.4%) |
| Total | 317 (100.0%) | 534 (100.0%) |
Property Value to Household Income Ratio in Geneva
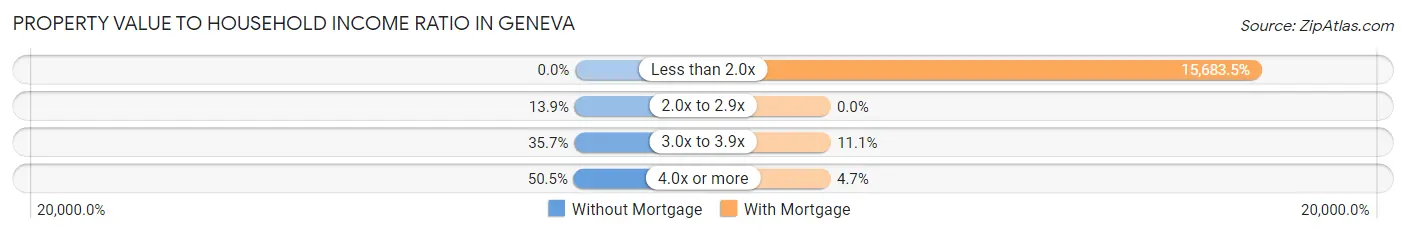
| Value-to-Income Ratio | Without Mortgage | With Mortgage |
| Less than 2.0x | 0 (0.0%) | 83,750 (15,683.5%) |
| 2.0x to 2.9x | 44 (13.9%) | 0 (0.0%) |
| 3.0x to 3.9x | 113 (35.6%) | 59 (11.1%) |
| 4.0x or more | 160 (50.5%) | 25 (4.7%) |
| Total | 317 (100.0%) | 534 (100.0%) |
Real Estate Taxes by Mortgage Status in Geneva
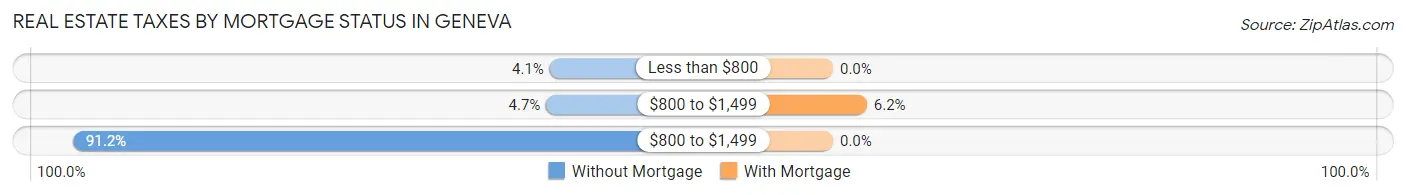
| Property Taxes | Without Mortgage | With Mortgage |
| Less than $800 | 13 (4.1%) | 0 (0.0%) |
| $800 to $1,499 | 15 (4.7%) | 33 (6.2%) |
| $800 to $1,499 | 289 (91.2%) | 0 (0.0%) |
| Total | 317 (100.0%) | 534 (100.0%) |
Health & Disability in Geneva
Health Insurance Coverage by Age in Geneva
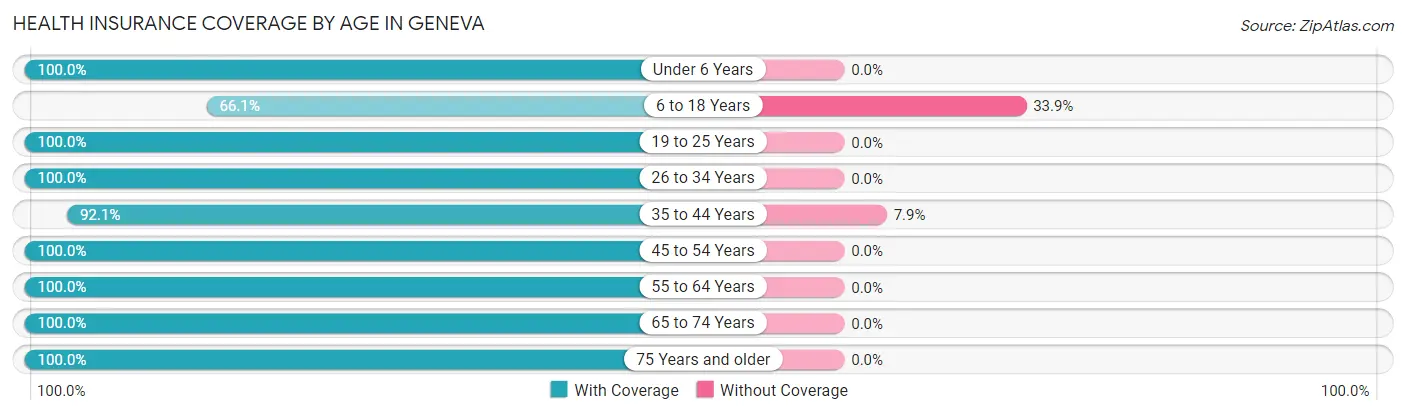
| Age Bracket | With Coverage | Without Coverage |
| Under 6 Years | 105 (100.0%) | 0 (0.0%) |
| 6 to 18 Years | 150 (66.1%) | 77 (33.9%) |
| 19 to 25 Years | 68 (100.0%) | 0 (0.0%) |
| 26 to 34 Years | 147 (100.0%) | 0 (0.0%) |
| 35 to 44 Years | 291 (92.1%) | 25 (7.9%) |
| 45 to 54 Years | 265 (100.0%) | 0 (0.0%) |
| 55 to 64 Years | 465 (100.0%) | 0 (0.0%) |
| 65 to 74 Years | 325 (100.0%) | 0 (0.0%) |
| 75 Years and older | 178 (100.0%) | 0 (0.0%) |
| Total | 1,994 (95.1%) | 102 (4.9%) |
Health Insurance Coverage by Citizenship Status in Geneva
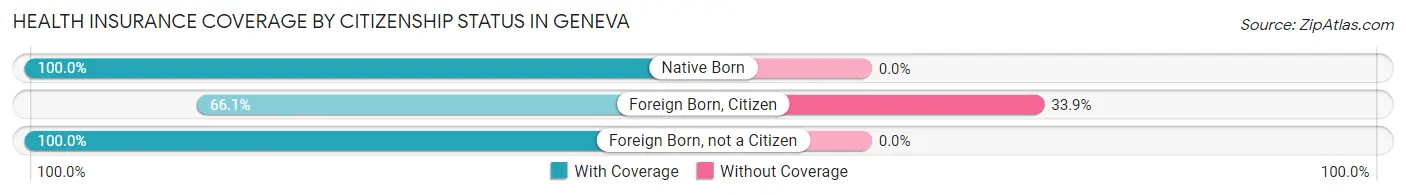
| Citizenship Status | With Coverage | Without Coverage |
| Native Born | 105 (100.0%) | 0 (0.0%) |
| Foreign Born, Citizen | 150 (66.1%) | 77 (33.9%) |
| Foreign Born, not a Citizen | 68 (100.0%) | 0 (0.0%) |
Health Insurance Coverage by Household Income in Geneva
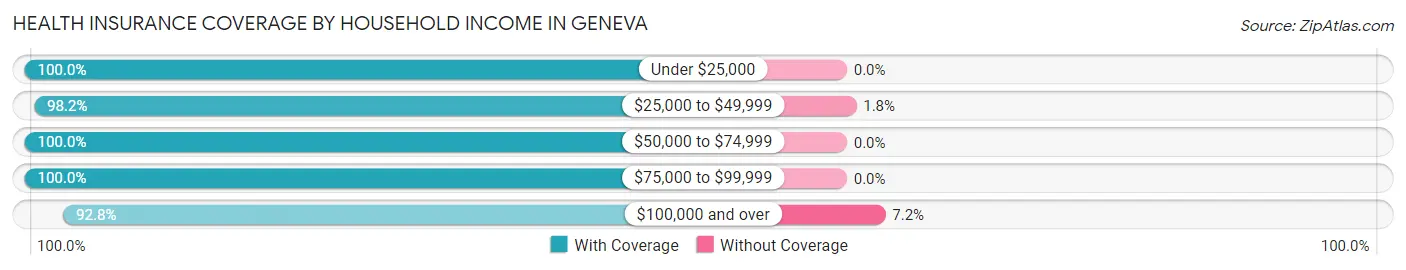
| Household Income | With Coverage | Without Coverage |
| Under $25,000 | 52 (100.0%) | 0 (0.0%) |
| $25,000 to $49,999 | 332 (98.2%) | 6 (1.8%) |
| $50,000 to $74,999 | 188 (100.0%) | 0 (0.0%) |
| $75,000 to $99,999 | 180 (100.0%) | 0 (0.0%) |
| $100,000 and over | 1,231 (92.8%) | 96 (7.2%) |
Public vs Private Health Insurance Coverage by Age in Geneva
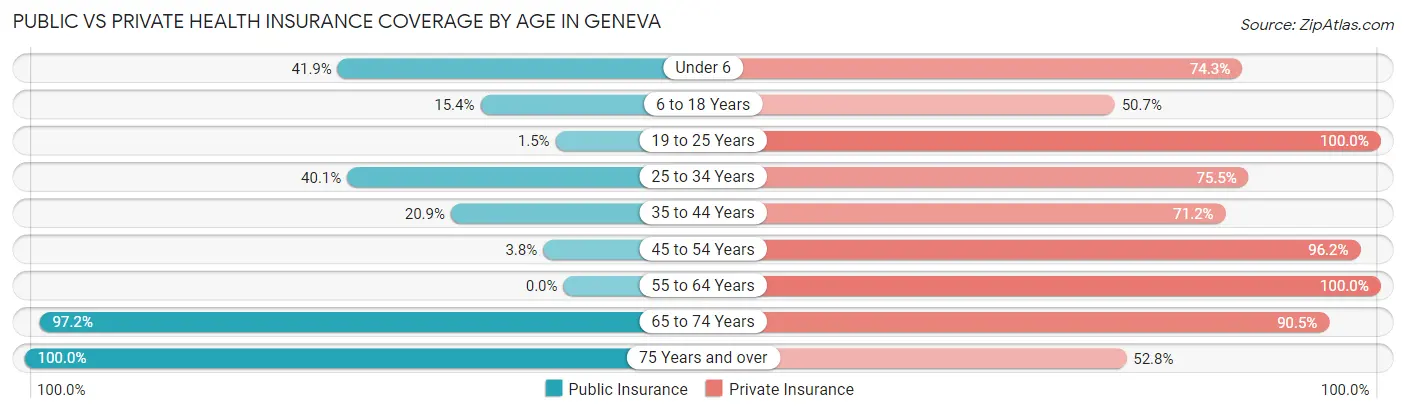
| Age Bracket | Public Insurance | Private Insurance |
| Under 6 | 44 (41.9%) | 78 (74.3%) |
| 6 to 18 Years | 35 (15.4%) | 115 (50.7%) |
| 19 to 25 Years | 1 (1.5%) | 68 (100.0%) |
| 25 to 34 Years | 59 (40.1%) | 111 (75.5%) |
| 35 to 44 Years | 66 (20.9%) | 225 (71.2%) |
| 45 to 54 Years | 10 (3.8%) | 255 (96.2%) |
| 55 to 64 Years | 0 (0.0%) | 465 (100.0%) |
| 65 to 74 Years | 316 (97.2%) | 294 (90.5%) |
| 75 Years and over | 178 (100.0%) | 94 (52.8%) |
| Total | 709 (33.8%) | 1,705 (81.4%) |
Disability Status by Sex by Age in Geneva
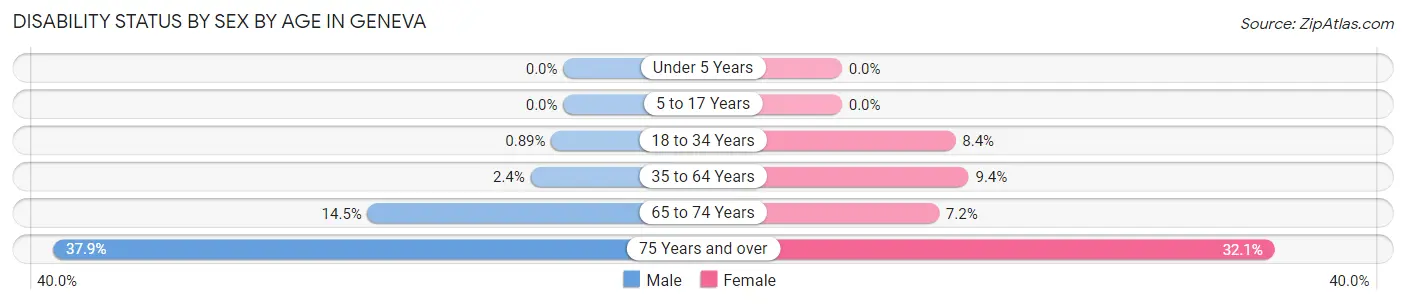
| Age Bracket | Male | Female |
| Under 5 Years | 0 (0.0%) | 0 (0.0%) |
| 5 to 17 Years | 0 (0.0%) | 0 (0.0%) |
| 18 to 34 Years | 1 (0.9%) | 15 (8.4%) |
| 35 to 64 Years | 13 (2.4%) | 48 (9.4%) |
| 65 to 74 Years | 17 (14.5%) | 15 (7.2%) |
| 75 Years and over | 25 (37.9%) | 36 (32.1%) |
Disability Class by Sex by Age in Geneva
Disability Class: Hearing Difficulty
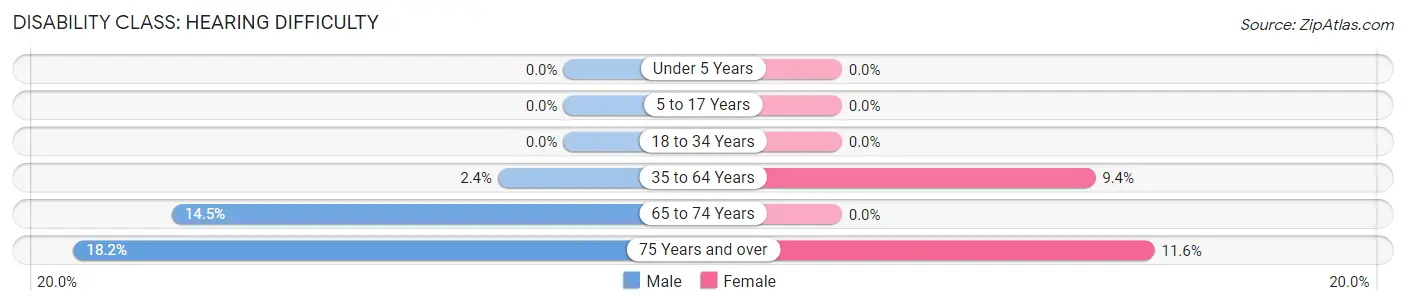
| Age Bracket | Male | Female |
| Under 5 Years | 0 (0.0%) | 0 (0.0%) |
| 5 to 17 Years | 0 (0.0%) | 0 (0.0%) |
| 18 to 34 Years | 0 (0.0%) | 0 (0.0%) |
| 35 to 64 Years | 13 (2.4%) | 48 (9.4%) |
| 65 to 74 Years | 17 (14.5%) | 0 (0.0%) |
| 75 Years and over | 12 (18.2%) | 13 (11.6%) |
Disability Class: Vision Difficulty
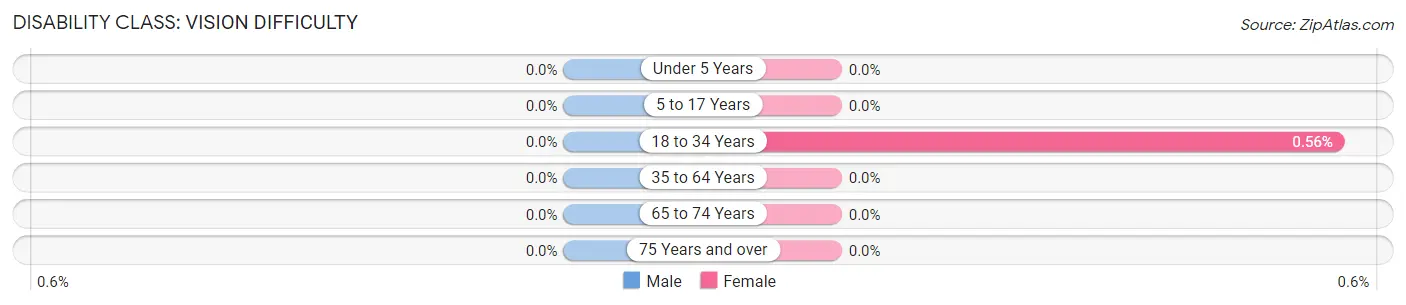
| Age Bracket | Male | Female |
| Under 5 Years | 0 (0.0%) | 0 (0.0%) |
| 5 to 17 Years | 0 (0.0%) | 0 (0.0%) |
| 18 to 34 Years | 0 (0.0%) | 1 (0.6%) |
| 35 to 64 Years | 0 (0.0%) | 0 (0.0%) |
| 65 to 74 Years | 0 (0.0%) | 0 (0.0%) |
| 75 Years and over | 0 (0.0%) | 0 (0.0%) |
Disability Class: Cognitive Difficulty
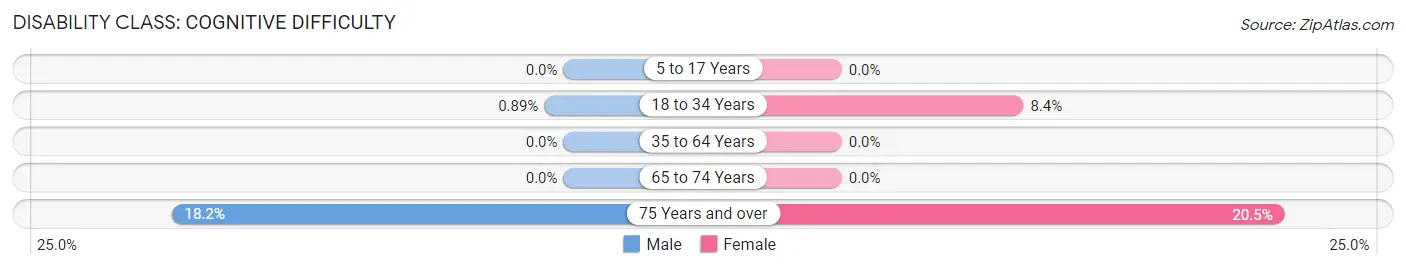
| Age Bracket | Male | Female |
| 5 to 17 Years | 0 (0.0%) | 0 (0.0%) |
| 18 to 34 Years | 1 (0.9%) | 15 (8.4%) |
| 35 to 64 Years | 0 (0.0%) | 0 (0.0%) |
| 65 to 74 Years | 0 (0.0%) | 0 (0.0%) |
| 75 Years and over | 12 (18.2%) | 23 (20.5%) |
Disability Class: Ambulatory Difficulty
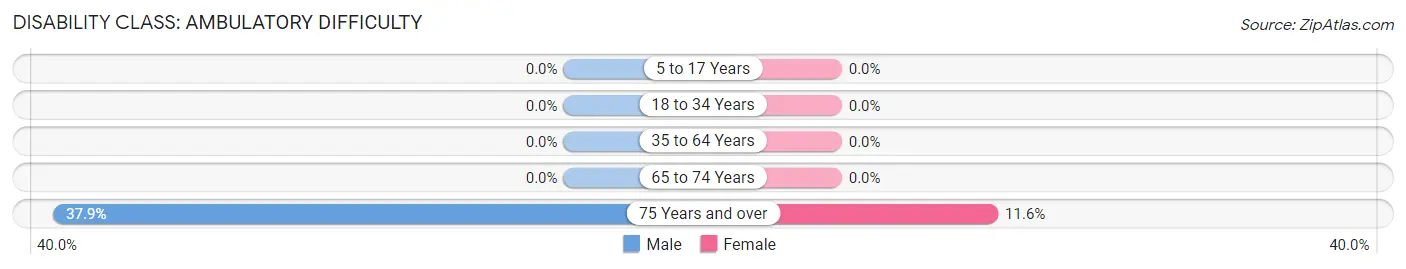
| Age Bracket | Male | Female |
| 5 to 17 Years | 0 (0.0%) | 0 (0.0%) |
| 18 to 34 Years | 0 (0.0%) | 0 (0.0%) |
| 35 to 64 Years | 0 (0.0%) | 0 (0.0%) |
| 65 to 74 Years | 0 (0.0%) | 0 (0.0%) |
| 75 Years and over | 25 (37.9%) | 13 (11.6%) |
Disability Class: Self-Care Difficulty
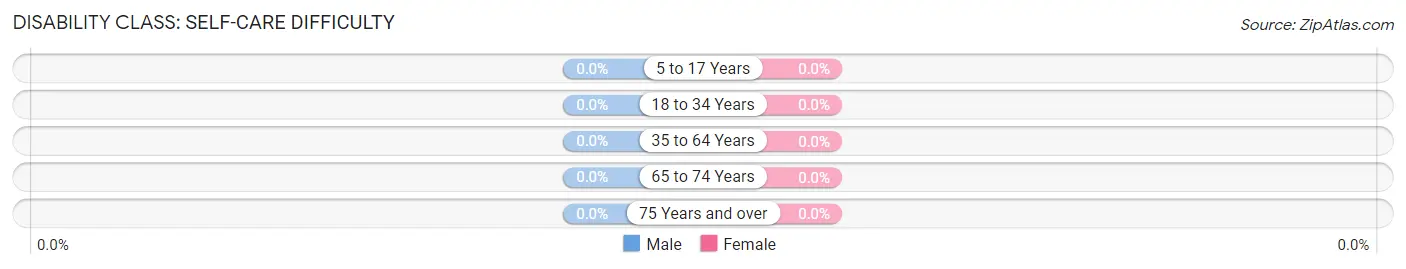
| Age Bracket | Male | Female |
| 5 to 17 Years | 0 (0.0%) | 0 (0.0%) |
| 18 to 34 Years | 0 (0.0%) | 0 (0.0%) |
| 35 to 64 Years | 0 (0.0%) | 0 (0.0%) |
| 65 to 74 Years | 0 (0.0%) | 0 (0.0%) |
| 75 Years and over | 0 (0.0%) | 0 (0.0%) |
Technology Access in Geneva
Computing Device Access in Geneva
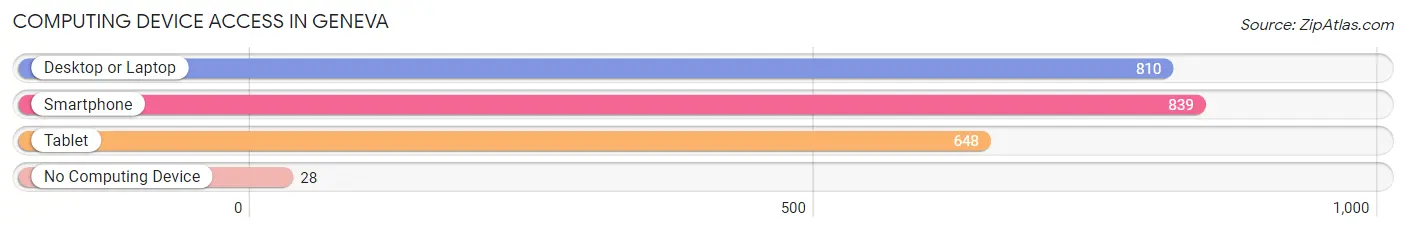
| Device Type | # Households | % Households |
| Desktop or Laptop | 810 | 88.8% |
| Smartphone | 839 | 92.0% |
| Tablet | 648 | 71.1% |
| No Computing Device | 28 | 3.1% |
| Total | 912 | 100.0% |
Internet Access in Geneva
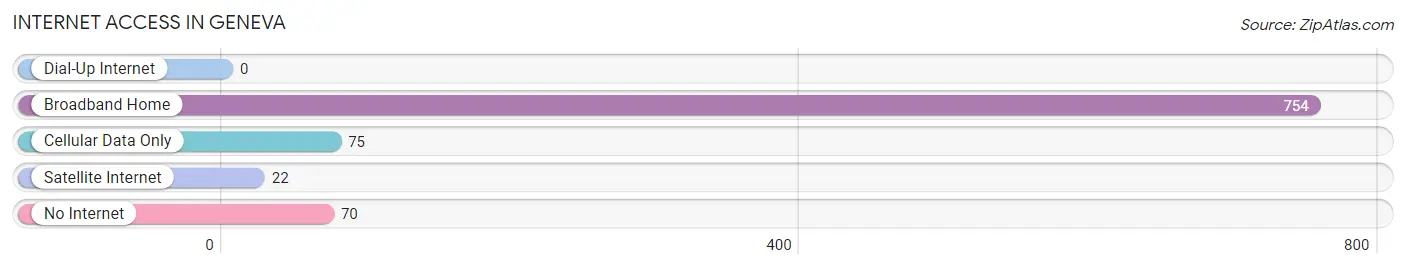
| Internet Type | # Households | % Households |
| Dial-Up Internet | 0 | 0.0% |
| Broadband Home | 754 | 82.7% |
| Cellular Data Only | 75 | 8.2% |
| Satellite Internet | 22 | 2.4% |
| No Internet | 70 | 7.7% |
| Total | 912 | 100.0% |
Geneva Summary
Geneva is a small town located in the state of Washington, United States. It is situated in the northwest corner of the state, near the border with Canada. The town is located in the Okanogan County, and is part of the Okanogan-Wenatchee National Forest. The town has a population of approximately 1,000 people, and is a popular tourist destination due to its proximity to the Cascade Mountains and the Columbia River.
Geography
Geneva is located in the northwest corner of Washington, near the border with Canada. The town is situated in the Okanogan County, and is part of the Okanogan-Wenatchee National Forest. The town is surrounded by mountains, and is located at the confluence of the Columbia and Okanogan Rivers. The town is located at an elevation of 1,890 feet, and has a total area of 0.7 square miles.
Climate
Geneva has a semi-arid climate, with hot summers and cold winters. The average temperature in the summer is around 75°F, and the average temperature in the winter is around 25°F. The town receives an average of 16 inches of precipitation per year, with most of it falling in the winter months.
Economy
Geneva’s economy is largely based on tourism and agriculture. The town is a popular destination for outdoor recreation, and is home to several wineries and vineyards. The town is also home to several small businesses, including restaurants, shops, and lodging. The town is also home to a small airport, which serves as a hub for air travel in the region.
Demographics
As of the 2010 census, Geneva had a population of 1,000 people. The racial makeup of the town was 94.2% White, 0.7% African American, 0.7% Native American, 0.7% Asian, 0.3% Pacific Islander, and 2.7% from other races. The median household income in the town was $37,500, and the median age was 44.
Conclusion
Geneva is a small town located in the northwest corner of Washington, near the border with Canada. The town is situated in the Okanogan County, and is part of the Okanogan-Wenatchee National Forest. The town has a population of approximately 1,000 people, and is a popular tourist destination due to its proximity to the Cascade Mountains and the Columbia River. The town’s economy is largely based on tourism and agriculture, and the town is home to several small businesses, including restaurants, shops, and lodging. The town has a semi-arid climate, with hot summers and cold winters. As of the 2010 census, Geneva had a population of 1,000 people, with a median household income of $37,500 and a median age of 44.
Common Questions
What is Per Capita Income in Geneva?
Per Capita income in Geneva is $52,963.
What is the Median Family Income in Geneva?
Median Family Income in Geneva is $137,615.
What is the Median Household income in Geneva?
Median Household Income in Geneva is $102,386.
What is Income or Wage Gap in Geneva?
Income or Wage Gap in Geneva is 23.5%.
Women in Geneva earn 76.5 cents for every dollar earned by a man.
What is Inequality or Gini Index in Geneva?
Inequality or Gini Index in Geneva is 0.37.
What is the Total Population of Geneva?
Total Population of Geneva is 2,096.
What is the Total Male Population of Geneva?
Total Male Population of Geneva is 980.
What is the Total Female Population of Geneva?
Total Female Population of Geneva is 1,116.
What is the Ratio of Males per 100 Females in Geneva?
There are 87.81 Males per 100 Females in Geneva.
What is the Ratio of Females per 100 Males in Geneva?
There are 113.88 Females per 100 Males in Geneva.
What is the Median Population Age in Geneva?
Median Population Age in Geneva is 51.8 Years.
What is the Average Family Size in Geneva
Average Family Size in Geneva is 2.5 People.
What is the Average Household Size in Geneva
Average Household Size in Geneva is 2.3 People.
How Large is the Labor Force in Geneva?
There are 1,205 People in the Labor Forcein in Geneva.
What is the Percentage of People in the Labor Force in Geneva?
65.3% of People are in the Labor Force in Geneva.
What is the Unemployment Rate in Geneva?
Unemployment Rate in Geneva is 11.1%.