Lakeland South, WA Map & Demographics
Lakeland South Map
Lakeland South Overview
$43,772
PER CAPITA INCOME
$109,082
AVG FAMILY INCOME
$100,938
AVG HOUSEHOLD INCOME
28.8%
WAGE / INCOME GAP [ % ]
71.2¢/ $1
WAGE / INCOME GAP [ $ ]
$12,704
FAMILY INCOME DEFICIT
0.38
INEQUALITY / GINI INDEX
12,606
TOTAL POPULATION
6,780
MALE POPULATION
5,826
FEMALE POPULATION
116.37
MALES / 100 FEMALES
85.93
FEMALES / 100 MALES
40.9
MEDIAN AGE
3.3
AVG FAMILY SIZE
2.8
AVG HOUSEHOLD SIZE
6,790
LABOR FORCE [ PEOPLE ]
66.1%
PERCENT IN LABOR FORCE
6.2%
UNEMPLOYMENT RATE
Income in Lakeland South
Income Overview in Lakeland South
Per Capita Income in Lakeland South is $43,772, while median incomes of families and households are $109,082 and $100,938 respectively.
| Characteristic | Number | Measure |
| Per Capita Income | 12,606 | $43,772 |
| Median Family Income | 3,197 | $109,082 |
| Mean Family Income | 3,197 | $135,733 |
| Median Household Income | 4,433 | $100,938 |
| Mean Household Income | 4,433 | $121,830 |
| Income Deficit | 3,197 | $12,704 |
| Wage / Income Gap (%) | 12,606 | 28.80% |
| Wage / Income Gap ($) | 12,606 | 71.20¢ per $1 |
| Gini / Inequality Index | 12,606 | 0.38 |
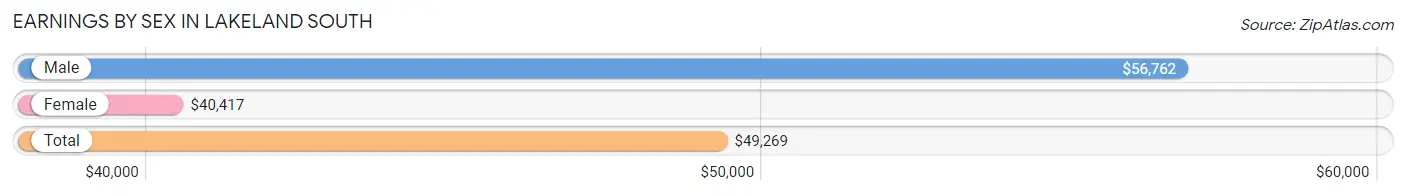
Earnings by Sex in Lakeland South
Average Earnings in Lakeland South are $49,269, $56,762 for men and $40,417 for women, a difference of 28.8%.
| Sex | Number | Average Earnings |
| Male | 3,921 (56.6%) | $56,762 |
| Female | 3,012 (43.4%) | $40,417 |
| Total | 6,933 (100.0%) | $49,269 |
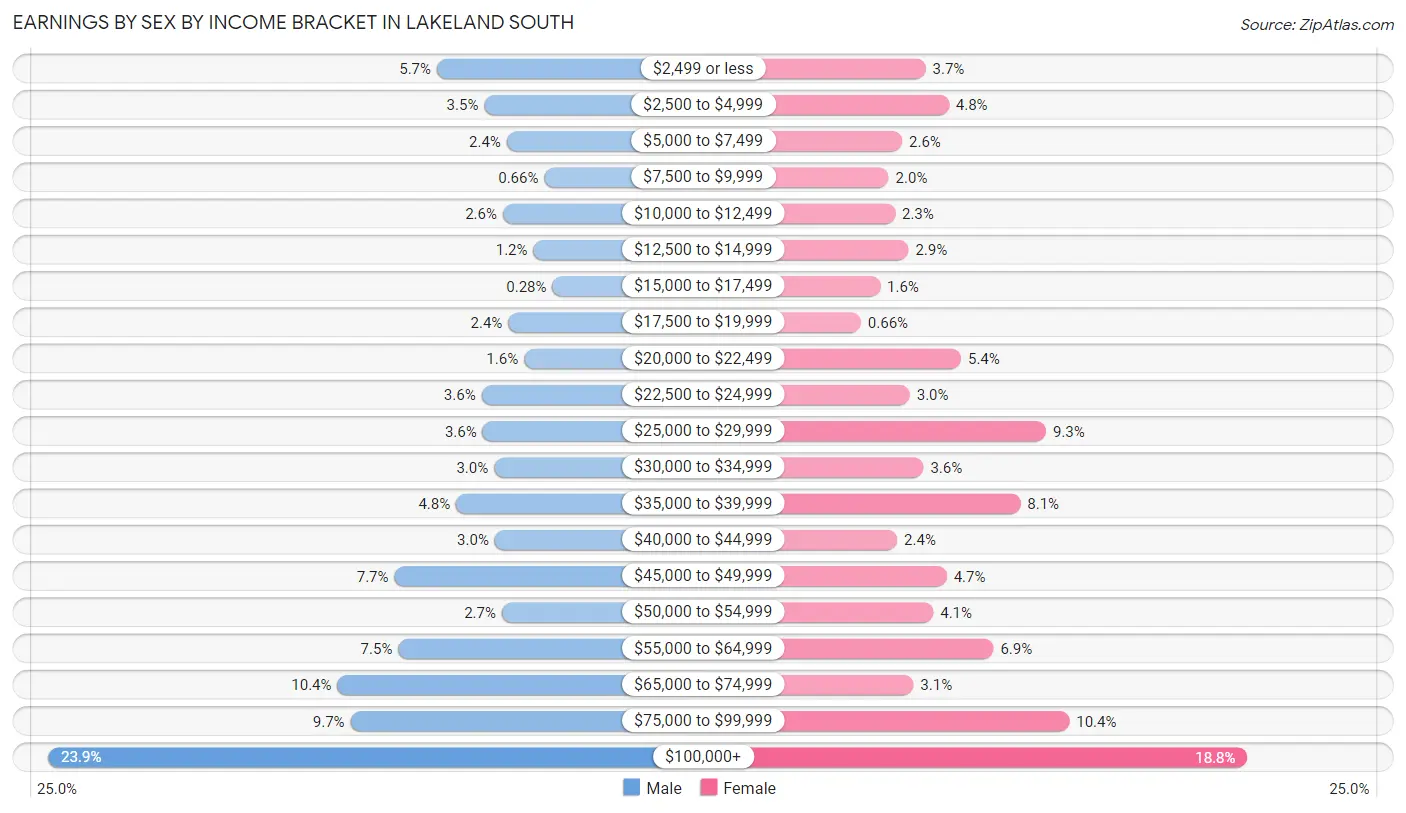
Earnings by Sex by Income Bracket in Lakeland South
The most common earnings brackets in Lakeland South are $100,000+ for men (937 | 23.9%) and $100,000+ for women (565 | 18.8%).
| Income | Male | Female |
| $2,499 or less | 223 (5.7%) | 111 (3.7%) |
| $2,500 to $4,999 | 136 (3.5%) | 144 (4.8%) |
| $5,000 to $7,499 | 95 (2.4%) | 78 (2.6%) |
| $7,500 to $9,999 | 26 (0.7%) | 59 (2.0%) |
| $10,000 to $12,499 | 102 (2.6%) | 68 (2.3%) |
| $12,500 to $14,999 | 46 (1.2%) | 87 (2.9%) |
| $15,000 to $17,499 | 11 (0.3%) | 47 (1.6%) |
| $17,500 to $19,999 | 92 (2.4%) | 20 (0.7%) |
| $20,000 to $22,499 | 63 (1.6%) | 161 (5.3%) |
| $22,500 to $24,999 | 141 (3.6%) | 89 (2.9%) |
| $25,000 to $29,999 | 139 (3.5%) | 281 (9.3%) |
| $30,000 to $34,999 | 118 (3.0%) | 108 (3.6%) |
| $35,000 to $39,999 | 188 (4.8%) | 245 (8.1%) |
| $40,000 to $44,999 | 117 (3.0%) | 71 (2.4%) |
| $45,000 to $49,999 | 301 (7.7%) | 141 (4.7%) |
| $50,000 to $54,999 | 104 (2.6%) | 122 (4.1%) |
| $55,000 to $64,999 | 294 (7.5%) | 207 (6.9%) |
| $65,000 to $74,999 | 406 (10.3%) | 94 (3.1%) |
| $75,000 to $99,999 | 382 (9.7%) | 314 (10.4%) |
| $100,000+ | 937 (23.9%) | 565 (18.8%) |
| Total | 3,921 (100.0%) | 3,012 (100.0%) |
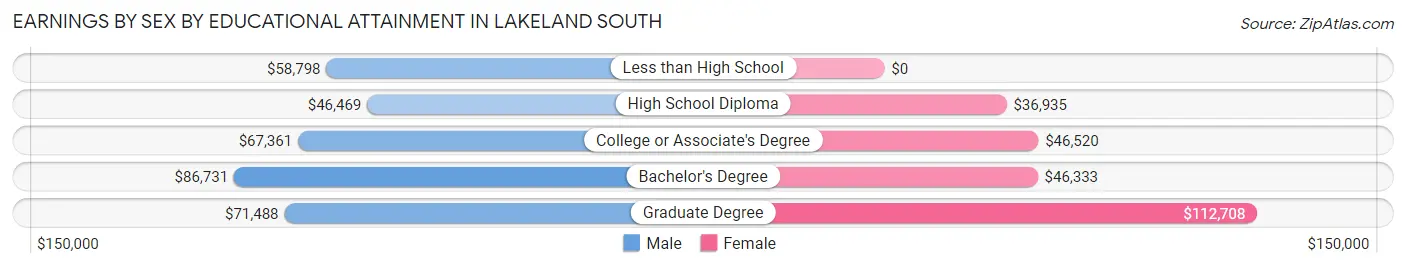
Earnings by Sex by Educational Attainment in Lakeland South
Average earnings in Lakeland South are $65,370 for men and $48,125 for women, a difference of 26.4%. Men with an educational attainment of bachelor's degree enjoy the highest average annual earnings of $86,731, while those with high school diploma education earn the least with $46,469. Women with an educational attainment of graduate degree earn the most with the average annual earnings of $112,708, while those with high school diploma education have the smallest earnings of $36,935.
| Educational Attainment | Male Income | Female Income |
| Less than High School | $58,798 | $0 |
| High School Diploma | $46,469 | $36,935 |
| College or Associate's Degree | $67,361 | $46,520 |
| Bachelor's Degree | $86,731 | $46,333 |
| Graduate Degree | $71,488 | $112,708 |
| Total | $65,370 | $48,125 |
Family Income in Lakeland South
Family Income Brackets in Lakeland South
According to the Lakeland South family income data, there are 770 families falling into the $100,000 to $149,999 income range, which is the most common income bracket and makes up 24.1% of all families. Conversely, the $10,000 to $14,999 income bracket is the least frequent group with only 19 families (0.6%) belonging to this category.
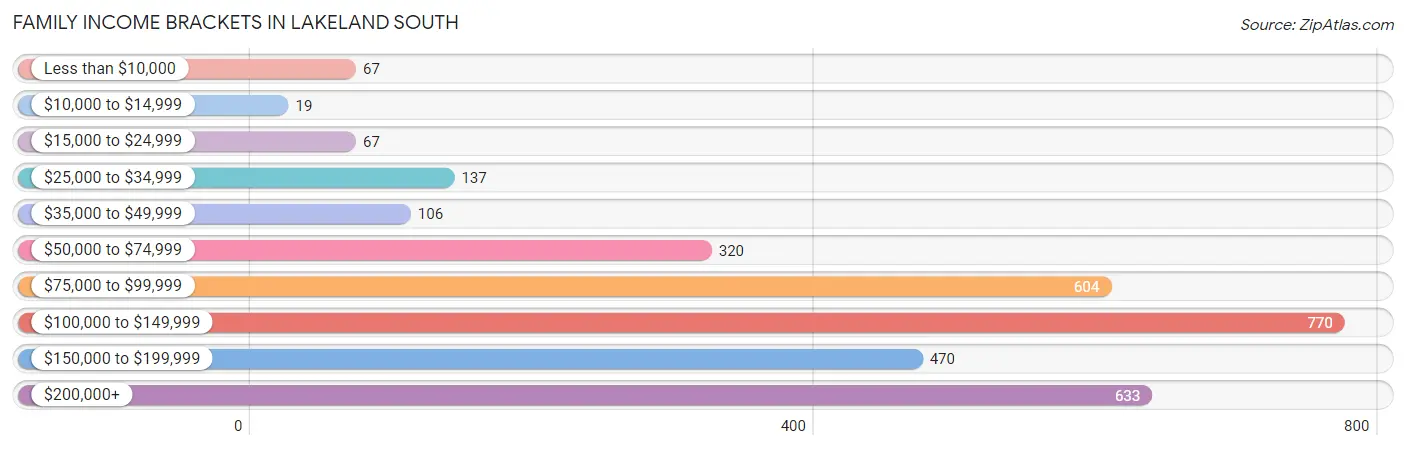
| Income Bracket | # Families | % Families |
| Less than $10,000 | 67 | 2.1% |
| $10,000 to $14,999 | 19 | 0.6% |
| $15,000 to $24,999 | 67 | 2.1% |
| $25,000 to $34,999 | 137 | 4.3% |
| $35,000 to $49,999 | 106 | 3.3% |
| $50,000 to $74,999 | 320 | 10.0% |
| $75,000 to $99,999 | 604 | 18.9% |
| $100,000 to $149,999 | 770 | 24.1% |
| $150,000 to $199,999 | 470 | 14.7% |
| $200,000+ | 633 | 19.8% |
Family Income by Famaliy Size in Lakeland South
4-person families (653 | 20.4%) account for the highest median family income in Lakeland South with $136,597 per family, while 2-person families (1,373 | 42.9%) have the highest median income of $48,278 per family member.
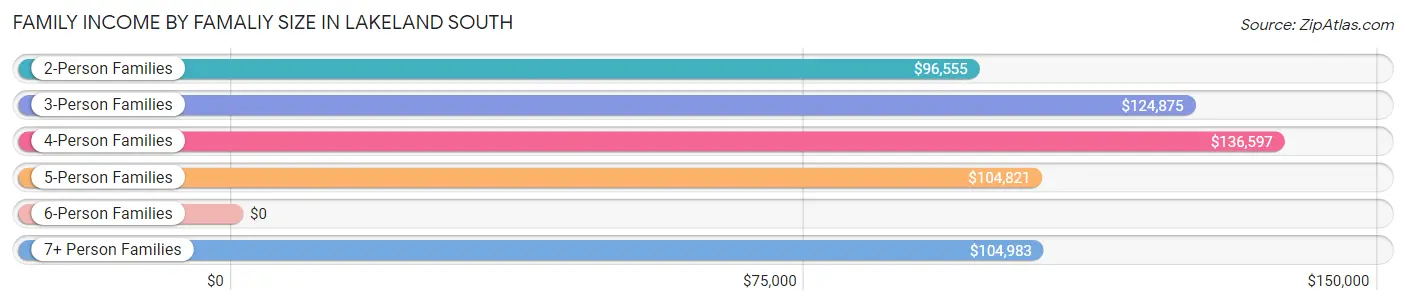
| Income Bracket | # Families | Median Income |
| 2-Person Families | 1,373 (42.9%) | $96,555 |
| 3-Person Families | 764 (23.9%) | $124,875 |
| 4-Person Families | 653 (20.4%) | $136,597 |
| 5-Person Families | 240 (7.5%) | $104,821 |
| 6-Person Families | 0 (0.0%) | $0 |
| 7+ Person Families | 167 (5.2%) | $104,983 |
| Total | 3,197 (100.0%) | $109,082 |
Family Income by Number of Earners in Lakeland South
The median family income in Lakeland South is $109,082, with families comprising 3+ earners (515) having the highest median family income of $163,073, while families with no earners (382) have the lowest median family income of $66,389, accounting for 16.1% and 11.9% of families, respectively.
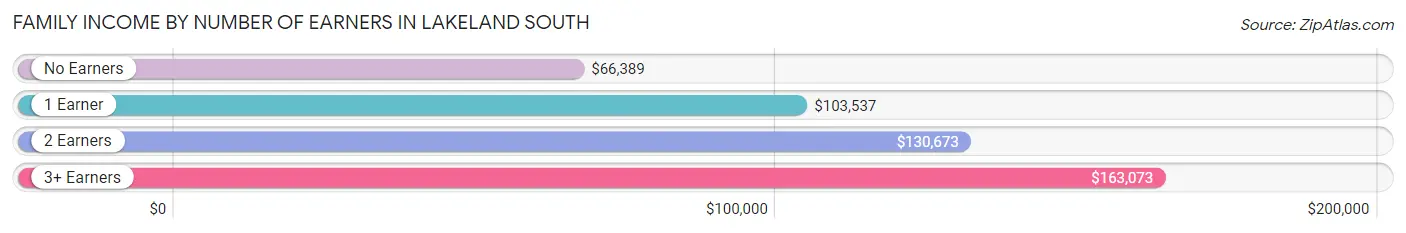
| Number of Earners | # Families | Median Income |
| No Earners | 382 (11.9%) | $66,389 |
| 1 Earner | 943 (29.5%) | $103,537 |
| 2 Earners | 1,357 (42.4%) | $130,673 |
| 3+ Earners | 515 (16.1%) | $163,073 |
| Total | 3,197 (100.0%) | $109,082 |
Household Income in Lakeland South
Household Income Brackets in Lakeland South
With 926 households falling in the category, the $100,000 to $149,999 income range is the most frequent in Lakeland South, accounting for 20.9% of all households. In contrast, only 53 households (1.2%) fall into the $10,000 to $14,999 income bracket, making it the least populous group.
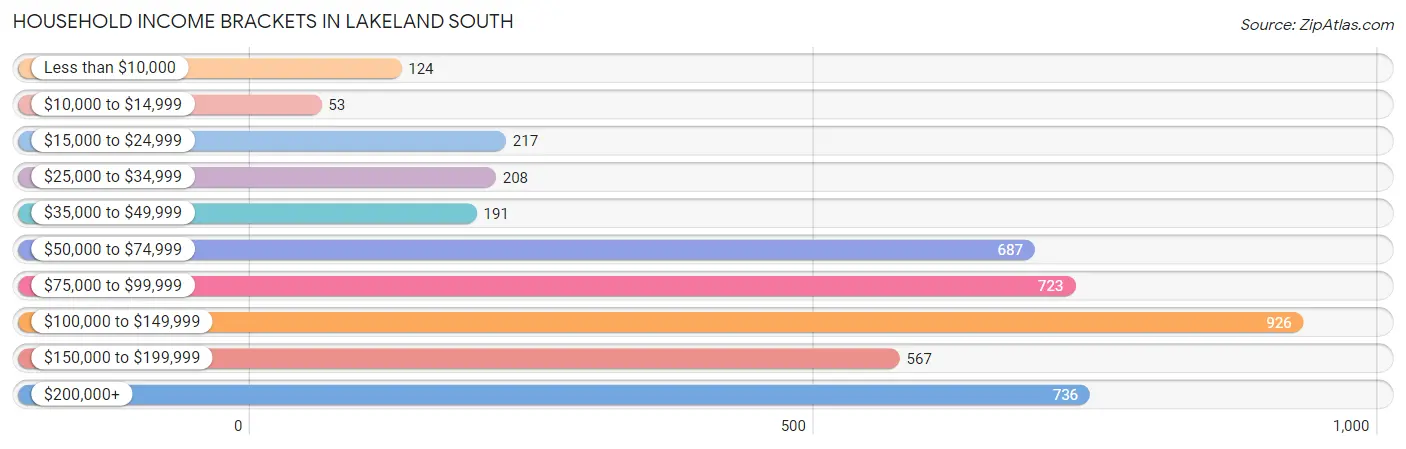
| Income Bracket | # Households | % Households |
| Less than $10,000 | 124 | 2.8% |
| $10,000 to $14,999 | 53 | 1.2% |
| $15,000 to $24,999 | 217 | 4.9% |
| $25,000 to $34,999 | 208 | 4.7% |
| $35,000 to $49,999 | 191 | 4.3% |
| $50,000 to $74,999 | 687 | 15.5% |
| $75,000 to $99,999 | 723 | 16.3% |
| $100,000 to $149,999 | 926 | 20.9% |
| $150,000 to $199,999 | 567 | 12.8% |
| $200,000+ | 736 | 16.6% |
Household Income by Householder Age in Lakeland South
The median household income in Lakeland South is $100,938, with the highest median household income of $123,730 found in the 45 to 64 years age bracket for the primary householder. A total of 1,924 households (43.4%) fall into this category. Meanwhile, the 15 to 24 years age bracket for the primary householder has the lowest median household income of $0, with 13 households (0.3%) in this group.
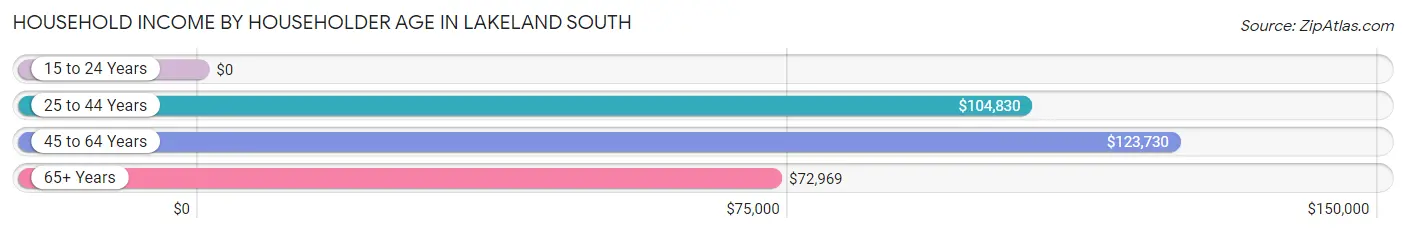
| Income Bracket | # Households | Median Income |
| 15 to 24 Years | 13 (0.3%) | $0 |
| 25 to 44 Years | 1,390 (31.4%) | $104,830 |
| 45 to 64 Years | 1,924 (43.4%) | $123,730 |
| 65+ Years | 1,106 (24.9%) | $72,969 |
| Total | 4,433 (100.0%) | $100,938 |
Poverty in Lakeland South
Income Below Poverty by Sex and Age in Lakeland South
With 4.8% poverty level for males and 8.1% for females among the residents of Lakeland South, under 5 year old males and under 5 year old females are the most vulnerable to poverty, with 110 males (28.3%) and 52 females (27.5%) in their respective age groups living below the poverty level.
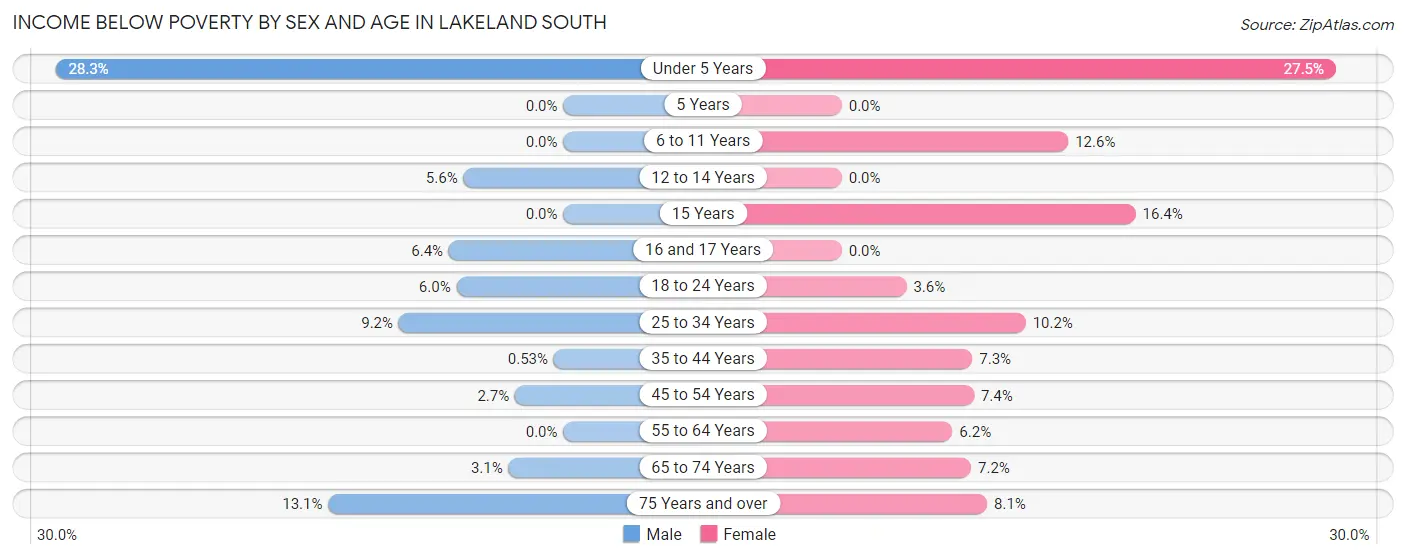
| Age Bracket | Male | Female |
| Under 5 Years | 110 (28.3%) | 52 (27.5%) |
| 5 Years | 0 (0.0%) | 0 (0.0%) |
| 6 to 11 Years | 0 (0.0%) | 45 (12.6%) |
| 12 to 14 Years | 12 (5.6%) | 0 (0.0%) |
| 15 Years | 0 (0.0%) | 18 (16.4%) |
| 16 and 17 Years | 10 (6.4%) | 0 (0.0%) |
| 18 to 24 Years | 36 (5.9%) | 16 (3.6%) |
| 25 to 34 Years | 69 (9.2%) | 108 (10.2%) |
| 35 to 44 Years | 5 (0.5%) | 48 (7.3%) |
| 45 to 54 Years | 18 (2.7%) | 47 (7.4%) |
| 55 to 64 Years | 0 (0.0%) | 75 (6.2%) |
| 65 to 74 Years | 24 (3.0%) | 29 (7.2%) |
| 75 Years and over | 36 (13.1%) | 31 (8.1%) |
| Total | 320 (4.8%) | 469 (8.1%) |
Income Above Poverty by Sex and Age in Lakeland South
According to the poverty statistics in Lakeland South, males aged 5 years and females aged 5 years are the age groups that are most secure financially, with 100.0% of males and 100.0% of females in these age groups living above the poverty line.
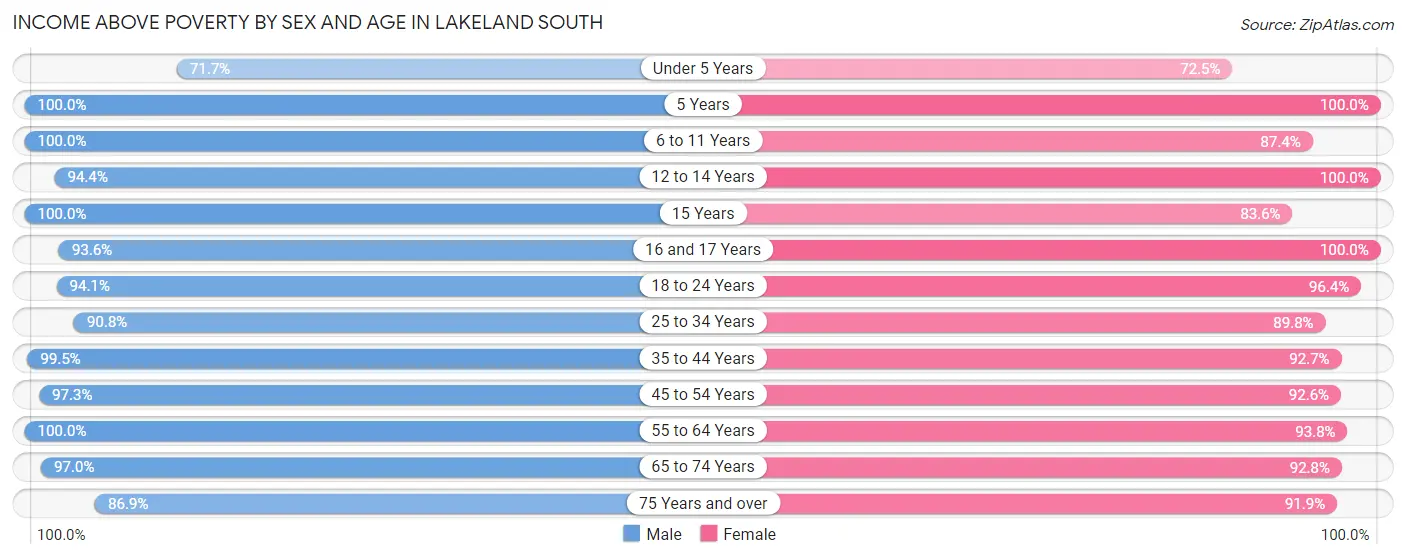
| Age Bracket | Male | Female |
| Under 5 Years | 279 (71.7%) | 137 (72.5%) |
| 5 Years | 54 (100.0%) | 106 (100.0%) |
| 6 to 11 Years | 722 (100.0%) | 312 (87.4%) |
| 12 to 14 Years | 204 (94.4%) | 73 (100.0%) |
| 15 Years | 39 (100.0%) | 92 (83.6%) |
| 16 and 17 Years | 147 (93.6%) | 143 (100.0%) |
| 18 to 24 Years | 569 (94.1%) | 428 (96.4%) |
| 25 to 34 Years | 684 (90.8%) | 947 (89.8%) |
| 35 to 44 Years | 937 (99.5%) | 612 (92.7%) |
| 45 to 54 Years | 652 (97.3%) | 592 (92.6%) |
| 55 to 64 Years | 1,133 (100.0%) | 1,142 (93.8%) |
| 65 to 74 Years | 763 (97.0%) | 374 (92.8%) |
| 75 Years and over | 239 (86.9%) | 352 (91.9%) |
| Total | 6,422 (95.3%) | 5,310 (91.9%) |
Income Below Poverty Among Married-Couple Families in Lakeland South
The poverty statistics for married-couple families in Lakeland South show that 3.0% or 79 of the total 2,634 families live below the poverty line. Families with 1 or 2 children have the highest poverty rate of 7.7%, comprising of 53 families. On the other hand, families with 3 or 4 children have the lowest poverty rate of 0.0%, which includes 0 families.
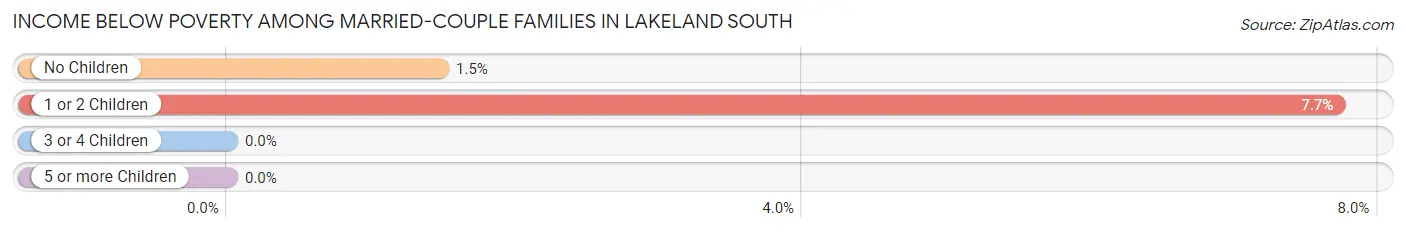
| Children | Above Poverty | Below Poverty |
| No Children | 1,737 (98.5%) | 26 (1.5%) |
| 1 or 2 Children | 634 (92.3%) | 53 (7.7%) |
| 3 or 4 Children | 100 (100.0%) | 0 (0.0%) |
| 5 or more Children | 84 (100.0%) | 0 (0.0%) |
| Total | 2,555 (97.0%) | 79 (3.0%) |
Income Below Poverty Among Single-Parent Households in Lakeland South
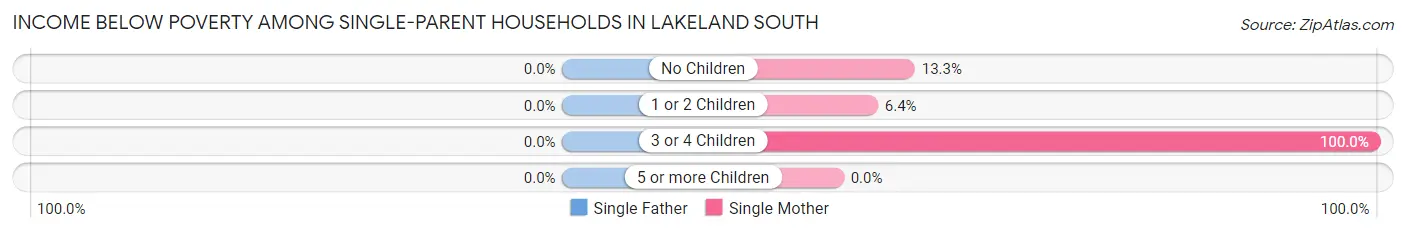
| Children | Single Father | Single Mother |
| No Children | 0 (0.0%) | 20 (13.3%) |
| 1 or 2 Children | 0 (0.0%) | 10 (6.4%) |
| 3 or 4 Children | 0 (0.0%) | 50 (100.0%) |
| 5 or more Children | 0 (0.0%) | 0 (0.0%) |
| Total | 0 (0.0%) | 80 (22.4%) |
Income Below Poverty Among Married-Couple vs Single-Parent Households in Lakeland South
The poverty data for Lakeland South shows that 79 of the married-couple family households (3.0%) and 80 of the single-parent households (14.2%) are living below the poverty level. Within the married-couple family households, those with 1 or 2 children have the highest poverty rate, with 53 households (7.7%) falling below the poverty line. Among the single-parent households, those with 3 or 4 children have the highest poverty rate, with 50 household (100.0%) living below poverty.
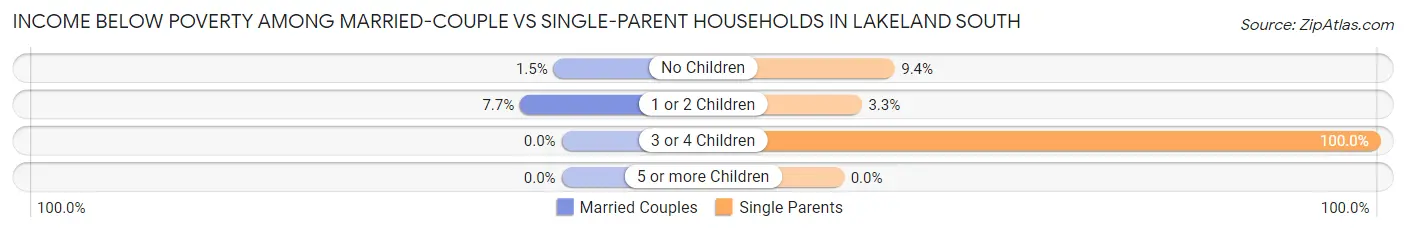
| Children | Married-Couple Families | Single-Parent Households |
| No Children | 26 (1.5%) | 20 (9.4%) |
| 1 or 2 Children | 53 (7.7%) | 10 (3.3%) |
| 3 or 4 Children | 0 (0.0%) | 50 (100.0%) |
| 5 or more Children | 0 (0.0%) | 0 (0.0%) |
| Total | 79 (3.0%) | 80 (14.2%) |
Race in Lakeland South
The most populous races in Lakeland South are White / Caucasian (7,911 | 62.8%), Two or more Races (2,007 | 15.9%), and Hispanic or Latino (1,547 | 12.3%).
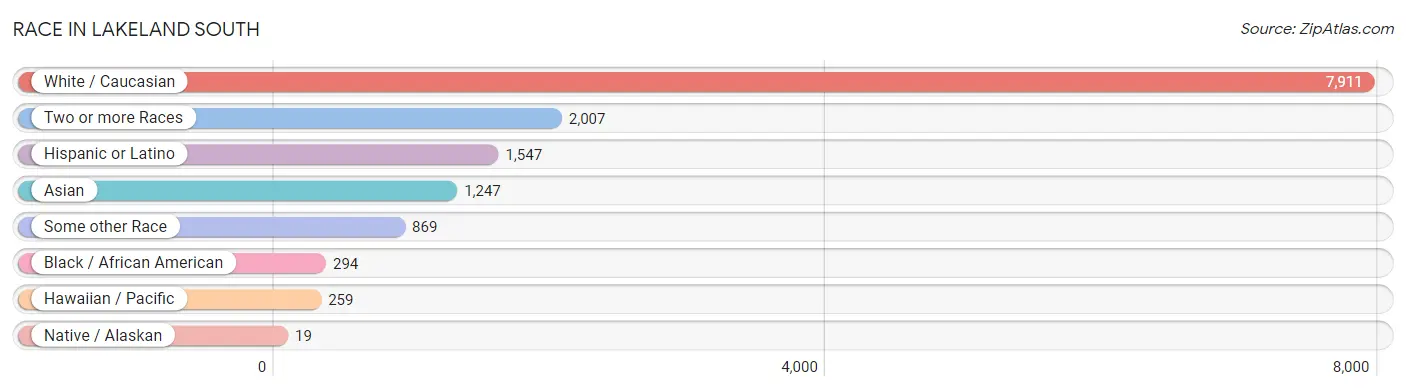
| Race | # Population | % Population |
| Asian | 1,247 | 9.9% |
| Black / African American | 294 | 2.3% |
| Hawaiian / Pacific | 259 | 2.1% |
| Hispanic or Latino | 1,547 | 12.3% |
| Native / Alaskan | 19 | 0.2% |
| White / Caucasian | 7,911 | 62.8% |
| Two or more Races | 2,007 | 15.9% |
| Some other Race | 869 | 6.9% |
| Total | 12,606 | 100.0% |
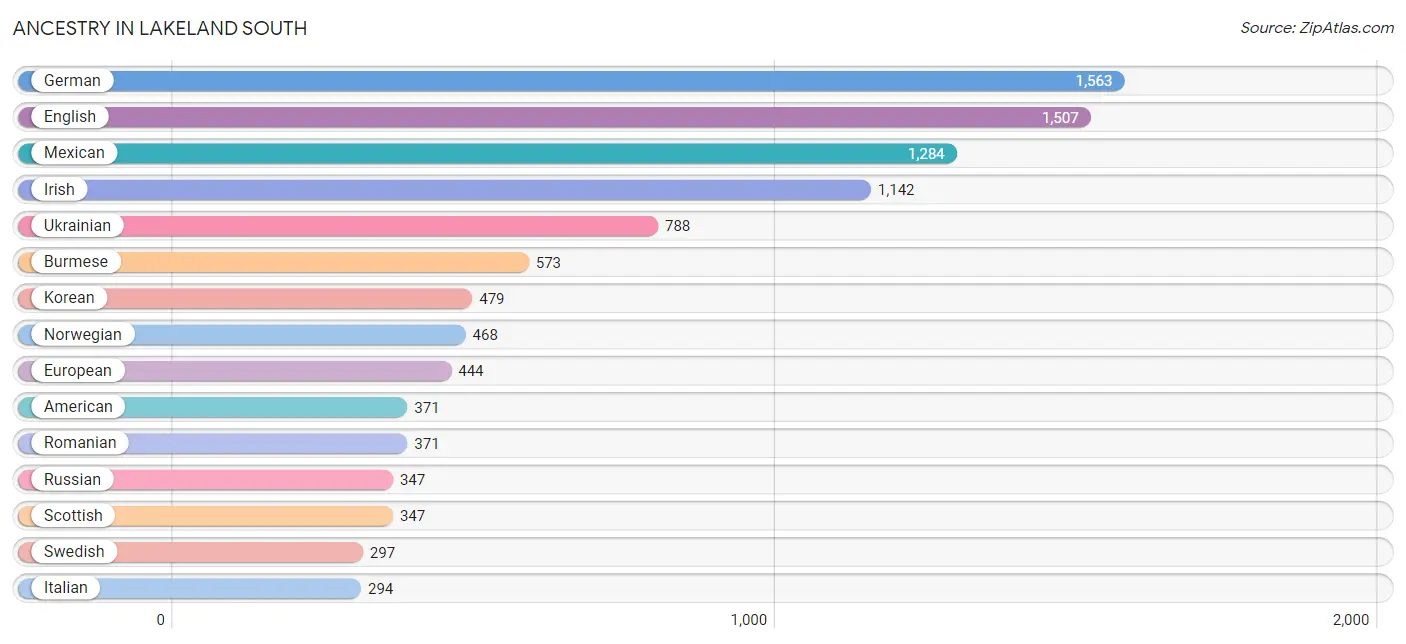
Ancestry in Lakeland South
The most populous ancestries reported in Lakeland South are German (1,563 | 12.4%), English (1,507 | 11.9%), Mexican (1,284 | 10.2%), Irish (1,142 | 9.1%), and Ukrainian (788 | 6.2%), together accounting for 49.8% of all Lakeland South residents.
| Ancestry | # Population | % Population |
| African | 28 | 0.2% |
| Alaska Native | 35 | 0.3% |
| American | 371 | 2.9% |
| Arab | 10 | 0.1% |
| Armenian | 63 | 0.5% |
| Austrian | 37 | 0.3% |
| Basque | 37 | 0.3% |
| Bhutanese | 128 | 1.0% |
| Brazilian | 66 | 0.5% |
| British | 74 | 0.6% |
| Burmese | 573 | 4.5% |
| Canadian | 67 | 0.5% |
| Central American | 84 | 0.7% |
| Central American Indian | 9 | 0.1% |
| Cherokee | 86 | 0.7% |
| Chippewa | 6 | 0.1% |
| Costa Rican | 54 | 0.4% |
| Croatian | 28 | 0.2% |
| Cuban | 13 | 0.1% |
| Czech | 33 | 0.3% |
| Danish | 15 | 0.1% |
| Dutch | 131 | 1.0% |
| Eastern European | 68 | 0.5% |
| Egyptian | 10 | 0.1% |
| English | 1,507 | 11.9% |
| European | 444 | 3.5% |
| Finnish | 54 | 0.4% |
| French | 247 | 2.0% |
| French American Indian | 4 | 0.0% |
| French Canadian | 7 | 0.1% |
| German | 1,563 | 12.4% |
| Greek | 23 | 0.2% |
| Guamanian / Chamorro | 86 | 0.7% |
| Honduran | 10 | 0.1% |
| Hungarian | 73 | 0.6% |
| Icelander | 19 | 0.2% |
| Indian (Asian) | 156 | 1.2% |
| Irish | 1,142 | 9.1% |
| Iroquois | 1 | 0.0% |
| Italian | 294 | 2.3% |
| Jamaican | 22 | 0.2% |
| Japanese | 166 | 1.3% |
| Kenyan | 27 | 0.2% |
| Korean | 479 | 3.8% |
| Luxembourger | 20 | 0.2% |
| Malaysian | 56 | 0.4% |
| Mexican | 1,284 | 10.2% |
| Native Hawaiian | 76 | 0.6% |
| Nicaraguan | 11 | 0.1% |
| Northern European | 50 | 0.4% |
| Norwegian | 468 | 3.7% |
| Pakistani | 21 | 0.2% |
| Pennsylvania German | 26 | 0.2% |
| Peruvian | 12 | 0.1% |
| Polish | 145 | 1.1% |
| Portuguese | 33 | 0.3% |
| Potawatomi | 6 | 0.1% |
| Puerto Rican | 8 | 0.1% |
| Romanian | 371 | 2.9% |
| Russian | 347 | 2.8% |
| Salvadoran | 9 | 0.1% |
| Samoan | 221 | 1.8% |
| Scandinavian | 109 | 0.9% |
| Scotch-Irish | 159 | 1.3% |
| Scottish | 347 | 2.8% |
| Slovak | 13 | 0.1% |
| South American | 12 | 0.1% |
| Spaniard | 129 | 1.0% |
| Sri Lankan | 213 | 1.7% |
| Subsaharan African | 55 | 0.4% |
| Swedish | 297 | 2.4% |
| Swiss | 9 | 0.1% |
| Thai | 109 | 0.9% |
| Ukrainian | 788 | 6.2% |
| Welsh | 262 | 2.1% | View All 75 Rows |
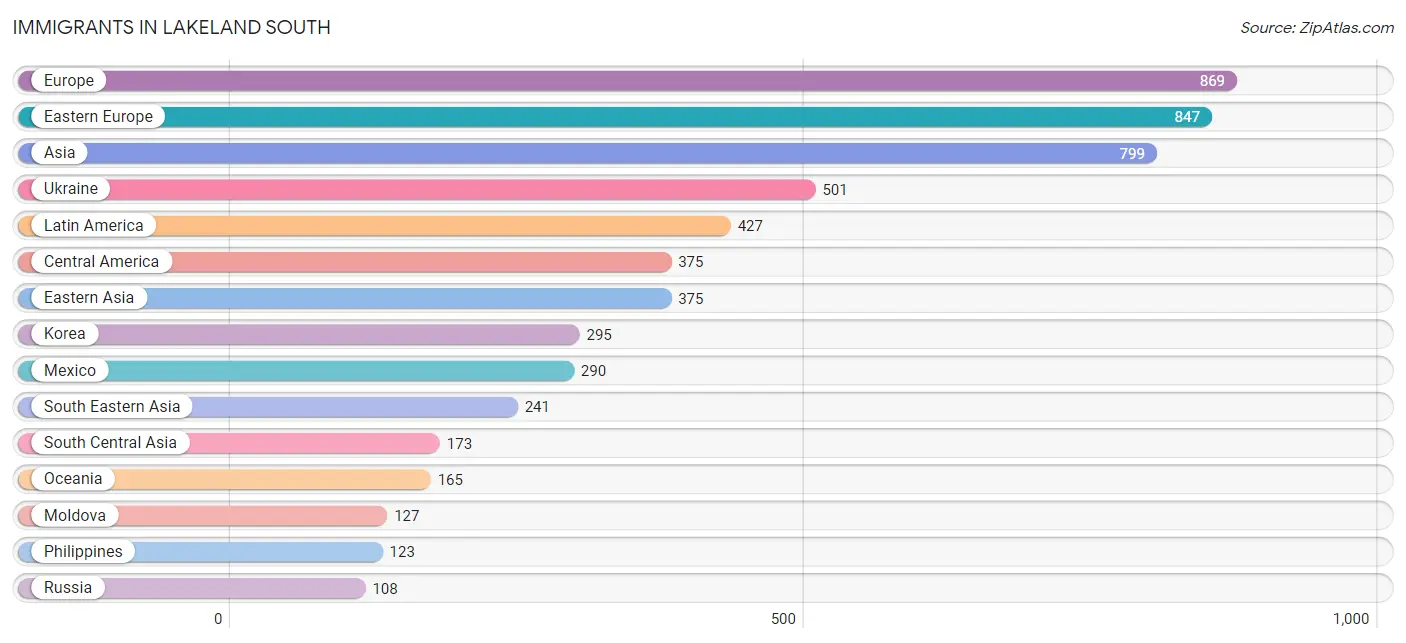
Immigrants in Lakeland South
The most numerous immigrant groups reported in Lakeland South came from Europe (869 | 6.9%), Eastern Europe (847 | 6.7%), Asia (799 | 6.3%), Ukraine (501 | 4.0%), and Latin America (427 | 3.4%), together accounting for 27.3% of all Lakeland South residents.
| Immigration Origin | # Population | % Population |
| Africa | 55 | 0.4% |
| Armenia | 10 | 0.1% |
| Asia | 799 | 6.3% |
| Belarus | 13 | 0.1% |
| Brazil | 40 | 0.3% |
| Cambodia | 45 | 0.4% |
| Canada | 45 | 0.4% |
| Central America | 375 | 3.0% |
| China | 48 | 0.4% |
| Czechoslovakia | 1 | 0.0% |
| Eastern Africa | 27 | 0.2% |
| Eastern Asia | 375 | 3.0% |
| Eastern Europe | 847 | 6.7% |
| Europe | 869 | 6.9% |
| Fiji | 26 | 0.2% |
| Honduras | 74 | 0.6% |
| Hong Kong | 17 | 0.1% |
| Hungary | 79 | 0.6% |
| India | 101 | 0.8% |
| Japan | 32 | 0.3% |
| Kazakhstan | 39 | 0.3% |
| Kenya | 27 | 0.2% |
| Korea | 295 | 2.3% |
| Latin America | 427 | 3.4% |
| Mexico | 290 | 2.3% |
| Middle Africa | 28 | 0.2% |
| Moldova | 127 | 1.0% |
| Netherlands | 13 | 0.1% |
| Nicaragua | 11 | 0.1% |
| Oceania | 165 | 1.3% |
| Pakistan | 12 | 0.1% |
| Peru | 12 | 0.1% |
| Philippines | 123 | 1.0% |
| Poland | 16 | 0.1% |
| Russia | 108 | 0.9% |
| South America | 52 | 0.4% |
| South Central Asia | 173 | 1.4% |
| South Eastern Asia | 241 | 1.9% |
| Switzerland | 9 | 0.1% |
| Taiwan | 21 | 0.2% |
| Thailand | 13 | 0.1% |
| Ukraine | 501 | 4.0% |
| Vietnam | 60 | 0.5% |
| Western Asia | 10 | 0.1% |
| Western Europe | 22 | 0.2% |
| Zaire | 28 | 0.2% | View All 46 Rows |
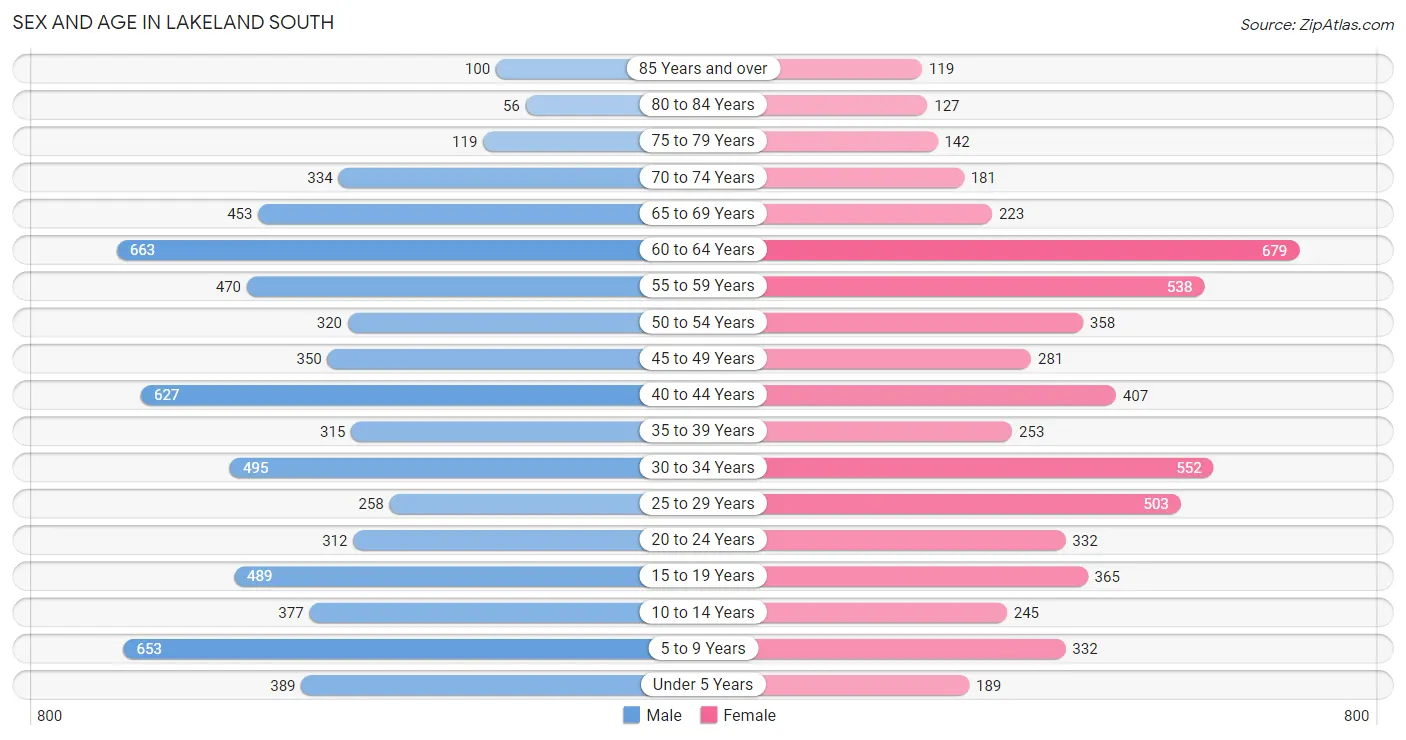
Sex and Age in Lakeland South
Sex and Age in Lakeland South
The most populous age groups in Lakeland South are 60 to 64 Years (663 | 9.8%) for men and 60 to 64 Years (679 | 11.7%) for women.
| Age Bracket | Male | Female |
| Under 5 Years | 389 (5.7%) | 189 (3.2%) |
| 5 to 9 Years | 653 (9.6%) | 332 (5.7%) |
| 10 to 14 Years | 377 (5.6%) | 245 (4.2%) |
| 15 to 19 Years | 489 (7.2%) | 365 (6.3%) |
| 20 to 24 Years | 312 (4.6%) | 332 (5.7%) |
| 25 to 29 Years | 258 (3.8%) | 503 (8.6%) |
| 30 to 34 Years | 495 (7.3%) | 552 (9.5%) |
| 35 to 39 Years | 315 (4.6%) | 253 (4.3%) |
| 40 to 44 Years | 627 (9.2%) | 407 (7.0%) |
| 45 to 49 Years | 350 (5.2%) | 281 (4.8%) |
| 50 to 54 Years | 320 (4.7%) | 358 (6.1%) |
| 55 to 59 Years | 470 (6.9%) | 538 (9.2%) |
| 60 to 64 Years | 663 (9.8%) | 679 (11.7%) |
| 65 to 69 Years | 453 (6.7%) | 223 (3.8%) |
| 70 to 74 Years | 334 (4.9%) | 181 (3.1%) |
| 75 to 79 Years | 119 (1.8%) | 142 (2.4%) |
| 80 to 84 Years | 56 (0.8%) | 127 (2.2%) |
| 85 Years and over | 100 (1.5%) | 119 (2.0%) |
| Total | 6,780 (100.0%) | 5,826 (100.0%) |
Families and Households in Lakeland South
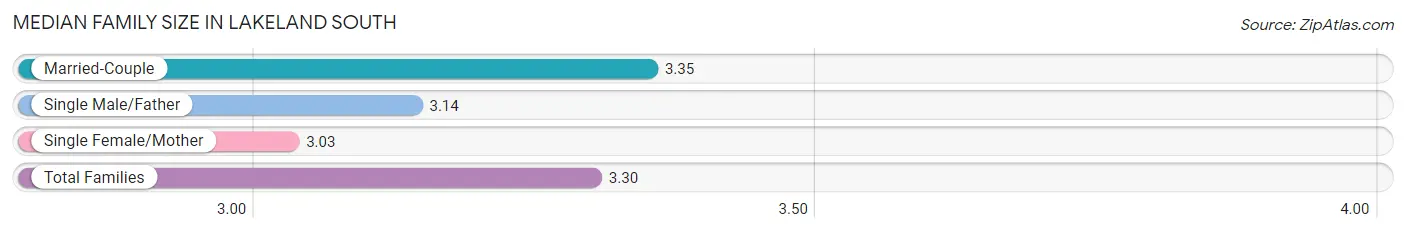
Median Family Size in Lakeland South
The median family size in Lakeland South is 3.30 persons per family, with married-couple families (2,634 | 82.4%) accounting for the largest median family size of 3.35 persons per family. On the other hand, single female/mother families (358 | 11.2%) represent the smallest median family size with 3.03 persons per family.
| Family Type | # Families | Family Size |
| Married-Couple | 2,634 (82.4%) | 3.35 |
| Single Male/Father | 205 (6.4%) | 3.14 |
| Single Female/Mother | 358 (11.2%) | 3.03 |
| Total Families | 3,197 (100.0%) | 3.30 |
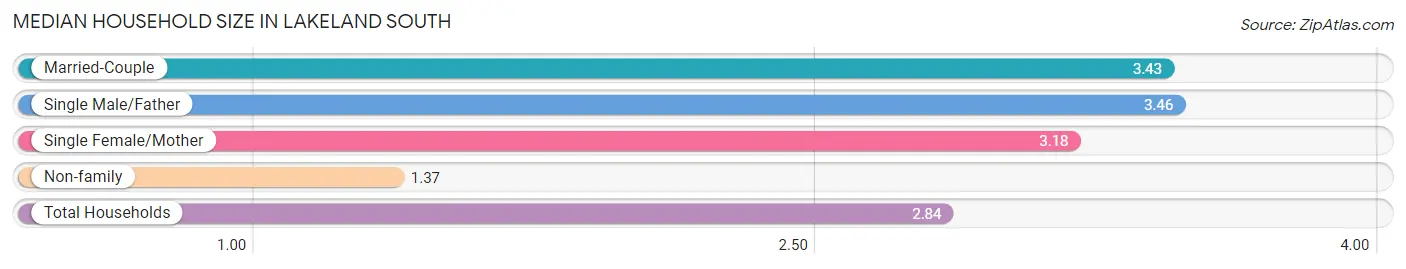
Median Household Size in Lakeland South
The median household size in Lakeland South is 2.84 persons per household, with single male/father households (205 | 4.6%) accounting for the largest median household size of 3.46 persons per household. non-family households (1,236 | 27.9%) represent the smallest median household size with 1.37 persons per household.
| Household Type | # Households | Household Size |
| Married-Couple | 2,634 (59.4%) | 3.43 |
| Single Male/Father | 205 (4.6%) | 3.46 |
| Single Female/Mother | 358 (8.1%) | 3.18 |
| Non-family | 1,236 (27.9%) | 1.37 |
| Total Households | 4,433 (100.0%) | 2.84 |
Household Size by Marriage Status in Lakeland South
Out of a total of 4,433 households in Lakeland South, 3,197 (72.1%) are family households, while 1,236 (27.9%) are nonfamily households. The most numerous type of family households are 2-person households, comprising 1,300, and the most common type of nonfamily households are 1-person households, comprising 843.
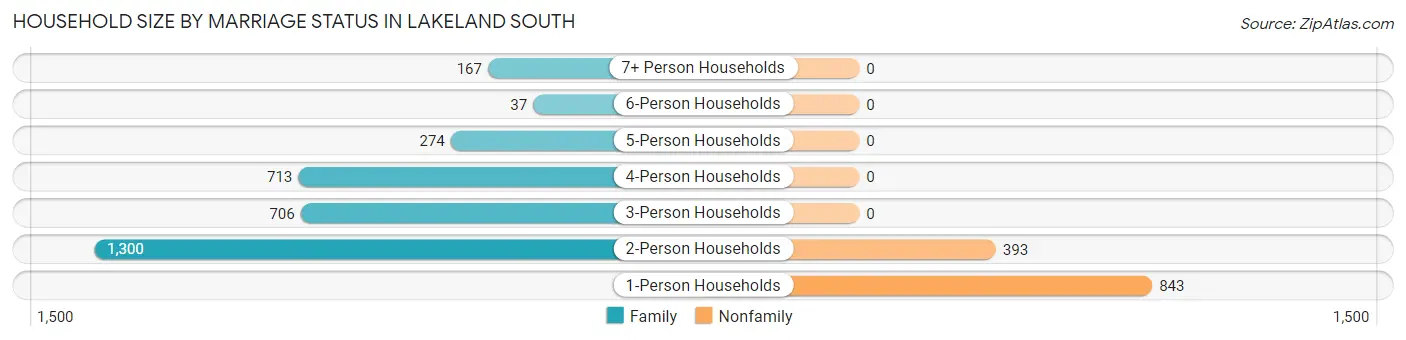
| Household Size | Family Households | Nonfamily Households |
| 1-Person Households | - | 843 (19.0%) |
| 2-Person Households | 1,300 (29.3%) | 393 (8.9%) |
| 3-Person Households | 706 (15.9%) | 0 (0.0%) |
| 4-Person Households | 713 (16.1%) | 0 (0.0%) |
| 5-Person Households | 274 (6.2%) | 0 (0.0%) |
| 6-Person Households | 37 (0.8%) | 0 (0.0%) |
| 7+ Person Households | 167 (3.8%) | 0 (0.0%) |
| Total | 3,197 (72.1%) | 1,236 (27.9%) |
Female Fertility in Lakeland South
Fertility by Age in Lakeland South
Average fertility rate in Lakeland South is 58.0 births per 1,000 women. Women in the age bracket of 20 to 34 years have the highest fertility rate with 92.0 births per 1,000 women. Women in the age bracket of 20 to 34 years acount for 78.9% of all women with births.
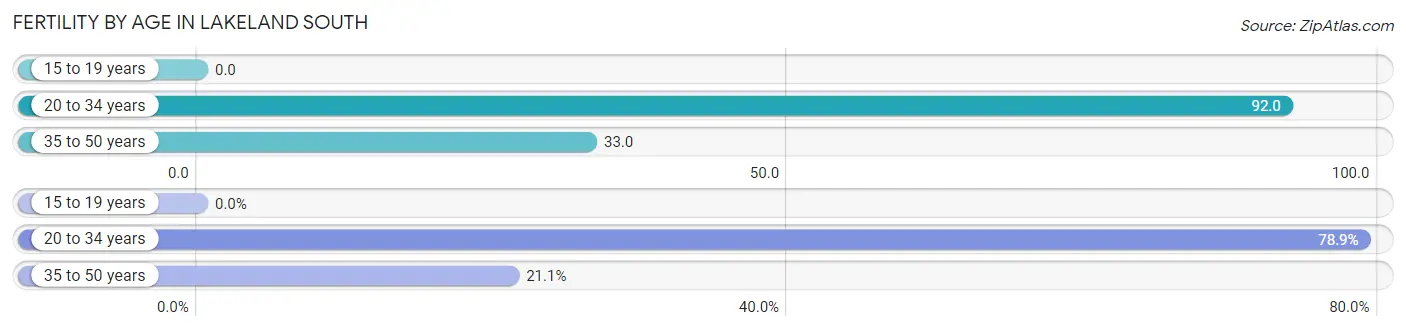
| Age Bracket | Women with Births | Births / 1,000 Women |
| 15 to 19 years | 0 (0.0%) | 0.0 |
| 20 to 34 years | 127 (78.9%) | 92.0 |
| 35 to 50 years | 34 (21.1%) | 33.0 |
| Total | 161 (100.0%) | 58.0 |
Fertility by Age by Marriage Status in Lakeland South
64.6% of women with births (161) in Lakeland South are married. The highest percentage of unmarried women with births falls into 35 to 50 years age bracket with 41.2% of them unmarried at the time of birth, while the lowest percentage of unmarried women with births belong to 20 to 34 years age bracket with 33.9% of them unmarried.
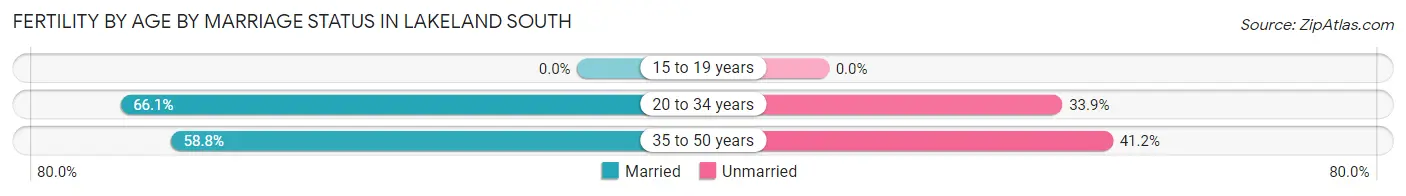
| Age Bracket | Married | Unmarried |
| 15 to 19 years | 0 (0.0%) | 0 (0.0%) |
| 20 to 34 years | 84 (66.1%) | 43 (33.9%) |
| 35 to 50 years | 20 (58.8%) | 14 (41.2%) |
| Total | 104 (64.6%) | 57 (35.4%) |
Fertility by Education in Lakeland South
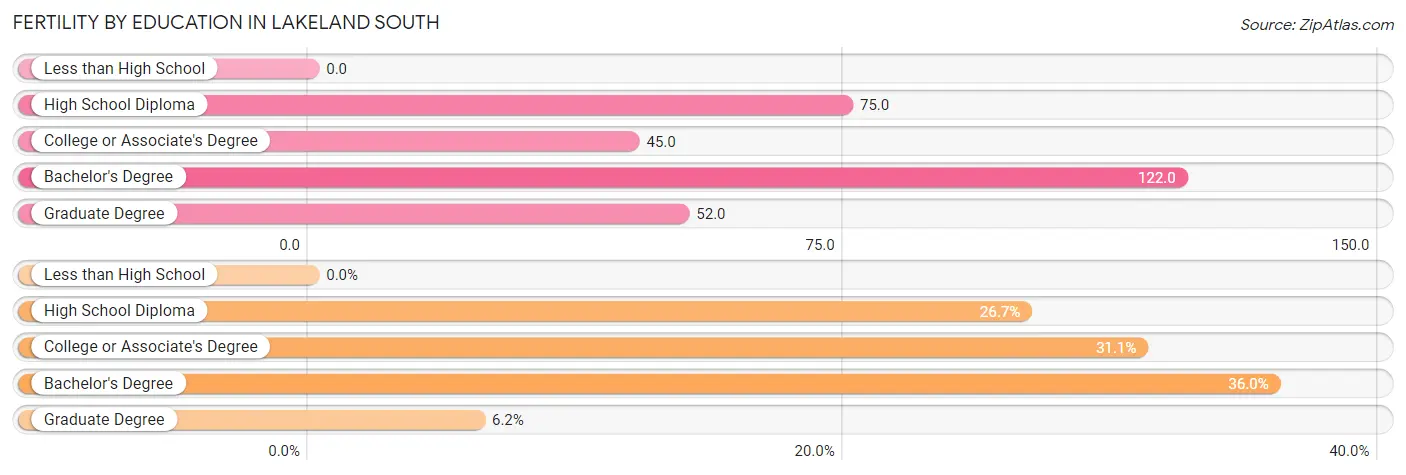
| Educational Attainment | Women with Births | Births / 1,000 Women |
| Less than High School | 0 (0.0%) | 0.0 |
| High School Diploma | 43 (26.7%) | 75.0 |
| College or Associate's Degree | 50 (31.1%) | 45.0 |
| Bachelor's Degree | 58 (36.0%) | 122.0 |
| Graduate Degree | 10 (6.2%) | 52.0 |
| Total | 161 (100.0%) | 58.0 |
Fertility by Education by Marriage Status in Lakeland South
35.4% of women with births in Lakeland South are unmarried. Women with the educational attainment of college or associate's degree are most likely to be married with 100.0% of them married at childbirth, while women with the educational attainment of high school diploma are least likely to be married with 100.0% of them unmarried at childbirth.
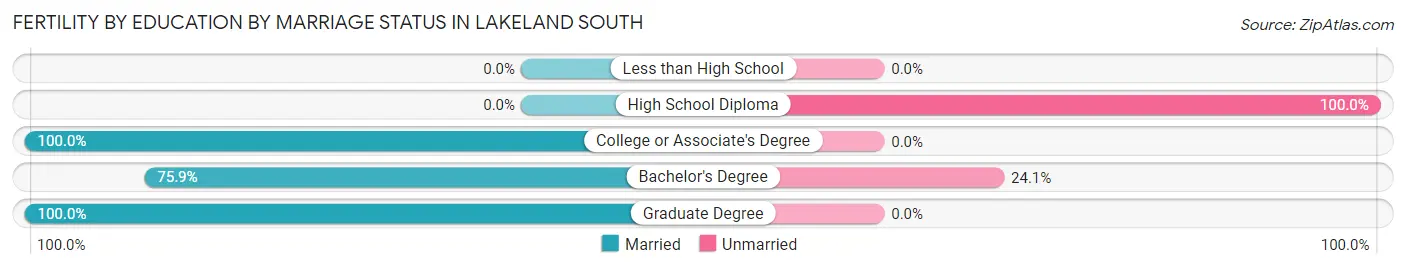
| Educational Attainment | Married | Unmarried |
| Less than High School | 0 (0.0%) | 0 (0.0%) |
| High School Diploma | 0 (0.0%) | 43 (100.0%) |
| College or Associate's Degree | 50 (100.0%) | 0 (0.0%) |
| Bachelor's Degree | 44 (75.9%) | 14 (24.1%) |
| Graduate Degree | 10 (100.0%) | 0 (0.0%) |
| Total | 104 (64.6%) | 57 (35.4%) |
Employment Characteristics in Lakeland South
Employment by Class of Employer in Lakeland South
Among the 6,264 employed individuals in Lakeland South, private company employees (4,075 | 65.0%), local government employees (659 | 10.5%), and not-for-profit organizations (572 | 9.1%) make up the most common classes of employment.
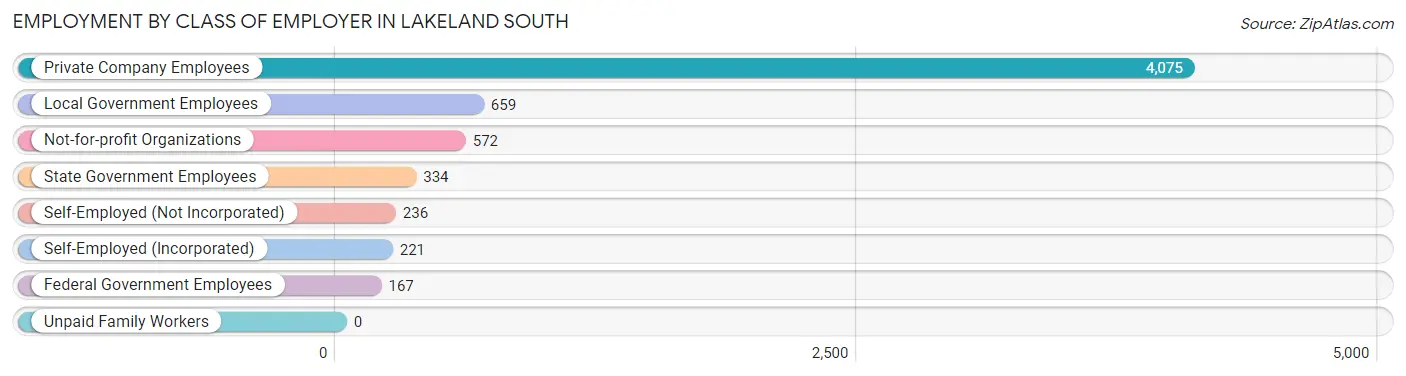
| Employer Class | # Employees | % Employees |
| Private Company Employees | 4,075 | 65.0% |
| Self-Employed (Incorporated) | 221 | 3.5% |
| Self-Employed (Not Incorporated) | 236 | 3.8% |
| Not-for-profit Organizations | 572 | 9.1% |
| Local Government Employees | 659 | 10.5% |
| State Government Employees | 334 | 5.3% |
| Federal Government Employees | 167 | 2.7% |
| Unpaid Family Workers | 0 | 0.0% |
| Total | 6,264 | 100.0% |
Employment Status by Age in Lakeland South
According to the labor force statistics for Lakeland South, out of the total population over 16 years of age (10,272), 66.1% or 6,790 individuals are in the labor force, with 6.2% or 421 of them unemployed. The age group with the highest labor force participation rate is 45 to 54 years, with 91.1% or 1,192 individuals in the labor force. Within the labor force, the 16 to 19 years age range has the highest percentage of unemployed individuals, with 12.3% or 52 of them being unemployed.
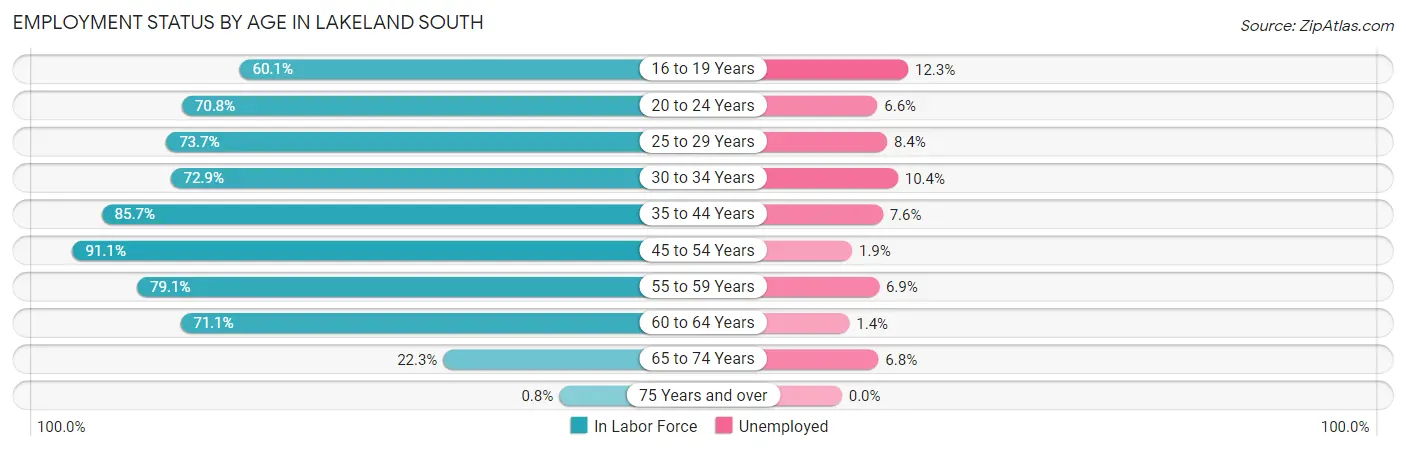
| Age Bracket | In Labor Force | Unemployed |
| 16 to 19 Years | 424 (60.1%) | 52 (12.3%) |
| 20 to 24 Years | 456 (70.8%) | 30 (6.6%) |
| 25 to 29 Years | 561 (73.7%) | 47 (8.4%) |
| 30 to 34 Years | 763 (72.9%) | 79 (10.4%) |
| 35 to 44 Years | 1,373 (85.7%) | 104 (7.6%) |
| 45 to 54 Years | 1,192 (91.1%) | 23 (1.9%) |
| 55 to 59 Years | 797 (79.1%) | 55 (6.9%) |
| 60 to 64 Years | 954 (71.1%) | 13 (1.4%) |
| 65 to 74 Years | 266 (22.3%) | 18 (6.8%) |
| 75 Years and over | 5 (0.8%) | 0 (0.0%) |
| Total | 6,790 (66.1%) | 421 (6.2%) |
Employment Status by Educational Attainment in Lakeland South
According to labor force statistics for Lakeland South, 79.8% of individuals (5,641) out of the total population between 25 and 64 years of age (7,069) are in the labor force, with 5.7% or 322 of them being unemployed. The group with the highest labor force participation rate are those with the educational attainment of less than high school, with 85.1% or 565 individuals in the labor force. Within the labor force, individuals with college / associate degree education have the highest percentage of unemployment, with 7.3% or 159 of them being unemployed.
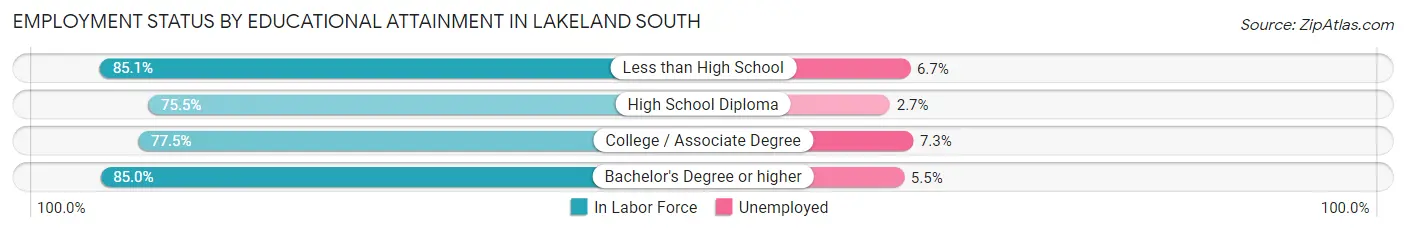
| Educational Attainment | In Labor Force | Unemployed |
| Less than High School | 565 (85.1%) | 44 (6.7%) |
| High School Diploma | 1,277 (75.5%) | 46 (2.7%) |
| College / Associate Degree | 2,175 (77.5%) | 205 (7.3%) |
| Bachelor's Degree or higher | 1,620 (85.0%) | 105 (5.5%) |
| Total | 5,641 (79.8%) | 403 (5.7%) |
Employment Occupations by Sex in Lakeland South
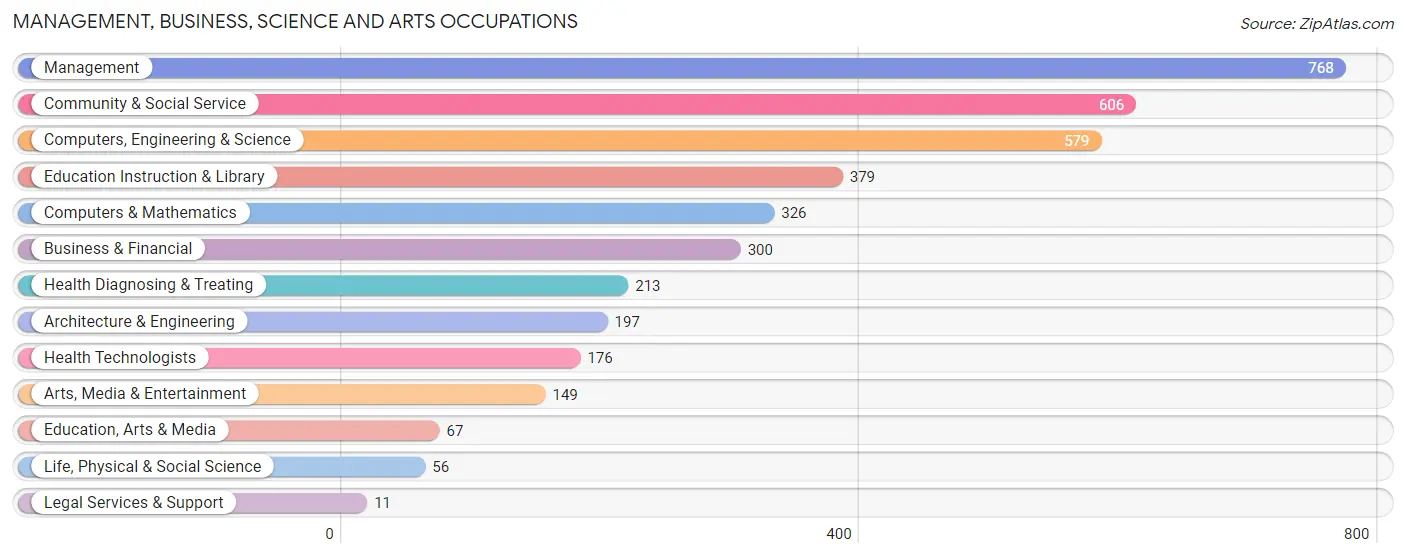
Management, Business, Science and Arts Occupations
The most common Management, Business, Science and Arts occupations in Lakeland South are Management (768 | 12.1%), Community & Social Service (606 | 9.5%), Computers, Engineering & Science (579 | 9.1%), Education Instruction & Library (379 | 5.9%), and Computers & Mathematics (326 | 5.1%).
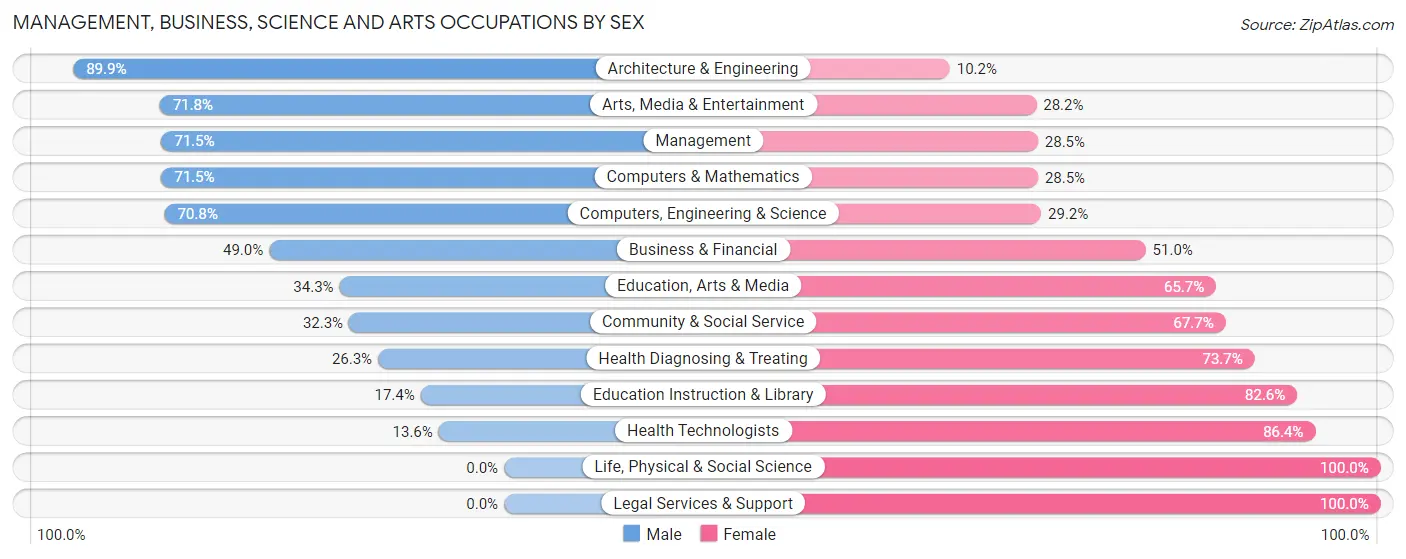
Management, Business, Science and Arts Occupations by Sex
Within the Management, Business, Science and Arts occupations in Lakeland South, the most male-oriented occupations are Architecture & Engineering (89.8%), Arts, Media & Entertainment (71.8%), and Management (71.5%), while the most female-oriented occupations are Life, Physical & Social Science (100.0%), Legal Services & Support (100.0%), and Health Technologists (86.4%).
| Occupation | Male | Female |
| Management | 549 (71.5%) | 219 (28.5%) |
| Business & Financial | 147 (49.0%) | 153 (51.0%) |
| Computers, Engineering & Science | 410 (70.8%) | 169 (29.2%) |
| Computers & Mathematics | 233 (71.5%) | 93 (28.5%) |
| Architecture & Engineering | 177 (89.8%) | 20 (10.2%) |
| Life, Physical & Social Science | 0 (0.0%) | 56 (100.0%) |
| Community & Social Service | 196 (32.3%) | 410 (67.7%) |
| Education, Arts & Media | 23 (34.3%) | 44 (65.7%) |
| Legal Services & Support | 0 (0.0%) | 11 (100.0%) |
| Education Instruction & Library | 66 (17.4%) | 313 (82.6%) |
| Arts, Media & Entertainment | 107 (71.8%) | 42 (28.2%) |
| Health Diagnosing & Treating | 56 (26.3%) | 157 (73.7%) |
| Health Technologists | 24 (13.6%) | 152 (86.4%) |
| Total (Category) | 1,358 (55.1%) | 1,108 (44.9%) |
| Total (Overall) | 3,564 (56.0%) | 2,805 (44.0%) |
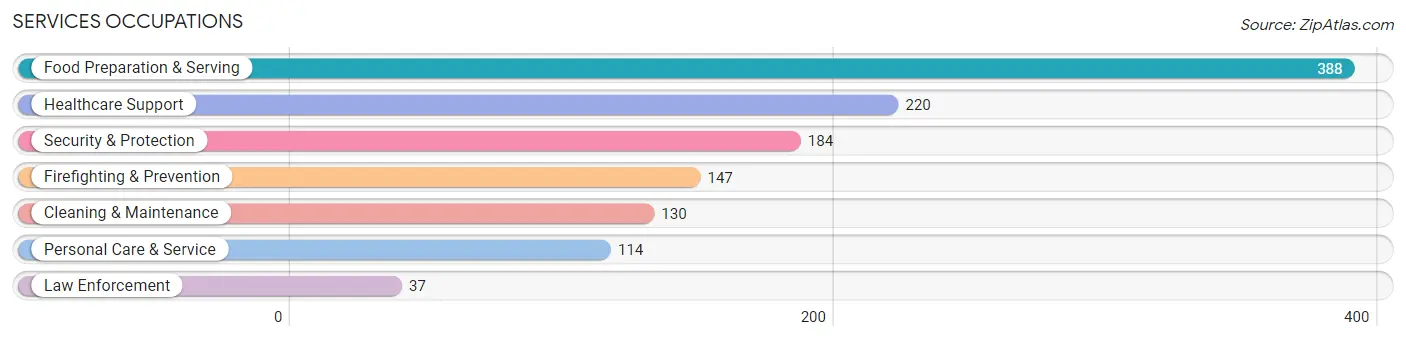
Services Occupations
The most common Services occupations in Lakeland South are Food Preparation & Serving (388 | 6.1%), Healthcare Support (220 | 3.5%), Security & Protection (184 | 2.9%), Firefighting & Prevention (147 | 2.3%), and Cleaning & Maintenance (130 | 2.0%).
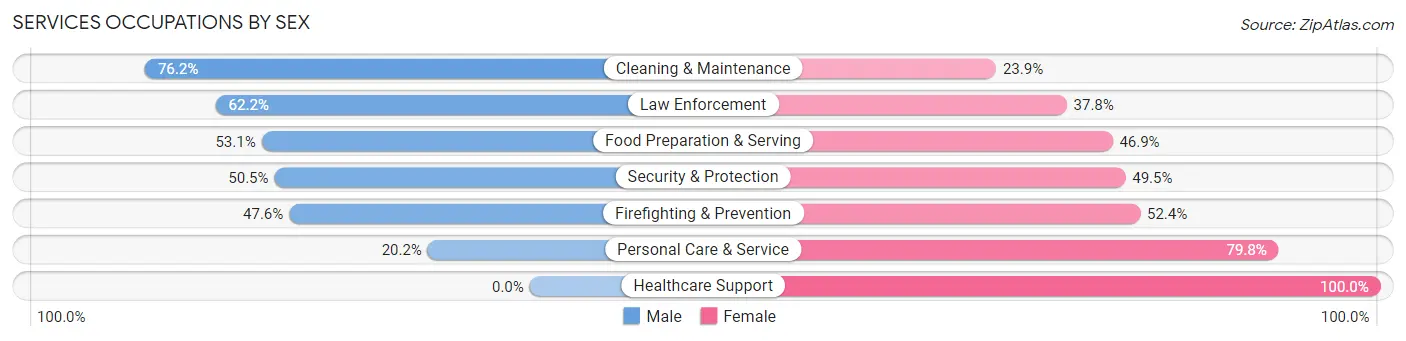
Services Occupations by Sex
Within the Services occupations in Lakeland South, the most male-oriented occupations are Cleaning & Maintenance (76.1%), Law Enforcement (62.2%), and Food Preparation & Serving (53.1%), while the most female-oriented occupations are Healthcare Support (100.0%), Personal Care & Service (79.8%), and Firefighting & Prevention (52.4%).
| Occupation | Male | Female |
| Healthcare Support | 0 (0.0%) | 220 (100.0%) |
| Security & Protection | 93 (50.5%) | 91 (49.5%) |
| Firefighting & Prevention | 70 (47.6%) | 77 (52.4%) |
| Law Enforcement | 23 (62.2%) | 14 (37.8%) |
| Food Preparation & Serving | 206 (53.1%) | 182 (46.9%) |
| Cleaning & Maintenance | 99 (76.1%) | 31 (23.8%) |
| Personal Care & Service | 23 (20.2%) | 91 (79.8%) |
| Total (Category) | 421 (40.6%) | 615 (59.4%) |
| Total (Overall) | 3,564 (56.0%) | 2,805 (44.0%) |
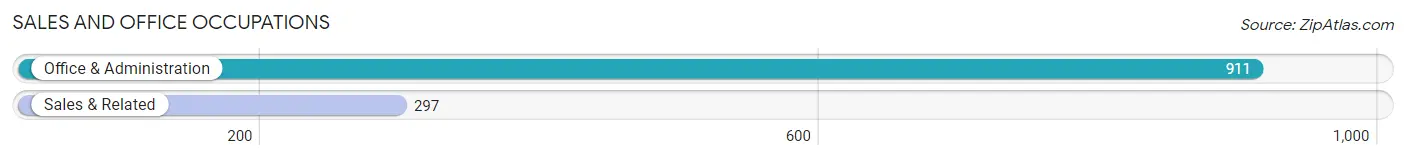
Sales and Office Occupations
The most common Sales and Office occupations in Lakeland South are Office & Administration (911 | 14.3%), and Sales & Related (297 | 4.7%).
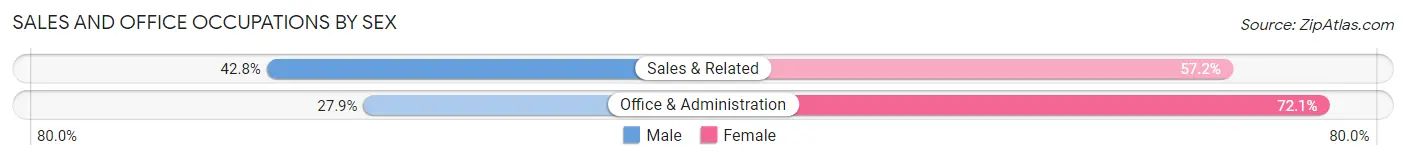
Sales and Office Occupations by Sex
| Occupation | Male | Female |
| Sales & Related | 127 (42.8%) | 170 (57.2%) |
| Office & Administration | 254 (27.9%) | 657 (72.1%) |
| Total (Category) | 381 (31.5%) | 827 (68.5%) |
| Total (Overall) | 3,564 (56.0%) | 2,805 (44.0%) |
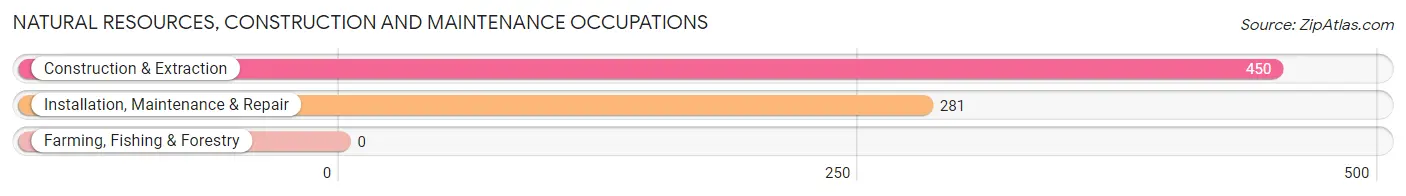
Natural Resources, Construction and Maintenance Occupations
The most common Natural Resources, Construction and Maintenance occupations in Lakeland South are Construction & Extraction (450 | 7.1%), and Installation, Maintenance & Repair (281 | 4.4%).
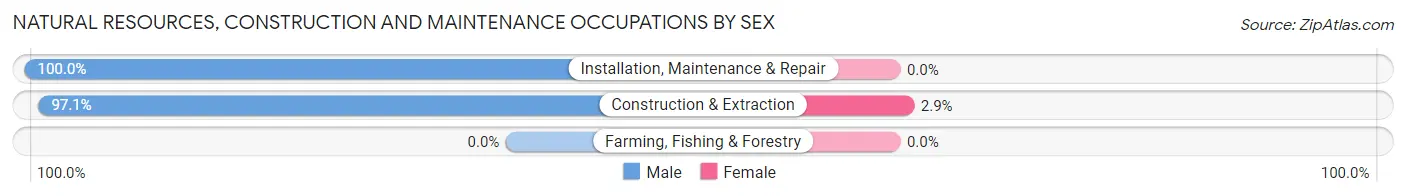
Natural Resources, Construction and Maintenance Occupations by Sex
| Occupation | Male | Female |
| Farming, Fishing & Forestry | 0 (0.0%) | 0 (0.0%) |
| Construction & Extraction | 437 (97.1%) | 13 (2.9%) |
| Installation, Maintenance & Repair | 281 (100.0%) | 0 (0.0%) |
| Total (Category) | 718 (98.2%) | 13 (1.8%) |
| Total (Overall) | 3,564 (56.0%) | 2,805 (44.0%) |
Production, Transportation and Moving Occupations
The most common Production, Transportation and Moving occupations in Lakeland South are Transportation (419 | 6.6%), Material Moving (265 | 4.2%), and Production (244 | 3.8%).
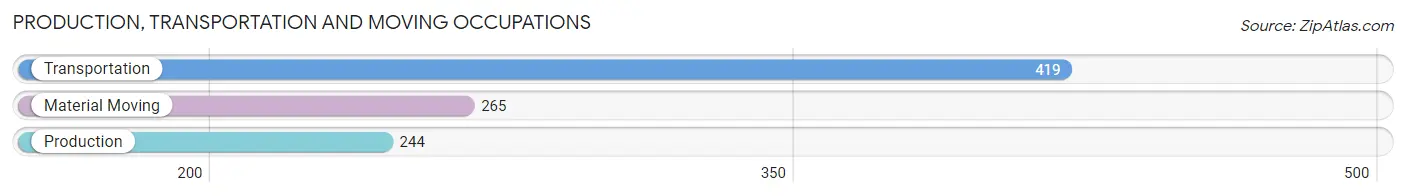
Production, Transportation and Moving Occupations by Sex
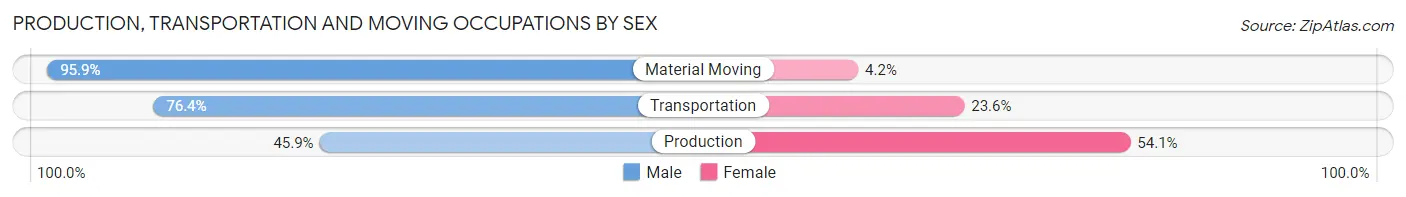
| Occupation | Male | Female |
| Production | 112 (45.9%) | 132 (54.1%) |
| Transportation | 320 (76.4%) | 99 (23.6%) |
| Material Moving | 254 (95.9%) | 11 (4.2%) |
| Total (Category) | 686 (73.9%) | 242 (26.1%) |
| Total (Overall) | 3,564 (56.0%) | 2,805 (44.0%) |
Employment Industries by Sex in Lakeland South
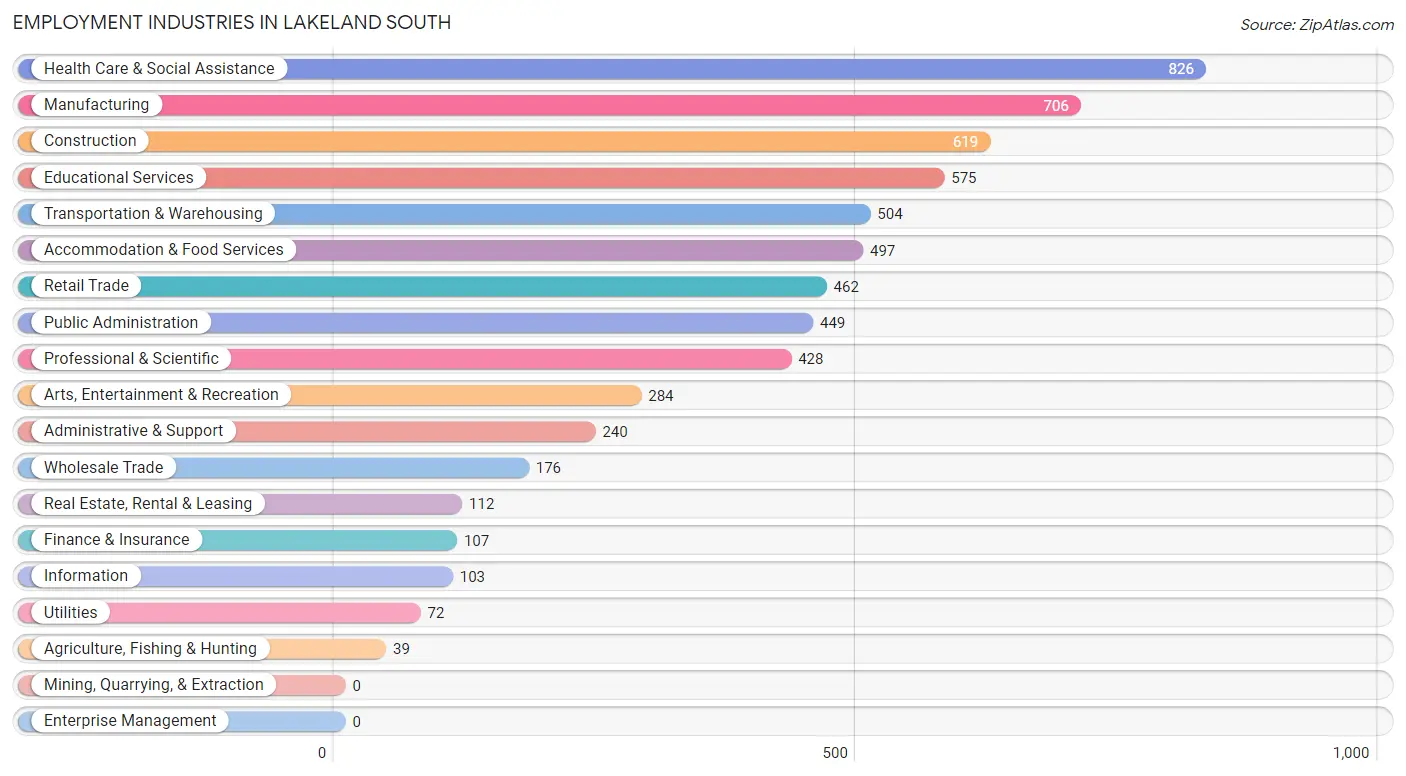
Employment Industries in Lakeland South
The major employment industries in Lakeland South include Health Care & Social Assistance (826 | 13.0%), Manufacturing (706 | 11.1%), Construction (619 | 9.7%), Educational Services (575 | 9.0%), and Transportation & Warehousing (504 | 7.9%).
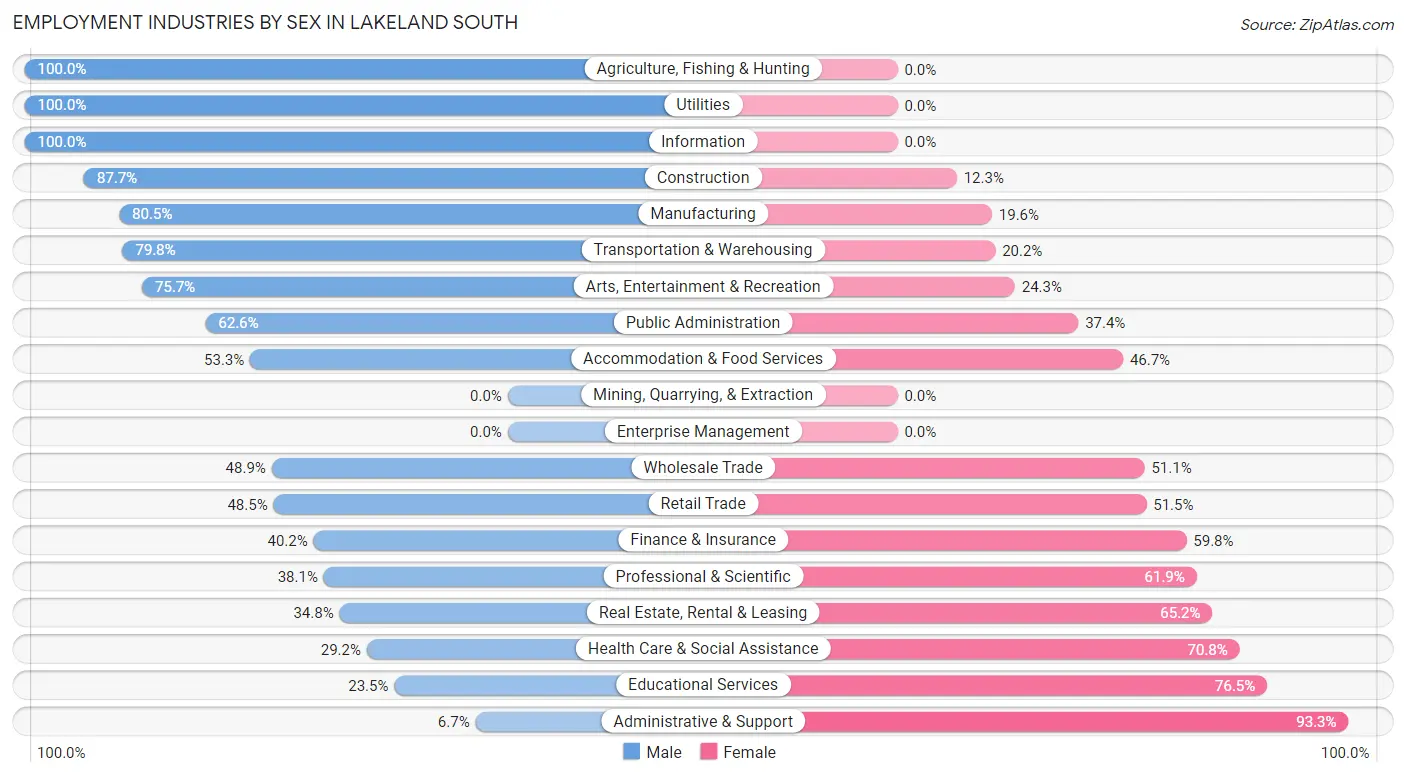
Employment Industries by Sex in Lakeland South
The Lakeland South industries that see more men than women are Agriculture, Fishing & Hunting (100.0%), Utilities (100.0%), and Information (100.0%), whereas the industries that tend to have a higher number of women are Administrative & Support (93.3%), Educational Services (76.5%), and Health Care & Social Assistance (70.8%).
| Industry | Male | Female |
| Agriculture, Fishing & Hunting | 39 (100.0%) | 0 (0.0%) |
| Mining, Quarrying, & Extraction | 0 (0.0%) | 0 (0.0%) |
| Construction | 543 (87.7%) | 76 (12.3%) |
| Manufacturing | 568 (80.4%) | 138 (19.6%) |
| Wholesale Trade | 86 (48.9%) | 90 (51.1%) |
| Retail Trade | 224 (48.5%) | 238 (51.5%) |
| Transportation & Warehousing | 402 (79.8%) | 102 (20.2%) |
| Utilities | 72 (100.0%) | 0 (0.0%) |
| Information | 103 (100.0%) | 0 (0.0%) |
| Finance & Insurance | 43 (40.2%) | 64 (59.8%) |
| Real Estate, Rental & Leasing | 39 (34.8%) | 73 (65.2%) |
| Professional & Scientific | 163 (38.1%) | 265 (61.9%) |
| Enterprise Management | 0 (0.0%) | 0 (0.0%) |
| Administrative & Support | 16 (6.7%) | 224 (93.3%) |
| Educational Services | 135 (23.5%) | 440 (76.5%) |
| Health Care & Social Assistance | 241 (29.2%) | 585 (70.8%) |
| Arts, Entertainment & Recreation | 215 (75.7%) | 69 (24.3%) |
| Accommodation & Food Services | 265 (53.3%) | 232 (46.7%) |
| Public Administration | 281 (62.6%) | 168 (37.4%) |
| Total | 3,564 (56.0%) | 2,805 (44.0%) |
Education in Lakeland South
School Enrollment in Lakeland South
The most common levels of schooling among the 2,945 students in Lakeland South are elementary school (705 | 23.9%), college / undergraduate (604 | 20.5%), and high school (587 | 19.9%).
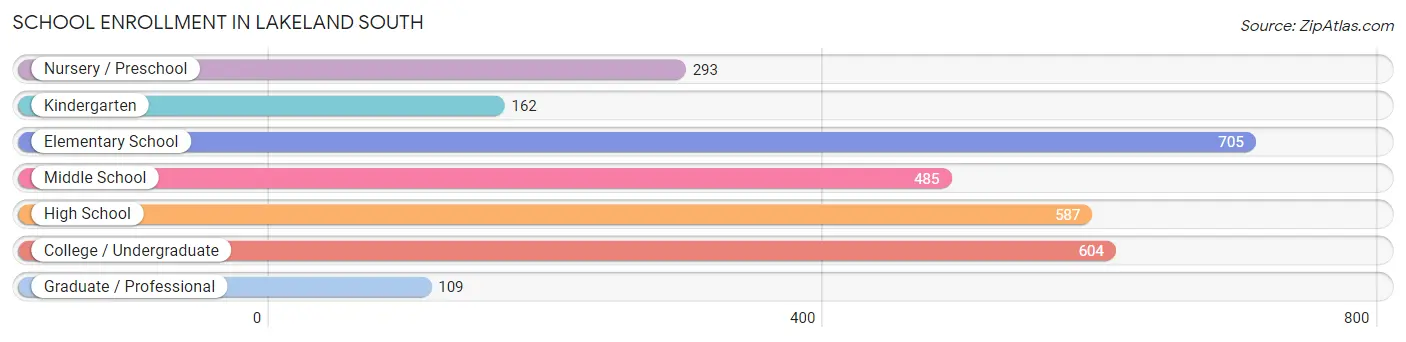
| School Level | # Students | % Students |
| Nursery / Preschool | 293 | 10.0% |
| Kindergarten | 162 | 5.5% |
| Elementary School | 705 | 23.9% |
| Middle School | 485 | 16.5% |
| High School | 587 | 19.9% |
| College / Undergraduate | 604 | 20.5% |
| Graduate / Professional | 109 | 3.7% |
| Total | 2,945 | 100.0% |
School Enrollment by Age by Funding Source in Lakeland South
Out of a total of 2,945 students who are enrolled in schools in Lakeland South, 427 (14.5%) attend a private institution, while the remaining 2,518 (85.5%) are enrolled in public schools. The age group of 20 to 24 year olds has the highest likelihood of being enrolled in private schools, with 151 (44.9% in the age bracket) enrolled. Conversely, the age group of 18 to 19 year olds has the lowest likelihood of being enrolled in a private school, with 232 (100.0% in the age bracket) attending a public institution.
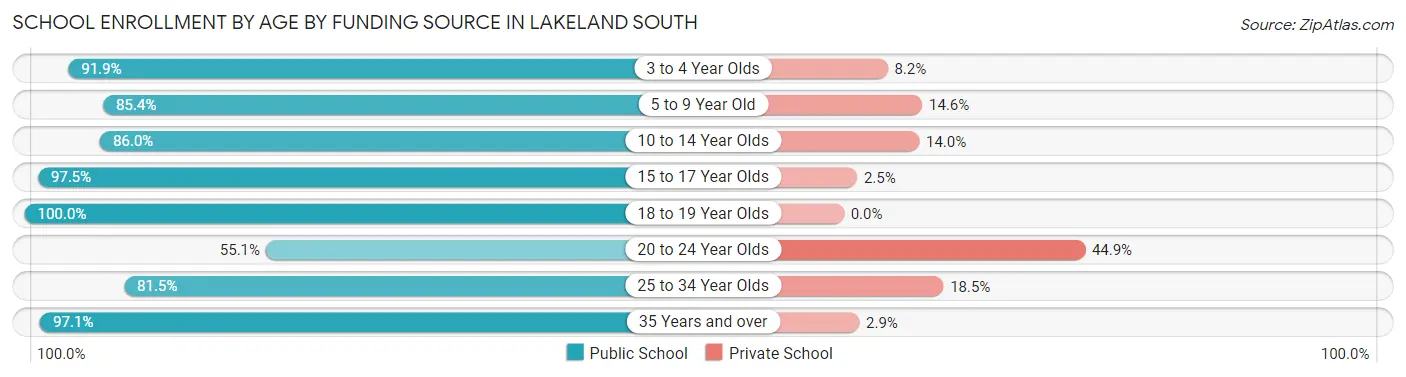
| Age Bracket | Public School | Private School |
| 3 to 4 Year Olds | 124 (91.8%) | 11 (8.2%) |
| 5 to 9 Year Old | 824 (85.4%) | 141 (14.6%) |
| 10 to 14 Year Olds | 502 (86.0%) | 82 (14.0%) |
| 15 to 17 Year Olds | 393 (97.5%) | 10 (2.5%) |
| 18 to 19 Year Olds | 232 (100.0%) | 0 (0.0%) |
| 20 to 24 Year Olds | 185 (55.1%) | 151 (44.9%) |
| 25 to 34 Year Olds | 123 (81.5%) | 28 (18.5%) |
| 35 Years and over | 135 (97.1%) | 4 (2.9%) |
| Total | 2,518 (85.5%) | 427 (14.5%) |
Educational Attainment by Field of Study in Lakeland South
Business (517 | 20.3%), engineering (265 | 10.4%), education (228 | 9.0%), bio, nature & agricultural (218 | 8.6%), and science & technology (213 | 8.4%) are the most common fields of study among 2,545 individuals in Lakeland South who have obtained a bachelor's degree or higher.
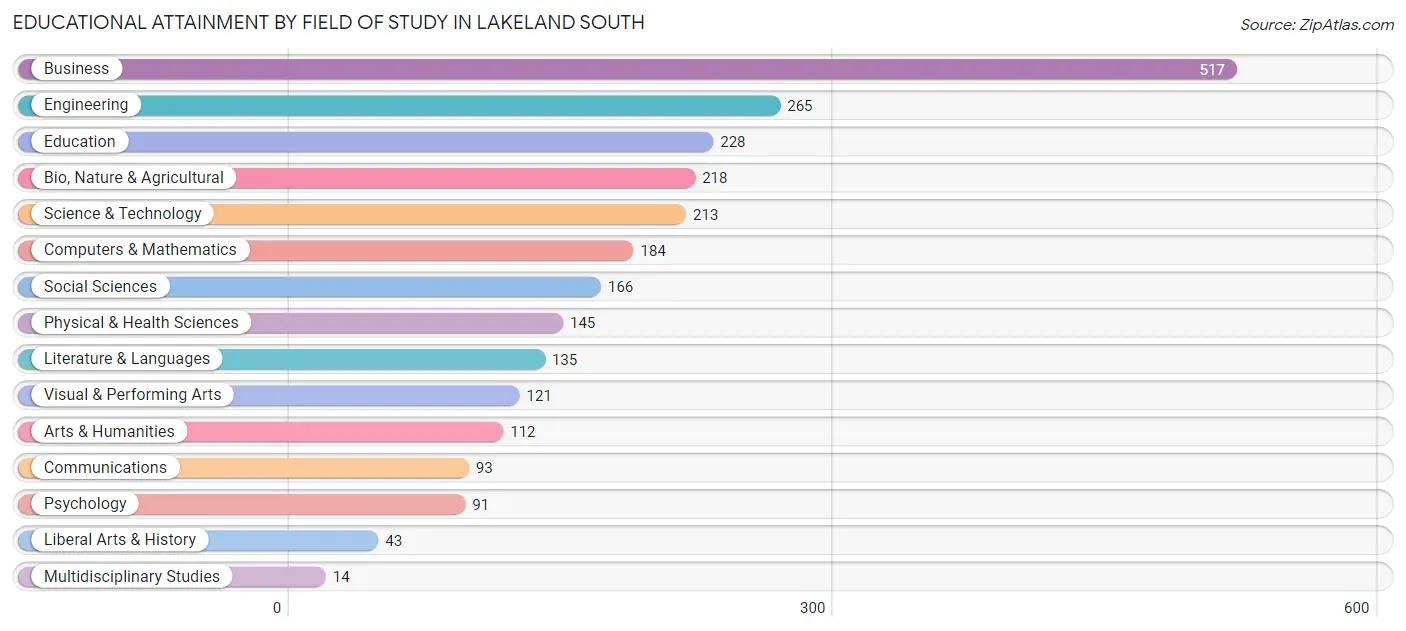
| Field of Study | # Graduates | % Graduates |
| Computers & Mathematics | 184 | 7.2% |
| Bio, Nature & Agricultural | 218 | 8.6% |
| Physical & Health Sciences | 145 | 5.7% |
| Psychology | 91 | 3.6% |
| Social Sciences | 166 | 6.5% |
| Engineering | 265 | 10.4% |
| Multidisciplinary Studies | 14 | 0.5% |
| Science & Technology | 213 | 8.4% |
| Business | 517 | 20.3% |
| Education | 228 | 9.0% |
| Literature & Languages | 135 | 5.3% |
| Liberal Arts & History | 43 | 1.7% |
| Visual & Performing Arts | 121 | 4.8% |
| Communications | 93 | 3.6% |
| Arts & Humanities | 112 | 4.4% |
| Total | 2,545 | 100.0% |
Transportation & Commute in Lakeland South
Vehicle Availability by Sex in Lakeland South
The most prevalent vehicle ownership categories in Lakeland South are males with 2 vehicles (1,492, accounting for 42.4%) and females with 2 vehicles (1,051, making up 54.4%).
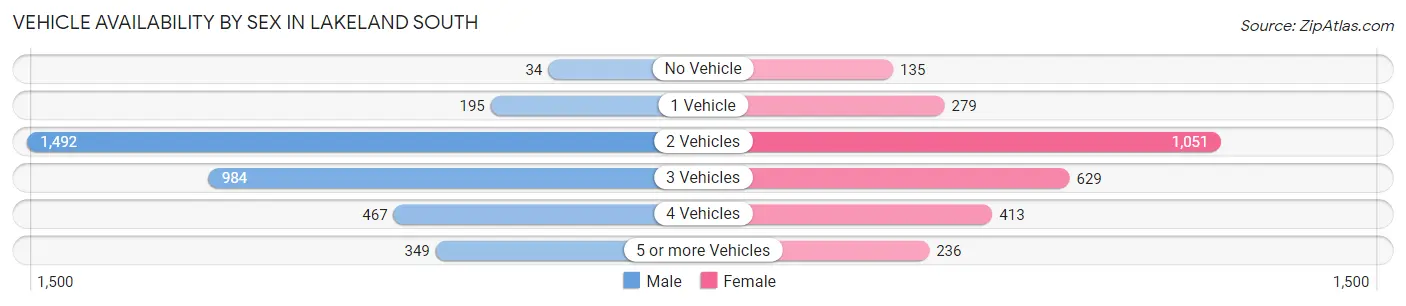
| Vehicles Available | Male | Female |
| No Vehicle | 34 (1.0%) | 135 (4.9%) |
| 1 Vehicle | 195 (5.5%) | 279 (10.2%) |
| 2 Vehicles | 1,492 (42.4%) | 1,051 (38.3%) |
| 3 Vehicles | 984 (28.0%) | 629 (22.9%) |
| 4 Vehicles | 467 (13.3%) | 413 (15.1%) |
| 5 or more Vehicles | 349 (9.9%) | 236 (8.6%) |
| Total | 3,521 (100.0%) | 2,743 (100.0%) |
Commute Time in Lakeland South
The most frequently occuring commute durations in Lakeland South are 30 to 34 minutes (1,006 commuters, 17.4%), 20 to 24 minutes (850 commuters, 14.7%), and 15 to 19 minutes (657 commuters, 11.4%).
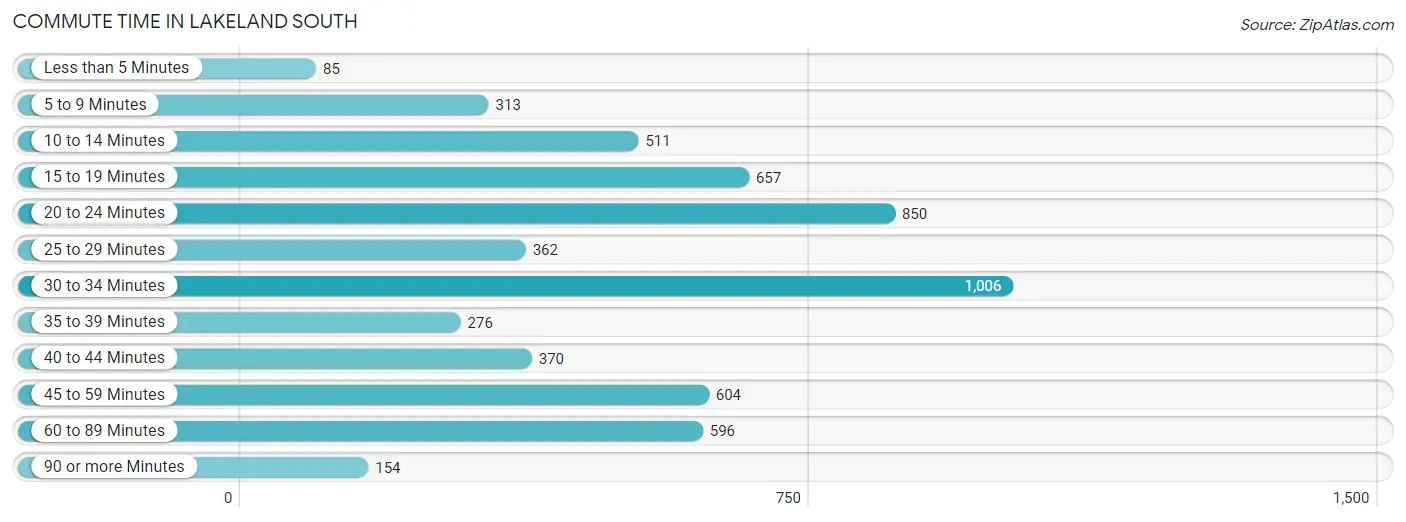
| Commute Time | # Commuters | % Commuters |
| Less than 5 Minutes | 85 | 1.5% |
| 5 to 9 Minutes | 313 | 5.4% |
| 10 to 14 Minutes | 511 | 8.8% |
| 15 to 19 Minutes | 657 | 11.4% |
| 20 to 24 Minutes | 850 | 14.7% |
| 25 to 29 Minutes | 362 | 6.3% |
| 30 to 34 Minutes | 1,006 | 17.4% |
| 35 to 39 Minutes | 276 | 4.8% |
| 40 to 44 Minutes | 370 | 6.4% |
| 45 to 59 Minutes | 604 | 10.4% |
| 60 to 89 Minutes | 596 | 10.3% |
| 90 or more Minutes | 154 | 2.7% |
Commute Time by Sex in Lakeland South
The most common commute times in Lakeland South are 30 to 34 minutes (636 commuters, 19.1%) for males and 30 to 34 minutes (370 commuters, 15.1%) for females.
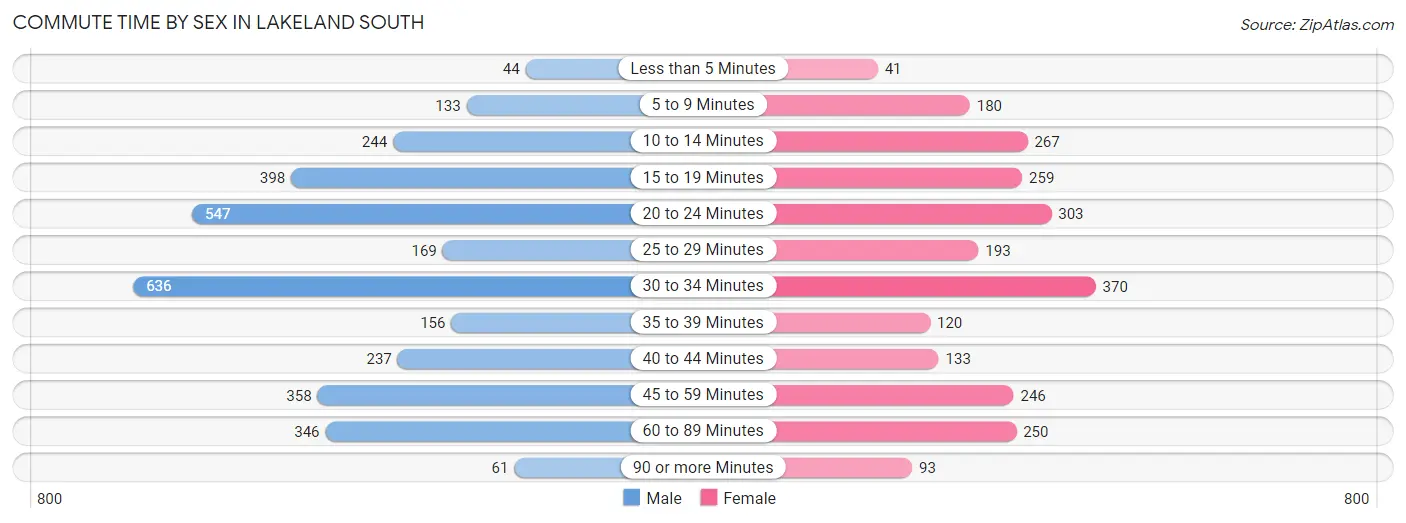
| Commute Time | Male | Female |
| Less than 5 Minutes | 44 (1.3%) | 41 (1.7%) |
| 5 to 9 Minutes | 133 (4.0%) | 180 (7.3%) |
| 10 to 14 Minutes | 244 (7.3%) | 267 (10.9%) |
| 15 to 19 Minutes | 398 (12.0%) | 259 (10.5%) |
| 20 to 24 Minutes | 547 (16.4%) | 303 (12.3%) |
| 25 to 29 Minutes | 169 (5.1%) | 193 (7.9%) |
| 30 to 34 Minutes | 636 (19.1%) | 370 (15.1%) |
| 35 to 39 Minutes | 156 (4.7%) | 120 (4.9%) |
| 40 to 44 Minutes | 237 (7.1%) | 133 (5.4%) |
| 45 to 59 Minutes | 358 (10.7%) | 246 (10.0%) |
| 60 to 89 Minutes | 346 (10.4%) | 250 (10.2%) |
| 90 or more Minutes | 61 (1.8%) | 93 (3.8%) |
Time of Departure to Work by Sex in Lakeland South
The most frequent times of departure to work in Lakeland South are 12:00 AM to 4:59 AM (503, 15.1%) for males and 7:00 AM to 7:29 AM (352, 14.3%) for females.
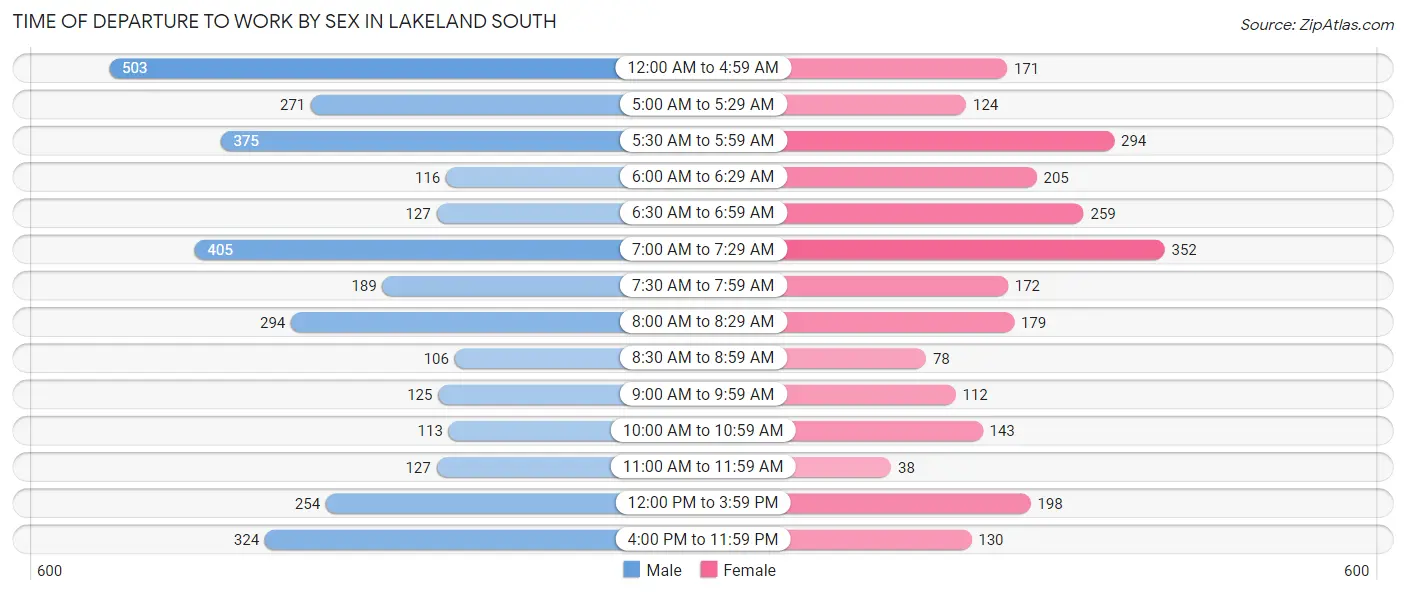
| Time of Departure | Male | Female |
| 12:00 AM to 4:59 AM | 503 (15.1%) | 171 (7.0%) |
| 5:00 AM to 5:29 AM | 271 (8.1%) | 124 (5.1%) |
| 5:30 AM to 5:59 AM | 375 (11.3%) | 294 (12.0%) |
| 6:00 AM to 6:29 AM | 116 (3.5%) | 205 (8.4%) |
| 6:30 AM to 6:59 AM | 127 (3.8%) | 259 (10.5%) |
| 7:00 AM to 7:29 AM | 405 (12.2%) | 352 (14.3%) |
| 7:30 AM to 7:59 AM | 189 (5.7%) | 172 (7.0%) |
| 8:00 AM to 8:29 AM | 294 (8.8%) | 179 (7.3%) |
| 8:30 AM to 8:59 AM | 106 (3.2%) | 78 (3.2%) |
| 9:00 AM to 9:59 AM | 125 (3.7%) | 112 (4.6%) |
| 10:00 AM to 10:59 AM | 113 (3.4%) | 143 (5.8%) |
| 11:00 AM to 11:59 AM | 127 (3.8%) | 38 (1.5%) |
| 12:00 PM to 3:59 PM | 254 (7.6%) | 198 (8.1%) |
| 4:00 PM to 11:59 PM | 324 (9.7%) | 130 (5.3%) |
| Total | 3,329 (100.0%) | 2,455 (100.0%) |
Housing Occupancy in Lakeland South
Occupancy by Ownership in Lakeland South
Of the total 4,433 dwellings in Lakeland South, owner-occupied units account for 3,549 (80.1%), while renter-occupied units make up 884 (19.9%).
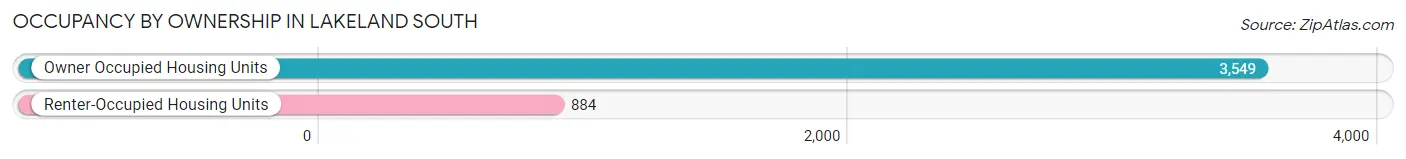
| Occupancy | # Housing Units | % Housing Units |
| Owner Occupied Housing Units | 3,549 | 80.1% |
| Renter-Occupied Housing Units | 884 | 19.9% |
| Total Occupied Housing Units | 4,433 | 100.0% |
Occupancy by Household Size in Lakeland South
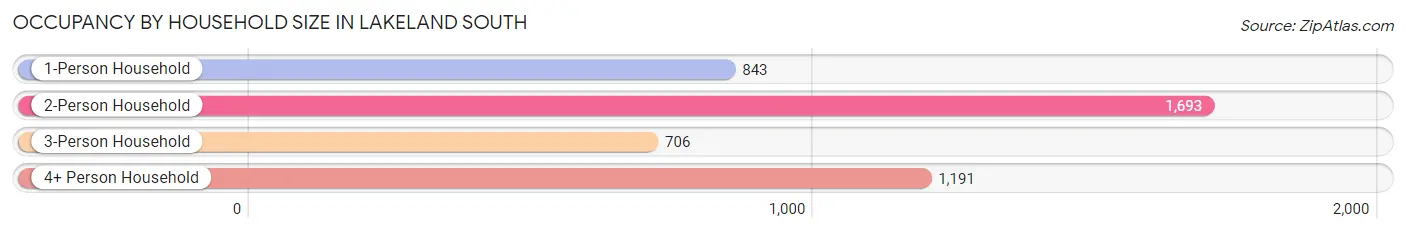
| Household Size | # Housing Units | % Housing Units |
| 1-Person Household | 843 | 19.0% |
| 2-Person Household | 1,693 | 38.2% |
| 3-Person Household | 706 | 15.9% |
| 4+ Person Household | 1,191 | 26.9% |
| Total Housing Units | 4,433 | 100.0% |
Occupancy by Ownership by Household Size in Lakeland South
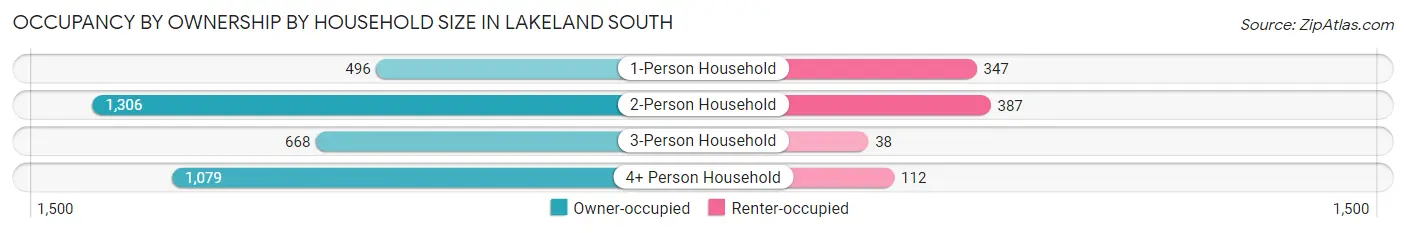
| Household Size | Owner-occupied | Renter-occupied |
| 1-Person Household | 496 (58.8%) | 347 (41.2%) |
| 2-Person Household | 1,306 (77.1%) | 387 (22.9%) |
| 3-Person Household | 668 (94.6%) | 38 (5.4%) |
| 4+ Person Household | 1,079 (90.6%) | 112 (9.4%) |
| Total Housing Units | 3,549 (80.1%) | 884 (19.9%) |
Occupancy by Educational Attainment in Lakeland South
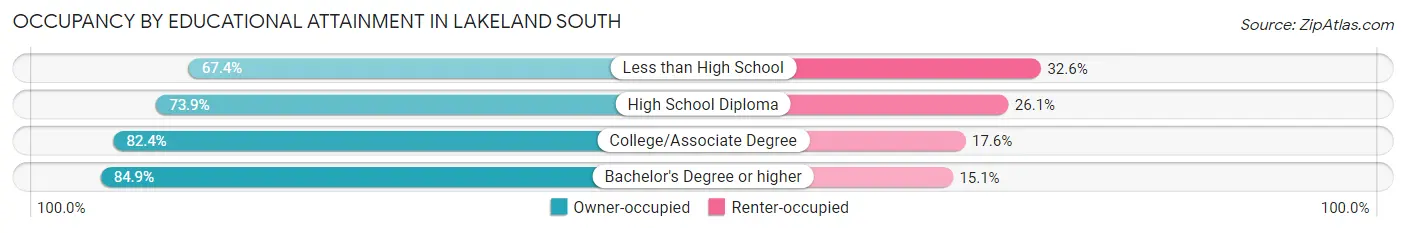
| Household Size | Owner-occupied | Renter-occupied |
| Less than High School | 298 (67.4%) | 144 (32.6%) |
| High School Diploma | 594 (73.9%) | 210 (26.1%) |
| College/Associate Degree | 1,590 (82.4%) | 340 (17.6%) |
| Bachelor's Degree or higher | 1,067 (84.9%) | 190 (15.1%) |
Occupancy by Age of Householder in Lakeland South
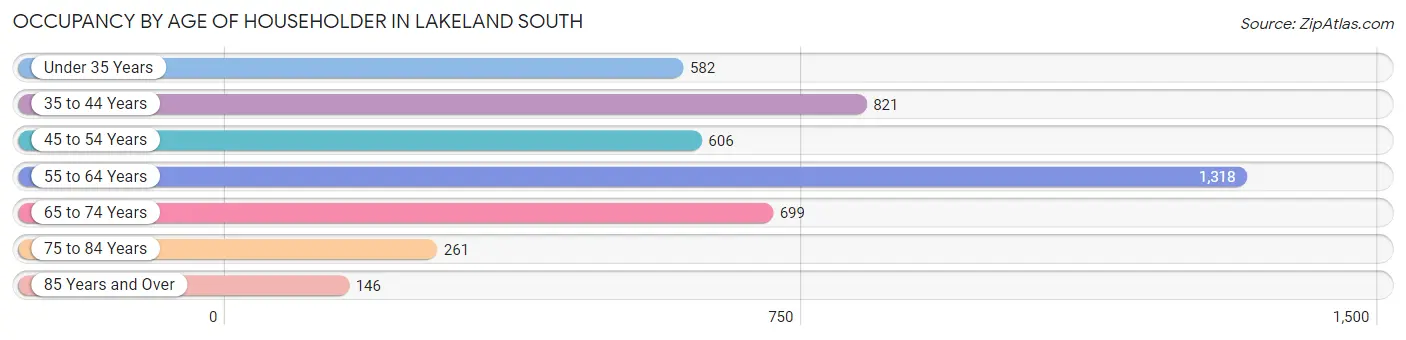
| Age Bracket | # Households | % Households |
| Under 35 Years | 582 | 13.1% |
| 35 to 44 Years | 821 | 18.5% |
| 45 to 54 Years | 606 | 13.7% |
| 55 to 64 Years | 1,318 | 29.7% |
| 65 to 74 Years | 699 | 15.8% |
| 75 to 84 Years | 261 | 5.9% |
| 85 Years and Over | 146 | 3.3% |
| Total | 4,433 | 100.0% |
Housing Finances in Lakeland South
Median Income by Occupancy in Lakeland South
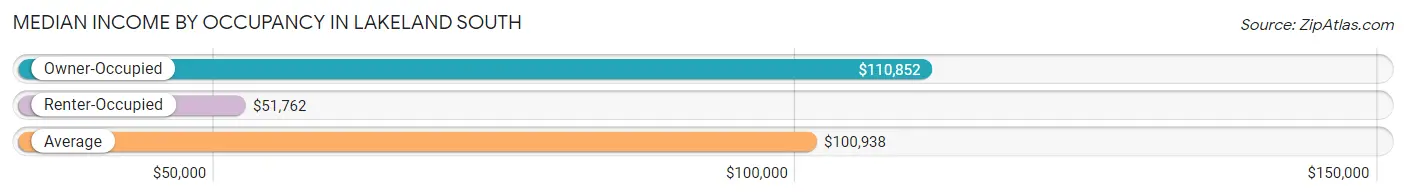
| Occupancy Type | # Households | Median Income |
| Owner-Occupied | 3,549 (80.1%) | $110,852 |
| Renter-Occupied | 884 (19.9%) | $51,762 |
| Average | 4,433 (100.0%) | $100,938 |
Occupancy by Householder Income Bracket in Lakeland South
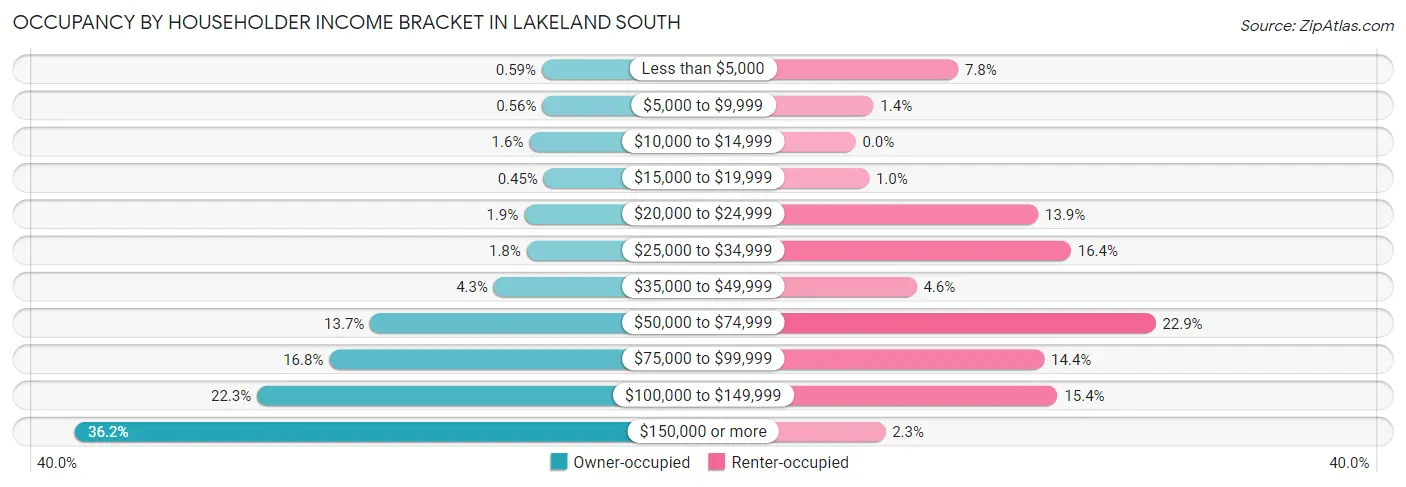
| Income Bracket | Owner-occupied | Renter-occupied |
| Less than $5,000 | 21 (0.6%) | 69 (7.8%) |
| $5,000 to $9,999 | 20 (0.6%) | 12 (1.4%) |
| $10,000 to $14,999 | 55 (1.5%) | 0 (0.0%) |
| $15,000 to $19,999 | 16 (0.4%) | 9 (1.0%) |
| $20,000 to $24,999 | 69 (1.9%) | 123 (13.9%) |
| $25,000 to $34,999 | 62 (1.8%) | 145 (16.4%) |
| $35,000 to $49,999 | 151 (4.3%) | 41 (4.6%) |
| $50,000 to $74,999 | 485 (13.7%) | 202 (22.9%) |
| $75,000 to $99,999 | 596 (16.8%) | 127 (14.4%) |
| $100,000 to $149,999 | 791 (22.3%) | 136 (15.4%) |
| $150,000 or more | 1,283 (36.1%) | 20 (2.3%) |
| Total | 3,549 (100.0%) | 884 (100.0%) |
Monthly Housing Cost Tiers in Lakeland South
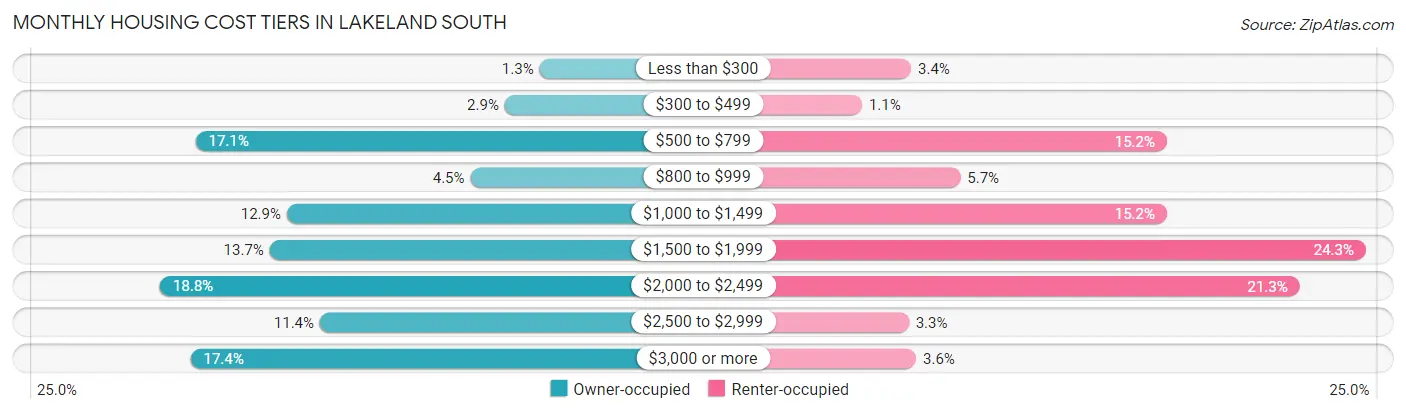
| Monthly Cost | Owner-occupied | Renter-occupied |
| Less than $300 | 46 (1.3%) | 30 (3.4%) |
| $300 to $499 | 103 (2.9%) | 10 (1.1%) |
| $500 to $799 | 608 (17.1%) | 134 (15.2%) |
| $800 to $999 | 159 (4.5%) | 50 (5.7%) |
| $1,000 to $1,499 | 459 (12.9%) | 134 (15.2%) |
| $1,500 to $1,999 | 487 (13.7%) | 215 (24.3%) |
| $2,000 to $2,499 | 666 (18.8%) | 188 (21.3%) |
| $2,500 to $2,999 | 405 (11.4%) | 29 (3.3%) |
| $3,000 or more | 616 (17.4%) | 32 (3.6%) |
| Total | 3,549 (100.0%) | 884 (100.0%) |
Physical Housing Characteristics in Lakeland South
Housing Structures in Lakeland South
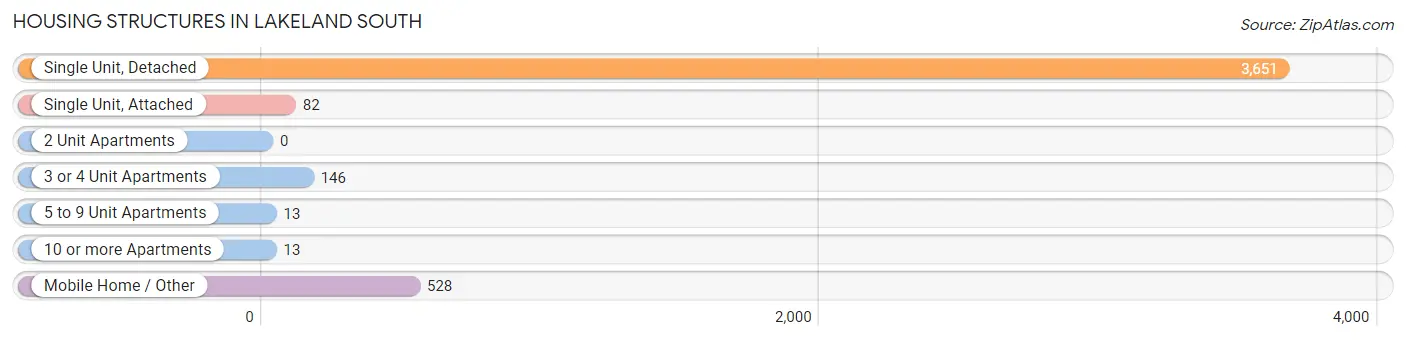
| Structure Type | # Housing Units | % Housing Units |
| Single Unit, Detached | 3,651 | 82.4% |
| Single Unit, Attached | 82 | 1.8% |
| 2 Unit Apartments | 0 | 0.0% |
| 3 or 4 Unit Apartments | 146 | 3.3% |
| 5 to 9 Unit Apartments | 13 | 0.3% |
| 10 or more Apartments | 13 | 0.3% |
| Mobile Home / Other | 528 | 11.9% |
| Total | 4,433 | 100.0% |
Housing Structures by Occupancy in Lakeland South
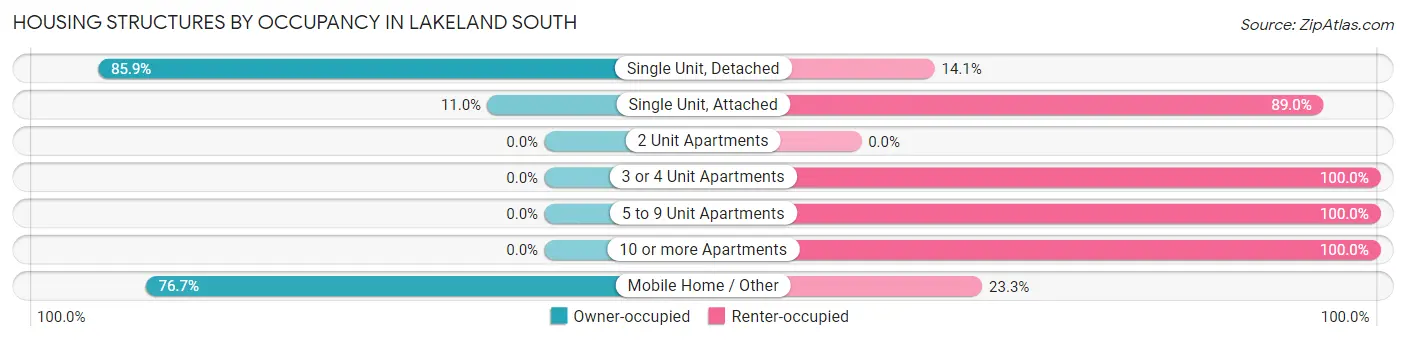
| Structure Type | Owner-occupied | Renter-occupied |
| Single Unit, Detached | 3,135 (85.9%) | 516 (14.1%) |
| Single Unit, Attached | 9 (11.0%) | 73 (89.0%) |
| 2 Unit Apartments | 0 (0.0%) | 0 (0.0%) |
| 3 or 4 Unit Apartments | 0 (0.0%) | 146 (100.0%) |
| 5 to 9 Unit Apartments | 0 (0.0%) | 13 (100.0%) |
| 10 or more Apartments | 0 (0.0%) | 13 (100.0%) |
| Mobile Home / Other | 405 (76.7%) | 123 (23.3%) |
| Total | 3,549 (80.1%) | 884 (19.9%) |
Housing Structures by Number of Rooms in Lakeland South
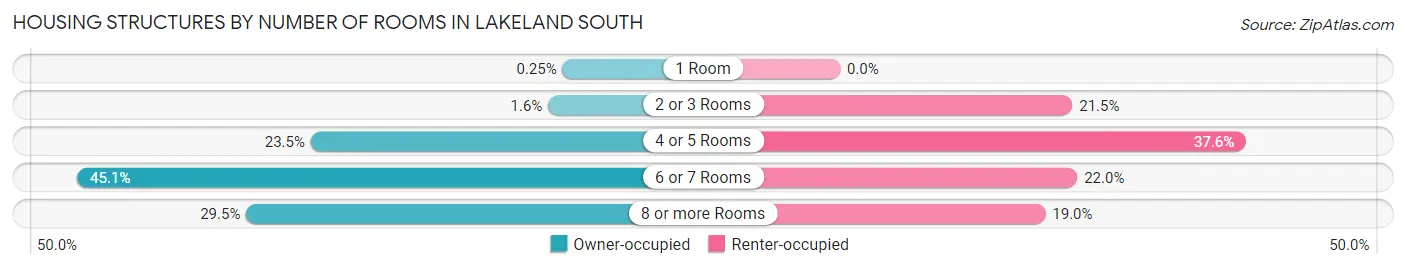
| Number of Rooms | Owner-occupied | Renter-occupied |
| 1 Room | 9 (0.3%) | 0 (0.0%) |
| 2 or 3 Rooms | 56 (1.6%) | 190 (21.5%) |
| 4 or 5 Rooms | 835 (23.5%) | 332 (37.6%) |
| 6 or 7 Rooms | 1,602 (45.1%) | 194 (22.0%) |
| 8 or more Rooms | 1,047 (29.5%) | 168 (19.0%) |
| Total | 3,549 (100.0%) | 884 (100.0%) |
Housing Structure by Heating Type in Lakeland South
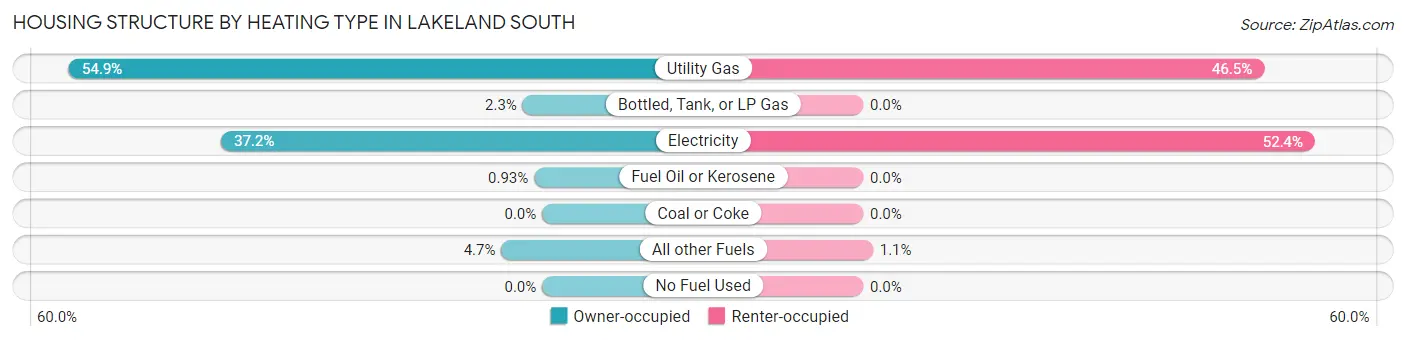
| Heating Type | Owner-occupied | Renter-occupied |
| Utility Gas | 1,947 (54.9%) | 411 (46.5%) |
| Bottled, Tank, or LP Gas | 80 (2.2%) | 0 (0.0%) |
| Electricity | 1,321 (37.2%) | 463 (52.4%) |
| Fuel Oil or Kerosene | 33 (0.9%) | 0 (0.0%) |
| Coal or Coke | 0 (0.0%) | 0 (0.0%) |
| All other Fuels | 168 (4.7%) | 10 (1.1%) |
| No Fuel Used | 0 (0.0%) | 0 (0.0%) |
| Total | 3,549 (100.0%) | 884 (100.0%) |
Household Vehicle Usage in Lakeland South
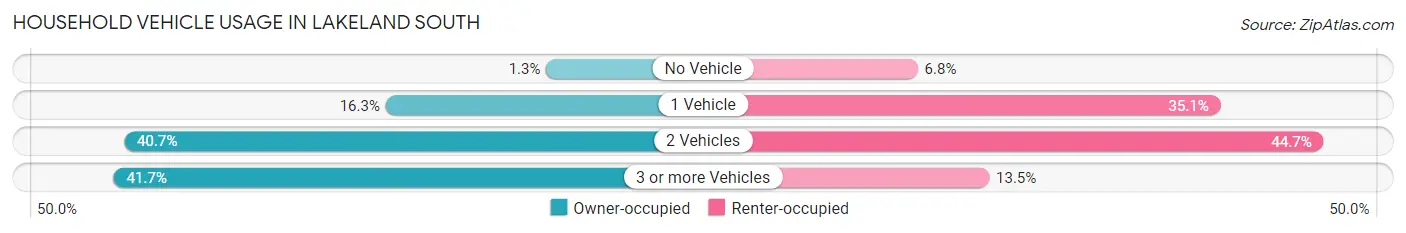
| Vehicles per Household | Owner-occupied | Renter-occupied |
| No Vehicle | 46 (1.3%) | 60 (6.8%) |
| 1 Vehicle | 578 (16.3%) | 310 (35.1%) |
| 2 Vehicles | 1,445 (40.7%) | 395 (44.7%) |
| 3 or more Vehicles | 1,480 (41.7%) | 119 (13.5%) |
| Total | 3,549 (100.0%) | 884 (100.0%) |
Real Estate & Mortgages in Lakeland South
Real Estate and Mortgage Overview in Lakeland South
| Characteristic | Without Mortgage | With Mortgage |
| Housing Units | 1,113 | 2,436 |
| Median Property Value | $389,100 | $494,600 |
| Median Household Income | $83,245 | $1,037 |
| Monthly Housing Costs | $735 | $616 |
| Real Estate Taxes | $4,383 | $65 |
Property Value by Mortgage Status in Lakeland South
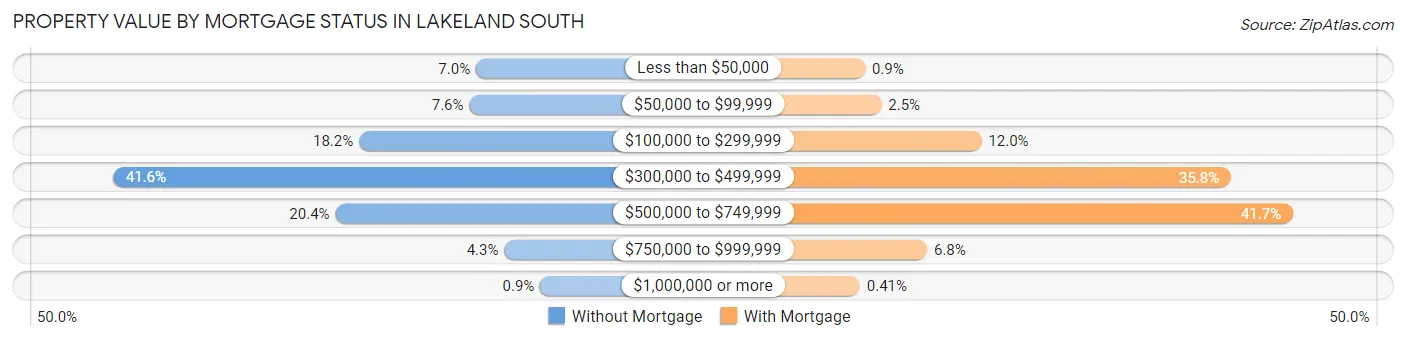
| Property Value | Without Mortgage | With Mortgage |
| Less than $50,000 | 78 (7.0%) | 22 (0.9%) |
| $50,000 to $99,999 | 85 (7.6%) | 60 (2.5%) |
| $100,000 to $299,999 | 202 (18.1%) | 292 (12.0%) |
| $300,000 to $499,999 | 463 (41.6%) | 871 (35.8%) |
| $500,000 to $749,999 | 227 (20.4%) | 1,015 (41.7%) |
| $750,000 to $999,999 | 48 (4.3%) | 166 (6.8%) |
| $1,000,000 or more | 10 (0.9%) | 10 (0.4%) |
| Total | 1,113 (100.0%) | 2,436 (100.0%) |
Household Income by Mortgage Status in Lakeland South
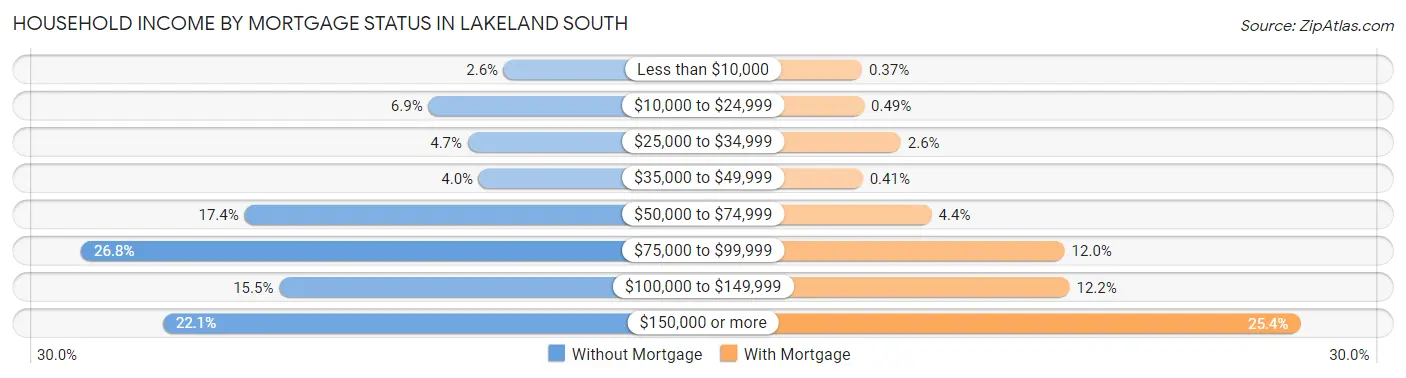
| Household Income | Without Mortgage | With Mortgage |
| Less than $10,000 | 29 (2.6%) | 9 (0.4%) |
| $10,000 to $24,999 | 77 (6.9%) | 12 (0.5%) |
| $25,000 to $34,999 | 52 (4.7%) | 63 (2.6%) |
| $35,000 to $49,999 | 45 (4.0%) | 10 (0.4%) |
| $50,000 to $74,999 | 194 (17.4%) | 106 (4.3%) |
| $75,000 to $99,999 | 298 (26.8%) | 291 (11.9%) |
| $100,000 to $149,999 | 172 (15.4%) | 298 (12.2%) |
| $150,000 or more | 246 (22.1%) | 619 (25.4%) |
| Total | 1,113 (100.0%) | 2,436 (100.0%) |
Property Value to Household Income Ratio in Lakeland South
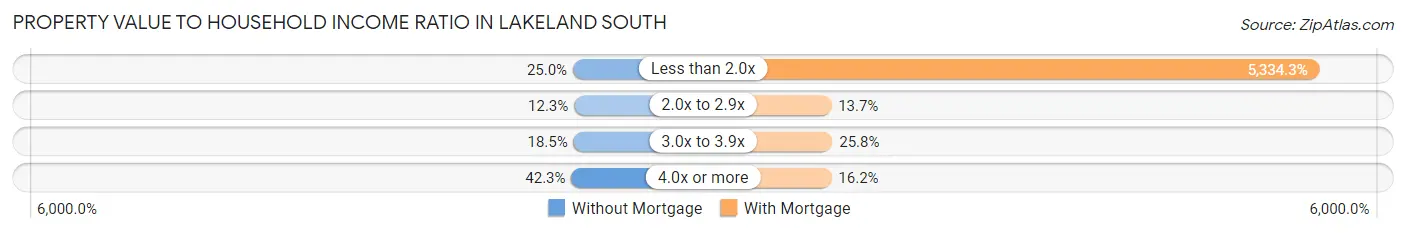
| Value-to-Income Ratio | Without Mortgage | With Mortgage |
| Less than 2.0x | 278 (25.0%) | 129,944 (5,334.3%) |
| 2.0x to 2.9x | 137 (12.3%) | 334 (13.7%) |
| 3.0x to 3.9x | 206 (18.5%) | 628 (25.8%) |
| 4.0x or more | 471 (42.3%) | 394 (16.2%) |
| Total | 1,113 (100.0%) | 2,436 (100.0%) |
Real Estate Taxes by Mortgage Status in Lakeland South
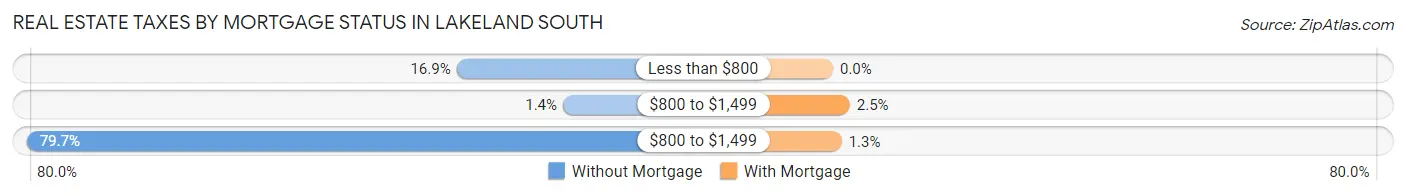
| Property Taxes | Without Mortgage | With Mortgage |
| Less than $800 | 188 (16.9%) | 0 (0.0%) |
| $800 to $1,499 | 15 (1.3%) | 60 (2.5%) |
| $800 to $1,499 | 887 (79.7%) | 31 (1.3%) |
| Total | 1,113 (100.0%) | 2,436 (100.0%) |
Health & Disability in Lakeland South
Health Insurance Coverage by Age in Lakeland South
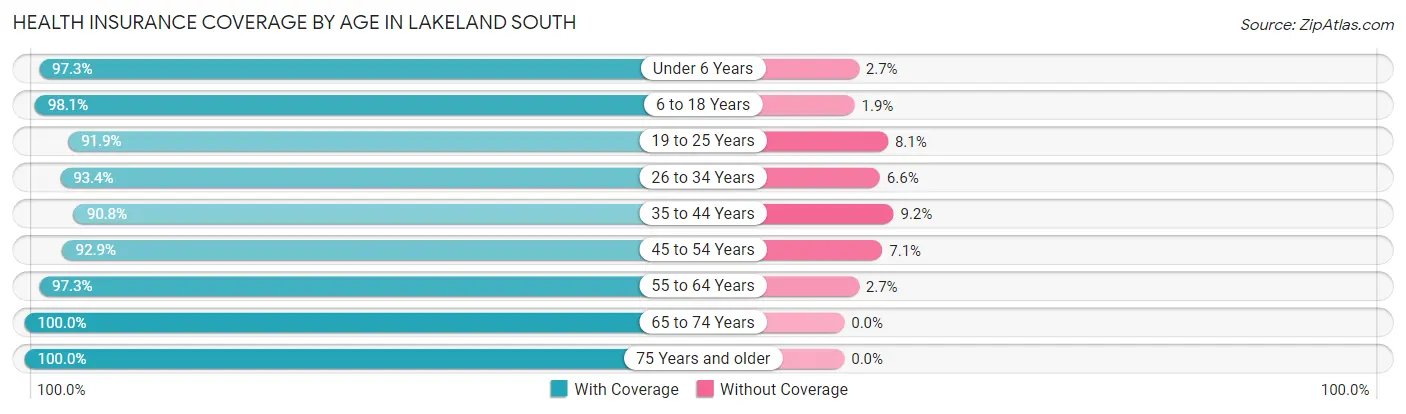
| Age Bracket | With Coverage | Without Coverage |
| Under 6 Years | 718 (97.3%) | 20 (2.7%) |
| 6 to 18 Years | 2,143 (98.1%) | 42 (1.9%) |
| 19 to 25 Years | 824 (91.9%) | 73 (8.1%) |
| 26 to 34 Years | 1,560 (93.4%) | 111 (6.6%) |
| 35 to 44 Years | 1,455 (90.8%) | 147 (9.2%) |
| 45 to 54 Years | 1,216 (92.9%) | 93 (7.1%) |
| 55 to 64 Years | 2,286 (97.3%) | 64 (2.7%) |
| 65 to 74 Years | 1,190 (100.0%) | 0 (0.0%) |
| 75 Years and older | 658 (100.0%) | 0 (0.0%) |
| Total | 12,050 (95.6%) | 550 (4.4%) |
Health Insurance Coverage by Citizenship Status in Lakeland South
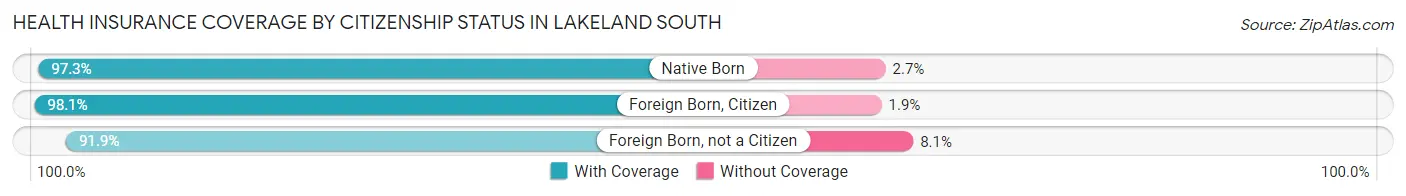
| Citizenship Status | With Coverage | Without Coverage |
| Native Born | 718 (97.3%) | 20 (2.7%) |
| Foreign Born, Citizen | 2,143 (98.1%) | 42 (1.9%) |
| Foreign Born, not a Citizen | 824 (91.9%) | 73 (8.1%) |
Health Insurance Coverage by Household Income in Lakeland South
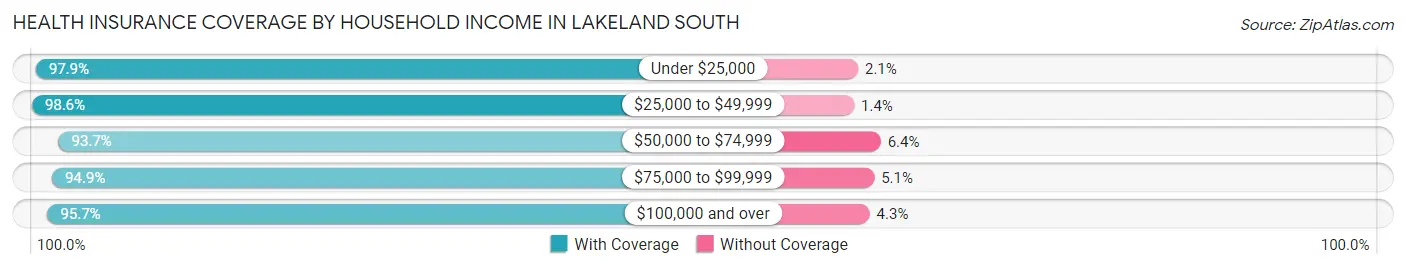
| Household Income | With Coverage | Without Coverage |
| Under $25,000 | 697 (97.9%) | 15 (2.1%) |
| $25,000 to $49,999 | 722 (98.6%) | 10 (1.4%) |
| $50,000 to $74,999 | 1,430 (93.6%) | 97 (6.4%) |
| $75,000 to $99,999 | 1,828 (94.9%) | 99 (5.1%) |
| $100,000 and over | 7,352 (95.7%) | 329 (4.3%) |
Public vs Private Health Insurance Coverage by Age in Lakeland South
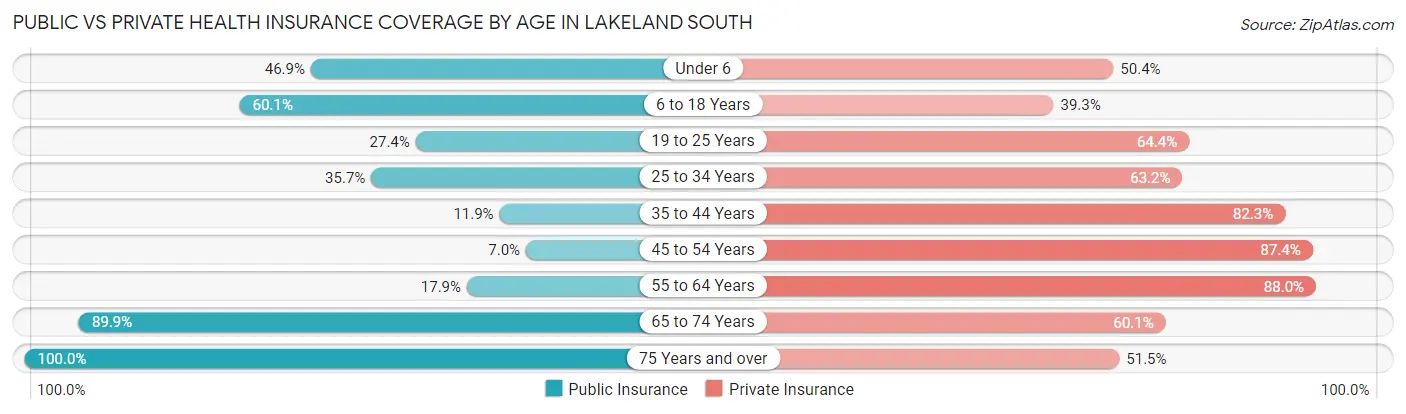
| Age Bracket | Public Insurance | Private Insurance |
| Under 6 | 346 (46.9%) | 372 (50.4%) |
| 6 to 18 Years | 1,313 (60.1%) | 859 (39.3%) |
| 19 to 25 Years | 246 (27.4%) | 578 (64.4%) |
| 25 to 34 Years | 596 (35.7%) | 1,056 (63.2%) |
| 35 to 44 Years | 190 (11.9%) | 1,318 (82.3%) |
| 45 to 54 Years | 91 (7.0%) | 1,144 (87.4%) |
| 55 to 64 Years | 421 (17.9%) | 2,068 (88.0%) |
| 65 to 74 Years | 1,070 (89.9%) | 715 (60.1%) |
| 75 Years and over | 658 (100.0%) | 339 (51.5%) |
| Total | 4,931 (39.1%) | 8,449 (67.1%) |
Disability Status by Sex by Age in Lakeland South
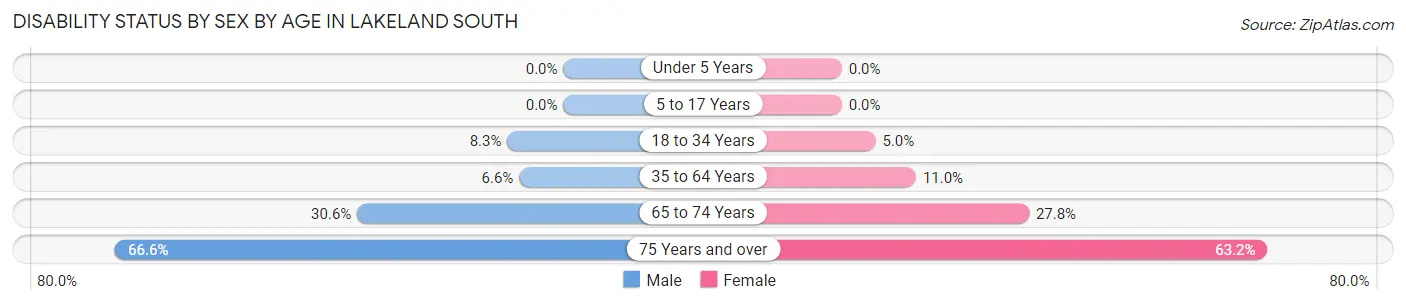
| Age Bracket | Male | Female |
| Under 5 Years | 0 (0.0%) | 0 (0.0%) |
| 5 to 17 Years | 0 (0.0%) | 0 (0.0%) |
| 18 to 34 Years | 113 (8.3%) | 75 (5.0%) |
| 35 to 64 Years | 180 (6.6%) | 277 (11.0%) |
| 65 to 74 Years | 241 (30.6%) | 112 (27.8%) |
| 75 Years and over | 183 (66.5%) | 242 (63.2%) |
Disability Class by Sex by Age in Lakeland South
Disability Class: Hearing Difficulty
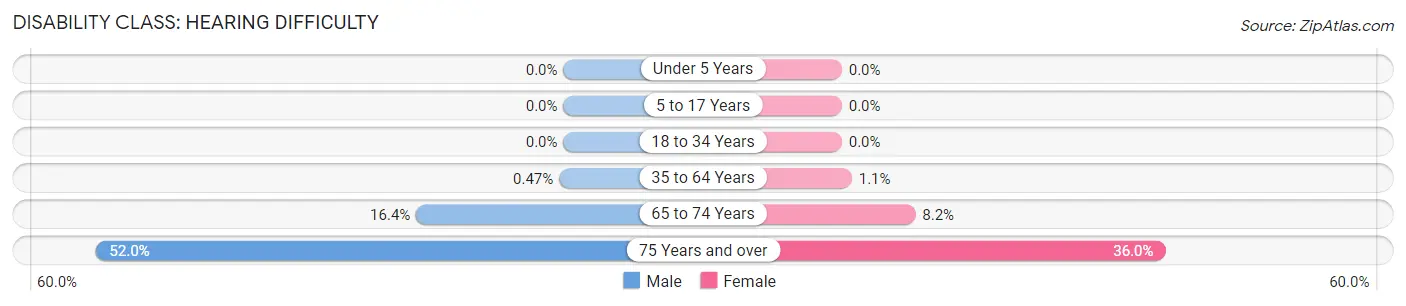
| Age Bracket | Male | Female |
| Under 5 Years | 0 (0.0%) | 0 (0.0%) |
| 5 to 17 Years | 0 (0.0%) | 0 (0.0%) |
| 18 to 34 Years | 0 (0.0%) | 0 (0.0%) |
| 35 to 64 Years | 13 (0.5%) | 28 (1.1%) |
| 65 to 74 Years | 129 (16.4%) | 33 (8.2%) |
| 75 Years and over | 143 (52.0%) | 138 (36.0%) |
Disability Class: Vision Difficulty
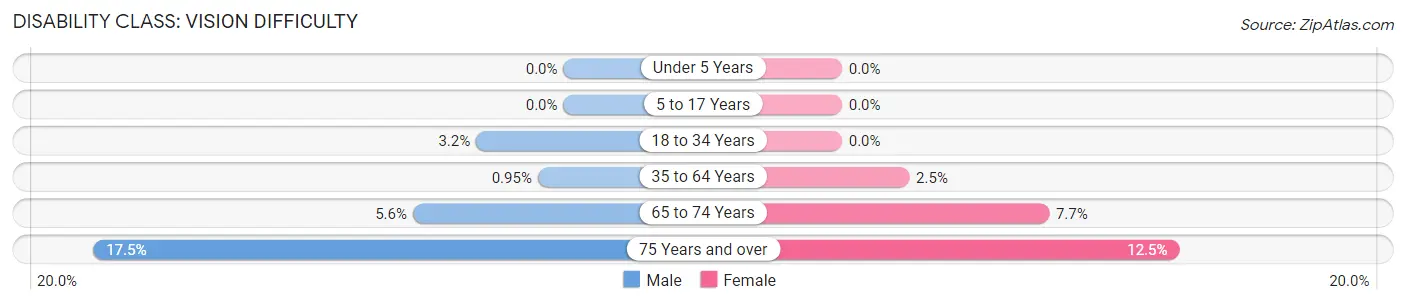
| Age Bracket | Male | Female |
| Under 5 Years | 0 (0.0%) | 0 (0.0%) |
| 5 to 17 Years | 0 (0.0%) | 0 (0.0%) |
| 18 to 34 Years | 44 (3.2%) | 0 (0.0%) |
| 35 to 64 Years | 26 (0.9%) | 63 (2.5%) |
| 65 to 74 Years | 44 (5.6%) | 31 (7.7%) |
| 75 Years and over | 48 (17.4%) | 48 (12.5%) |
Disability Class: Cognitive Difficulty
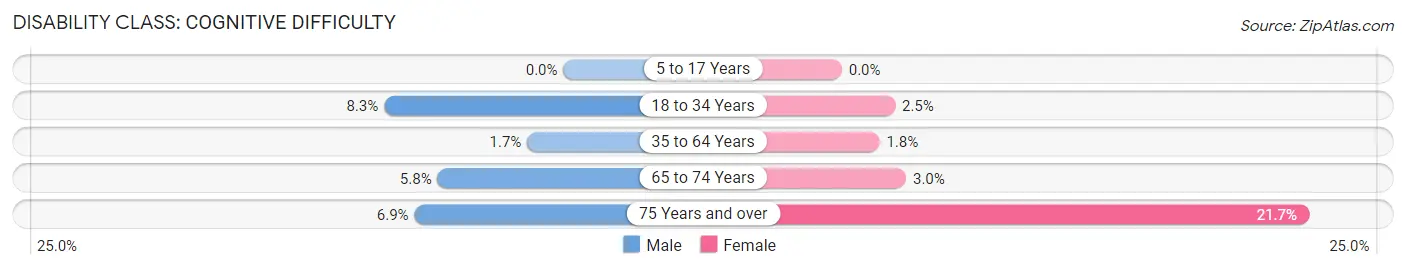
| Age Bracket | Male | Female |
| 5 to 17 Years | 0 (0.0%) | 0 (0.0%) |
| 18 to 34 Years | 113 (8.3%) | 37 (2.5%) |
| 35 to 64 Years | 46 (1.7%) | 44 (1.8%) |
| 65 to 74 Years | 46 (5.8%) | 12 (3.0%) |
| 75 Years and over | 19 (6.9%) | 83 (21.7%) |
Disability Class: Ambulatory Difficulty
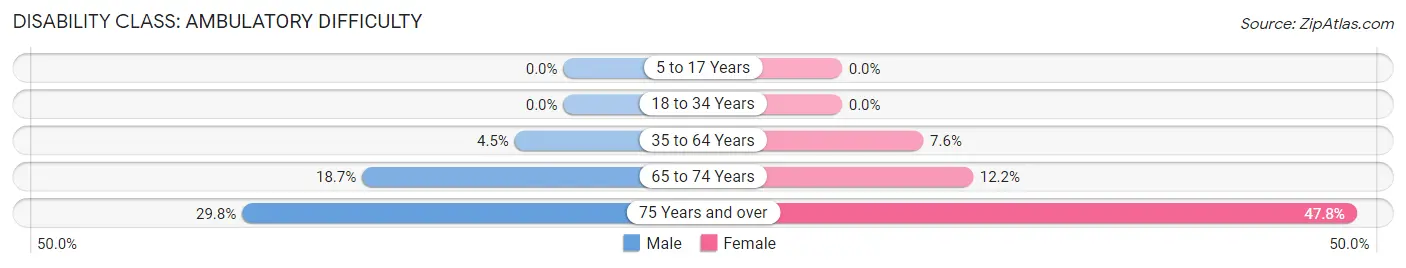
| Age Bracket | Male | Female |
| 5 to 17 Years | 0 (0.0%) | 0 (0.0%) |
| 18 to 34 Years | 0 (0.0%) | 0 (0.0%) |
| 35 to 64 Years | 124 (4.5%) | 190 (7.5%) |
| 65 to 74 Years | 147 (18.7%) | 49 (12.2%) |
| 75 Years and over | 82 (29.8%) | 183 (47.8%) |
Disability Class: Self-Care Difficulty
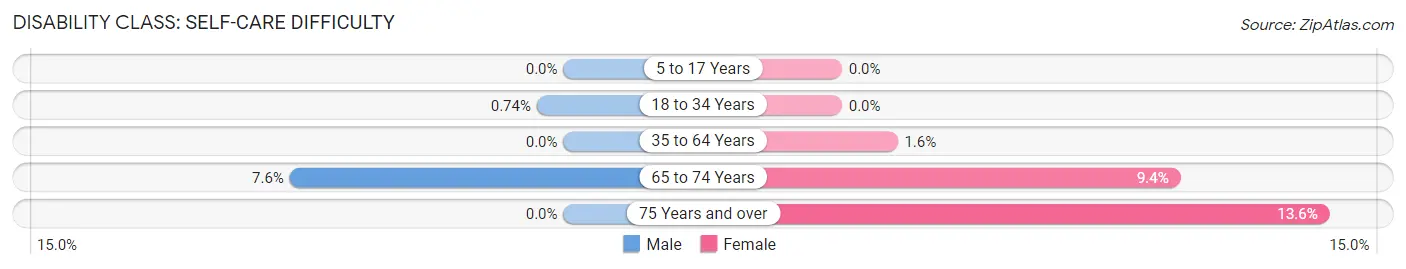
| Age Bracket | Male | Female |
| 5 to 17 Years | 0 (0.0%) | 0 (0.0%) |
| 18 to 34 Years | 10 (0.7%) | 0 (0.0%) |
| 35 to 64 Years | 0 (0.0%) | 39 (1.5%) |
| 65 to 74 Years | 60 (7.6%) | 38 (9.4%) |
| 75 Years and over | 0 (0.0%) | 52 (13.6%) |
Technology Access in Lakeland South
Computing Device Access in Lakeland South
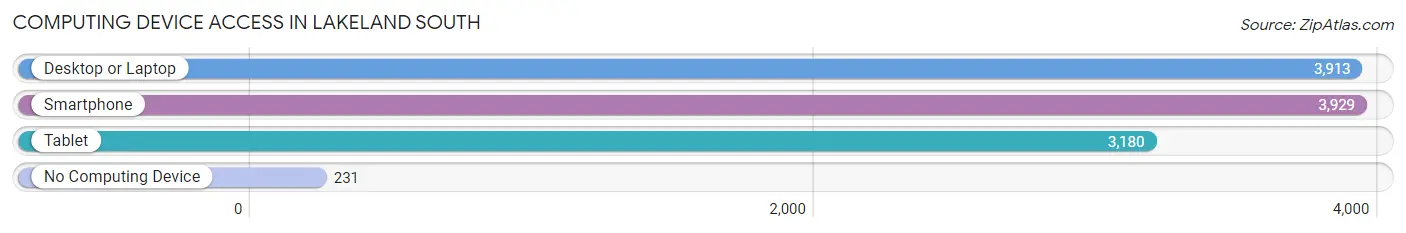
| Device Type | # Households | % Households |
| Desktop or Laptop | 3,913 | 88.3% |
| Smartphone | 3,929 | 88.6% |
| Tablet | 3,180 | 71.7% |
| No Computing Device | 231 | 5.2% |
| Total | 4,433 | 100.0% |
Internet Access in Lakeland South
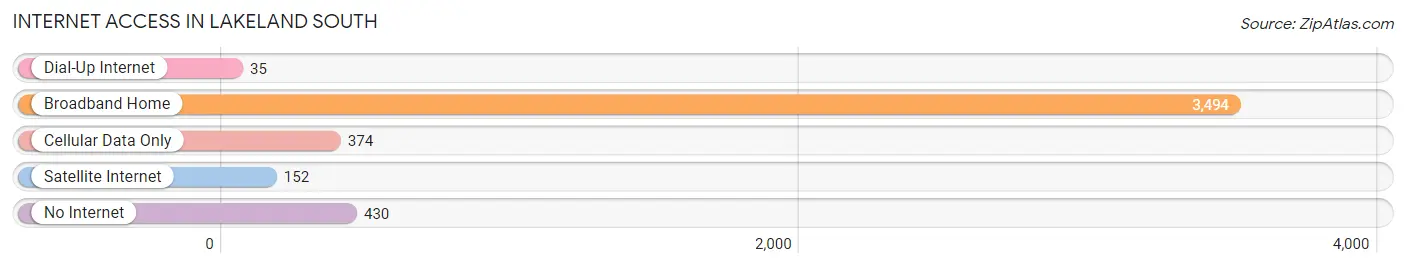
| Internet Type | # Households | % Households |
| Dial-Up Internet | 35 | 0.8% |
| Broadband Home | 3,494 | 78.8% |
| Cellular Data Only | 374 | 8.4% |
| Satellite Internet | 152 | 3.4% |
| No Internet | 430 | 9.7% |
| Total | 4,433 | 100.0% |
Lakeland South Summary
Lakeland South is a small unincorporated community located in Pierce County, Washington, United States. It is situated on the south shore of Lake Tapps, a reservoir created by the construction of the Lake Tapps Dam in 1911. The community is located approximately 25 miles southeast of Tacoma and 30 miles northwest of Seattle.
History
The area that is now Lakeland South was originally inhabited by the Puyallup Tribe of Native Americans. The first non-native settlers arrived in the area in the late 1800s, and the community was officially established in the early 1900s. The area was originally known as "Lakeland," but the name was changed to "Lakeland South" in the 1950s to distinguish it from the nearby community of Lakeland North.
Geography
Lakeland South is located in Pierce County, Washington, on the south shore of Lake Tapps. The community is situated at an elevation of approximately 400 feet above sea level. The area is characterized by rolling hills and lush forests, and is home to a variety of wildlife, including deer, elk, and bald eagles.
Economy
The economy of Lakeland South is largely based on tourism and recreation. The area is home to several popular recreational activities, including fishing, boating, and camping. The community is also home to several businesses, including restaurants, convenience stores, and a marina.
Demographics
As of the 2010 census, the population of Lakeland South was 1,845. The racial makeup of the community was 94.3% White, 0.7% African American, 0.7% Native American, 0.7% Asian, 0.2% Pacific Islander, and 2.6% from other races. The median household income was $60,938, and the median family income was $68,958.
Conclusion
Lakeland South is a small unincorporated community located in Pierce County, Washington. It is situated on the south shore of Lake Tapps, and is home to a variety of recreational activities. The economy of the community is largely based on tourism and recreation, and the population is primarily White.
Common Questions
What is Per Capita Income in Lakeland South?
Per Capita income in Lakeland South is $43,772.
What is the Median Family Income in Lakeland South?
Median Family Income in Lakeland South is $109,082.
What is the Median Household income in Lakeland South?
Median Household Income in Lakeland South is $100,938.
What is Income or Wage Gap in Lakeland South?
Income or Wage Gap in Lakeland South is 28.8%.
Women in Lakeland South earn 71.2 cents for every dollar earned by a man.
What is Family Income Deficit in Lakeland South?
Family Income Deficit in Lakeland South is $12,704.
Families that are below poverty line in Lakeland South earn $12,704 less on average than the poverty threshold level.
What is Inequality or Gini Index in Lakeland South?
Inequality or Gini Index in Lakeland South is 0.38.
What is the Total Population of Lakeland South?
Total Population of Lakeland South is 12,606.
What is the Total Male Population of Lakeland South?
Total Male Population of Lakeland South is 6,780.
What is the Total Female Population of Lakeland South?
Total Female Population of Lakeland South is 5,826.
What is the Ratio of Males per 100 Females in Lakeland South?
There are 116.37 Males per 100 Females in Lakeland South.
What is the Ratio of Females per 100 Males in Lakeland South?
There are 85.93 Females per 100 Males in Lakeland South.
What is the Median Population Age in Lakeland South?
Median Population Age in Lakeland South is 40.9 Years.
What is the Average Family Size in Lakeland South
Average Family Size in Lakeland South is 3.3 People.
What is the Average Household Size in Lakeland South
Average Household Size in Lakeland South is 2.8 People.
How Large is the Labor Force in Lakeland South?
There are 6,790 People in the Labor Forcein in Lakeland South.
What is the Percentage of People in the Labor Force in Lakeland South?
66.1% of People are in the Labor Force in Lakeland South.
What is the Unemployment Rate in Lakeland South?
Unemployment Rate in Lakeland South is 6.2%.