Esperance, WA Map & Demographics
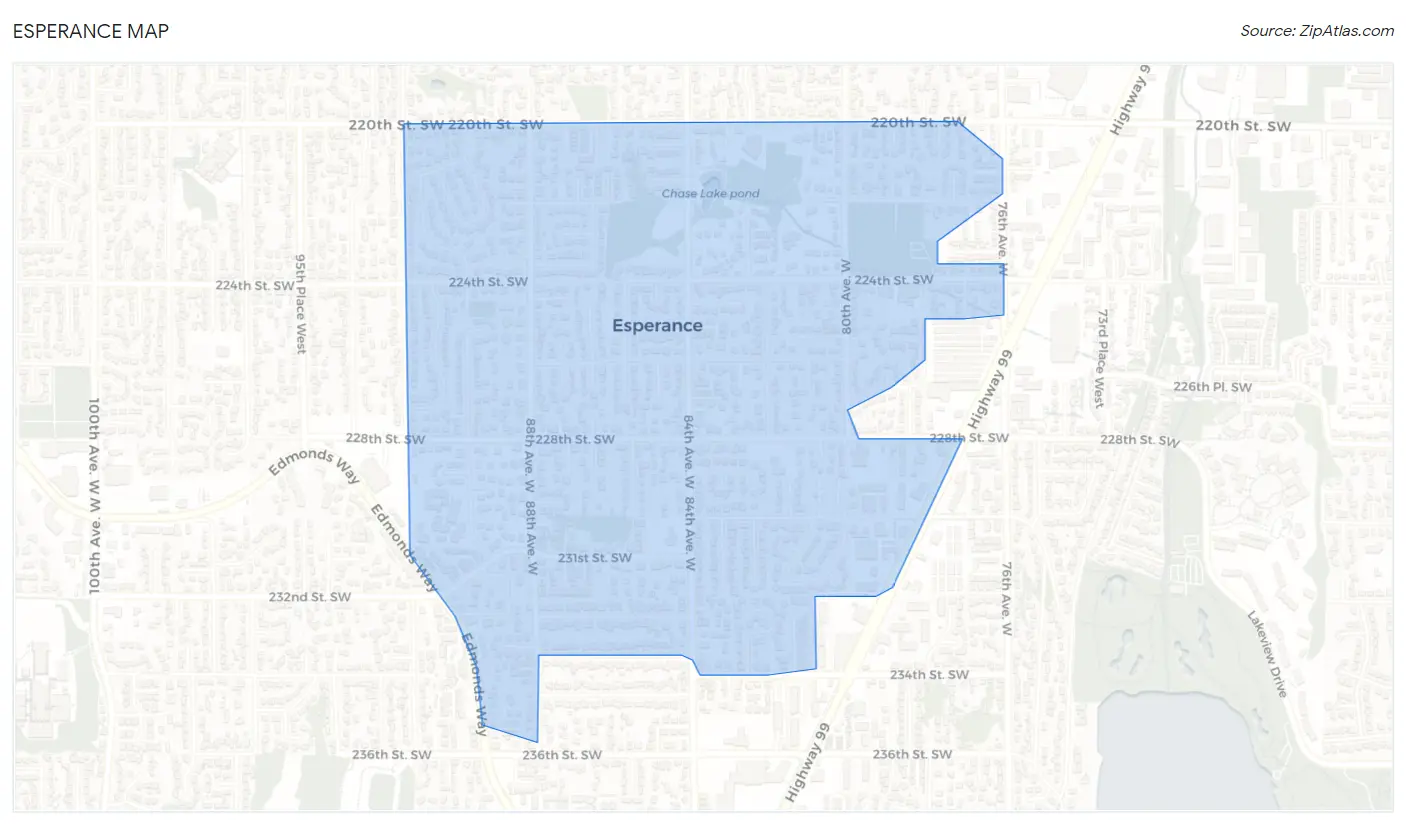
Esperance Map
Esperance Overview
$48,702
PER CAPITA INCOME
$129,596
AVG FAMILY INCOME
$123,309
AVG HOUSEHOLD INCOME
19.4%
WAGE / INCOME GAP [ % ]
80.6¢/ $1
WAGE / INCOME GAP [ $ ]
0.34
INEQUALITY / GINI INDEX
4,268
TOTAL POPULATION
2,133
MALE POPULATION
2,135
FEMALE POPULATION
99.91
MALES / 100 FEMALES
100.09
FEMALES / 100 MALES
40.3
MEDIAN AGE
3.1
AVG FAMILY SIZE
2.8
AVG HOUSEHOLD SIZE
2,318
LABOR FORCE [ PEOPLE ]
66.6%
PERCENT IN LABOR FORCE
3.0%
UNEMPLOYMENT RATE
Income in Esperance
Income Overview in Esperance
Per Capita Income in Esperance is $48,702, while median incomes of families and households are $129,596 and $123,309 respectively.
| Characteristic | Number | Measure |
| Per Capita Income | 4,268 | $48,702 |
| Median Family Income | 1,000 | $129,596 |
| Mean Family Income | 1,000 | $163,071 |
| Median Household Income | 1,489 | $123,309 |
| Mean Household Income | 1,489 | $137,634 |
| Income Deficit | 1,000 | $0 |
| Wage / Income Gap (%) | 4,268 | 19.39% |
| Wage / Income Gap ($) | 4,268 | 80.61¢ per $1 |
| Gini / Inequality Index | 4,268 | 0.34 |
Earnings by Sex in Esperance
Average Earnings in Esperance are $59,428, $69,512 for men and $56,032 for women, a difference of 19.4%.
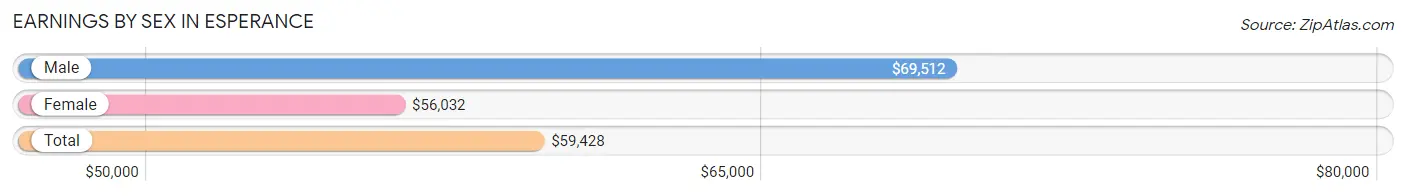
| Sex | Number | Average Earnings |
| Male | 1,124 (45.7%) | $69,512 |
| Female | 1,336 (54.3%) | $56,032 |
| Total | 2,460 (100.0%) | $59,428 |
Earnings by Sex by Income Bracket in Esperance
The most common earnings brackets in Esperance are $100,000+ for men (332 | 29.5%) and $55,000 to $64,999 for women (302 | 22.6%).
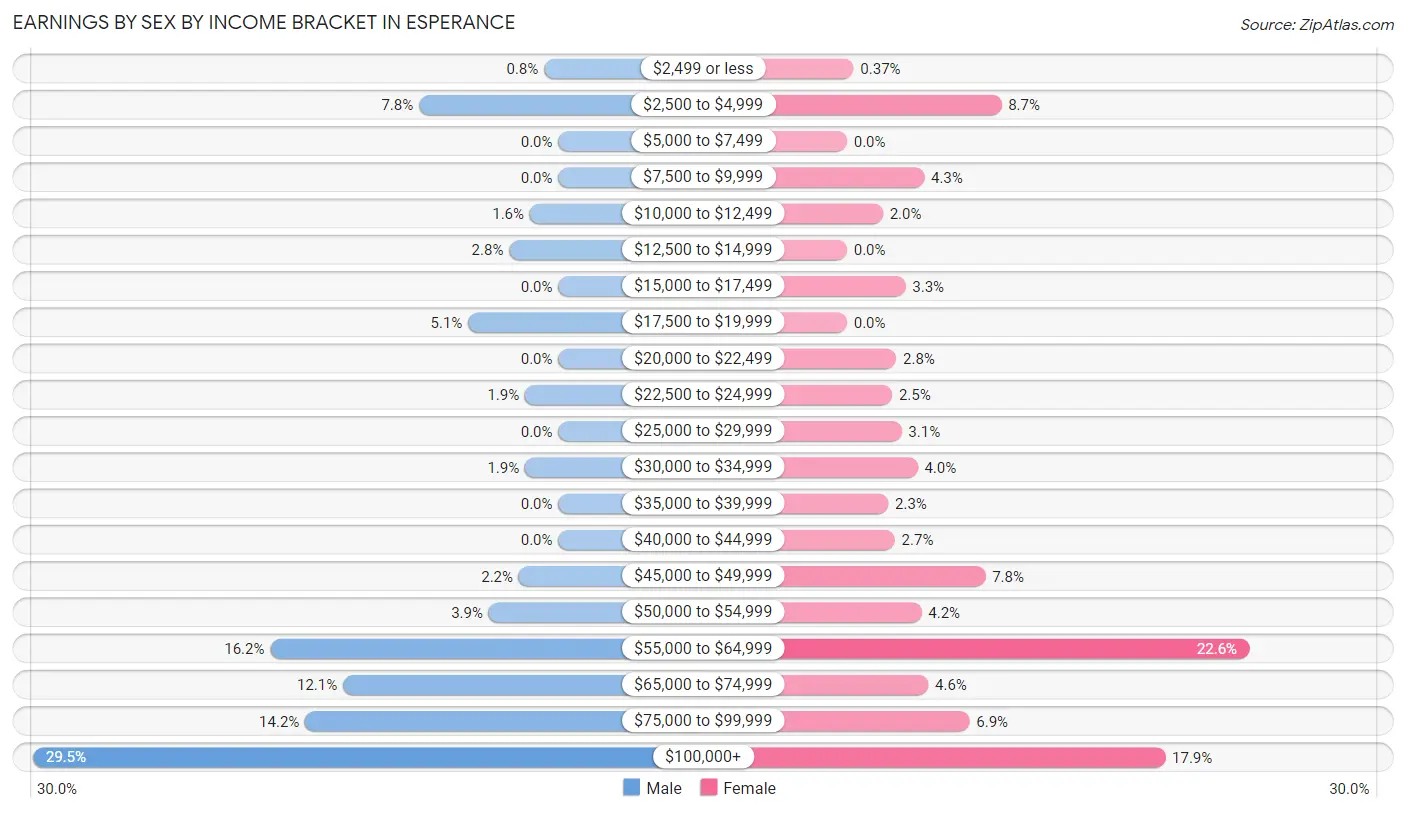
| Income | Male | Female |
| $2,499 or less | 9 (0.8%) | 5 (0.4%) |
| $2,500 to $4,999 | 88 (7.8%) | 116 (8.7%) |
| $5,000 to $7,499 | 0 (0.0%) | 0 (0.0%) |
| $7,500 to $9,999 | 0 (0.0%) | 58 (4.3%) |
| $10,000 to $12,499 | 18 (1.6%) | 27 (2.0%) |
| $12,500 to $14,999 | 31 (2.8%) | 0 (0.0%) |
| $15,000 to $17,499 | 0 (0.0%) | 44 (3.3%) |
| $17,500 to $19,999 | 57 (5.1%) | 0 (0.0%) |
| $20,000 to $22,499 | 0 (0.0%) | 37 (2.8%) |
| $22,500 to $24,999 | 21 (1.9%) | 34 (2.5%) |
| $25,000 to $29,999 | 0 (0.0%) | 41 (3.1%) |
| $30,000 to $34,999 | 21 (1.9%) | 53 (4.0%) |
| $35,000 to $39,999 | 0 (0.0%) | 31 (2.3%) |
| $40,000 to $44,999 | 0 (0.0%) | 36 (2.7%) |
| $45,000 to $49,999 | 25 (2.2%) | 104 (7.8%) |
| $50,000 to $54,999 | 44 (3.9%) | 56 (4.2%) |
| $55,000 to $64,999 | 182 (16.2%) | 302 (22.6%) |
| $65,000 to $74,999 | 136 (12.1%) | 61 (4.6%) |
| $75,000 to $99,999 | 160 (14.2%) | 92 (6.9%) |
| $100,000+ | 332 (29.5%) | 239 (17.9%) |
| Total | 1,124 (100.0%) | 1,336 (100.0%) |
Earnings by Sex by Educational Attainment in Esperance
Average earnings in Esperance are $71,935 for men and $58,559 for women, a difference of 18.6%. Men with an educational attainment of graduate degree enjoy the highest average annual earnings of $135,618, while those with high school diploma education earn the least with $56,635. Women with an educational attainment of bachelor's degree earn the most with the average annual earnings of $60,117, while those with high school diploma education have the smallest earnings of $48,167.
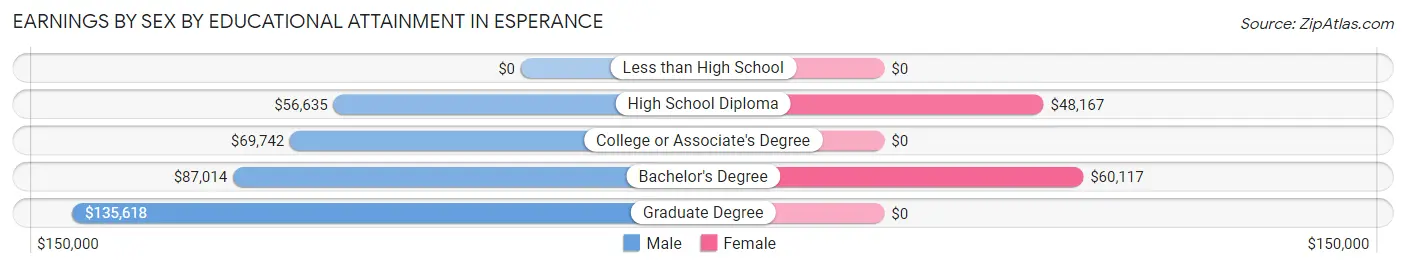
| Educational Attainment | Male Income | Female Income |
| Less than High School | - | - |
| High School Diploma | $56,635 | $48,167 |
| College or Associate's Degree | $69,742 | $0 |
| Bachelor's Degree | $87,014 | $60,117 |
| Graduate Degree | $135,618 | $0 |
| Total | $71,935 | $58,559 |
Family Income in Esperance
Family Income Brackets in Esperance
According to the Esperance family income data, there are 429 families falling into the $100,000 to $149,999 income range, which is the most common income bracket and makes up 42.9% of all families.
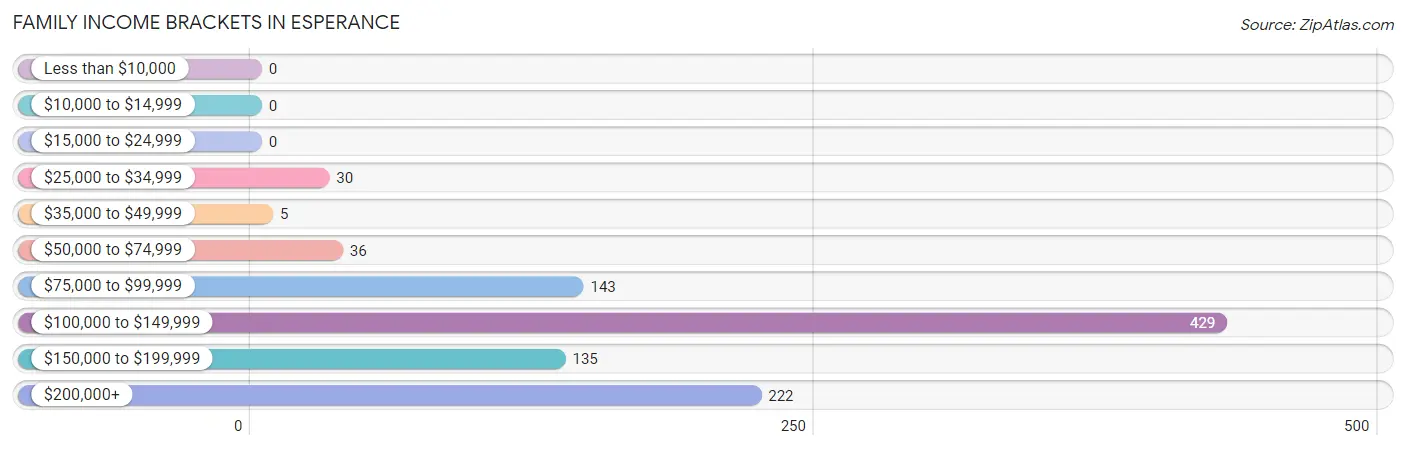
| Income Bracket | # Families | % Families |
| Less than $10,000 | 0 | 0.0% |
| $10,000 to $14,999 | 0 | 0.0% |
| $15,000 to $24,999 | 0 | 0.0% |
| $25,000 to $34,999 | 30 | 3.0% |
| $35,000 to $49,999 | 5 | 0.5% |
| $50,000 to $74,999 | 36 | 3.6% |
| $75,000 to $99,999 | 143 | 14.3% |
| $100,000 to $149,999 | 429 | 42.9% |
| $150,000 to $199,999 | 135 | 13.5% |
| $200,000+ | 222 | 22.2% |
Family Income by Famaliy Size in Esperance
4-person families (172 | 17.2%) account for the highest median family income in Esperance with $179,167 per family, while 2-person families (351 | 35.1%) have the highest median income of $52,254 per family member.
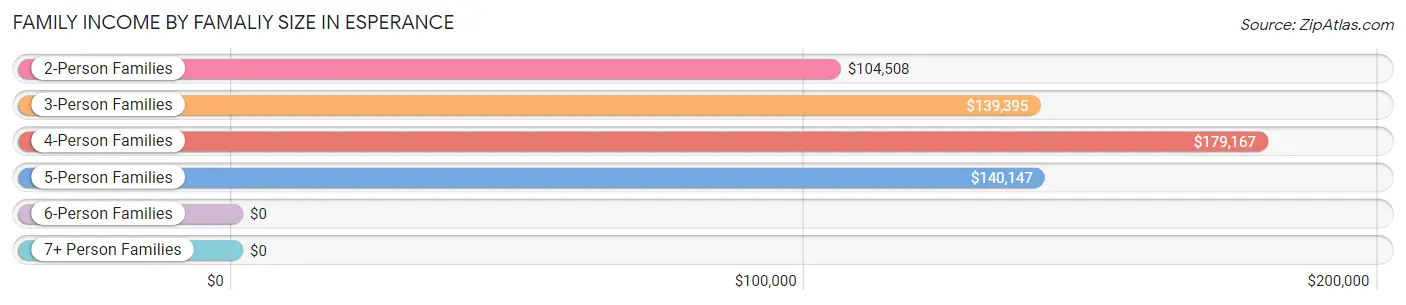
| Income Bracket | # Families | Median Income |
| 2-Person Families | 351 (35.1%) | $104,508 |
| 3-Person Families | 291 (29.1%) | $139,395 |
| 4-Person Families | 172 (17.2%) | $179,167 |
| 5-Person Families | 186 (18.6%) | $140,147 |
| 6-Person Families | 0 (0.0%) | $0 |
| 7+ Person Families | 0 (0.0%) | $0 |
| Total | 1,000 (100.0%) | $129,596 |
Family Income by Number of Earners in Esperance
The median family income in Esperance is $129,596, with families comprising 3+ earners (168) having the highest median family income of $170,217, while families with no earners (88) have the lowest median family income of $77,031, accounting for 16.8% and 8.8% of families, respectively.
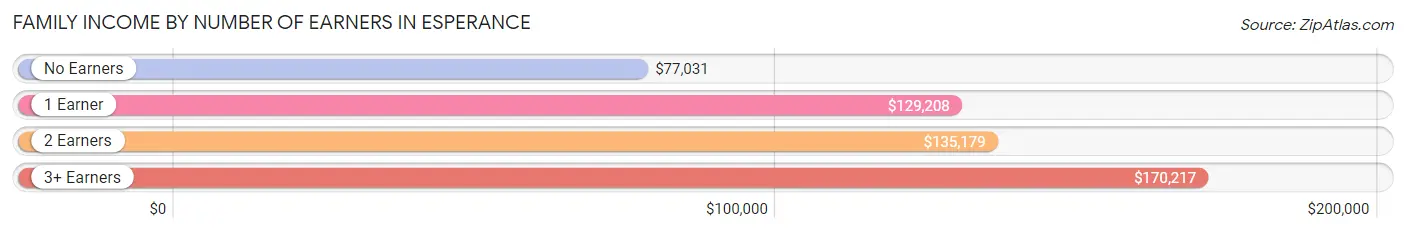
| Number of Earners | # Families | Median Income |
| No Earners | 88 (8.8%) | $77,031 |
| 1 Earner | 186 (18.6%) | $129,208 |
| 2 Earners | 558 (55.8%) | $135,179 |
| 3+ Earners | 168 (16.8%) | $170,217 |
| Total | 1,000 (100.0%) | $129,596 |
Household Income in Esperance
Household Income Brackets in Esperance
With 456 households falling in the category, the $100,000 to $149,999 income range is the most frequent in Esperance, accounting for 30.6% of all households.
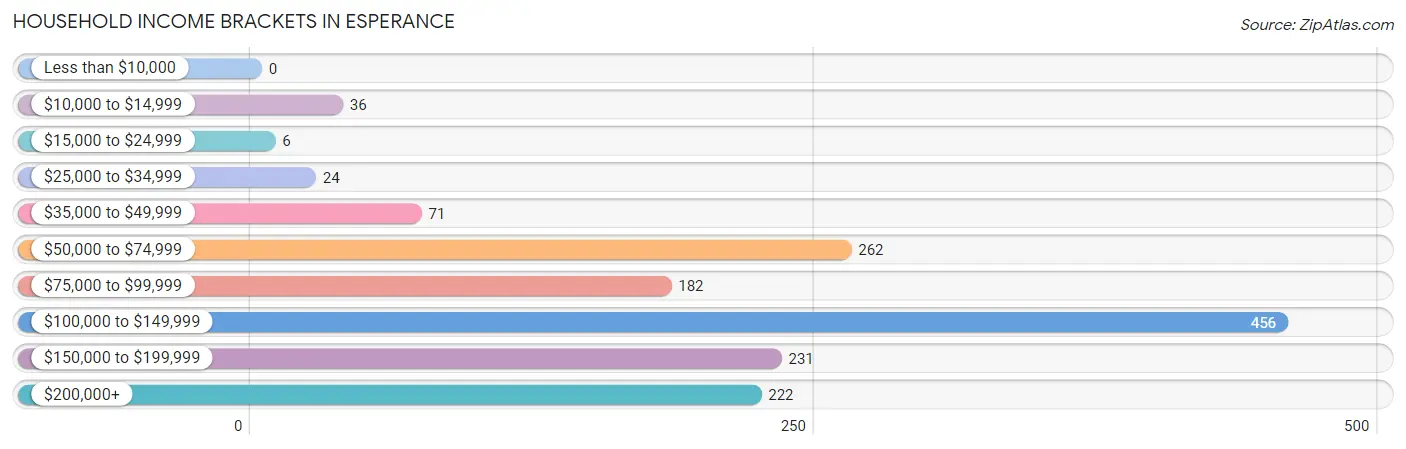
| Income Bracket | # Households | % Households |
| Less than $10,000 | 0 | 0.0% |
| $10,000 to $14,999 | 36 | 2.4% |
| $15,000 to $24,999 | 6 | 0.4% |
| $25,000 to $34,999 | 24 | 1.6% |
| $35,000 to $49,999 | 71 | 4.8% |
| $50,000 to $74,999 | 262 | 17.6% |
| $75,000 to $99,999 | 182 | 12.2% |
| $100,000 to $149,999 | 456 | 30.6% |
| $150,000 to $199,999 | 231 | 15.5% |
| $200,000+ | 222 | 14.9% |
Household Income by Householder Age in Esperance
The median household income in Esperance is $123,309, with the highest median household income of $142,426 found in the 25 to 44 years age bracket for the primary householder. A total of 532 households (35.7%) fall into this category. Meanwhile, the 15 to 24 years age bracket for the primary householder has the lowest median household income of $0, with 12 households (0.8%) in this group.
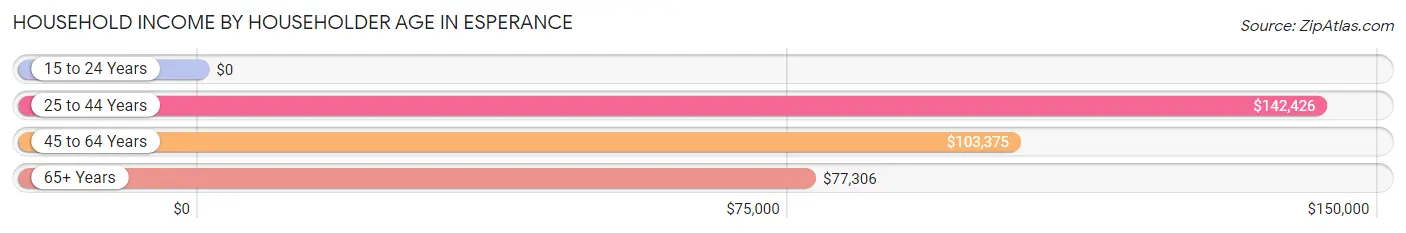
| Income Bracket | # Households | Median Income |
| 15 to 24 Years | 12 (0.8%) | $0 |
| 25 to 44 Years | 532 (35.7%) | $142,426 |
| 45 to 64 Years | 598 (40.2%) | $103,375 |
| 65+ Years | 347 (23.3%) | $77,306 |
| Total | 1,489 (100.0%) | $123,309 |
Poverty in Esperance
Income Below Poverty by Sex and Age in Esperance
With 9.9% poverty level for males and 13.3% for females among the residents of Esperance, 16 and 17 year old males and 16 and 17 year old females are the most vulnerable to poverty, with 43 males (56.6%) and 116 females (84.1%) in their respective age groups living below the poverty level.
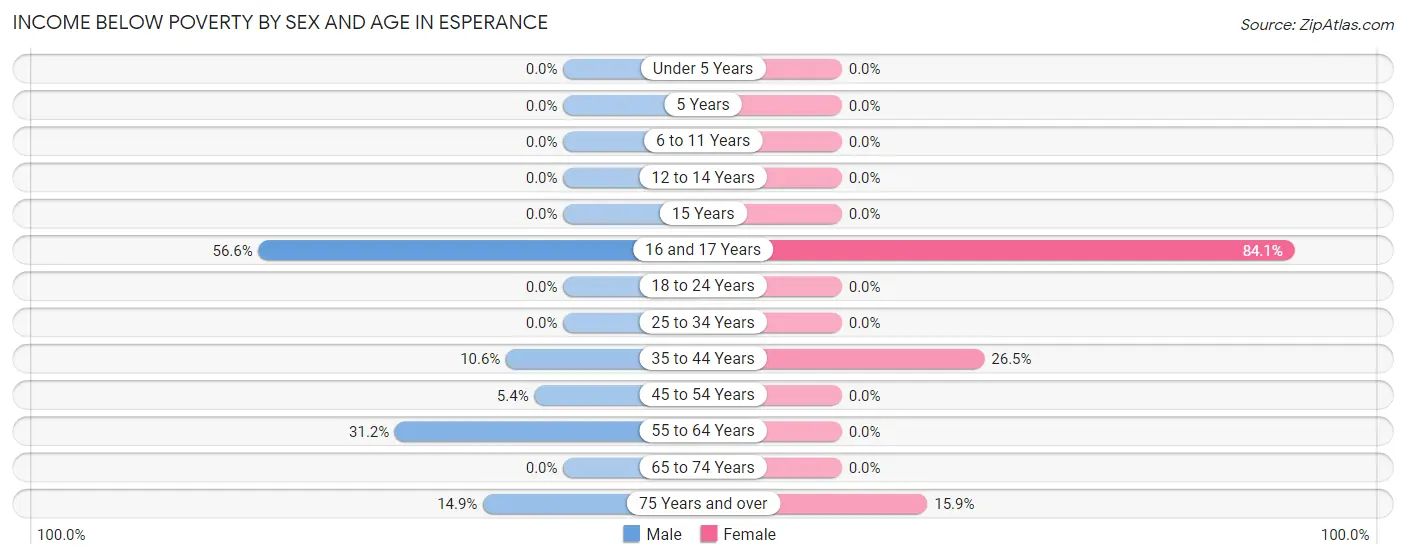
| Age Bracket | Male | Female |
| Under 5 Years | 0 (0.0%) | 0 (0.0%) |
| 5 Years | 0 (0.0%) | 0 (0.0%) |
| 6 to 11 Years | 0 (0.0%) | 0 (0.0%) |
| 12 to 14 Years | 0 (0.0%) | 0 (0.0%) |
| 15 Years | 0 (0.0%) | 0 (0.0%) |
| 16 and 17 Years | 43 (56.6%) | 116 (84.1%) |
| 18 to 24 Years | 0 (0.0%) | 0 (0.0%) |
| 25 to 34 Years | 0 (0.0%) | 0 (0.0%) |
| 35 to 44 Years | 47 (10.6%) | 136 (26.5%) |
| 45 to 54 Years | 9 (5.4%) | 0 (0.0%) |
| 55 to 64 Years | 94 (31.2%) | 0 (0.0%) |
| 65 to 74 Years | 0 (0.0%) | 0 (0.0%) |
| 75 Years and over | 18 (14.9%) | 30 (15.9%) |
| Total | 211 (9.9%) | 282 (13.3%) |
Income Above Poverty by Sex and Age in Esperance
According to the poverty statistics in Esperance, males aged under 5 years and females aged under 5 years are the age groups that are most secure financially, with 100.0% of males and 100.0% of females in these age groups living above the poverty line.
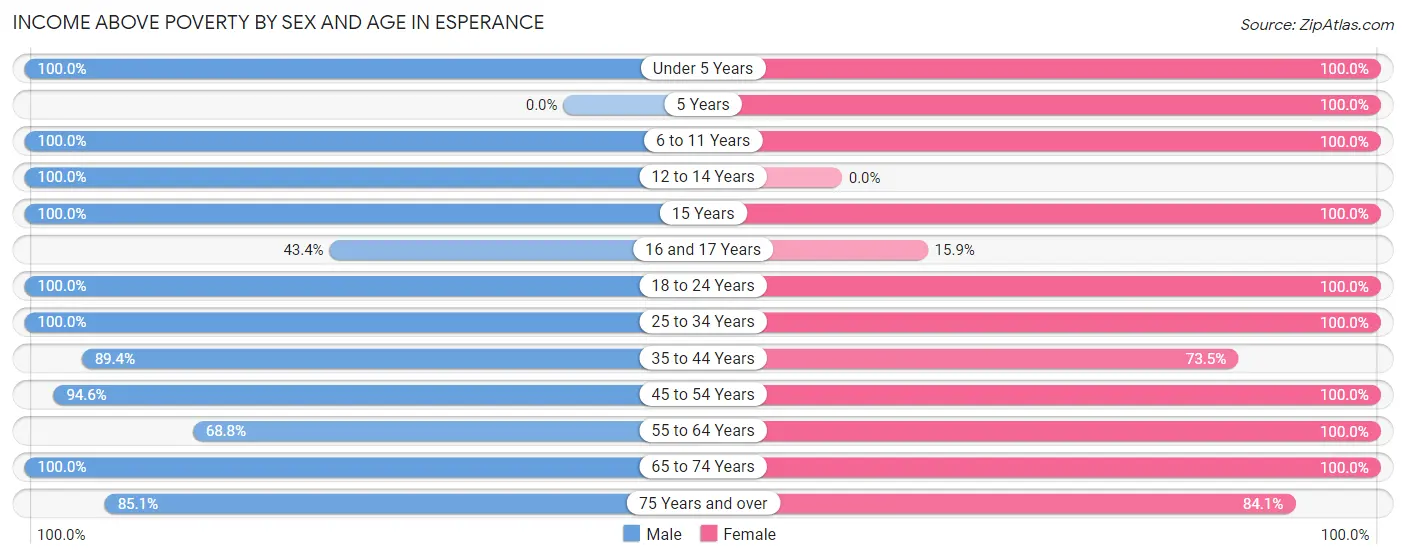
| Age Bracket | Male | Female |
| Under 5 Years | 226 (100.0%) | 103 (100.0%) |
| 5 Years | 0 (0.0%) | 6 (100.0%) |
| 6 to 11 Years | 250 (100.0%) | 135 (100.0%) |
| 12 to 14 Years | 30 (100.0%) | 0 (0.0%) |
| 15 Years | 33 (100.0%) | 4 (100.0%) |
| 16 and 17 Years | 33 (43.4%) | 22 (15.9%) |
| 18 to 24 Years | 104 (100.0%) | 113 (100.0%) |
| 25 to 34 Years | 185 (100.0%) | 301 (100.0%) |
| 35 to 44 Years | 396 (89.4%) | 378 (73.5%) |
| 45 to 54 Years | 159 (94.6%) | 279 (100.0%) |
| 55 to 64 Years | 207 (68.8%) | 160 (100.0%) |
| 65 to 74 Years | 188 (100.0%) | 180 (100.0%) |
| 75 Years and over | 103 (85.1%) | 159 (84.1%) |
| Total | 1,914 (90.1%) | 1,840 (86.7%) |
Income Below Poverty Among Married-Couple Families in Esperance
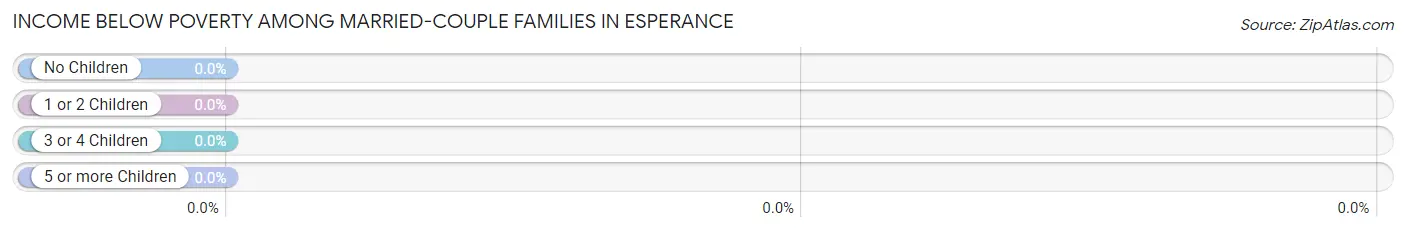
| Children | Above Poverty | Below Poverty |
| No Children | 394 (100.0%) | 0 (0.0%) |
| 1 or 2 Children | 294 (100.0%) | 0 (0.0%) |
| 3 or 4 Children | 112 (100.0%) | 0 (0.0%) |
| 5 or more Children | 0 (0.0%) | 0 (0.0%) |
| Total | 800 (100.0%) | 0 (0.0%) |
Income Below Poverty Among Single-Parent Households in Esperance
| Children | Single Father | Single Mother |
| No Children | 0 (0.0%) | 0 (0.0%) |
| 1 or 2 Children | 0 (0.0%) | 0 (0.0%) |
| 3 or 4 Children | 0 (0.0%) | 0 (0.0%) |
| 5 or more Children | 0 (0.0%) | 0 (0.0%) |
| Total | 0 (0.0%) | 0 (0.0%) |
Income Below Poverty Among Married-Couple vs Single-Parent Households in Esperance
| Children | Married-Couple Families | Single-Parent Households |
| No Children | 0 (0.0%) | 0 (0.0%) |
| 1 or 2 Children | 0 (0.0%) | 0 (0.0%) |
| 3 or 4 Children | 0 (0.0%) | 0 (0.0%) |
| 5 or more Children | 0 (0.0%) | 0 (0.0%) |
| Total | 0 (0.0%) | 0 (0.0%) |
Race in Esperance
The most populous races in Esperance are White / Caucasian (2,972 | 69.6%), Asian (698 | 16.4%), and Hispanic or Latino (304 | 7.1%).
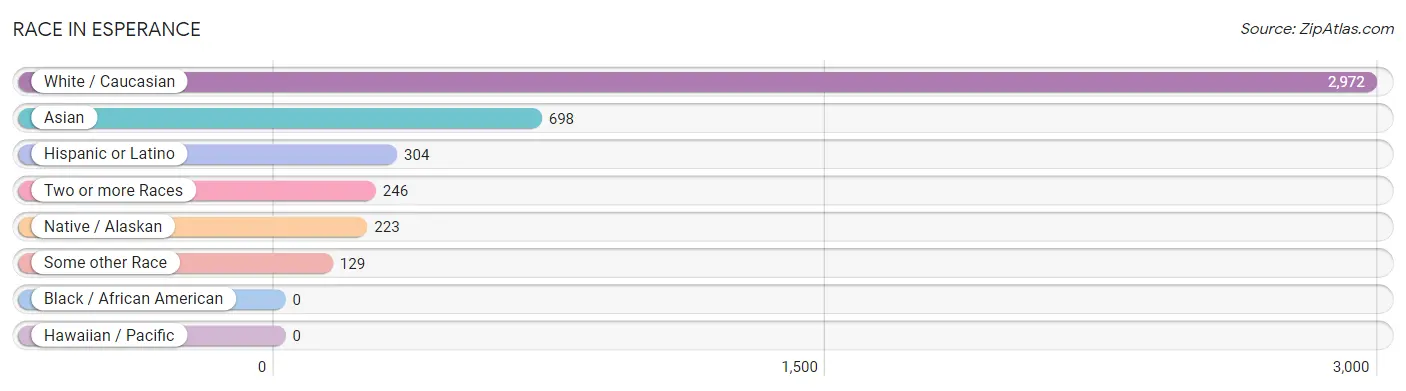
| Race | # Population | % Population |
| Asian | 698 | 16.4% |
| Black / African American | 0 | 0.0% |
| Hawaiian / Pacific | 0 | 0.0% |
| Hispanic or Latino | 304 | 7.1% |
| Native / Alaskan | 223 | 5.2% |
| White / Caucasian | 2,972 | 69.6% |
| Two or more Races | 246 | 5.8% |
| Some other Race | 129 | 3.0% |
| Total | 4,268 | 100.0% |
Ancestry in Esperance
The most populous ancestries reported in Esperance are German (727 | 17.0%), English (604 | 14.1%), Burmese (510 | 11.9%), Irish (311 | 7.3%), and Mexican (292 | 6.8%), together accounting for 57.3% of all Esperance residents.
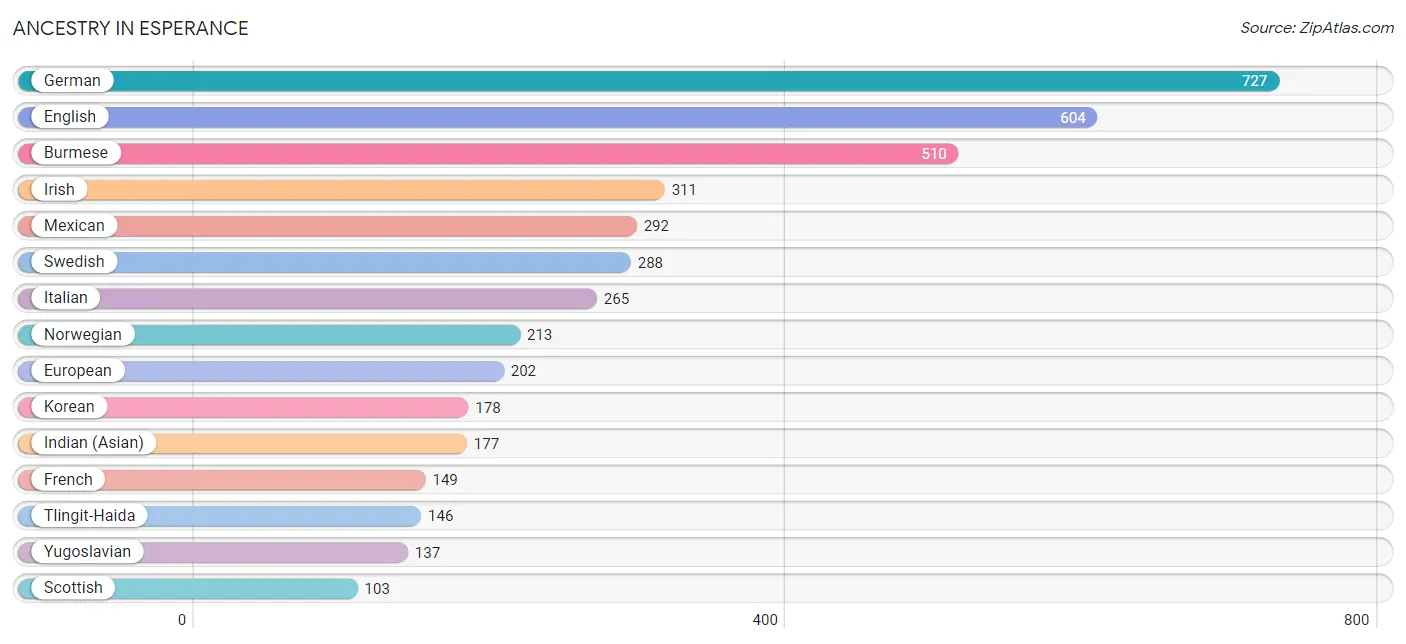
| Ancestry | # Population | % Population |
| American | 12 | 0.3% |
| Arab | 47 | 1.1% |
| Bhutanese | 59 | 1.4% |
| Brazilian | 13 | 0.3% |
| British | 17 | 0.4% |
| Burmese | 510 | 11.9% |
| Cherokee | 11 | 0.3% |
| Chippewa | 30 | 0.7% |
| Colombian | 3 | 0.1% |
| Croatian | 28 | 0.7% |
| Danish | 59 | 1.4% |
| Dutch | 34 | 0.8% |
| Eastern European | 27 | 0.6% |
| English | 604 | 14.1% |
| Estonian | 25 | 0.6% |
| European | 202 | 4.7% |
| Finnish | 13 | 0.3% |
| French | 149 | 3.5% |
| French Canadian | 20 | 0.5% |
| German | 727 | 17.0% |
| Hungarian | 19 | 0.4% |
| Indian (Asian) | 177 | 4.2% |
| Irish | 311 | 7.3% |
| Italian | 265 | 6.2% |
| Korean | 178 | 4.2% |
| Mexican | 292 | 6.8% |
| Northern European | 57 | 1.3% |
| Norwegian | 213 | 5.0% |
| Polish | 40 | 0.9% |
| Romanian | 88 | 2.1% |
| Russian | 42 | 1.0% |
| Scandinavian | 86 | 2.0% |
| Scotch-Irish | 16 | 0.4% |
| Scottish | 103 | 2.4% |
| South American | 12 | 0.3% |
| Sri Lankan | 12 | 0.3% |
| Swedish | 288 | 6.8% |
| Swiss | 27 | 0.6% |
| Tlingit-Haida | 146 | 3.4% |
| Venezuelan | 9 | 0.2% |
| Welsh | 10 | 0.2% |
| Yugoslavian | 137 | 3.2% | View All 42 Rows |
Immigrants in Esperance
The most numerous immigrant groups reported in Esperance came from Asia (430 | 10.1%), Eastern Asia (362 | 8.5%), Europe (272 | 6.4%), Eastern Europe (200 | 4.7%), and China (185 | 4.3%), together accounting for 33.9% of all Esperance residents.
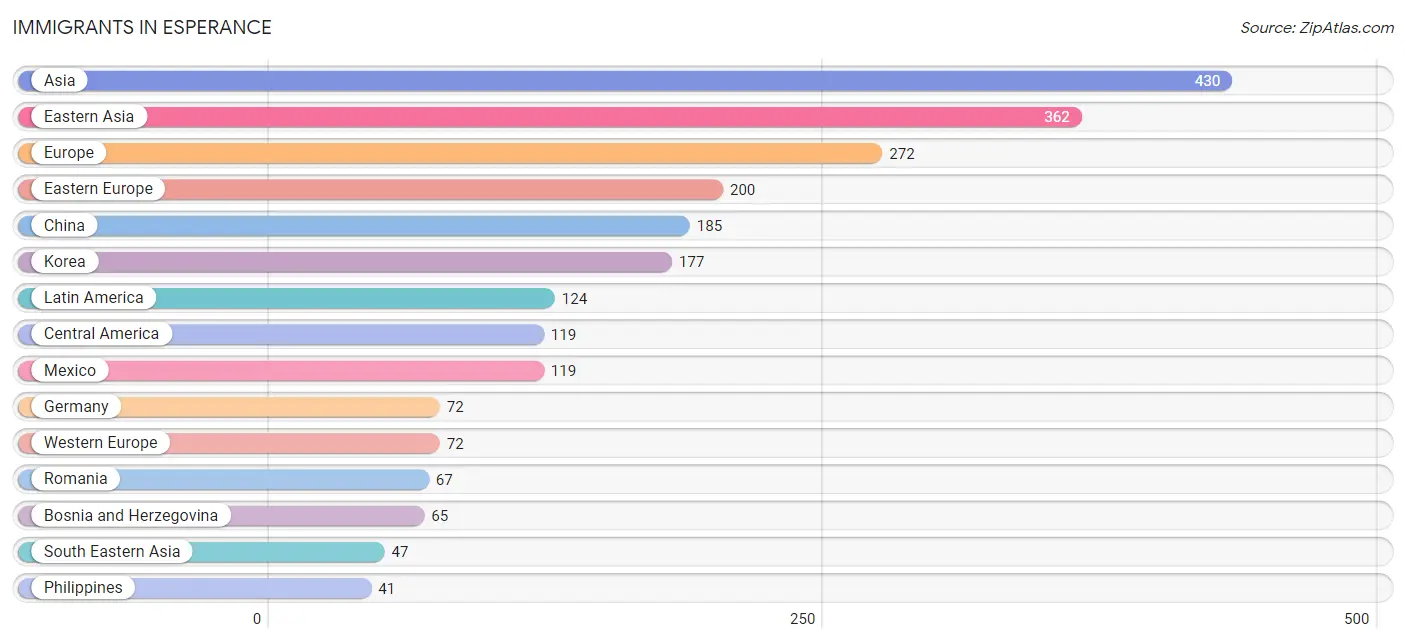
| Immigration Origin | # Population | % Population |
| Asia | 430 | 10.1% |
| Bosnia and Herzegovina | 65 | 1.5% |
| Central America | 119 | 2.8% |
| China | 185 | 4.3% |
| Eastern Asia | 362 | 8.5% |
| Eastern Europe | 200 | 4.7% |
| Europe | 272 | 6.4% |
| Germany | 72 | 1.7% |
| Jordan | 21 | 0.5% |
| Korea | 177 | 4.2% |
| Latin America | 124 | 2.9% |
| Mexico | 119 | 2.8% |
| Moldova | 37 | 0.9% |
| Philippines | 41 | 1.0% |
| Romania | 67 | 1.6% |
| South America | 5 | 0.1% |
| South Eastern Asia | 47 | 1.1% |
| Ukraine | 6 | 0.1% |
| Venezuela | 5 | 0.1% |
| Vietnam | 6 | 0.1% |
| Western Asia | 21 | 0.5% |
| Western Europe | 72 | 1.7% | View All 22 Rows |
Sex and Age in Esperance
Sex and Age in Esperance
The most populous age groups in Esperance are 40 to 44 Years (232 | 10.9%) for men and 40 to 44 Years (338 | 15.8%) for women.
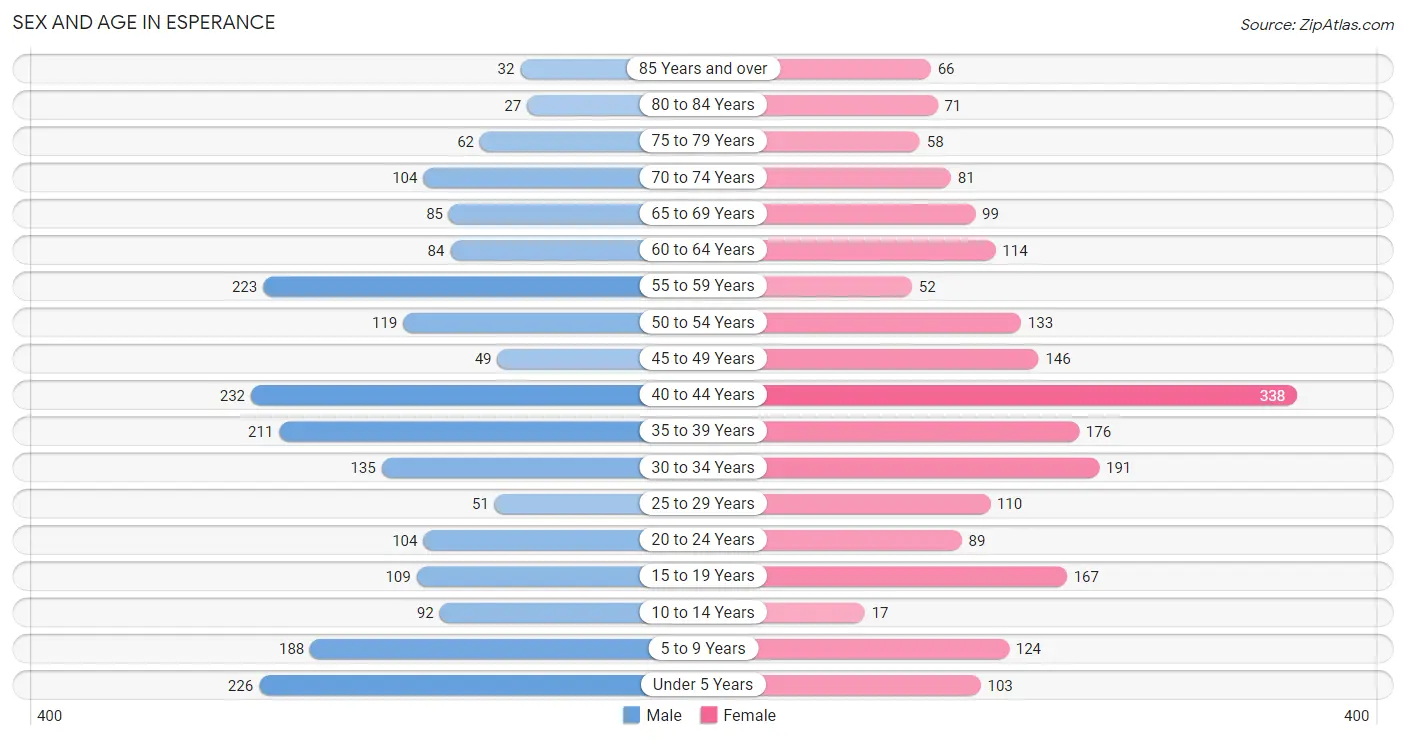
| Age Bracket | Male | Female |
| Under 5 Years | 226 (10.6%) | 103 (4.8%) |
| 5 to 9 Years | 188 (8.8%) | 124 (5.8%) |
| 10 to 14 Years | 92 (4.3%) | 17 (0.8%) |
| 15 to 19 Years | 109 (5.1%) | 167 (7.8%) |
| 20 to 24 Years | 104 (4.9%) | 89 (4.2%) |
| 25 to 29 Years | 51 (2.4%) | 110 (5.1%) |
| 30 to 34 Years | 135 (6.3%) | 191 (8.9%) |
| 35 to 39 Years | 211 (9.9%) | 176 (8.2%) |
| 40 to 44 Years | 232 (10.9%) | 338 (15.8%) |
| 45 to 49 Years | 49 (2.3%) | 146 (6.8%) |
| 50 to 54 Years | 119 (5.6%) | 133 (6.2%) |
| 55 to 59 Years | 223 (10.4%) | 52 (2.4%) |
| 60 to 64 Years | 84 (3.9%) | 114 (5.3%) |
| 65 to 69 Years | 85 (4.0%) | 99 (4.6%) |
| 70 to 74 Years | 104 (4.9%) | 81 (3.8%) |
| 75 to 79 Years | 62 (2.9%) | 58 (2.7%) |
| 80 to 84 Years | 27 (1.3%) | 71 (3.3%) |
| 85 Years and over | 32 (1.5%) | 66 (3.1%) |
| Total | 2,133 (100.0%) | 2,135 (100.0%) |
Families and Households in Esperance
Median Family Size in Esperance
The median family size in Esperance is 3.15 persons per family, with married-couple families (800 | 80.0%) accounting for the largest median family size of 3.21 persons per family. On the other hand, single female/mother families (108 | 10.8%) represent the smallest median family size with 2.77 persons per family.
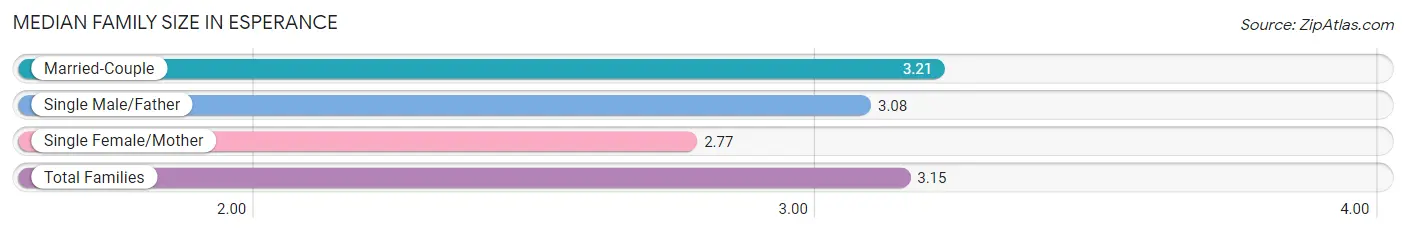
| Family Type | # Families | Family Size |
| Married-Couple | 800 (80.0%) | 3.21 |
| Single Male/Father | 92 (9.2%) | 3.08 |
| Single Female/Mother | 108 (10.8%) | 2.77 |
| Total Families | 1,000 (100.0%) | 3.15 |
Median Household Size in Esperance
The median household size in Esperance is 2.81 persons per household, with single male/father households (92 | 6.2%) accounting for the largest median household size of 5.61 persons per household. non-family households (489 | 32.8%) represent the smallest median household size with 1.18 persons per household.
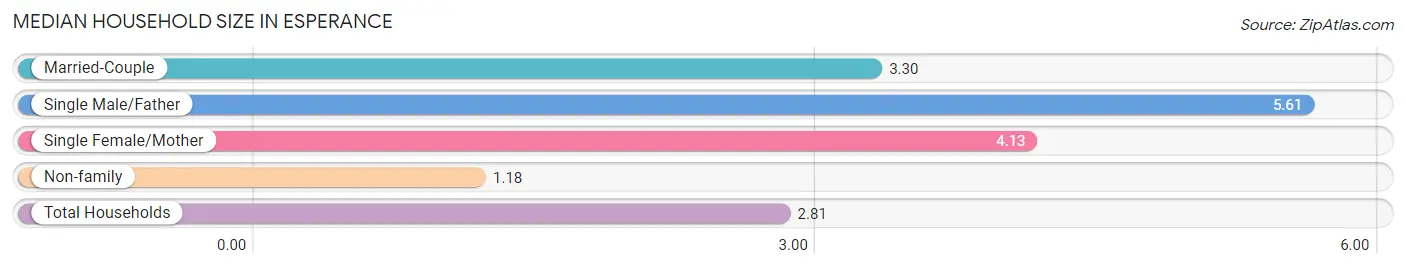
| Household Type | # Households | Household Size |
| Married-Couple | 800 (53.7%) | 3.30 |
| Single Male/Father | 92 (6.2%) | 5.61 |
| Single Female/Mother | 108 (7.2%) | 4.13 |
| Non-family | 489 (32.8%) | 1.18 |
| Total Households | 1,489 (100.0%) | 2.81 |
Household Size by Marriage Status in Esperance
Out of a total of 1,489 households in Esperance, 1,000 (67.2%) are family households, while 489 (32.8%) are nonfamily households. The most numerous type of family households are 2-person households, comprising 307, and the most common type of nonfamily households are 1-person households, comprising 448.
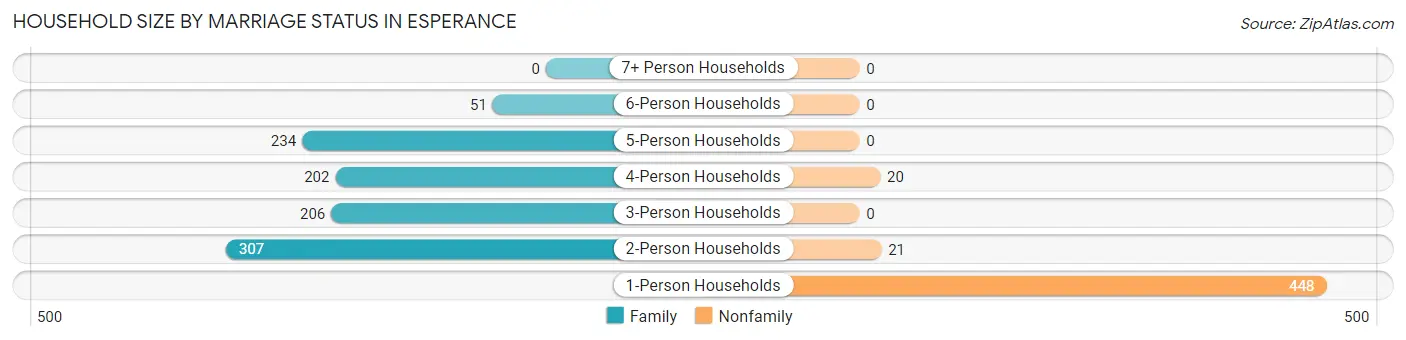
| Household Size | Family Households | Nonfamily Households |
| 1-Person Households | - | 448 (30.1%) |
| 2-Person Households | 307 (20.6%) | 21 (1.4%) |
| 3-Person Households | 206 (13.8%) | 0 (0.0%) |
| 4-Person Households | 202 (13.6%) | 20 (1.3%) |
| 5-Person Households | 234 (15.7%) | 0 (0.0%) |
| 6-Person Households | 51 (3.4%) | 0 (0.0%) |
| 7+ Person Households | 0 (0.0%) | 0 (0.0%) |
| Total | 1,000 (67.2%) | 489 (32.8%) |
Female Fertility in Esperance
Fertility by Age in Esperance
Average fertility rate in Esperance is 127.0 births per 1,000 women. Women in the age bracket of 20 to 34 years have the highest fertility rate with 408.0 births per 1,000 women. Women in the age bracket of 20 to 34 years acount for 100.0% of all women with births.
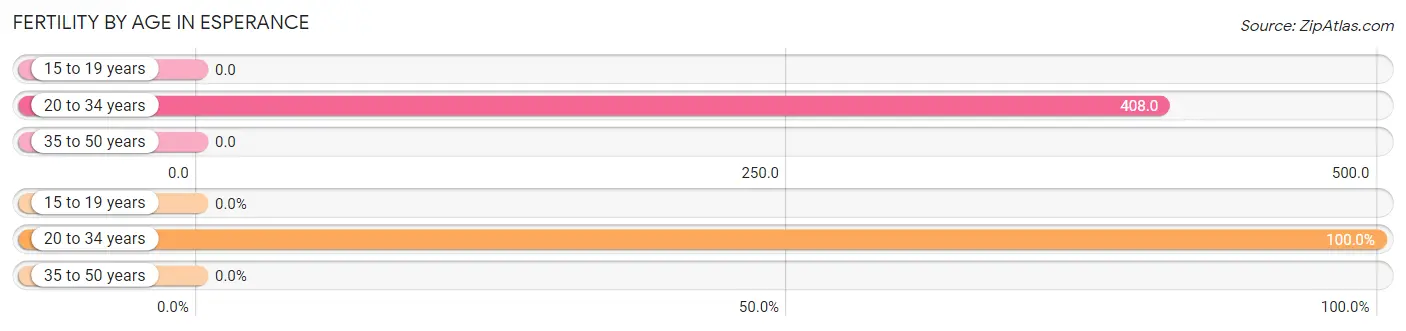
| Age Bracket | Women with Births | Births / 1,000 Women |
| 15 to 19 years | 0 (0.0%) | 0.0 |
| 20 to 34 years | 159 (100.0%) | 408.0 |
| 35 to 50 years | 0 (0.0%) | 0.0 |
| Total | 159 (100.0%) | 127.0 |
Fertility by Age by Marriage Status in Esperance
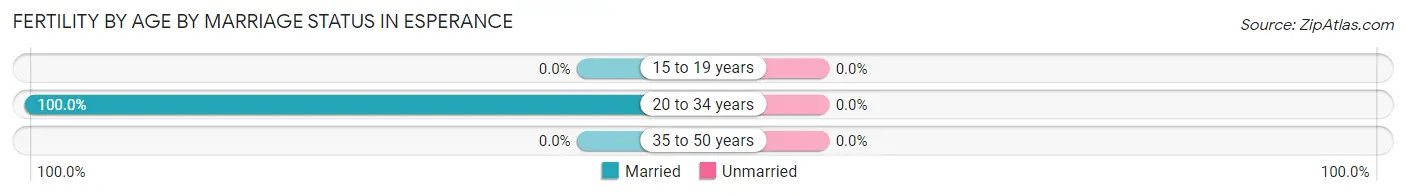
| Age Bracket | Married | Unmarried |
| 15 to 19 years | 0 (0.0%) | 0 (0.0%) |
| 20 to 34 years | 159 (100.0%) | 0 (0.0%) |
| 35 to 50 years | 0 (0.0%) | 0 (0.0%) |
| Total | 159 (100.0%) | 0 (0.0%) |
Fertility by Education in Esperance
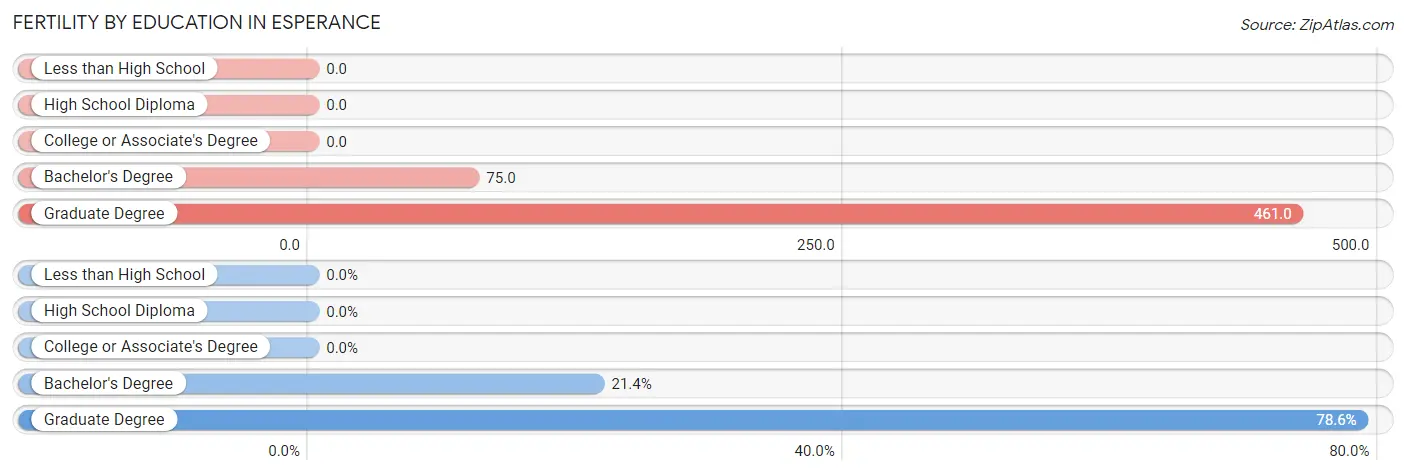
| Educational Attainment | Women with Births | Births / 1,000 Women |
| Less than High School | 0 (0.0%) | 0.0 |
| High School Diploma | 0 (0.0%) | 0.0 |
| College or Associate's Degree | 0 (0.0%) | 0.0 |
| Bachelor's Degree | 34 (21.4%) | 75.0 |
| Graduate Degree | 125 (78.6%) | 461.0 |
| Total | 159 (100.0%) | 127.0 |
Fertility by Education by Marriage Status in Esperance
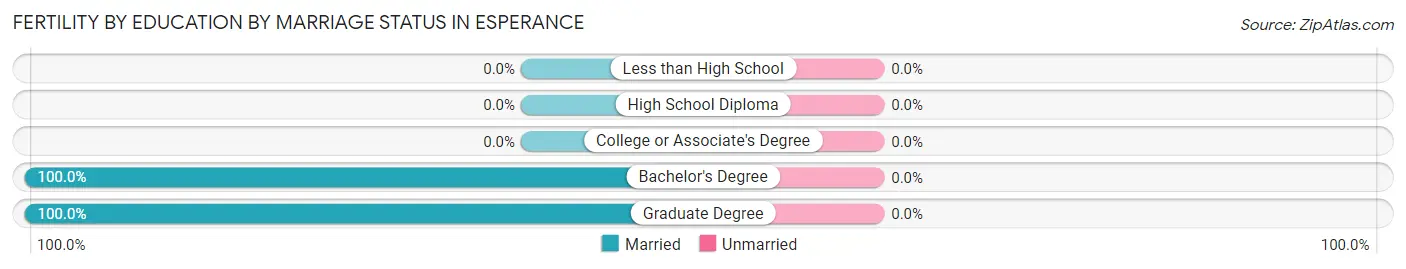
| Educational Attainment | Married | Unmarried |
| Less than High School | 0 (0.0%) | 0 (0.0%) |
| High School Diploma | 0 (0.0%) | 0 (0.0%) |
| College or Associate's Degree | 0 (0.0%) | 0 (0.0%) |
| Bachelor's Degree | 34 (100.0%) | 0 (0.0%) |
| Graduate Degree | 125 (100.0%) | 0 (0.0%) |
| Total | 159 (100.0%) | 0 (0.0%) |
Employment Characteristics in Esperance
Employment by Class of Employer in Esperance
Among the 2,167 employed individuals in Esperance, private company employees (1,242 | 57.3%), not-for-profit organizations (304 | 14.0%), and local government employees (267 | 12.3%) make up the most common classes of employment.
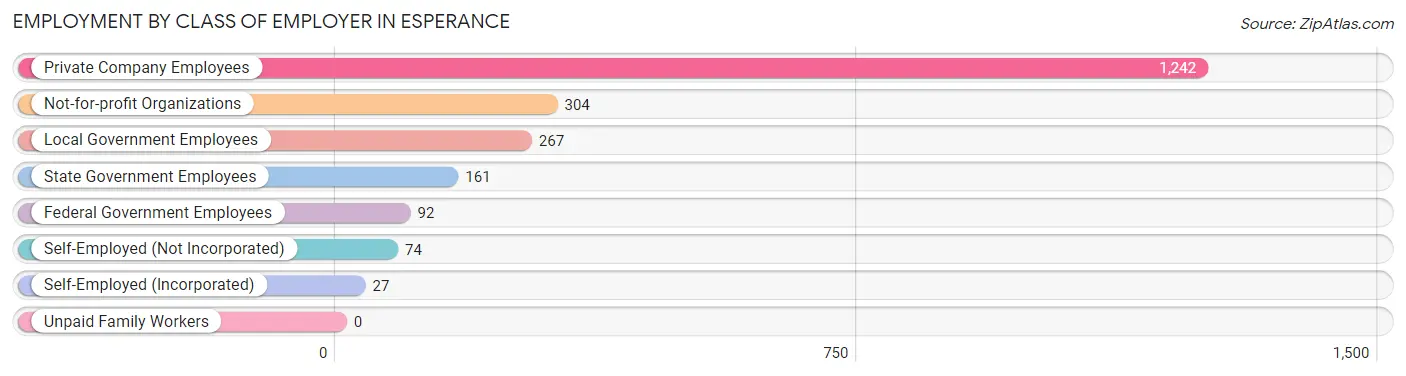
| Employer Class | # Employees | % Employees |
| Private Company Employees | 1,242 | 57.3% |
| Self-Employed (Incorporated) | 27 | 1.3% |
| Self-Employed (Not Incorporated) | 74 | 3.4% |
| Not-for-profit Organizations | 304 | 14.0% |
| Local Government Employees | 267 | 12.3% |
| State Government Employees | 161 | 7.4% |
| Federal Government Employees | 92 | 4.3% |
| Unpaid Family Workers | 0 | 0.0% |
| Total | 2,167 | 100.0% |
Employment Status by Age in Esperance
According to the labor force statistics for Esperance, out of the total population over 16 years of age (3,481), 66.6% or 2,318 individuals are in the labor force, with 3.0% or 70 of them unemployed. The age group with the highest labor force participation rate is 20 to 24 years, with 99.5% or 192 individuals in the labor force. Within the labor force, the 16 to 19 years age range has the highest percentage of unemployed individuals, with 24.2% or 8 of them being unemployed.
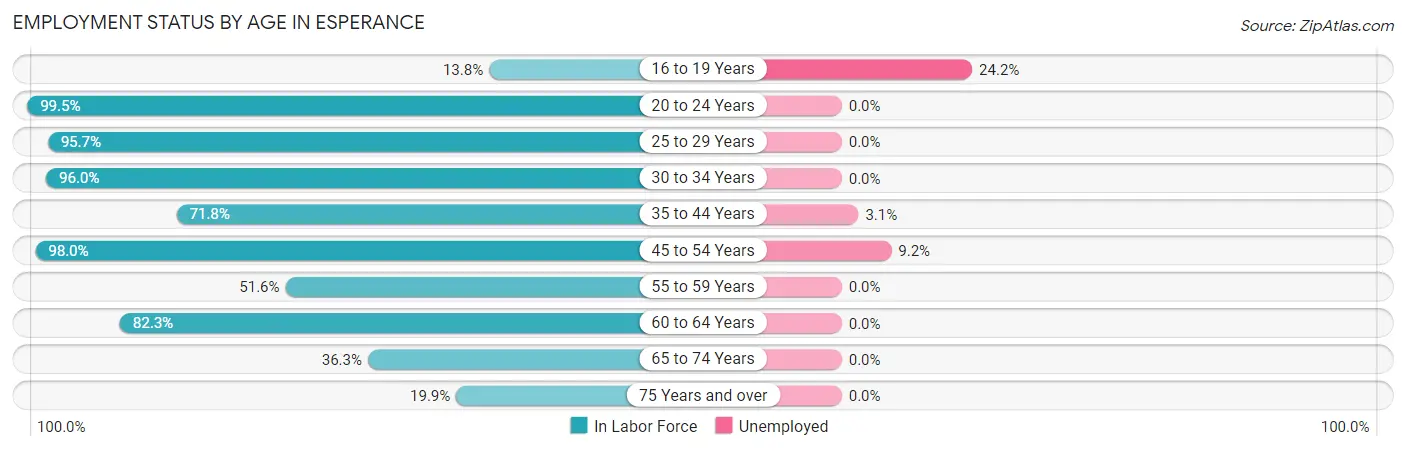
| Age Bracket | In Labor Force | Unemployed |
| 16 to 19 Years | 33 (13.8%) | 8 (24.2%) |
| 20 to 24 Years | 192 (99.5%) | 0 (0.0%) |
| 25 to 29 Years | 154 (95.7%) | 0 (0.0%) |
| 30 to 34 Years | 313 (96.0%) | 0 (0.0%) |
| 35 to 44 Years | 687 (71.8%) | 21 (3.1%) |
| 45 to 54 Years | 438 (98.0%) | 40 (9.2%) |
| 55 to 59 Years | 142 (51.6%) | 0 (0.0%) |
| 60 to 64 Years | 163 (82.3%) | 0 (0.0%) |
| 65 to 74 Years | 134 (36.3%) | 0 (0.0%) |
| 75 Years and over | 63 (19.9%) | 0 (0.0%) |
| Total | 2,318 (66.6%) | 70 (3.0%) |
Employment Status by Educational Attainment in Esperance
According to labor force statistics for Esperance, 80.2% of individuals (1,896) out of the total population between 25 and 64 years of age (2,364) are in the labor force, with 3.2% or 61 of them being unemployed. The group with the highest labor force participation rate are those with the educational attainment of bachelor's degree or higher, with 90.7% or 1,168 individuals in the labor force. Within the labor force, individuals with high school diploma education have the highest percentage of unemployment, with 15.4% or 61 of them being unemployed.
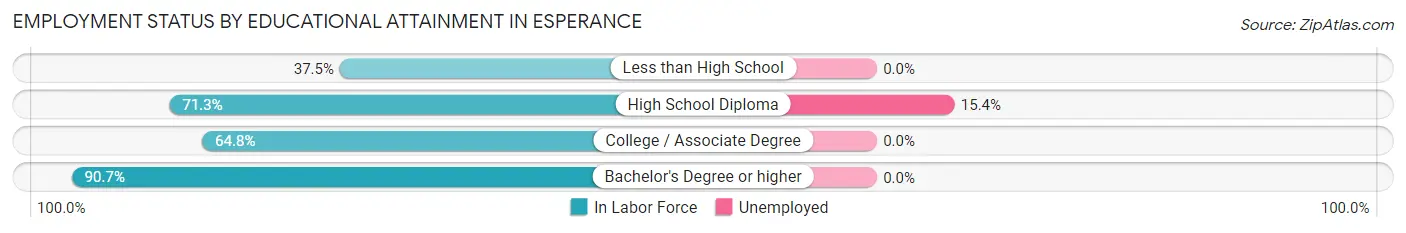
| Educational Attainment | In Labor Force | Unemployed |
| Less than High School | 6 (37.5%) | 0 (0.0%) |
| High School Diploma | 395 (71.3%) | 85 (15.4%) |
| College / Associate Degree | 328 (64.8%) | 0 (0.0%) |
| Bachelor's Degree or higher | 1,168 (90.7%) | 0 (0.0%) |
| Total | 1,896 (80.2%) | 76 (3.2%) |
Employment Occupations by Sex in Esperance
Management, Business, Science and Arts Occupations
The most common Management, Business, Science and Arts occupations in Esperance are Management (439 | 19.5%), Community & Social Service (216 | 9.6%), Computers, Engineering & Science (203 | 9.0%), Health Diagnosing & Treating (185 | 8.2%), and Health Technologists (173 | 7.7%).
Management, Business, Science and Arts Occupations by Sex
Within the Management, Business, Science and Arts occupations in Esperance, the most male-oriented occupations are Computers & Mathematics (94.5%), Computers, Engineering & Science (93.6%), and Architecture & Engineering (92.0%), while the most female-oriented occupations are Arts, Media & Entertainment (100.0%), Health Diagnosing & Treating (100.0%), and Health Technologists (100.0%).
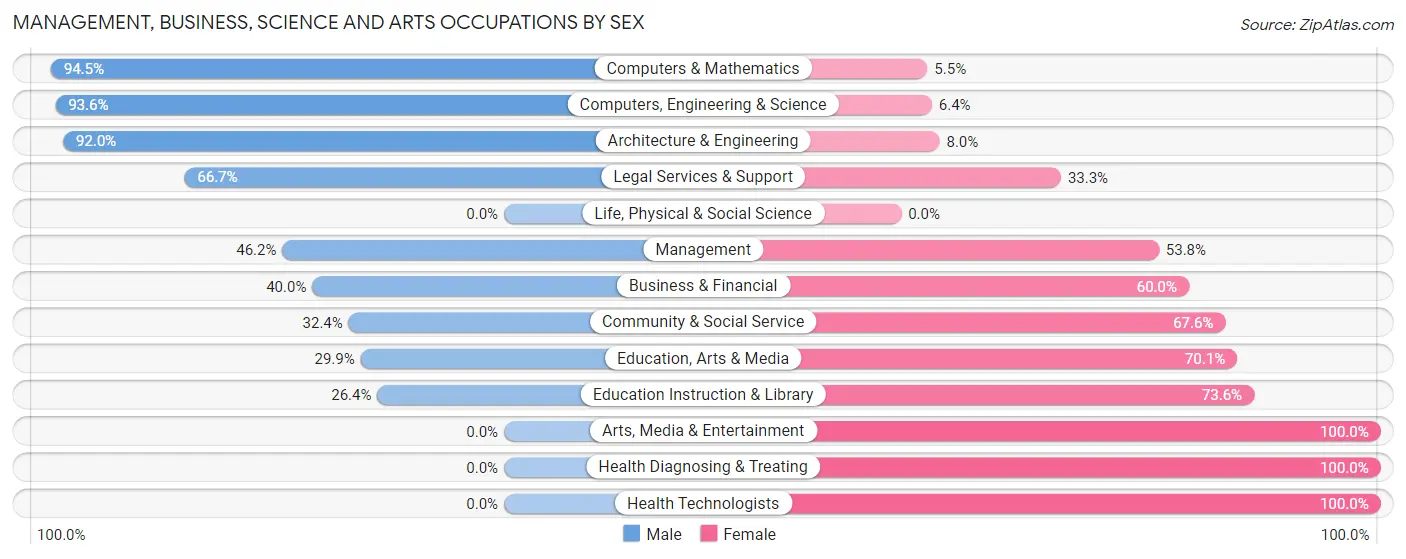
| Occupation | Male | Female |
| Management | 203 (46.2%) | 236 (53.8%) |
| Business & Financial | 44 (40.0%) | 66 (60.0%) |
| Computers, Engineering & Science | 190 (93.6%) | 13 (6.4%) |
| Computers & Mathematics | 121 (94.5%) | 7 (5.5%) |
| Architecture & Engineering | 69 (92.0%) | 6 (8.0%) |
| Life, Physical & Social Science | 0 (0.0%) | 0 (0.0%) |
| Community & Social Service | 70 (32.4%) | 146 (67.6%) |
| Education, Arts & Media | 38 (29.9%) | 89 (70.1%) |
| Legal Services & Support | 18 (66.7%) | 9 (33.3%) |
| Education Instruction & Library | 14 (26.4%) | 39 (73.6%) |
| Arts, Media & Entertainment | 0 (0.0%) | 9 (100.0%) |
| Health Diagnosing & Treating | 0 (0.0%) | 185 (100.0%) |
| Health Technologists | 0 (0.0%) | 173 (100.0%) |
| Total (Category) | 507 (44.0%) | 646 (56.0%) |
| Total (Overall) | 1,064 (47.3%) | 1,183 (52.6%) |
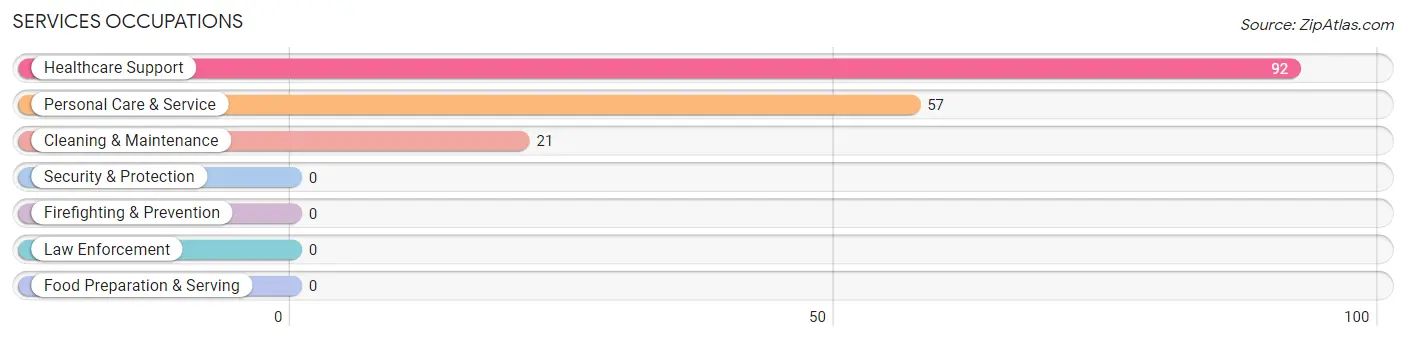
Services Occupations
The most common Services occupations in Esperance are Healthcare Support (92 | 4.1%), Personal Care & Service (57 | 2.5%), and Cleaning & Maintenance (21 | 0.9%).
Services Occupations by Sex
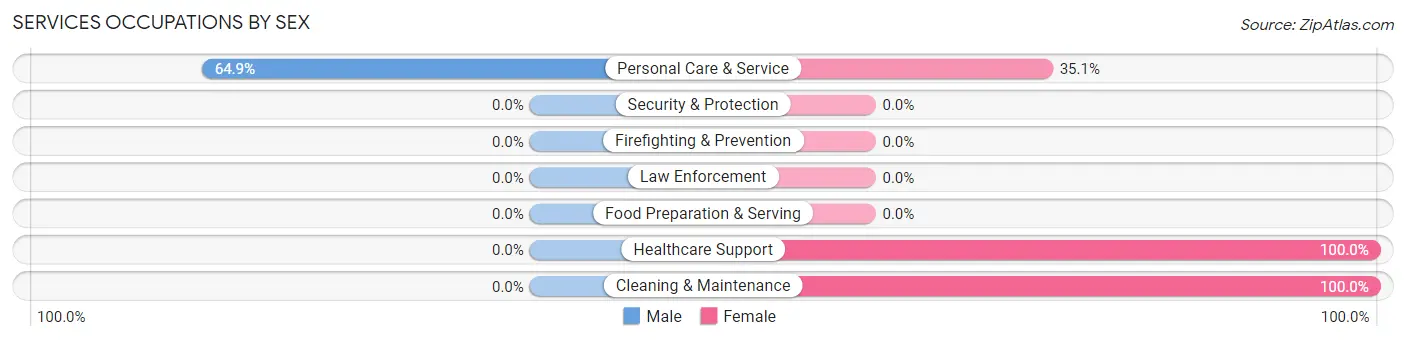
| Occupation | Male | Female |
| Healthcare Support | 0 (0.0%) | 92 (100.0%) |
| Security & Protection | 0 (0.0%) | 0 (0.0%) |
| Firefighting & Prevention | 0 (0.0%) | 0 (0.0%) |
| Law Enforcement | 0 (0.0%) | 0 (0.0%) |
| Food Preparation & Serving | 0 (0.0%) | 0 (0.0%) |
| Cleaning & Maintenance | 0 (0.0%) | 21 (100.0%) |
| Personal Care & Service | 37 (64.9%) | 20 (35.1%) |
| Total (Category) | 37 (21.8%) | 133 (78.2%) |
| Total (Overall) | 1,064 (47.3%) | 1,183 (52.6%) |
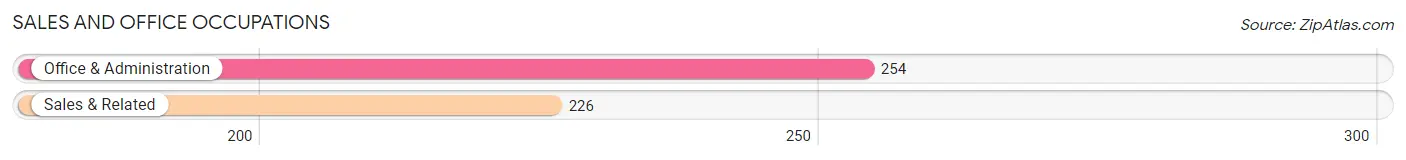
Sales and Office Occupations
The most common Sales and Office occupations in Esperance are Office & Administration (254 | 11.3%), and Sales & Related (226 | 10.1%).
Sales and Office Occupations by Sex
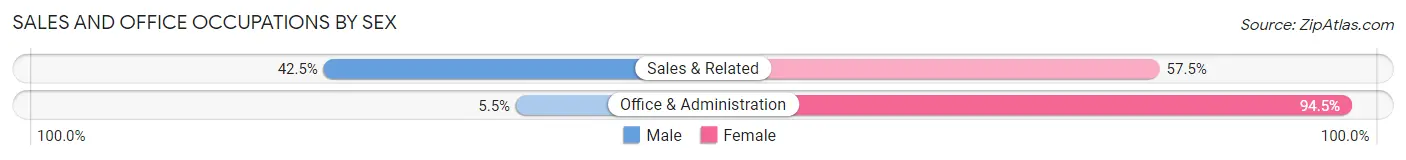
| Occupation | Male | Female |
| Sales & Related | 96 (42.5%) | 130 (57.5%) |
| Office & Administration | 14 (5.5%) | 240 (94.5%) |
| Total (Category) | 110 (22.9%) | 370 (77.1%) |
| Total (Overall) | 1,064 (47.3%) | 1,183 (52.6%) |
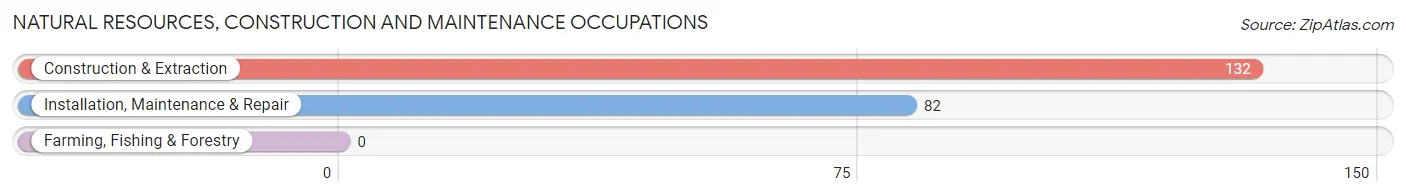
Natural Resources, Construction and Maintenance Occupations
The most common Natural Resources, Construction and Maintenance occupations in Esperance are Construction & Extraction (132 | 5.9%), and Installation, Maintenance & Repair (82 | 3.6%).
Natural Resources, Construction and Maintenance Occupations by Sex
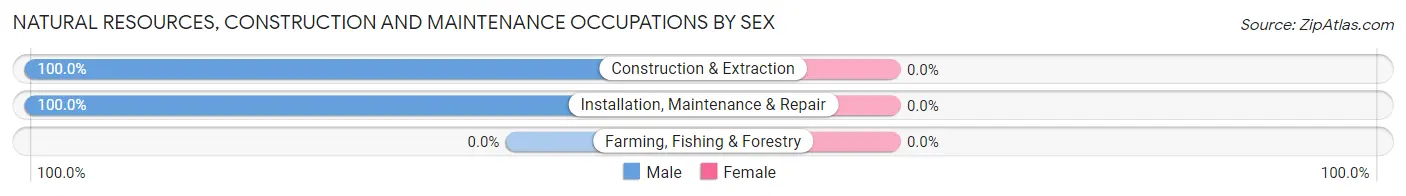
| Occupation | Male | Female |
| Farming, Fishing & Forestry | 0 (0.0%) | 0 (0.0%) |
| Construction & Extraction | 132 (100.0%) | 0 (0.0%) |
| Installation, Maintenance & Repair | 82 (100.0%) | 0 (0.0%) |
| Total (Category) | 214 (100.0%) | 0 (0.0%) |
| Total (Overall) | 1,064 (47.3%) | 1,183 (52.6%) |
Production, Transportation and Moving Occupations
The most common Production, Transportation and Moving occupations in Esperance are Production (111 | 4.9%), Transportation (100 | 4.4%), and Material Moving (19 | 0.9%).
Production, Transportation and Moving Occupations by Sex
| Occupation | Male | Female |
| Production | 77 (69.4%) | 34 (30.6%) |
| Transportation | 100 (100.0%) | 0 (0.0%) |
| Material Moving | 19 (100.0%) | 0 (0.0%) |
| Total (Category) | 196 (85.2%) | 34 (14.8%) |
| Total (Overall) | 1,064 (47.3%) | 1,183 (52.6%) |
Employment Industries by Sex in Esperance
Employment Industries in Esperance
The major employment industries in Esperance include Health Care & Social Assistance (339 | 15.1%), Educational Services (264 | 11.7%), Retail Trade (222 | 9.9%), Public Administration (217 | 9.7%), and Professional & Scientific (196 | 8.7%).
Employment Industries by Sex in Esperance
The Esperance industries that see more men than women are Transportation & Warehousing (94.4%), Construction (93.3%), and Information (84.3%), whereas the industries that tend to have a higher number of women are Agriculture, Fishing & Hunting (100.0%), Health Care & Social Assistance (100.0%), and Finance & Insurance (74.7%).
| Industry | Male | Female |
| Agriculture, Fishing & Hunting | 0 (0.0%) | 15 (100.0%) |
| Mining, Quarrying, & Extraction | 0 (0.0%) | 0 (0.0%) |
| Construction | 111 (93.3%) | 8 (6.7%) |
| Manufacturing | 142 (83.0%) | 29 (17.0%) |
| Wholesale Trade | 90 (69.2%) | 40 (30.8%) |
| Retail Trade | 97 (43.7%) | 125 (56.3%) |
| Transportation & Warehousing | 134 (94.4%) | 8 (5.6%) |
| Utilities | 0 (0.0%) | 0 (0.0%) |
| Information | 43 (84.3%) | 8 (15.7%) |
| Finance & Insurance | 23 (25.3%) | 68 (74.7%) |
| Real Estate, Rental & Leasing | 29 (38.7%) | 46 (61.3%) |
| Professional & Scientific | 120 (61.2%) | 76 (38.8%) |
| Enterprise Management | 0 (0.0%) | 0 (0.0%) |
| Administrative & Support | 0 (0.0%) | 0 (0.0%) |
| Educational Services | 79 (29.9%) | 185 (70.1%) |
| Health Care & Social Assistance | 0 (0.0%) | 339 (100.0%) |
| Arts, Entertainment & Recreation | 0 (0.0%) | 0 (0.0%) |
| Accommodation & Food Services | 52 (71.2%) | 21 (28.8%) |
| Public Administration | 85 (39.2%) | 132 (60.8%) |
| Total | 1,064 (47.3%) | 1,183 (52.6%) |
Education in Esperance
School Enrollment in Esperance
The most common levels of schooling among the 1,076 students in Esperance are elementary school (339 | 31.5%), college / undergraduate (270 | 25.1%), and high school (251 | 23.3%).
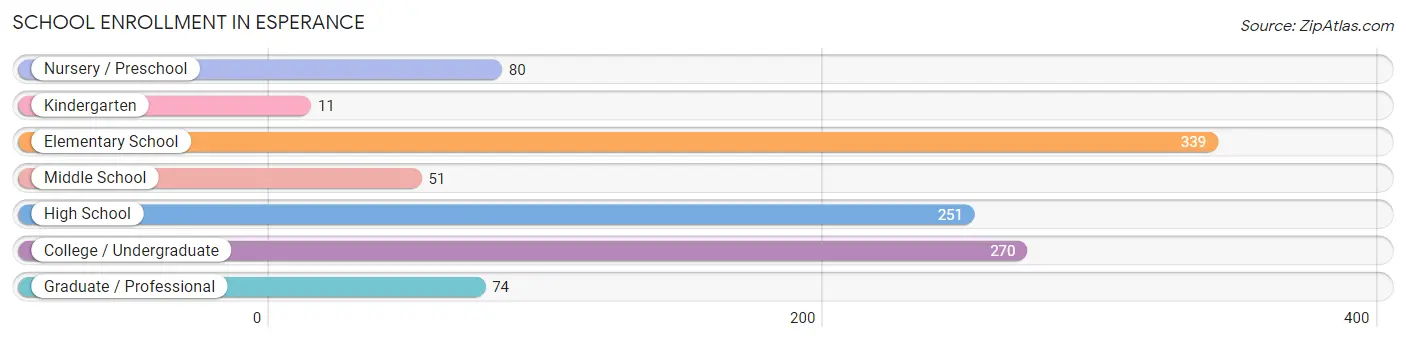
| School Level | # Students | % Students |
| Nursery / Preschool | 80 | 7.4% |
| Kindergarten | 11 | 1.0% |
| Elementary School | 339 | 31.5% |
| Middle School | 51 | 4.7% |
| High School | 251 | 23.3% |
| College / Undergraduate | 270 | 25.1% |
| Graduate / Professional | 74 | 6.9% |
| Total | 1,076 | 100.0% |
School Enrollment by Age by Funding Source in Esperance
Out of a total of 1,076 students who are enrolled in schools in Esperance, 112 (10.4%) attend a private institution, while the remaining 964 (89.6%) are enrolled in public schools. The age group of 3 to 4 year olds has the highest likelihood of being enrolled in private schools, with 74 (100.0% in the age bracket) enrolled. Conversely, the age group of 5 to 9 year old has the lowest likelihood of being enrolled in a private school, with 298 (100.0% in the age bracket) attending a public institution.
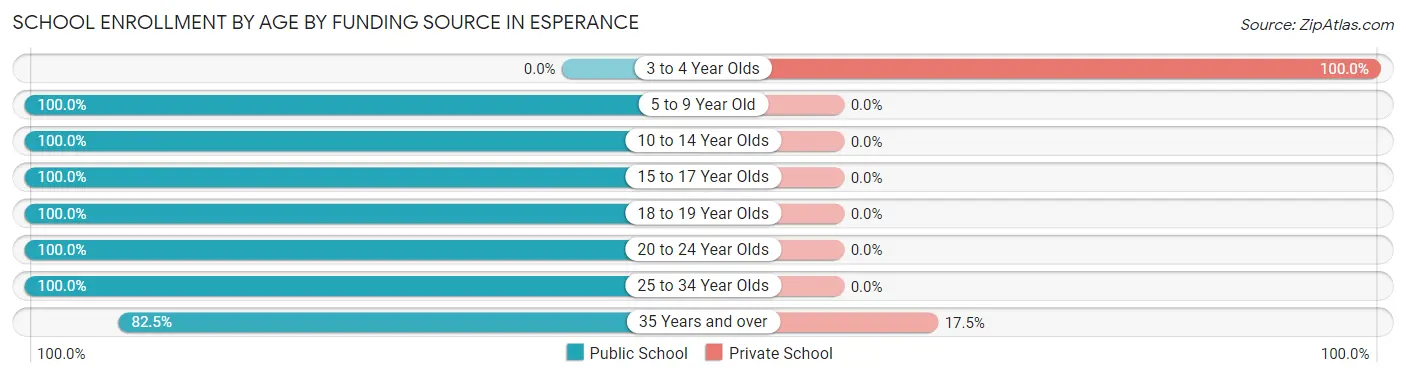
| Age Bracket | Public School | Private School |
| 3 to 4 Year Olds | 0 (0.0%) | 74 (100.0%) |
| 5 to 9 Year Old | 298 (100.0%) | 0 (0.0%) |
| 10 to 14 Year Olds | 109 (100.0%) | 0 (0.0%) |
| 15 to 17 Year Olds | 251 (100.0%) | 0 (0.0%) |
| 18 to 19 Year Olds | 25 (100.0%) | 0 (0.0%) |
| 20 to 24 Year Olds | 88 (100.0%) | 0 (0.0%) |
| 25 to 34 Year Olds | 14 (100.0%) | 0 (0.0%) |
| 35 Years and over | 179 (82.5%) | 38 (17.5%) |
| Total | 964 (89.6%) | 112 (10.4%) |
Educational Attainment by Field of Study in Esperance
Social sciences (324 | 18.7%), business (274 | 15.8%), engineering (163 | 9.4%), arts & humanities (147 | 8.5%), and psychology (140 | 8.1%) are the most common fields of study among 1,732 individuals in Esperance who have obtained a bachelor's degree or higher.
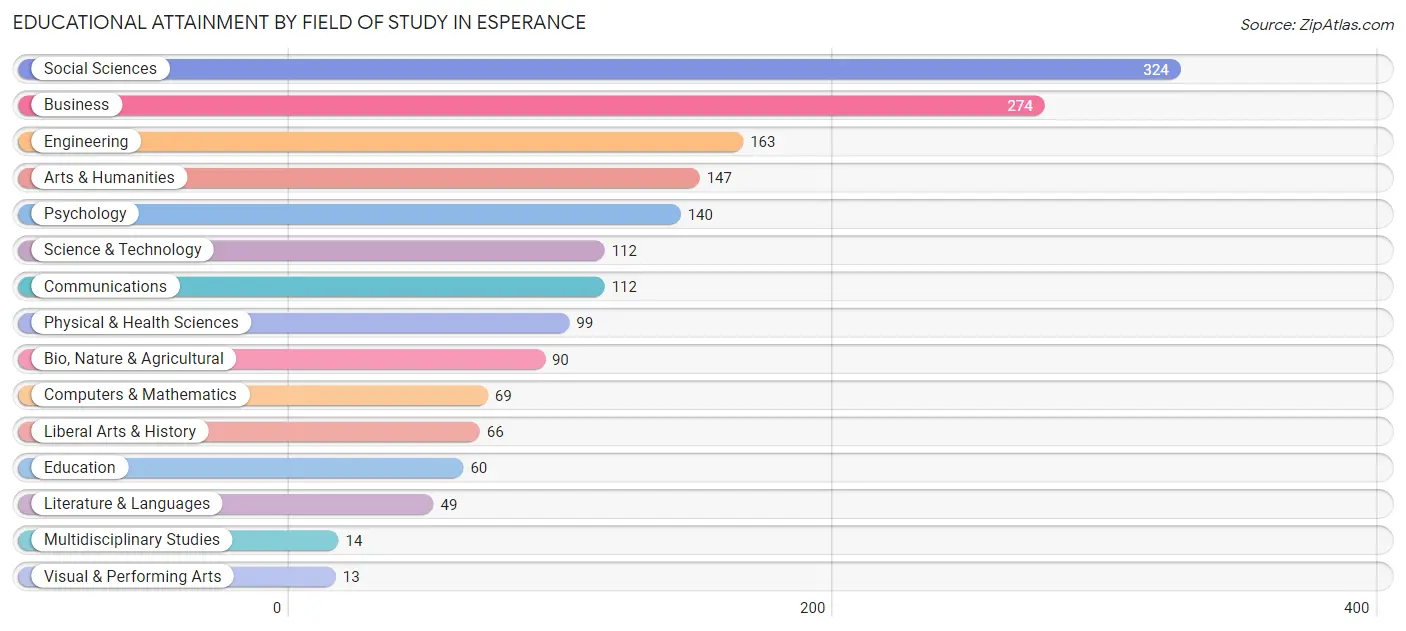
| Field of Study | # Graduates | % Graduates |
| Computers & Mathematics | 69 | 4.0% |
| Bio, Nature & Agricultural | 90 | 5.2% |
| Physical & Health Sciences | 99 | 5.7% |
| Psychology | 140 | 8.1% |
| Social Sciences | 324 | 18.7% |
| Engineering | 163 | 9.4% |
| Multidisciplinary Studies | 14 | 0.8% |
| Science & Technology | 112 | 6.5% |
| Business | 274 | 15.8% |
| Education | 60 | 3.5% |
| Literature & Languages | 49 | 2.8% |
| Liberal Arts & History | 66 | 3.8% |
| Visual & Performing Arts | 13 | 0.7% |
| Communications | 112 | 6.5% |
| Arts & Humanities | 147 | 8.5% |
| Total | 1,732 | 100.0% |
Transportation & Commute in Esperance
Vehicle Availability by Sex in Esperance
The most prevalent vehicle ownership categories in Esperance are males with 2 vehicles (272, accounting for 27.3%) and females with 2 vehicles (285, making up 23.6%).
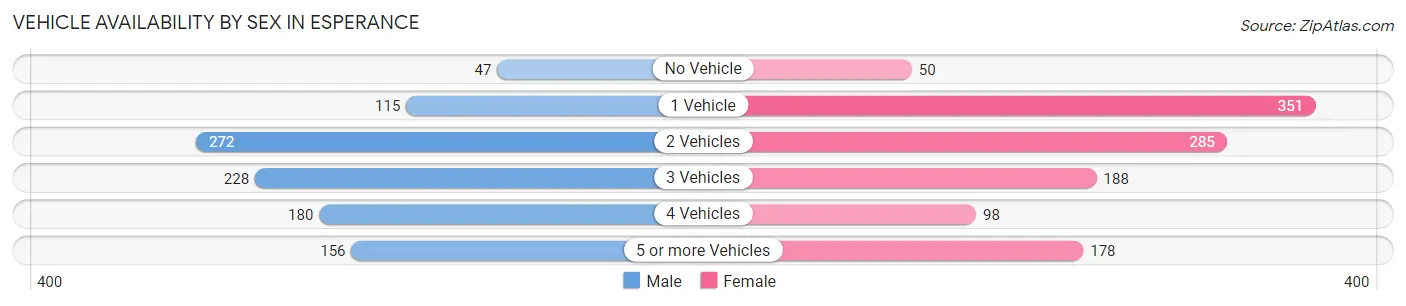
| Vehicles Available | Male | Female |
| No Vehicle | 47 (4.7%) | 50 (4.3%) |
| 1 Vehicle | 115 (11.5%) | 351 (30.5%) |
| 2 Vehicles | 272 (27.3%) | 285 (24.8%) |
| 3 Vehicles | 228 (22.9%) | 188 (16.4%) |
| 4 Vehicles | 180 (18.0%) | 98 (8.5%) |
| 5 or more Vehicles | 156 (15.6%) | 178 (15.5%) |
| Total | 998 (100.0%) | 1,150 (100.0%) |
Commute Time in Esperance
The most frequently occuring commute durations in Esperance are 10 to 14 minutes (290 commuters, 17.3%), 30 to 34 minutes (274 commuters, 16.3%), and 60 to 89 minutes (189 commuters, 11.3%).
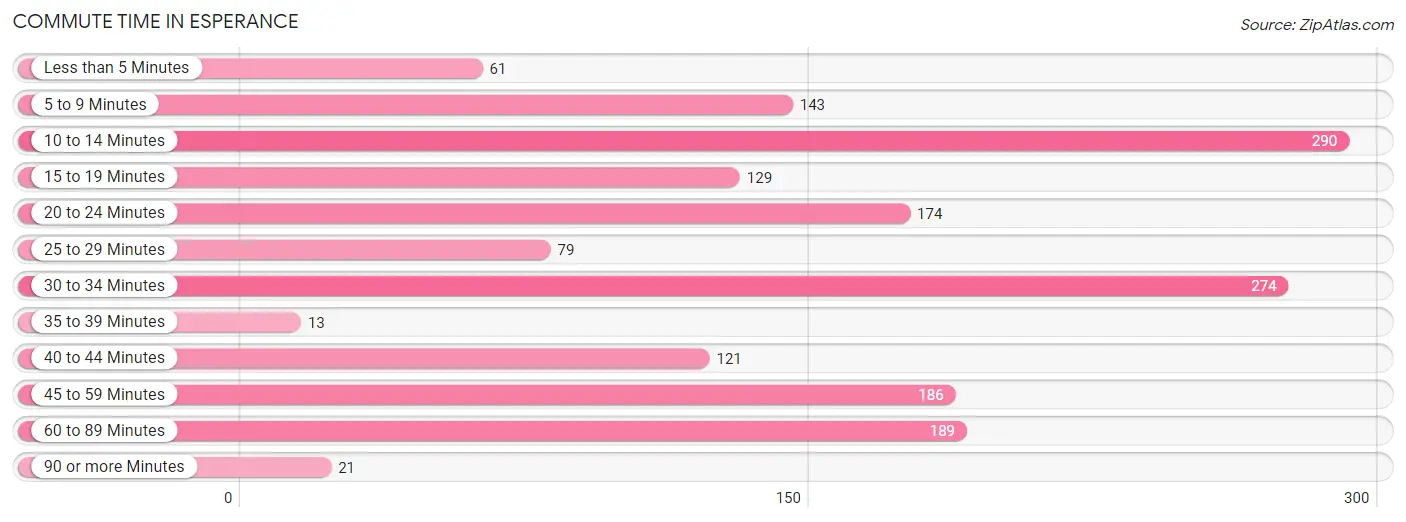
| Commute Time | # Commuters | % Commuters |
| Less than 5 Minutes | 61 | 3.6% |
| 5 to 9 Minutes | 143 | 8.5% |
| 10 to 14 Minutes | 290 | 17.3% |
| 15 to 19 Minutes | 129 | 7.7% |
| 20 to 24 Minutes | 174 | 10.4% |
| 25 to 29 Minutes | 79 | 4.7% |
| 30 to 34 Minutes | 274 | 16.3% |
| 35 to 39 Minutes | 13 | 0.8% |
| 40 to 44 Minutes | 121 | 7.2% |
| 45 to 59 Minutes | 186 | 11.1% |
| 60 to 89 Minutes | 189 | 11.3% |
| 90 or more Minutes | 21 | 1.3% |
Commute Time by Sex in Esperance
The most common commute times in Esperance are 30 to 34 minutes (140 commuters, 18.6%) for males and 10 to 14 minutes (173 commuters, 18.7%) for females.
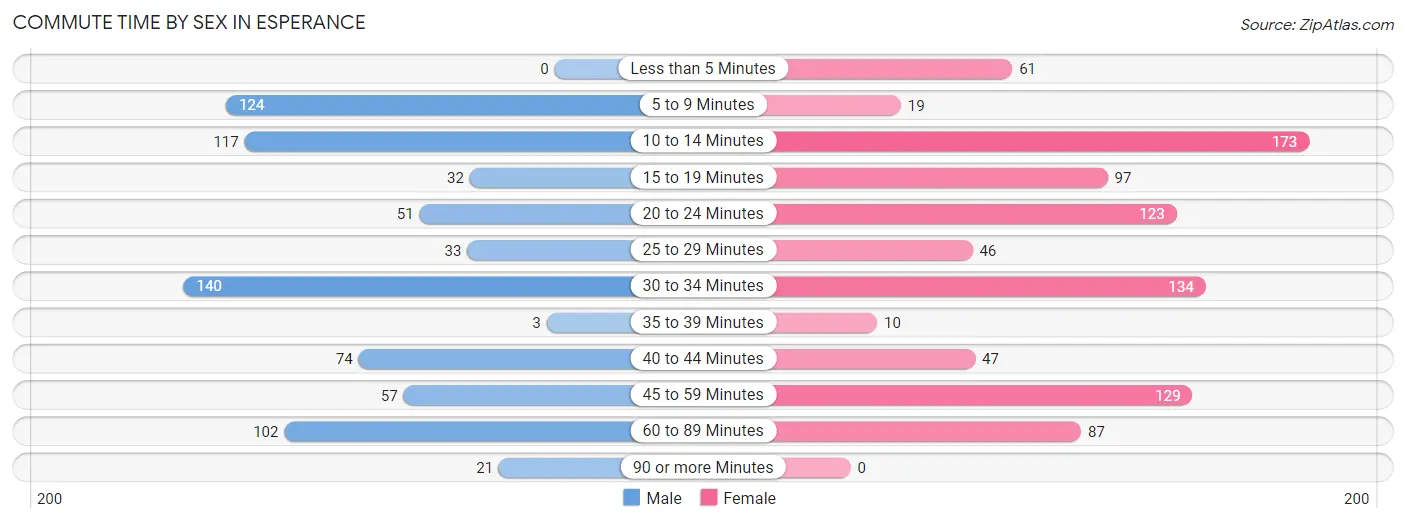
| Commute Time | Male | Female |
| Less than 5 Minutes | 0 (0.0%) | 61 (6.6%) |
| 5 to 9 Minutes | 124 (16.5%) | 19 (2.1%) |
| 10 to 14 Minutes | 117 (15.5%) | 173 (18.7%) |
| 15 to 19 Minutes | 32 (4.2%) | 97 (10.5%) |
| 20 to 24 Minutes | 51 (6.8%) | 123 (13.3%) |
| 25 to 29 Minutes | 33 (4.4%) | 46 (5.0%) |
| 30 to 34 Minutes | 140 (18.6%) | 134 (14.5%) |
| 35 to 39 Minutes | 3 (0.4%) | 10 (1.1%) |
| 40 to 44 Minutes | 74 (9.8%) | 47 (5.1%) |
| 45 to 59 Minutes | 57 (7.6%) | 129 (13.9%) |
| 60 to 89 Minutes | 102 (13.5%) | 87 (9.4%) |
| 90 or more Minutes | 21 (2.8%) | 0 (0.0%) |
Time of Departure to Work by Sex in Esperance
The most frequent times of departure to work in Esperance are 6:30 AM to 6:59 AM (125, 16.6%) for males and 7:00 AM to 7:29 AM (183, 19.8%) for females.
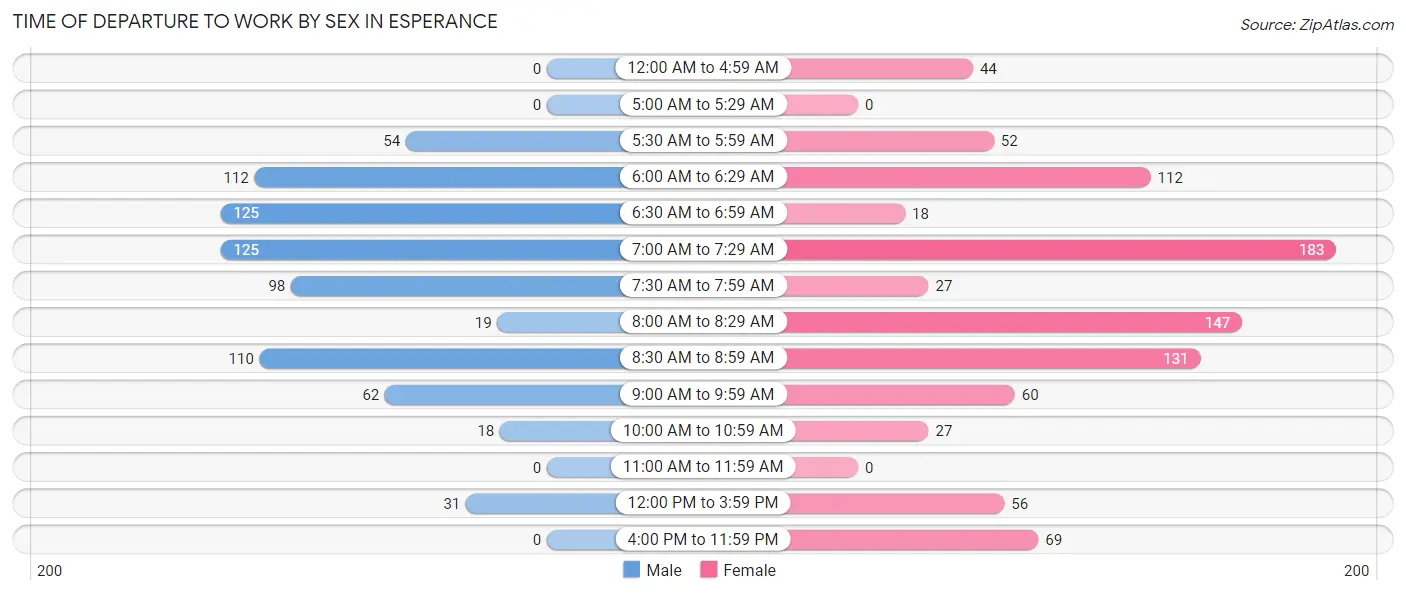
| Time of Departure | Male | Female |
| 12:00 AM to 4:59 AM | 0 (0.0%) | 44 (4.8%) |
| 5:00 AM to 5:29 AM | 0 (0.0%) | 0 (0.0%) |
| 5:30 AM to 5:59 AM | 54 (7.2%) | 52 (5.6%) |
| 6:00 AM to 6:29 AM | 112 (14.8%) | 112 (12.1%) |
| 6:30 AM to 6:59 AM | 125 (16.6%) | 18 (1.9%) |
| 7:00 AM to 7:29 AM | 125 (16.6%) | 183 (19.8%) |
| 7:30 AM to 7:59 AM | 98 (13.0%) | 27 (2.9%) |
| 8:00 AM to 8:29 AM | 19 (2.5%) | 147 (15.9%) |
| 8:30 AM to 8:59 AM | 110 (14.6%) | 131 (14.1%) |
| 9:00 AM to 9:59 AM | 62 (8.2%) | 60 (6.5%) |
| 10:00 AM to 10:59 AM | 18 (2.4%) | 27 (2.9%) |
| 11:00 AM to 11:59 AM | 0 (0.0%) | 0 (0.0%) |
| 12:00 PM to 3:59 PM | 31 (4.1%) | 56 (6.0%) |
| 4:00 PM to 11:59 PM | 0 (0.0%) | 69 (7.4%) |
| Total | 754 (100.0%) | 926 (100.0%) |
Housing Occupancy in Esperance
Occupancy by Ownership in Esperance
Of the total 1,489 dwellings in Esperance, owner-occupied units account for 1,154 (77.5%), while renter-occupied units make up 335 (22.5%).
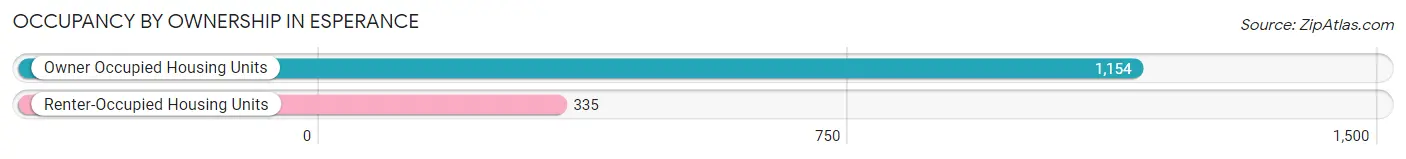
| Occupancy | # Housing Units | % Housing Units |
| Owner Occupied Housing Units | 1,154 | 77.5% |
| Renter-Occupied Housing Units | 335 | 22.5% |
| Total Occupied Housing Units | 1,489 | 100.0% |
Occupancy by Household Size in Esperance
| Household Size | # Housing Units | % Housing Units |
| 1-Person Household | 448 | 30.1% |
| 2-Person Household | 328 | 22.0% |
| 3-Person Household | 206 | 13.8% |
| 4+ Person Household | 507 | 34.1% |
| Total Housing Units | 1,489 | 100.0% |
Occupancy by Ownership by Household Size in Esperance
| Household Size | Owner-occupied | Renter-occupied |
| 1-Person Household | 287 (64.1%) | 161 (35.9%) |
| 2-Person Household | 269 (82.0%) | 59 (18.0%) |
| 3-Person Household | 206 (100.0%) | 0 (0.0%) |
| 4+ Person Household | 392 (77.3%) | 115 (22.7%) |
| Total Housing Units | 1,154 (77.5%) | 335 (22.5%) |
Occupancy by Educational Attainment in Esperance
| Household Size | Owner-occupied | Renter-occupied |
| Less than High School | 6 (100.0%) | 0 (0.0%) |
| High School Diploma | 209 (85.3%) | 36 (14.7%) |
| College/Associate Degree | 200 (57.5%) | 148 (42.5%) |
| Bachelor's Degree or higher | 739 (83.0%) | 151 (17.0%) |
Occupancy by Age of Householder in Esperance
| Age Bracket | # Households | % Households |
| Under 35 Years | 167 | 11.2% |
| 35 to 44 Years | 377 | 25.3% |
| 45 to 54 Years | 354 | 23.8% |
| 55 to 64 Years | 244 | 16.4% |
| 65 to 74 Years | 207 | 13.9% |
| 75 to 84 Years | 108 | 7.2% |
| 85 Years and Over | 32 | 2.1% |
| Total | 1,489 | 100.0% |
Housing Finances in Esperance
Median Income by Occupancy in Esperance
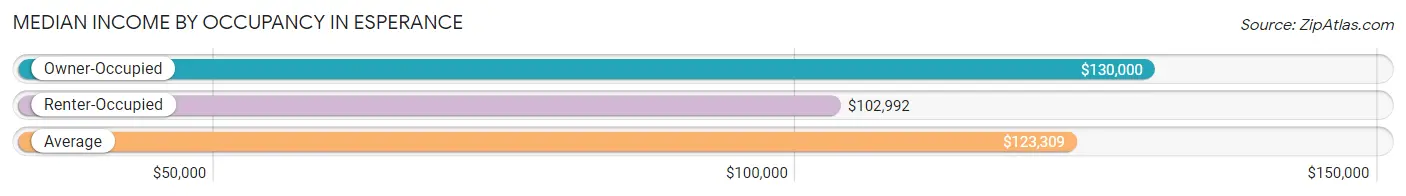
| Occupancy Type | # Households | Median Income |
| Owner-Occupied | 1,154 (77.5%) | $130,000 |
| Renter-Occupied | 335 (22.5%) | $102,992 |
| Average | 1,489 (100.0%) | $123,309 |
Occupancy by Householder Income Bracket in Esperance
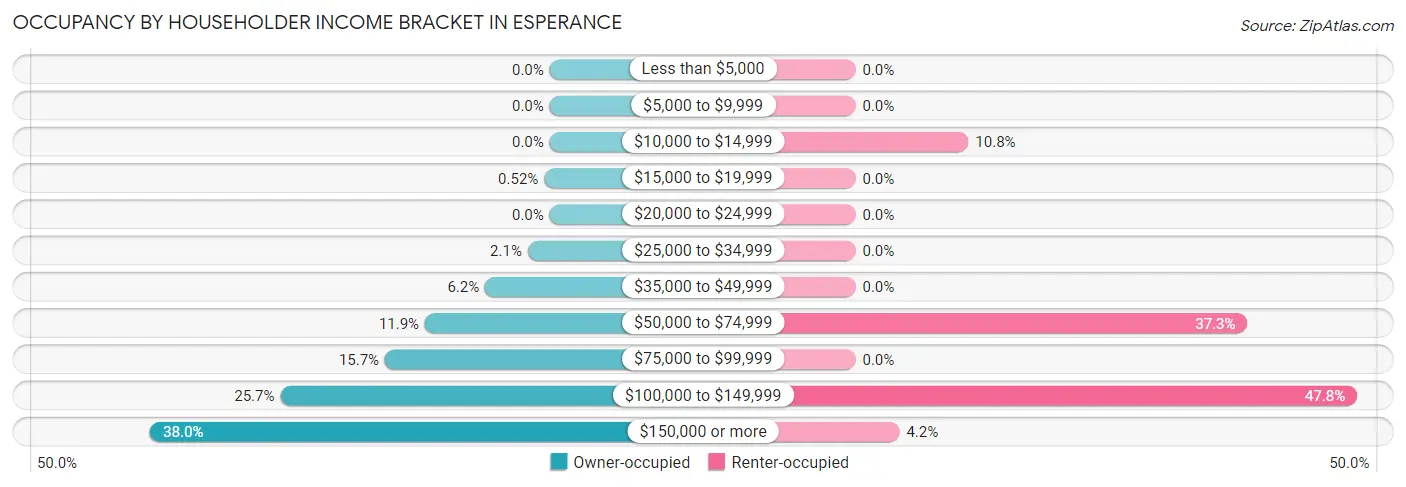
| Income Bracket | Owner-occupied | Renter-occupied |
| Less than $5,000 | 0 (0.0%) | 0 (0.0%) |
| $5,000 to $9,999 | 0 (0.0%) | 0 (0.0%) |
| $10,000 to $14,999 | 0 (0.0%) | 36 (10.7%) |
| $15,000 to $19,999 | 6 (0.5%) | 0 (0.0%) |
| $20,000 to $24,999 | 0 (0.0%) | 0 (0.0%) |
| $25,000 to $34,999 | 24 (2.1%) | 0 (0.0%) |
| $35,000 to $49,999 | 71 (6.1%) | 0 (0.0%) |
| $50,000 to $74,999 | 137 (11.9%) | 125 (37.3%) |
| $75,000 to $99,999 | 181 (15.7%) | 0 (0.0%) |
| $100,000 to $149,999 | 296 (25.7%) | 160 (47.8%) |
| $150,000 or more | 439 (38.0%) | 14 (4.2%) |
| Total | 1,154 (100.0%) | 335 (100.0%) |
Monthly Housing Cost Tiers in Esperance
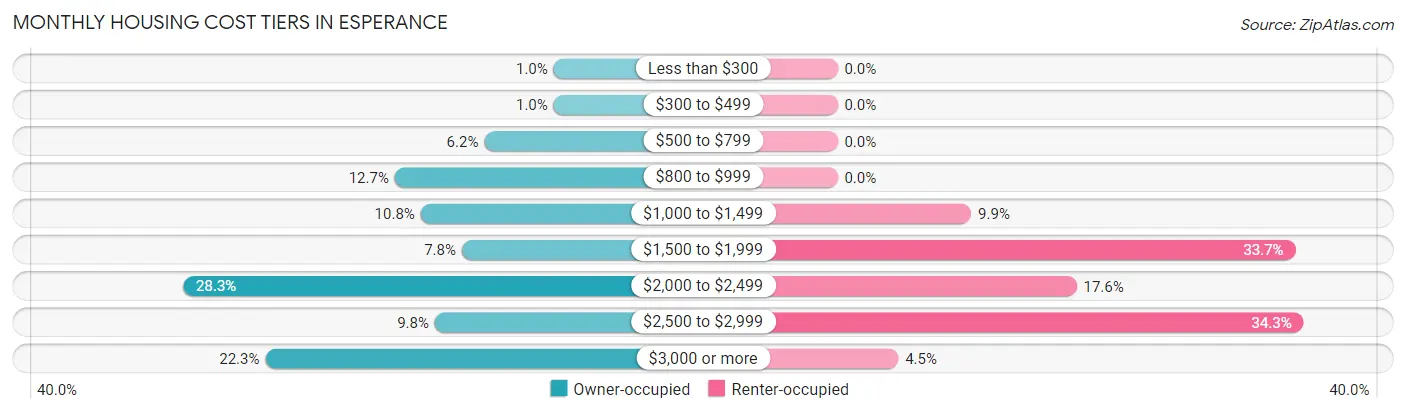
| Monthly Cost | Owner-occupied | Renter-occupied |
| Less than $300 | 12 (1.0%) | 0 (0.0%) |
| $300 to $499 | 12 (1.0%) | 0 (0.0%) |
| $500 to $799 | 71 (6.1%) | 0 (0.0%) |
| $800 to $999 | 147 (12.7%) | 0 (0.0%) |
| $1,000 to $1,499 | 125 (10.8%) | 33 (9.9%) |
| $1,500 to $1,999 | 90 (7.8%) | 113 (33.7%) |
| $2,000 to $2,499 | 327 (28.3%) | 59 (17.6%) |
| $2,500 to $2,999 | 113 (9.8%) | 115 (34.3%) |
| $3,000 or more | 257 (22.3%) | 15 (4.5%) |
| Total | 1,154 (100.0%) | 335 (100.0%) |
Physical Housing Characteristics in Esperance
Housing Structures in Esperance
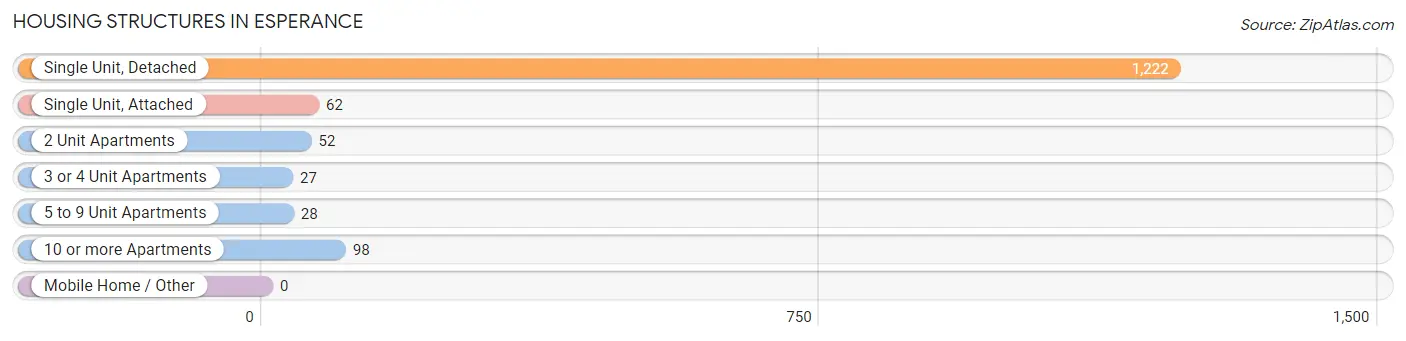
| Structure Type | # Housing Units | % Housing Units |
| Single Unit, Detached | 1,222 | 82.1% |
| Single Unit, Attached | 62 | 4.2% |
| 2 Unit Apartments | 52 | 3.5% |
| 3 or 4 Unit Apartments | 27 | 1.8% |
| 5 to 9 Unit Apartments | 28 | 1.9% |
| 10 or more Apartments | 98 | 6.6% |
| Mobile Home / Other | 0 | 0.0% |
| Total | 1,489 | 100.0% |
Housing Structures by Occupancy in Esperance
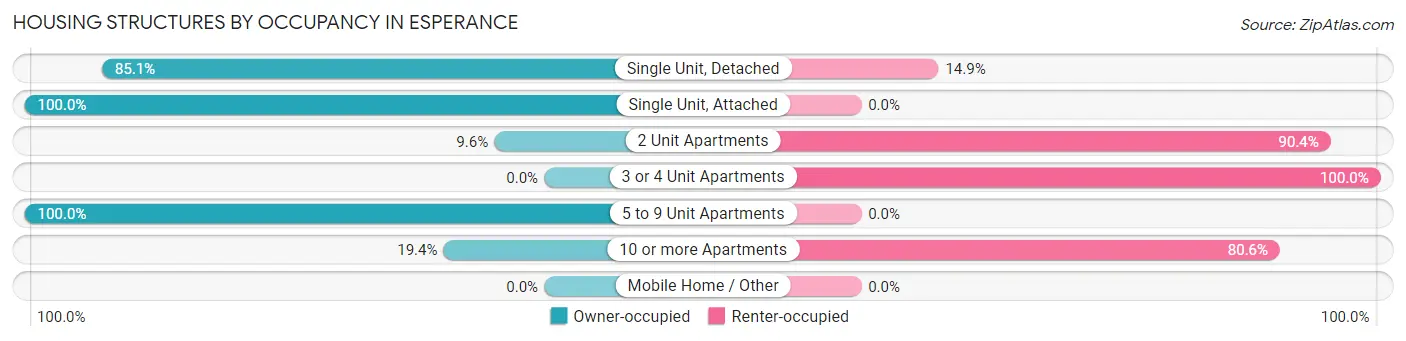
| Structure Type | Owner-occupied | Renter-occupied |
| Single Unit, Detached | 1,040 (85.1%) | 182 (14.9%) |
| Single Unit, Attached | 62 (100.0%) | 0 (0.0%) |
| 2 Unit Apartments | 5 (9.6%) | 47 (90.4%) |
| 3 or 4 Unit Apartments | 0 (0.0%) | 27 (100.0%) |
| 5 to 9 Unit Apartments | 28 (100.0%) | 0 (0.0%) |
| 10 or more Apartments | 19 (19.4%) | 79 (80.6%) |
| Mobile Home / Other | 0 (0.0%) | 0 (0.0%) |
| Total | 1,154 (77.5%) | 335 (22.5%) |
Housing Structures by Number of Rooms in Esperance
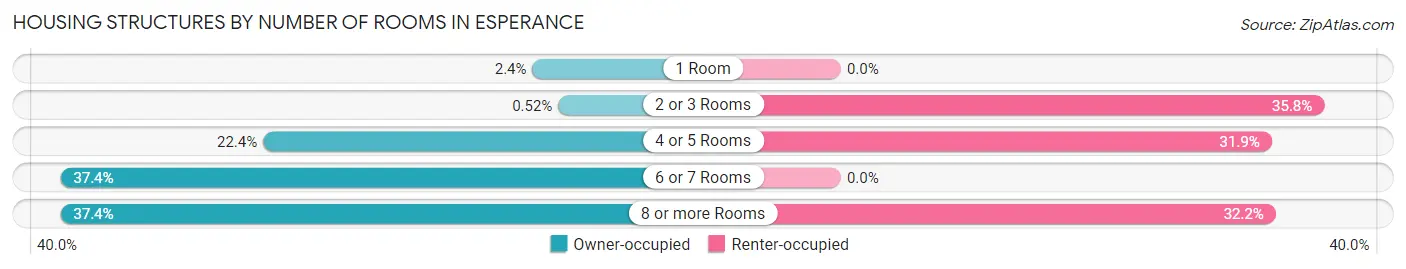
| Number of Rooms | Owner-occupied | Renter-occupied |
| 1 Room | 28 (2.4%) | 0 (0.0%) |
| 2 or 3 Rooms | 6 (0.5%) | 120 (35.8%) |
| 4 or 5 Rooms | 258 (22.4%) | 107 (31.9%) |
| 6 or 7 Rooms | 431 (37.3%) | 0 (0.0%) |
| 8 or more Rooms | 431 (37.3%) | 108 (32.2%) |
| Total | 1,154 (100.0%) | 335 (100.0%) |
Housing Structure by Heating Type in Esperance
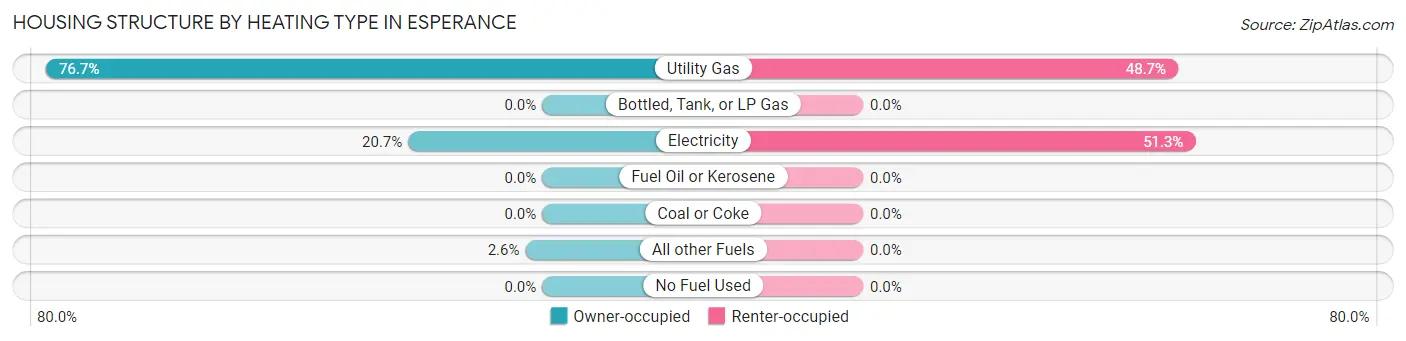
| Heating Type | Owner-occupied | Renter-occupied |
| Utility Gas | 885 (76.7%) | 163 (48.7%) |
| Bottled, Tank, or LP Gas | 0 (0.0%) | 0 (0.0%) |
| Electricity | 239 (20.7%) | 172 (51.3%) |
| Fuel Oil or Kerosene | 0 (0.0%) | 0 (0.0%) |
| Coal or Coke | 0 (0.0%) | 0 (0.0%) |
| All other Fuels | 30 (2.6%) | 0 (0.0%) |
| No Fuel Used | 0 (0.0%) | 0 (0.0%) |
| Total | 1,154 (100.0%) | 335 (100.0%) |
Household Vehicle Usage in Esperance
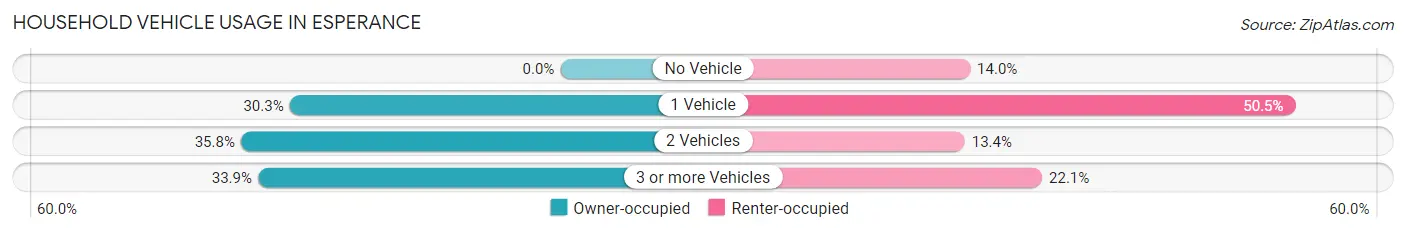
| Vehicles per Household | Owner-occupied | Renter-occupied |
| No Vehicle | 0 (0.0%) | 47 (14.0%) |
| 1 Vehicle | 350 (30.3%) | 169 (50.4%) |
| 2 Vehicles | 413 (35.8%) | 45 (13.4%) |
| 3 or more Vehicles | 391 (33.9%) | 74 (22.1%) |
| Total | 1,154 (100.0%) | 335 (100.0%) |
Real Estate & Mortgages in Esperance
Real Estate and Mortgage Overview in Esperance
| Characteristic | Without Mortgage | With Mortgage |
| Housing Units | 284 | 870 |
| Median Property Value | $642,000 | $716,500 |
| Median Household Income | $97,885 | $392 |
| Monthly Housing Costs | $918 | $257 |
| Real Estate Taxes | $6,458 | $34 |
Property Value by Mortgage Status in Esperance
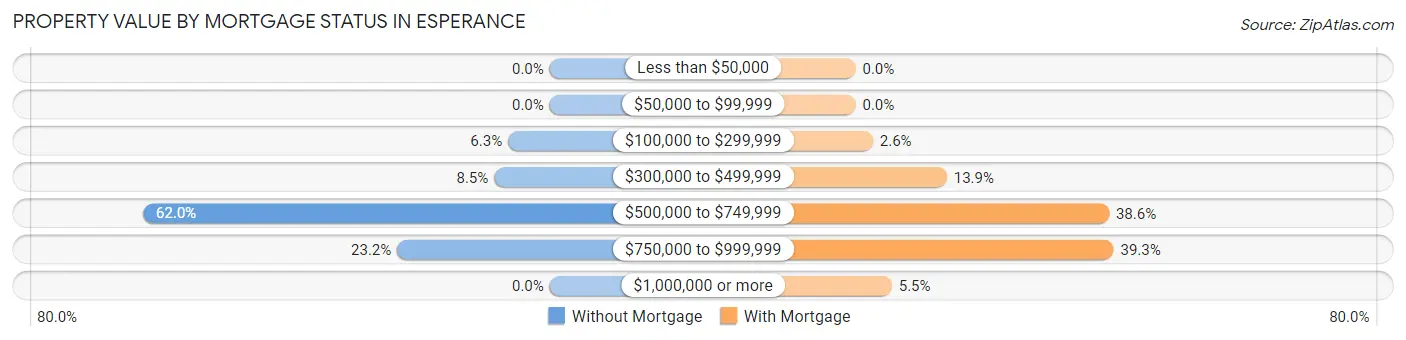
| Property Value | Without Mortgage | With Mortgage |
| Less than $50,000 | 0 (0.0%) | 0 (0.0%) |
| $50,000 to $99,999 | 0 (0.0%) | 0 (0.0%) |
| $100,000 to $299,999 | 18 (6.3%) | 23 (2.6%) |
| $300,000 to $499,999 | 24 (8.5%) | 121 (13.9%) |
| $500,000 to $749,999 | 176 (62.0%) | 336 (38.6%) |
| $750,000 to $999,999 | 66 (23.2%) | 342 (39.3%) |
| $1,000,000 or more | 0 (0.0%) | 48 (5.5%) |
| Total | 284 (100.0%) | 870 (100.0%) |
Household Income by Mortgage Status in Esperance
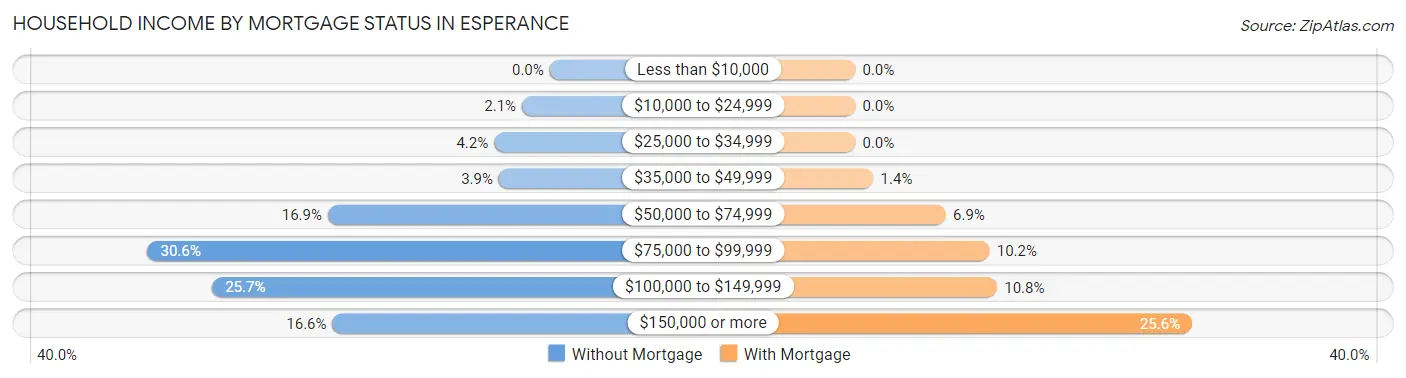
| Household Income | Without Mortgage | With Mortgage |
| Less than $10,000 | 0 (0.0%) | 0 (0.0%) |
| $10,000 to $24,999 | 6 (2.1%) | 0 (0.0%) |
| $25,000 to $34,999 | 12 (4.2%) | 0 (0.0%) |
| $35,000 to $49,999 | 11 (3.9%) | 12 (1.4%) |
| $50,000 to $74,999 | 48 (16.9%) | 60 (6.9%) |
| $75,000 to $99,999 | 87 (30.6%) | 89 (10.2%) |
| $100,000 to $149,999 | 73 (25.7%) | 94 (10.8%) |
| $150,000 or more | 47 (16.6%) | 223 (25.6%) |
| Total | 284 (100.0%) | 870 (100.0%) |
Property Value to Household Income Ratio in Esperance
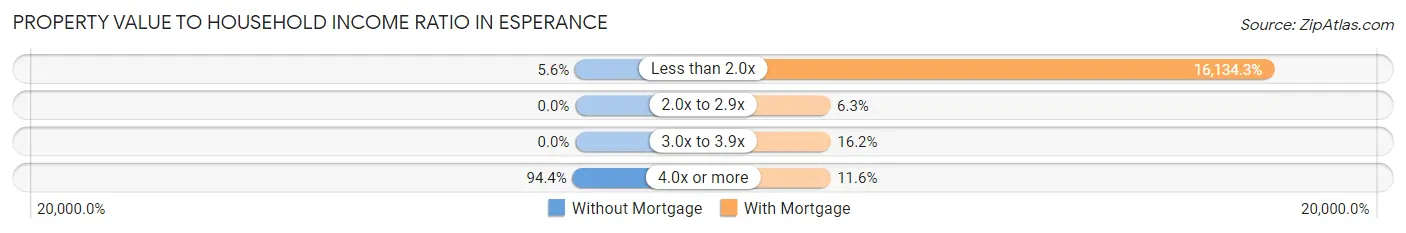
| Value-to-Income Ratio | Without Mortgage | With Mortgage |
| Less than 2.0x | 16 (5.6%) | 140,368 (16,134.3%) |
| 2.0x to 2.9x | 0 (0.0%) | 55 (6.3%) |
| 3.0x to 3.9x | 0 (0.0%) | 141 (16.2%) |
| 4.0x or more | 268 (94.4%) | 101 (11.6%) |
| Total | 284 (100.0%) | 870 (100.0%) |
Real Estate Taxes by Mortgage Status in Esperance
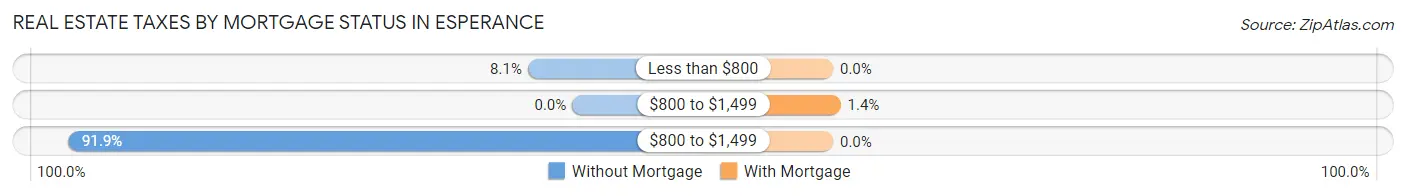
| Property Taxes | Without Mortgage | With Mortgage |
| Less than $800 | 23 (8.1%) | 0 (0.0%) |
| $800 to $1,499 | 0 (0.0%) | 12 (1.4%) |
| $800 to $1,499 | 261 (91.9%) | 0 (0.0%) |
| Total | 284 (100.0%) | 870 (100.0%) |
Health & Disability in Esperance
Health Insurance Coverage by Age in Esperance
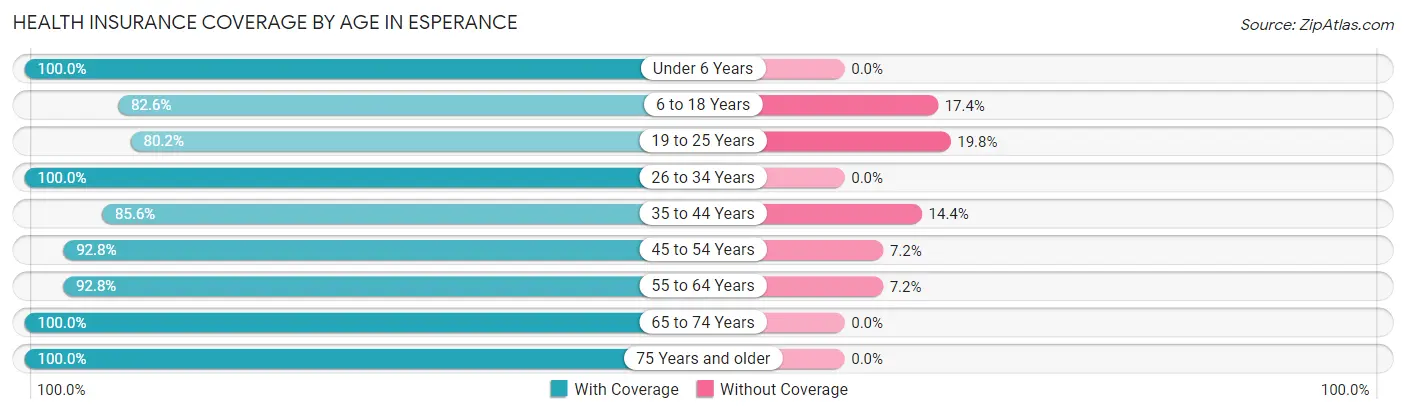
| Age Bracket | With Coverage | Without Coverage |
| Under 6 Years | 335 (100.0%) | 0 (0.0%) |
| 6 to 18 Years | 550 (82.6%) | 116 (17.4%) |
| 19 to 25 Years | 203 (80.2%) | 50 (19.8%) |
| 26 to 34 Years | 450 (100.0%) | 0 (0.0%) |
| 35 to 44 Years | 819 (85.6%) | 138 (14.4%) |
| 45 to 54 Years | 412 (92.8%) | 32 (7.2%) |
| 55 to 64 Years | 428 (92.8%) | 33 (7.2%) |
| 65 to 74 Years | 368 (100.0%) | 0 (0.0%) |
| 75 Years and older | 310 (100.0%) | 0 (0.0%) |
| Total | 3,875 (91.3%) | 369 (8.7%) |
Health Insurance Coverage by Citizenship Status in Esperance
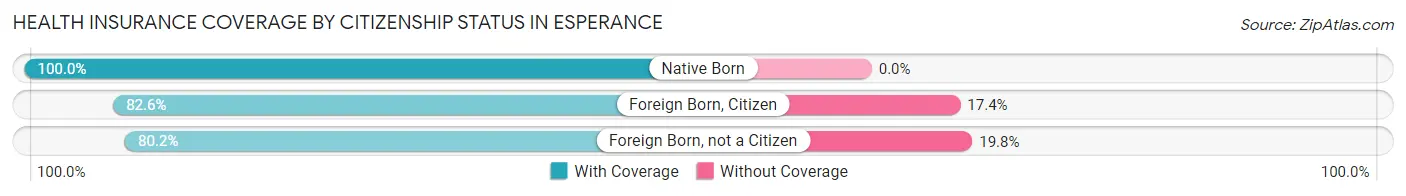
| Citizenship Status | With Coverage | Without Coverage |
| Native Born | 335 (100.0%) | 0 (0.0%) |
| Foreign Born, Citizen | 550 (82.6%) | 116 (17.4%) |
| Foreign Born, not a Citizen | 203 (80.2%) | 50 (19.8%) |
Health Insurance Coverage by Household Income in Esperance
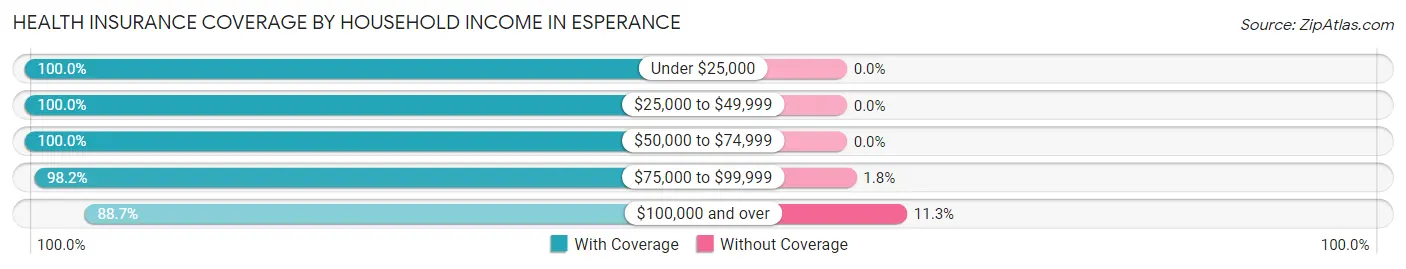
| Household Income | With Coverage | Without Coverage |
| Under $25,000 | 42 (100.0%) | 0 (0.0%) |
| $25,000 to $49,999 | 99 (100.0%) | 0 (0.0%) |
| $50,000 to $74,999 | 338 (100.0%) | 0 (0.0%) |
| $75,000 to $99,999 | 492 (98.2%) | 9 (1.8%) |
| $100,000 and over | 2,838 (88.7%) | 360 (11.3%) |
Public vs Private Health Insurance Coverage by Age in Esperance
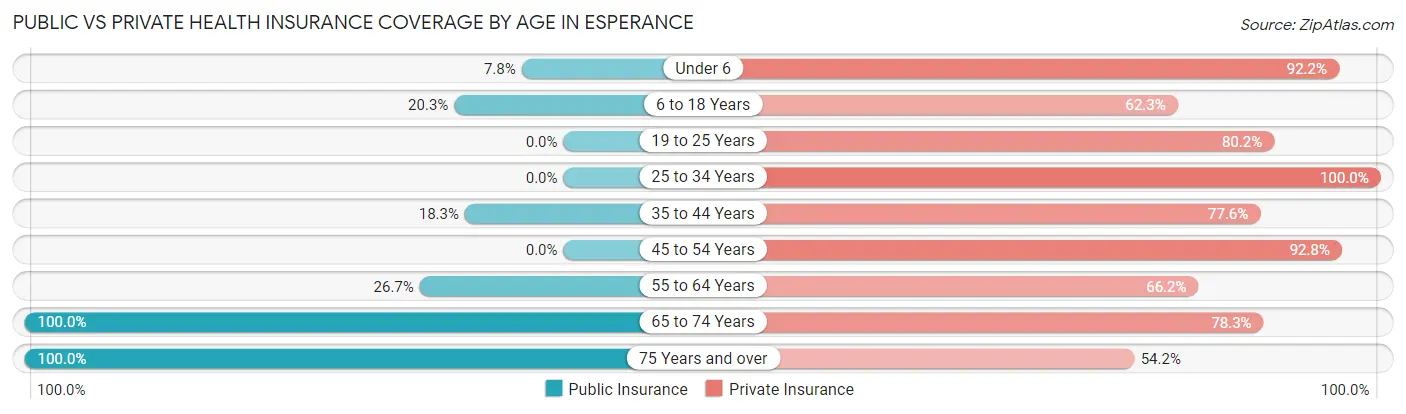
| Age Bracket | Public Insurance | Private Insurance |
| Under 6 | 26 (7.8%) | 309 (92.2%) |
| 6 to 18 Years | 135 (20.3%) | 415 (62.3%) |
| 19 to 25 Years | 0 (0.0%) | 203 (80.2%) |
| 25 to 34 Years | 0 (0.0%) | 450 (100.0%) |
| 35 to 44 Years | 175 (18.3%) | 743 (77.6%) |
| 45 to 54 Years | 0 (0.0%) | 412 (92.8%) |
| 55 to 64 Years | 123 (26.7%) | 305 (66.2%) |
| 65 to 74 Years | 368 (100.0%) | 288 (78.3%) |
| 75 Years and over | 310 (100.0%) | 168 (54.2%) |
| Total | 1,137 (26.8%) | 3,293 (77.6%) |
Disability Status by Sex by Age in Esperance
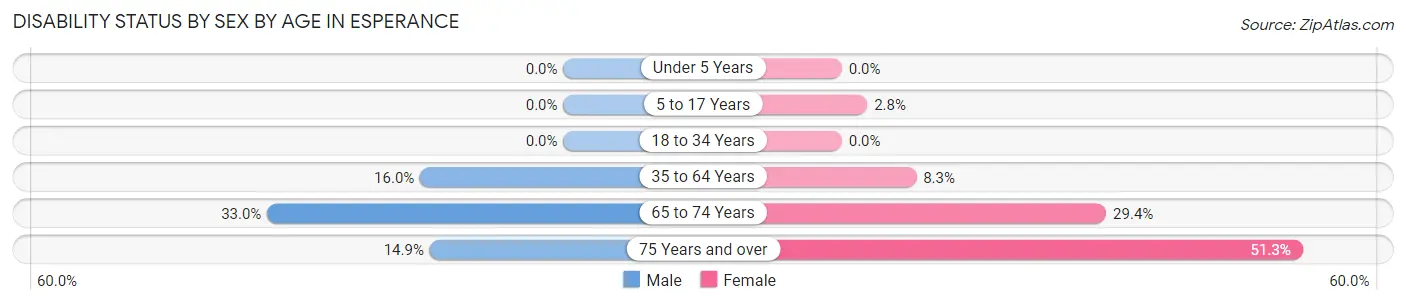
| Age Bracket | Male | Female |
| Under 5 Years | 0 (0.0%) | 0 (0.0%) |
| 5 to 17 Years | 0 (0.0%) | 8 (2.8%) |
| 18 to 34 Years | 0 (0.0%) | 0 (0.0%) |
| 35 to 64 Years | 145 (16.0%) | 79 (8.3%) |
| 65 to 74 Years | 62 (33.0%) | 53 (29.4%) |
| 75 Years and over | 18 (14.9%) | 97 (51.3%) |
Disability Class by Sex by Age in Esperance
Disability Class: Hearing Difficulty
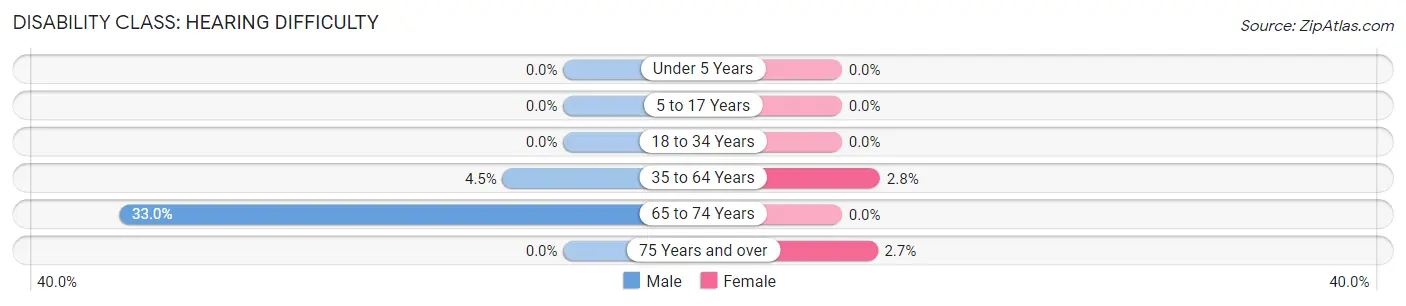
| Age Bracket | Male | Female |
| Under 5 Years | 0 (0.0%) | 0 (0.0%) |
| 5 to 17 Years | 0 (0.0%) | 0 (0.0%) |
| 18 to 34 Years | 0 (0.0%) | 0 (0.0%) |
| 35 to 64 Years | 41 (4.5%) | 27 (2.8%) |
| 65 to 74 Years | 62 (33.0%) | 0 (0.0%) |
| 75 Years and over | 0 (0.0%) | 5 (2.6%) |
Disability Class: Vision Difficulty
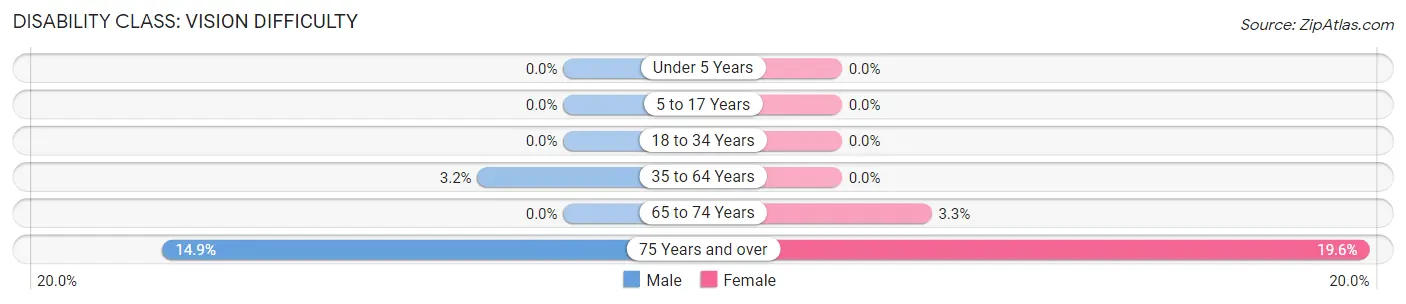
| Age Bracket | Male | Female |
| Under 5 Years | 0 (0.0%) | 0 (0.0%) |
| 5 to 17 Years | 0 (0.0%) | 0 (0.0%) |
| 18 to 34 Years | 0 (0.0%) | 0 (0.0%) |
| 35 to 64 Years | 29 (3.2%) | 0 (0.0%) |
| 65 to 74 Years | 0 (0.0%) | 6 (3.3%) |
| 75 Years and over | 18 (14.9%) | 37 (19.6%) |
Disability Class: Cognitive Difficulty
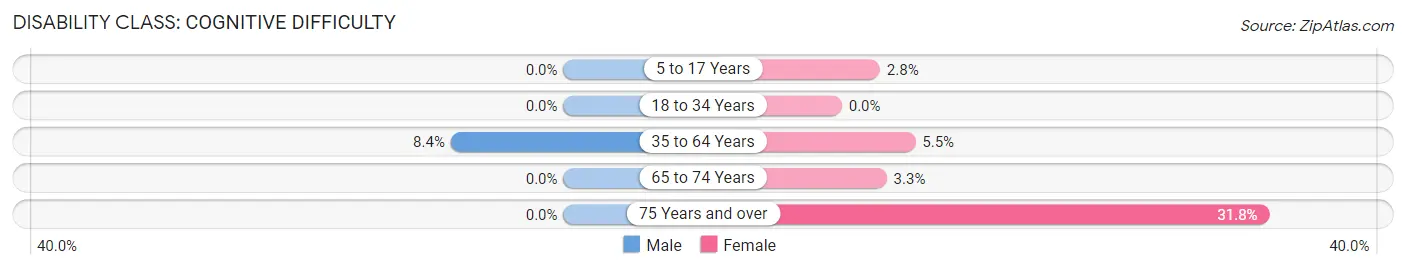
| Age Bracket | Male | Female |
| 5 to 17 Years | 0 (0.0%) | 8 (2.8%) |
| 18 to 34 Years | 0 (0.0%) | 0 (0.0%) |
| 35 to 64 Years | 76 (8.4%) | 52 (5.5%) |
| 65 to 74 Years | 0 (0.0%) | 6 (3.3%) |
| 75 Years and over | 0 (0.0%) | 60 (31.8%) |
Disability Class: Ambulatory Difficulty
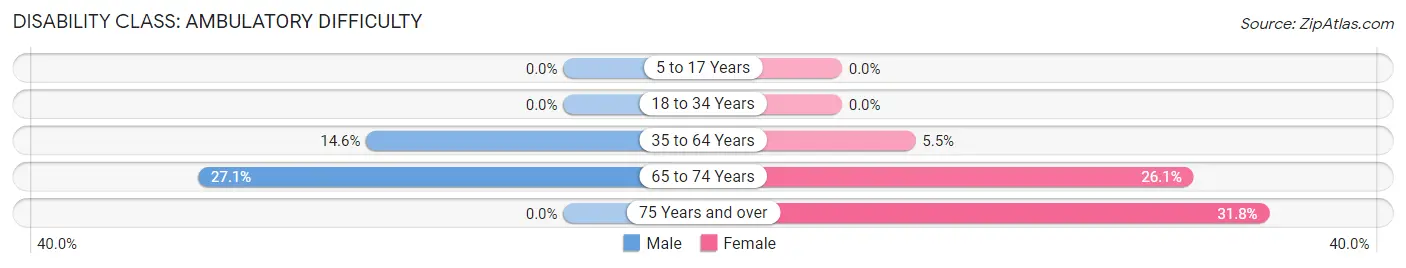
| Age Bracket | Male | Female |
| 5 to 17 Years | 0 (0.0%) | 0 (0.0%) |
| 18 to 34 Years | 0 (0.0%) | 0 (0.0%) |
| 35 to 64 Years | 133 (14.6%) | 52 (5.5%) |
| 65 to 74 Years | 51 (27.1%) | 47 (26.1%) |
| 75 Years and over | 0 (0.0%) | 60 (31.8%) |
Disability Class: Self-Care Difficulty
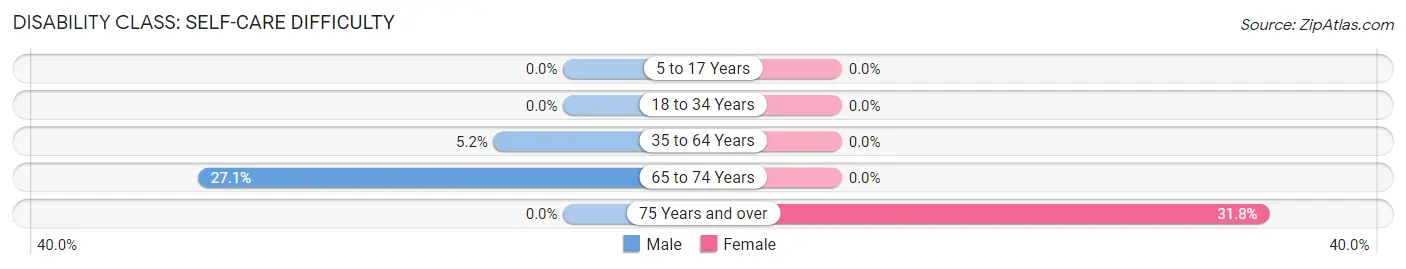
| Age Bracket | Male | Female |
| 5 to 17 Years | 0 (0.0%) | 0 (0.0%) |
| 18 to 34 Years | 0 (0.0%) | 0 (0.0%) |
| 35 to 64 Years | 47 (5.2%) | 0 (0.0%) |
| 65 to 74 Years | 51 (27.1%) | 0 (0.0%) |
| 75 Years and over | 0 (0.0%) | 60 (31.8%) |
Technology Access in Esperance
Computing Device Access in Esperance
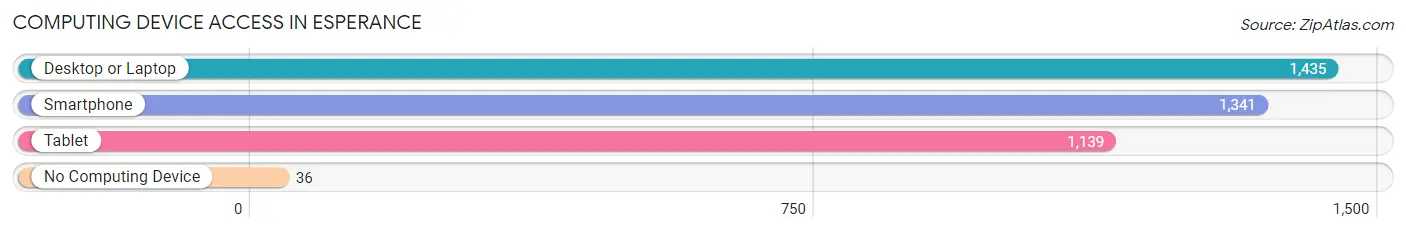
| Device Type | # Households | % Households |
| Desktop or Laptop | 1,435 | 96.4% |
| Smartphone | 1,341 | 90.1% |
| Tablet | 1,139 | 76.5% |
| No Computing Device | 36 | 2.4% |
| Total | 1,489 | 100.0% |
Internet Access in Esperance
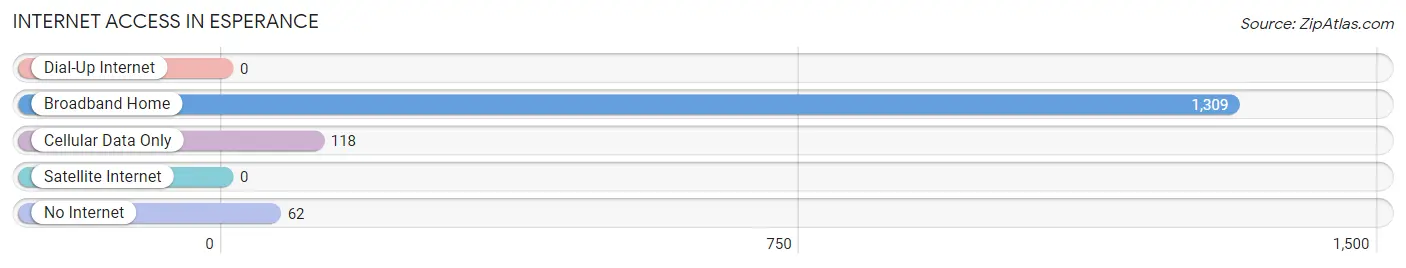
| Internet Type | # Households | % Households |
| Dial-Up Internet | 0 | 0.0% |
| Broadband Home | 1,309 | 87.9% |
| Cellular Data Only | 118 | 7.9% |
| Satellite Internet | 0 | 0.0% |
| No Internet | 62 | 4.2% |
| Total | 1,489 | 100.0% |
Esperance Summary
Esperance is a coastal town located in the south-eastern corner of Western Australia. It is situated on the shores of the Great Australian Bight, approximately 720 kilometres south-east of Perth. The town is the largest in the Shire of Esperance, and is the gateway to the region’s many attractions.
History
The area around Esperance was first explored by Europeans in the late 18th century, when French explorer Nicolas Baudin sailed along the coast. The first European settlement in the area was established in 1802, when the French established a whaling station at Thistle Cove. The station was abandoned in 1810, but the area was later explored by the British in 1826.
The town of Esperance was officially established in 1864, when the first settlers arrived from England. The town was named after the French ship, L’Esperance, which had been wrecked off the coast in 1802. The town quickly grew, and by the early 1900s it had become a thriving port and commercial centre.
Geography
Esperance is located on the south-eastern corner of Western Australia, on the shores of the Great Australian Bight. The town is situated on the edge of the Esperance Plains, a flat, sandy plain that stretches from the coast to the inland areas of the region. The town is surrounded by a number of national parks and reserves, including Cape Le Grand National Park, Fitzgerald River National Park and Stokes National Park.
The climate in Esperance is generally mild and temperate, with warm summers and cool winters. The average temperature in summer is around 25°C, while in winter it is around 15°C. The town receives an average of 890mm of rainfall per year, with most of the rain falling in winter and spring.
Economy
Esperance is a major regional centre for the south-eastern corner of Western Australia. The town’s economy is largely based on tourism, with the town’s many attractions drawing visitors from all over the world. The town is also a major port, with a large fishing fleet operating out of the harbour.
The town is also home to a number of industries, including mining, agriculture and manufacturing. The region is home to a number of mines, including the Ravensthorpe Nickel Mine, which is one of the largest nickel mines in the world. The town is also home to a number of agricultural businesses, including sheep and cattle farms, as well as a number of wineries.
Demographics
As of the 2016 census, the population of Esperance was 13,926. The town has a median age of 40, with the majority of the population being between the ages of 25 and 54. The town has a diverse population, with the largest ethnic groups being Australian, English, Irish, Scottish and German.
The town has a strong sense of community, with a number of local clubs and organisations. The town is also home to a number of festivals and events, including the Esperance Bay Festival, the Esperance Cup and the Esperance Show.
Esperance is a vibrant and diverse town, with a rich history and a strong sense of community. The town’s economy is largely based on tourism, with the town’s many attractions drawing visitors from all over the world. The town is also home to a number of industries, including mining, agriculture and manufacturing. The town has a diverse population, with the largest ethnic groups being Australian, English, Irish, Scottish and German.
Common Questions
What is Per Capita Income in Esperance?
Per Capita income in Esperance is $48,702.
What is the Median Family Income in Esperance?
Median Family Income in Esperance is $129,596.
What is the Median Household income in Esperance?
Median Household Income in Esperance is $123,309.
What is Income or Wage Gap in Esperance?
Income or Wage Gap in Esperance is 19.4%.
Women in Esperance earn 80.6 cents for every dollar earned by a man.
What is Inequality or Gini Index in Esperance?
Inequality or Gini Index in Esperance is 0.34.
What is the Total Population of Esperance?
Total Population of Esperance is 4,268.
What is the Total Male Population of Esperance?
Total Male Population of Esperance is 2,133.
What is the Total Female Population of Esperance?
Total Female Population of Esperance is 2,135.
What is the Ratio of Males per 100 Females in Esperance?
There are 99.91 Males per 100 Females in Esperance.
What is the Ratio of Females per 100 Males in Esperance?
There are 100.09 Females per 100 Males in Esperance.
What is the Median Population Age in Esperance?
Median Population Age in Esperance is 40.3 Years.
What is the Average Family Size in Esperance
Average Family Size in Esperance is 3.1 People.
What is the Average Household Size in Esperance
Average Household Size in Esperance is 2.8 People.
How Large is the Labor Force in Esperance?
There are 2,318 People in the Labor Forcein in Esperance.
What is the Percentage of People in the Labor Force in Esperance?
66.6% of People are in the Labor Force in Esperance.
What is the Unemployment Rate in Esperance?
Unemployment Rate in Esperance is 3.0%.