Zip Codes with the Highest Percentage of Population Employed in Computer & Mathematics in Washington
RELATED REPORTS & OPTIONS
Computer & Mathematics
Washington
Compare Zip Codes
Map of Zip Codes with the Highest Percentage of Population Employed in Computer & Mathematics in Washington
0.0%
80.0%
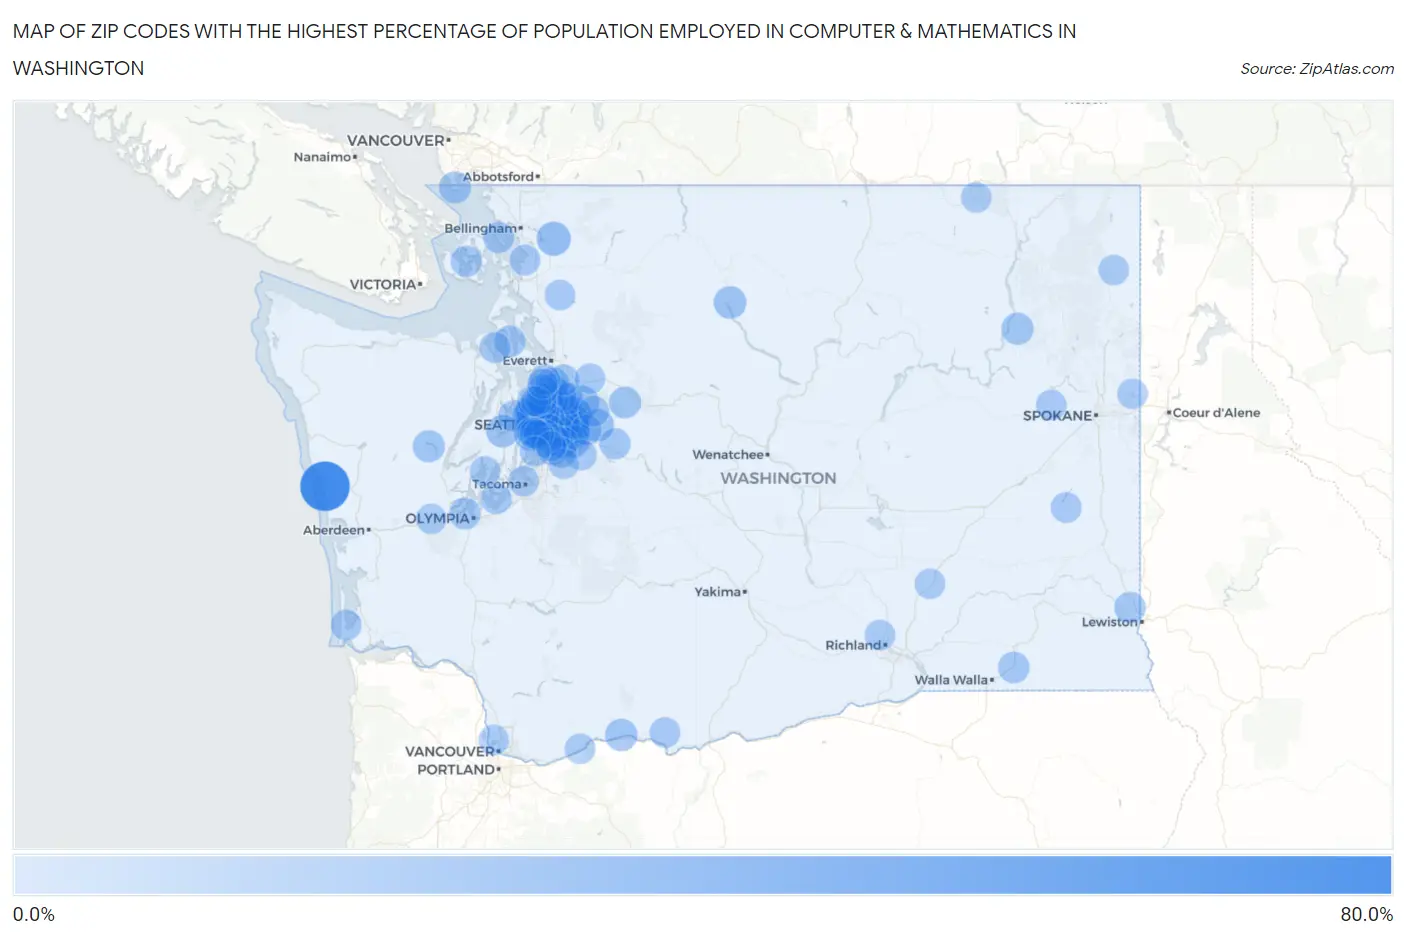
Zip Codes with the Highest Percentage of Population Employed in Computer & Mathematics in Washington
| Zip Code | % Employed | vs State | vs National | |
| 1. | 98562 | 70.5% | 6.1%(+64.5)#1 | 3.5%(+67.0)#8 |
| 2. | 98007 | 34.8% | 6.1%(+28.8)#2 | 3.5%(+31.3)#33 |
| 3. | 98052 | 33.5% | 6.1%(+27.4)#3 | 3.5%(+30.0)#35 |
| 4. | 98109 | 29.0% | 6.1%(+22.9)#4 | 3.5%(+25.5)#56 |
| 5. | 98101 | 29.0% | 6.1%(+22.9)#5 | 3.5%(+25.5)#57 |
| 6. | 98004 | 27.7% | 6.1%(+21.7)#6 | 3.5%(+24.2)#65 |
| 7. | 98121 | 27.2% | 6.1%(+21.1)#7 | 3.5%(+23.7)#66 |
| 8. | 98005 | 26.7% | 6.1%(+20.6)#8 | 3.5%(+23.1)#68 |
| 9. | 98053 | 23.2% | 6.1%(+17.2)#9 | 3.5%(+19.7)#93 |
| 10. | 98074 | 21.9% | 6.1%(+15.8)#10 | 3.5%(+18.3)#110 |
| 11. | 98029 | 20.2% | 6.1%(+14.2)#11 | 3.5%(+16.7)#126 |
| 12. | 98075 | 18.8% | 6.1%(+12.8)#12 | 3.5%(+15.3)#152 |
| 13. | 98164 | 18.8% | 6.1%(+12.7)#13 | 3.5%(+15.3)#153 |
| 14. | 98033 | 18.4% | 6.1%(+12.3)#14 | 3.5%(+14.8)#166 |
| 15. | 98008 | 18.1% | 6.1%(+12.0)#15 | 3.5%(+14.5)#175 |
| 16. | 98220 | 17.9% | 6.1%(+11.8)#16 | 3.5%(+14.4)#178 |
| 17. | 98122 | 17.6% | 6.1%(+11.6)#17 | 3.5%(+14.1)#184 |
| 18. | 98107 | 16.4% | 6.1%(+10.3)#18 | 3.5%(+12.9)#204 |
| 19. | 98021 | 16.4% | 6.1%(+10.3)#19 | 3.5%(+12.9)#205 |
| 20. | 98019 | 16.0% | 6.1%(+9.96)#20 | 3.5%(+12.5)#218 |
| 21. | 98102 | 15.4% | 6.1%(+9.37)#21 | 3.5%(+11.9)#233 |
| 22. | 98199 | 15.3% | 6.1%(+9.22)#22 | 3.5%(+11.8)#241 |
| 23. | 98006 | 15.1% | 6.1%(+9.08)#23 | 3.5%(+11.6)#249 |
| 24. | 98034 | 14.9% | 6.1%(+8.79)#24 | 3.5%(+11.3)#261 |
| 25. | 98104 | 14.7% | 6.1%(+8.61)#25 | 3.5%(+11.1)#270 |
| 26. | 98072 | 14.1% | 6.1%(+8.08)#26 | 3.5%(+10.6)#296 |
| 27. | 98011 | 13.9% | 6.1%(+7.86)#27 | 3.5%(+10.4)#315 |
| 28. | 98012 | 13.7% | 6.1%(+7.66)#28 | 3.5%(+10.2)#323 |
| 29. | 98112 | 13.3% | 6.1%(+7.23)#29 | 3.5%(+9.76)#344 |
| 30. | 98028 | 12.7% | 6.1%(+6.65)#30 | 3.5%(+9.18)#381 |
| 31. | 98065 | 12.6% | 6.1%(+6.58)#31 | 3.5%(+9.11)#387 |
| 32. | 98314 | 12.5% | 6.1%(+6.44)#32 | 3.5%(+8.98)#397 |
| 33. | 98852 | 12.5% | 6.1%(+6.44)#33 | 3.5%(+8.98)#399 |
| 34. | 98119 | 11.9% | 6.1%(+5.82)#34 | 3.5%(+8.35)#451 |
| 35. | 98651 | 11.8% | 6.1%(+5.75)#35 | 3.5%(+8.28)#463 |
| 36. | 98103 | 11.8% | 6.1%(+5.73)#36 | 3.5%(+8.27)#467 |
| 37. | 98144 | 11.4% | 6.1%(+5.31)#37 | 3.5%(+7.84)#512 |
| 38. | 98027 | 11.2% | 6.1%(+5.18)#38 | 3.5%(+7.71)#533 |
| 39. | 98281 | 10.9% | 6.1%(+4.84)#39 | 3.5%(+7.38)#570 |
| 40. | 98548 | 10.9% | 6.1%(+4.84)#40 | 3.5%(+7.37)#571 |
| 41. | 98115 | 10.9% | 6.1%(+4.82)#41 | 3.5%(+7.36)#572 |
| 42. | 99137 | 10.6% | 6.1%(+4.53)#42 | 3.5%(+7.06)#617 |
| 43. | 98077 | 10.6% | 6.1%(+4.51)#43 | 3.5%(+7.05)#621 |
| 44. | 98039 | 10.5% | 6.1%(+4.47)#44 | 3.5%(+7.01)#625 |
| 45. | 98105 | 10.4% | 6.1%(+4.35)#45 | 3.5%(+6.89)#648 |
| 46. | 98040 | 10.2% | 6.1%(+4.13)#46 | 3.5%(+6.67)#675 |
| 47. | 98059 | 9.9% | 6.1%(+3.84)#47 | 3.5%(+6.37)#723 |
| 48. | 98224 | 9.8% | 6.1%(+3.76)#48 | 3.5%(+6.30)#739 |
| 49. | 98116 | 9.8% | 6.1%(+3.70)#49 | 3.5%(+6.23)#747 |
| 50. | 98117 | 9.7% | 6.1%(+3.61)#50 | 3.5%(+6.15)#759 |
| 51. | 98136 | 9.5% | 6.1%(+3.43)#51 | 3.5%(+5.97)#797 |
| 52. | 98505 | 9.2% | 6.1%(+3.19)#52 | 3.5%(+5.72)#842 |
| 53. | 99329 | 9.0% | 6.1%(+2.90)#53 | 3.5%(+5.43)#913 |
| 54. | 98253 | 8.6% | 6.1%(+2.54)#54 | 3.5%(+5.07)#1,023 |
| 55. | 98045 | 8.5% | 6.1%(+2.47)#55 | 3.5%(+5.01)#1,042 |
| 56. | 98125 | 8.5% | 6.1%(+2.45)#56 | 3.5%(+4.99)#1,049 |
| 57. | 98056 | 8.4% | 6.1%(+2.37)#57 | 3.5%(+4.91)#1,070 |
| 58. | 98155 | 8.3% | 6.1%(+2.28)#58 | 3.5%(+4.82)#1,098 |
| 59. | 98118 | 8.3% | 6.1%(+2.27)#59 | 3.5%(+4.81)#1,108 |
| 60. | 99179 | 8.2% | 6.1%(+2.17)#60 | 3.5%(+4.70)#1,142 |
| 61. | 98110 | 8.2% | 6.1%(+2.13)#61 | 3.5%(+4.67)#1,149 |
| 62. | 98296 | 8.2% | 6.1%(+2.12)#62 | 3.5%(+4.65)#1,155 |
| 63. | 98358 | 7.9% | 6.1%(+1.84)#63 | 3.5%(+4.37)#1,237 |
| 64. | 98286 | 7.8% | 6.1%(+1.78)#64 | 3.5%(+4.32)#1,264 |
| 65. | 98262 | 7.5% | 6.1%(+1.42)#65 | 3.5%(+3.95)#1,396 |
| 66. | 98036 | 7.2% | 6.1%(+1.13)#66 | 3.5%(+3.66)#1,524 |
| 67. | 98024 | 7.2% | 6.1%(+1.11)#67 | 3.5%(+3.64)#1,532 |
| 68. | 98014 | 7.1% | 6.1%(+1.04)#68 | 3.5%(+3.57)#1,575 |
| 69. | 98126 | 7.0% | 6.1%(+0.987)#69 | 3.5%(+3.52)#1,597 |
| 70. | 98038 | 6.9% | 6.1%(+0.853)#70 | 3.5%(+3.39)#1,675 |
| 71. | 98631 | 6.8% | 6.1%(+0.738)#71 | 3.5%(+3.27)#1,737 |
| 72. | 98303 | 6.8% | 6.1%(+0.724)#72 | 3.5%(+3.26)#1,743 |
| 73. | 98177 | 6.7% | 6.1%(+0.624)#73 | 3.5%(+3.16)#1,804 |
| 74. | 98055 | 6.6% | 6.1%(+0.506)#74 | 3.5%(+3.04)#1,879 |
| 75. | 98403 | 6.4% | 6.1%(+0.365)#75 | 3.5%(+2.90)#1,986 |
| 76. | 98058 | 6.3% | 6.1%(+0.287)#76 | 3.5%(+2.82)#2,043 |
| 77. | 98635 | 6.3% | 6.1%(+0.283)#77 | 3.5%(+2.82)#2,045 |
| 78. | 98178 | 6.3% | 6.1%(+0.241)#78 | 3.5%(+2.77)#2,086 |
| 79. | 99171 | 6.2% | 6.1%(+0.192)#79 | 3.5%(+2.73)#2,112 |
| 80. | 98232 | 6.1% | 6.1%(+0.049)#80 | 3.5%(+2.58)#2,220 |
| 81. | 99029 | 6.0% | 6.1%(-0.063)#81 | 3.5%(+2.47)#2,313 |
| 82. | 98087 | 6.0% | 6.1%(-0.107)#82 | 3.5%(+2.43)#2,359 |
| 83. | 98133 | 5.9% | 6.1%(-0.177)#83 | 3.5%(+2.36)#2,425 |
| 84. | 98274 | 5.9% | 6.1%(-0.177)#84 | 3.5%(+2.36)#2,426 |
| 85. | 98108 | 5.8% | 6.1%(-0.208)#85 | 3.5%(+2.33)#2,451 |
| 86. | 99121 | 5.8% | 6.1%(-0.273)#86 | 3.5%(+2.26)#2,508 |
| 87. | 99354 | 5.7% | 6.1%(-0.323)#87 | 3.5%(+2.21)#2,548 |
| 88. | 98639 | 5.7% | 6.1%(-0.373)#88 | 3.5%(+2.16)#2,606 |
| 89. | 98272 | 5.7% | 6.1%(-0.387)#89 | 3.5%(+2.15)#2,615 |
| 90. | 99119 | 5.6% | 6.1%(-0.491)#90 | 3.5%(+2.04)#2,708 |
| 91. | 98042 | 5.6% | 6.1%(-0.491)#91 | 3.5%(+2.04)#2,709 |
| 92. | 98106 | 5.6% | 6.1%(-0.500)#92 | 3.5%(+2.03)#2,719 |
| 93. | 98037 | 5.5% | 6.1%(-0.538)#93 | 3.5%(+2.00)#2,758 |
| 94. | 98394 | 5.5% | 6.1%(-0.560)#94 | 3.5%(+1.97)#2,788 |
| 95. | 99025 | 5.5% | 6.1%(-0.591)#95 | 3.5%(+1.94)#2,821 |
| 96. | 98557 | 5.4% | 6.1%(-0.633)#96 | 3.5%(+1.90)#2,866 |
| 97. | 98057 | 5.4% | 6.1%(-0.650)#97 | 3.5%(+1.88)#2,888 |
| 98. | 99326 | 5.2% | 6.1%(-0.809)#98 | 3.5%(+1.72)#3,073 |
| 99. | 98166 | 5.2% | 6.1%(-0.815)#99 | 3.5%(+1.72)#3,077 |
| 100. | 98660 | 5.2% | 6.1%(-0.898)#100 | 3.5%(+1.64)#3,168 |
Common Questions
What are the Top 10 Zip Codes with the Highest Percentage of Population Employed in Computer & Mathematics in Washington?
Top 10 Zip Codes with the Highest Percentage of Population Employed in Computer & Mathematics in Washington are:
What zip code has the Highest Percentage of Population Employed in Computer & Mathematics in Washington?
98562 has the Highest Percentage of Population Employed in Computer & Mathematics in Washington with 70.5%.
What is the Percentage of Population Employed in Computer & Mathematics in the State of Washington?
Percentage of Population Employed in Computer & Mathematics in Washington is 6.1%.
What is the Percentage of Population Employed in Computer & Mathematics in the United States?
Percentage of Population Employed in Computer & Mathematics in the United States is 3.5%.