Zip Codes with the Highest Percentage of Population Employed in Computer & Mathematics in Olympia, WA
RELATED REPORTS & OPTIONS
Computer & Mathematics
Olympia
Compare Zip Codes
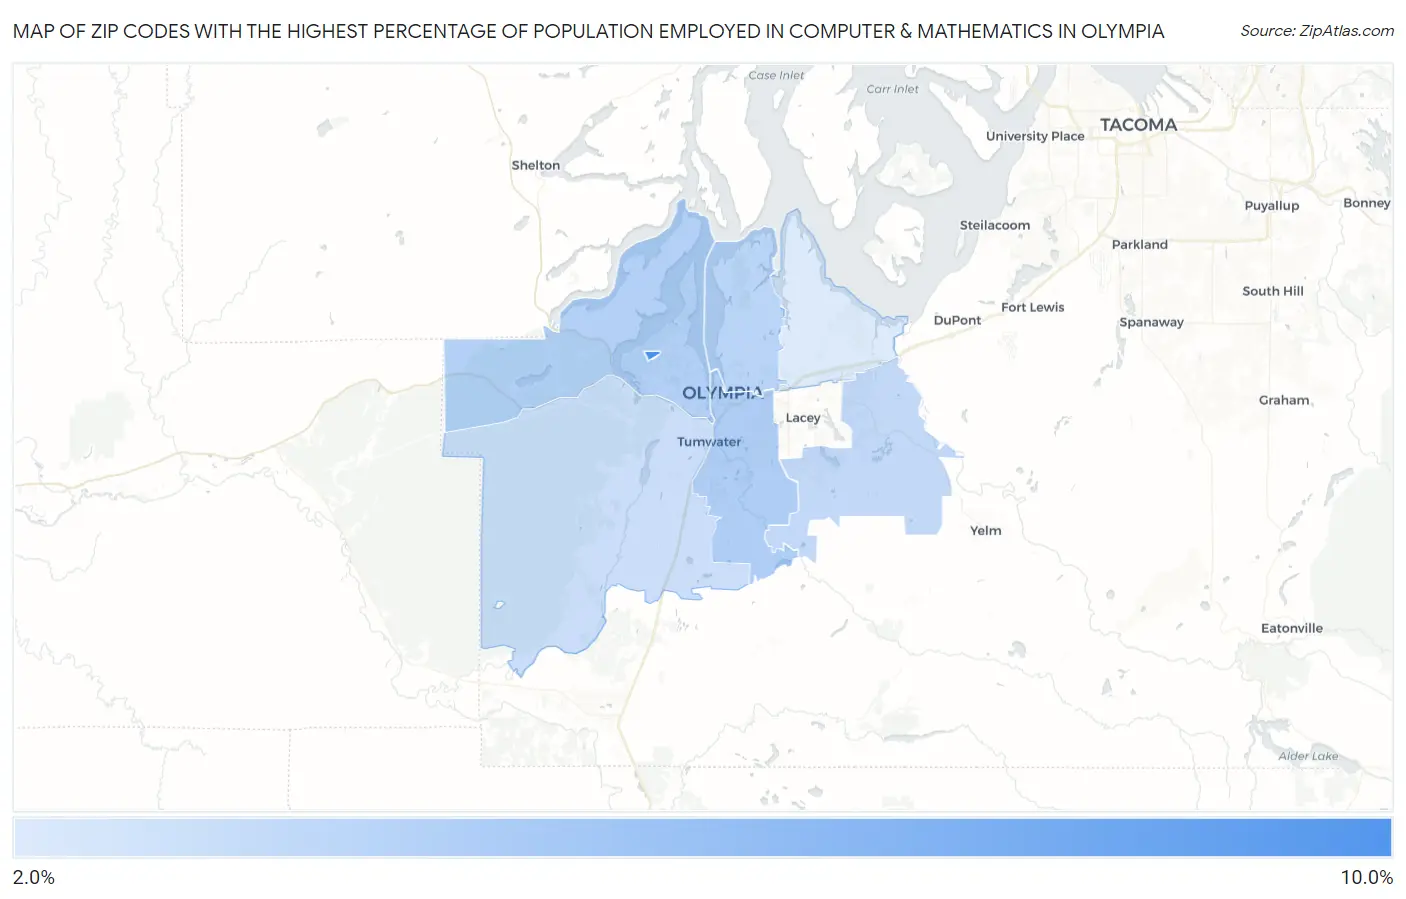
Map of Zip Codes with the Highest Percentage of Population Employed in Computer & Mathematics in Olympia
2.9%
9.2%
Zip Codes with the Highest Percentage of Population Employed in Computer & Mathematics in Olympia, WA
| Zip Code | % Employed | vs State | vs National | |
| 1. | 98505 | 9.2% | 6.1%(+3.19)#52 | 3.5%(+5.72)#842 |
| 2. | 98501 | 4.8% | 6.1%(-1.26)#107 | 3.5%(+1.28)#3,642 |
| 3. | 98502 | 4.6% | 6.1%(-1.46)#116 | 3.5%(+1.08)#3,938 |
| 4. | 98506 | 4.4% | 6.1%(-1.70)#130 | 3.5%(+0.834)#4,331 |
| 5. | 98513 | 4.1% | 6.1%(-2.00)#146 | 3.5%(+0.529)#4,915 |
| 6. | 98512 | 3.7% | 6.1%(-2.38)#167 | 3.5%(+0.156)#5,778 |
| 7. | 98516 | 2.9% | 6.1%(-3.12)#228 | 3.5%(-0.583)#7,960 |
1
Common Questions
What are the Top 5 Zip Codes with the Highest Percentage of Population Employed in Computer & Mathematics in Olympia, WA?
Top 5 Zip Codes with the Highest Percentage of Population Employed in Computer & Mathematics in Olympia, WA are:
What zip code has the Highest Percentage of Population Employed in Computer & Mathematics in Olympia, WA?
98505 has the Highest Percentage of Population Employed in Computer & Mathematics in Olympia, WA with 9.2%.
What is the Percentage of Population Employed in Computer & Mathematics in Olympia, WA?
Percentage of Population Employed in Computer & Mathematics in Olympia is 4.7%.
What is the Percentage of Population Employed in Computer & Mathematics in Washington?
Percentage of Population Employed in Computer & Mathematics in Washington is 6.1%.
What is the Percentage of Population Employed in Computer & Mathematics in the United States?
Percentage of Population Employed in Computer & Mathematics in the United States is 3.5%.