Zip Codes with the Highest Percentage of Population Employed in Computer & Mathematics in Kennewick, WA
RELATED REPORTS & OPTIONS
Computer & Mathematics
Kennewick
Compare Zip Codes
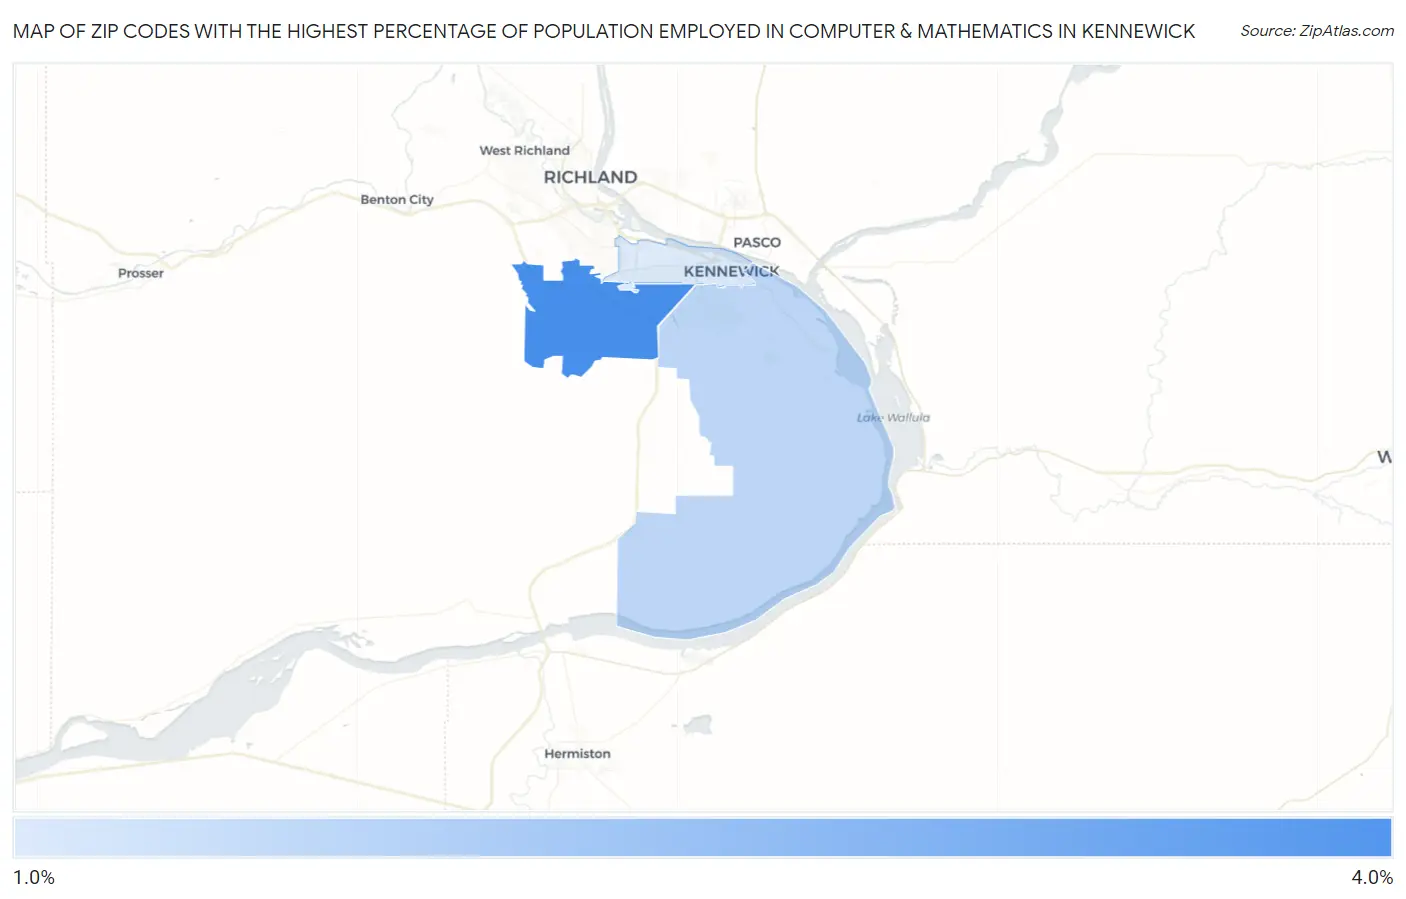
Map of Zip Codes with the Highest Percentage of Population Employed in Computer & Mathematics in Kennewick
1.6%
3.0%
Zip Codes with the Highest Percentage of Population Employed in Computer & Mathematics in Kennewick, WA
| Zip Code | % Employed | vs State | vs National | |
| 1. | 99338 | 3.0% | 6.1%(-3.03)#218 | 3.5%(-0.499)#7,651 |
| 2. | 99337 | 1.9% | 6.1%(-4.14)#303 | 3.5%(-1.60)#12,190 |
| 3. | 99336 | 1.6% | 6.1%(-4.43)#327 | 3.5%(-1.90)#13,688 |
1
Common Questions
What are the Top Zip Codes with the Highest Percentage of Population Employed in Computer & Mathematics in Kennewick, WA?
Top Zip Codes with the Highest Percentage of Population Employed in Computer & Mathematics in Kennewick, WA are:
What zip code has the Highest Percentage of Population Employed in Computer & Mathematics in Kennewick, WA?
99338 has the Highest Percentage of Population Employed in Computer & Mathematics in Kennewick, WA with 3.0%.
What is the Percentage of Population Employed in Computer & Mathematics in Kennewick, WA?
Percentage of Population Employed in Computer & Mathematics in Kennewick is 1.8%.
What is the Percentage of Population Employed in Computer & Mathematics in Washington?
Percentage of Population Employed in Computer & Mathematics in Washington is 6.1%.
What is the Percentage of Population Employed in Computer & Mathematics in the United States?
Percentage of Population Employed in Computer & Mathematics in the United States is 3.5%.