Monroe, WA Map & Demographics
Monroe Map
Monroe Overview
$36,580
PER CAPITA INCOME
$106,181
AVG FAMILY INCOME
$99,713
AVG HOUSEHOLD INCOME
24.6%
WAGE / INCOME GAP [ % ]
75.4¢/ $1
WAGE / INCOME GAP [ $ ]
0.36
INEQUALITY / GINI INDEX
19,632
TOTAL POPULATION
11,098
MALE POPULATION
8,534
FEMALE POPULATION
130.04
MALES / 100 FEMALES
76.90
FEMALES / 100 MALES
35.8
MEDIAN AGE
3.2
AVG FAMILY SIZE
2.8
AVG HOUSEHOLD SIZE
9,520
LABOR FORCE [ PEOPLE ]
59.8%
PERCENT IN LABOR FORCE
4.3%
UNEMPLOYMENT RATE
Monroe Zip Codes
Monroe Area Codes
Income in Monroe
Income Overview in Monroe
Per Capita Income in Monroe is $36,580, while median incomes of families and households are $106,181 and $99,713 respectively.
| Characteristic | Number | Measure |
| Per Capita Income | 19,632 | $36,580 |
| Median Family Income | 4,623 | $106,181 |
| Mean Family Income | 4,623 | $124,710 |
| Median Household Income | 6,038 | $99,713 |
| Mean Household Income | 6,038 | $114,630 |
| Income Deficit | 4,623 | $0 |
| Wage / Income Gap (%) | 19,632 | 24.59% |
| Wage / Income Gap ($) | 19,632 | 75.41¢ per $1 |
| Gini / Inequality Index | 19,632 | 0.36 |
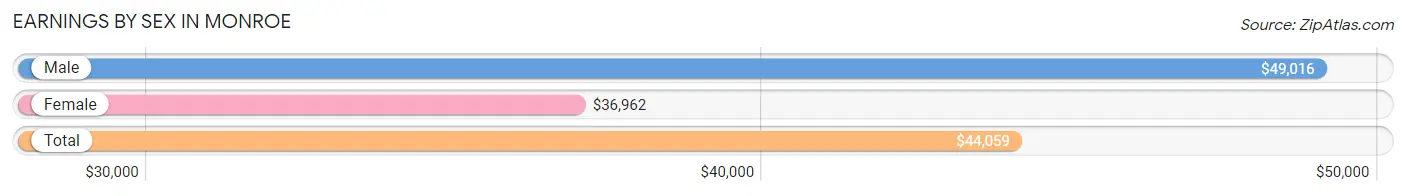
Earnings by Sex in Monroe
Average Earnings in Monroe are $44,059, $49,016 for men and $36,962 for women, a difference of 24.6%.
| Sex | Number | Average Earnings |
| Male | 6,980 (62.5%) | $49,016 |
| Female | 4,180 (37.5%) | $36,962 |
| Total | 11,160 (100.0%) | $44,059 |
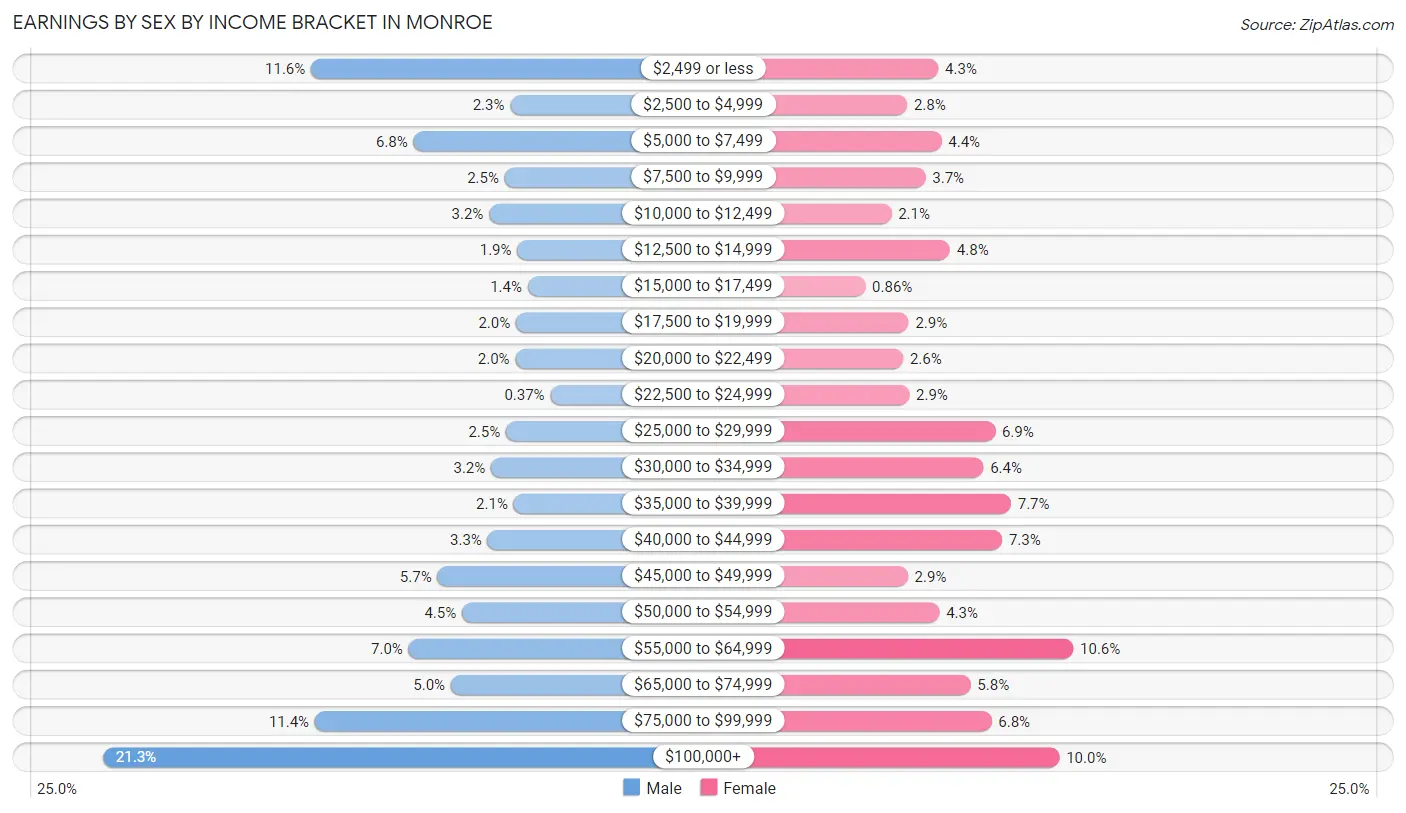
Earnings by Sex by Income Bracket in Monroe
The most common earnings brackets in Monroe are $100,000+ for men (1,489 | 21.3%) and $55,000 to $64,999 for women (443 | 10.6%).
| Income | Male | Female |
| $2,499 or less | 808 (11.6%) | 179 (4.3%) |
| $2,500 to $4,999 | 157 (2.2%) | 118 (2.8%) |
| $5,000 to $7,499 | 473 (6.8%) | 185 (4.4%) |
| $7,500 to $9,999 | 175 (2.5%) | 154 (3.7%) |
| $10,000 to $12,499 | 226 (3.2%) | 87 (2.1%) |
| $12,500 to $14,999 | 134 (1.9%) | 202 (4.8%) |
| $15,000 to $17,499 | 100 (1.4%) | 36 (0.9%) |
| $17,500 to $19,999 | 138 (2.0%) | 121 (2.9%) |
| $20,000 to $22,499 | 140 (2.0%) | 110 (2.6%) |
| $22,500 to $24,999 | 26 (0.4%) | 122 (2.9%) |
| $25,000 to $29,999 | 171 (2.5%) | 290 (6.9%) |
| $30,000 to $34,999 | 220 (3.2%) | 267 (6.4%) |
| $35,000 to $39,999 | 146 (2.1%) | 321 (7.7%) |
| $40,000 to $44,999 | 231 (3.3%) | 304 (7.3%) |
| $45,000 to $49,999 | 395 (5.7%) | 119 (2.9%) |
| $50,000 to $54,999 | 315 (4.5%) | 181 (4.3%) |
| $55,000 to $64,999 | 489 (7.0%) | 443 (10.6%) |
| $65,000 to $74,999 | 351 (5.0%) | 242 (5.8%) |
| $75,000 to $99,999 | 796 (11.4%) | 283 (6.8%) |
| $100,000+ | 1,489 (21.3%) | 416 (10.0%) |
| Total | 6,980 (100.0%) | 4,180 (100.0%) |
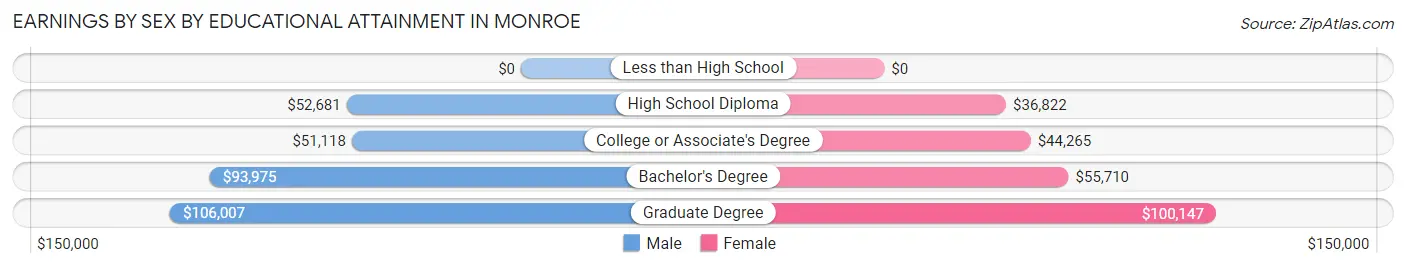
Earnings by Sex by Educational Attainment in Monroe
Average earnings in Monroe are $55,525 for men and $43,725 for women, a difference of 21.2%. Men with an educational attainment of graduate degree enjoy the highest average annual earnings of $106,007, while those with college or associate's degree education earn the least with $51,118. Women with an educational attainment of graduate degree earn the most with the average annual earnings of $100,147, while those with high school diploma education have the smallest earnings of $36,822.
| Educational Attainment | Male Income | Female Income |
| Less than High School | - | - |
| High School Diploma | $52,681 | $36,822 |
| College or Associate's Degree | $51,118 | $44,265 |
| Bachelor's Degree | $93,975 | $55,710 |
| Graduate Degree | $106,007 | $100,147 |
| Total | $55,525 | $43,725 |
Family Income in Monroe
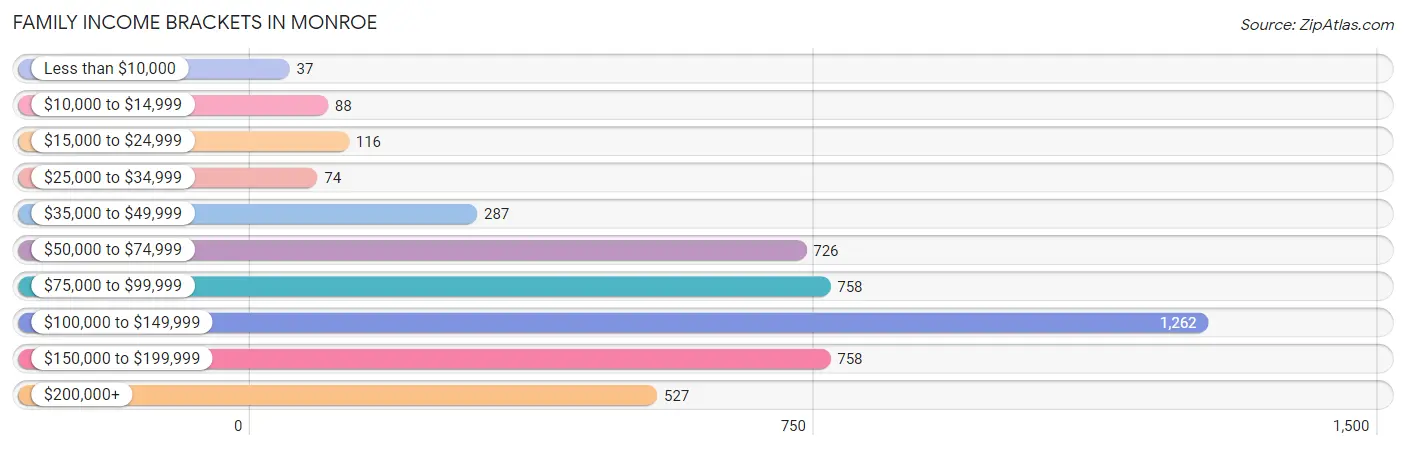
Family Income Brackets in Monroe
According to the Monroe family income data, there are 1,262 families falling into the $100,000 to $149,999 income range, which is the most common income bracket and makes up 27.3% of all families. Conversely, the less than $10,000 income bracket is the least frequent group with only 37 families (0.8%) belonging to this category.
| Income Bracket | # Families | % Families |
| Less than $10,000 | 37 | 0.8% |
| $10,000 to $14,999 | 88 | 1.9% |
| $15,000 to $24,999 | 116 | 2.5% |
| $25,000 to $34,999 | 74 | 1.6% |
| $35,000 to $49,999 | 287 | 6.2% |
| $50,000 to $74,999 | 726 | 15.7% |
| $75,000 to $99,999 | 758 | 16.4% |
| $100,000 to $149,999 | 1,262 | 27.3% |
| $150,000 to $199,999 | 758 | 16.4% |
| $200,000+ | 527 | 11.4% |
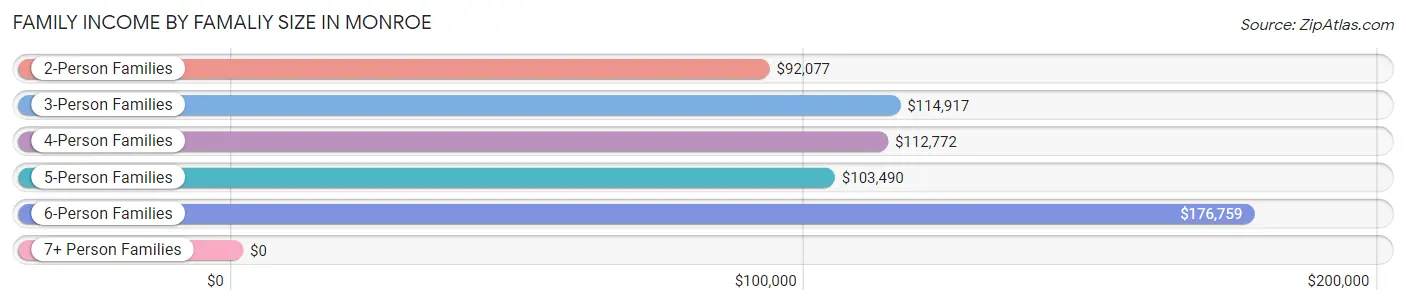
Family Income by Famaliy Size in Monroe
6-person families (178 | 3.8%) account for the highest median family income in Monroe with $176,759 per family, while 2-person families (1,931 | 41.8%) have the highest median income of $46,038 per family member.
| Income Bracket | # Families | Median Income |
| 2-Person Families | 1,931 (41.8%) | $92,077 |
| 3-Person Families | 1,036 (22.4%) | $114,917 |
| 4-Person Families | 943 (20.4%) | $112,772 |
| 5-Person Families | 469 (10.1%) | $103,490 |
| 6-Person Families | 178 (3.8%) | $176,759 |
| 7+ Person Families | 66 (1.4%) | $0 |
| Total | 4,623 (100.0%) | $106,181 |
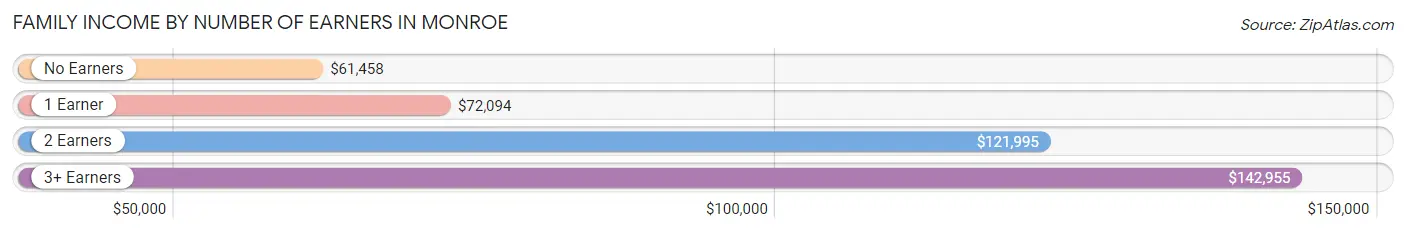
Family Income by Number of Earners in Monroe
The median family income in Monroe is $106,181, with families comprising 3+ earners (656) having the highest median family income of $142,955, while families with no earners (229) have the lowest median family income of $61,458, accounting for 14.2% and 5.0% of families, respectively.
| Number of Earners | # Families | Median Income |
| No Earners | 229 (5.0%) | $61,458 |
| 1 Earner | 1,447 (31.3%) | $72,094 |
| 2 Earners | 2,291 (49.6%) | $121,995 |
| 3+ Earners | 656 (14.2%) | $142,955 |
| Total | 4,623 (100.0%) | $106,181 |
Household Income in Monroe
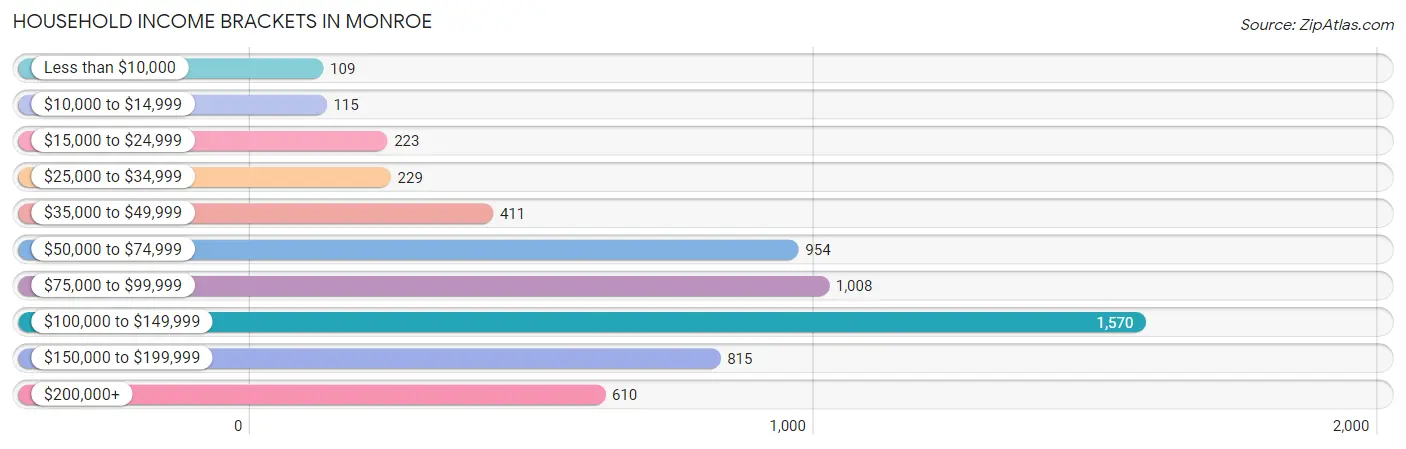
Household Income Brackets in Monroe
With 1,570 households falling in the category, the $100,000 to $149,999 income range is the most frequent in Monroe, accounting for 26.0% of all households. In contrast, only 109 households (1.8%) fall into the less than $10,000 income bracket, making it the least populous group.
| Income Bracket | # Households | % Households |
| Less than $10,000 | 109 | 1.8% |
| $10,000 to $14,999 | 115 | 1.9% |
| $15,000 to $24,999 | 223 | 3.7% |
| $25,000 to $34,999 | 229 | 3.8% |
| $35,000 to $49,999 | 411 | 6.8% |
| $50,000 to $74,999 | 954 | 15.8% |
| $75,000 to $99,999 | 1,008 | 16.7% |
| $100,000 to $149,999 | 1,570 | 26.0% |
| $150,000 to $199,999 | 815 | 13.5% |
| $200,000+ | 610 | 10.1% |
Household Income by Householder Age in Monroe
The median household income in Monroe is $99,713, with the highest median household income of $109,886 found in the 45 to 64 years age bracket for the primary householder. A total of 2,416 households (40.0%) fall into this category. Meanwhile, the 65+ years age bracket for the primary householder has the lowest median household income of $57,578, with 1,099 households (18.2%) in this group.
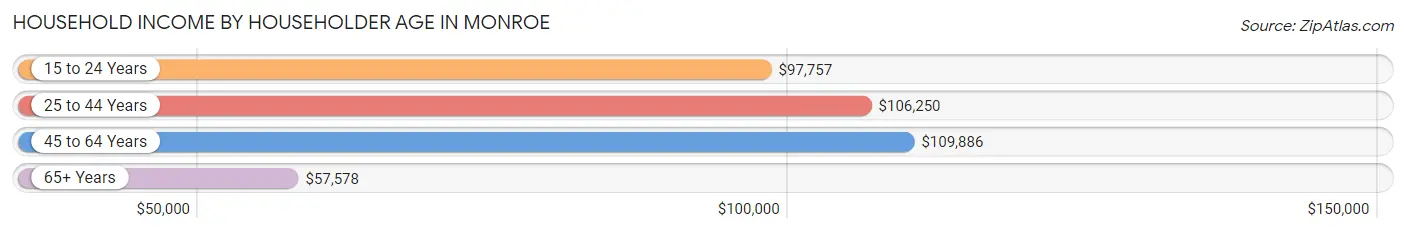
| Income Bracket | # Households | Median Income |
| 15 to 24 Years | 237 (3.9%) | $97,757 |
| 25 to 44 Years | 2,286 (37.9%) | $106,250 |
| 45 to 64 Years | 2,416 (40.0%) | $109,886 |
| 65+ Years | 1,099 (18.2%) | $57,578 |
| Total | 6,038 (100.0%) | $99,713 |
Poverty in Monroe
Income Below Poverty by Sex and Age in Monroe
With 4.7% poverty level for males and 9.3% for females among the residents of Monroe, 5 year old males and 5 year old females are the most vulnerable to poverty, with 8 males (14.0%) and 28 females (46.7%) in their respective age groups living below the poverty level.
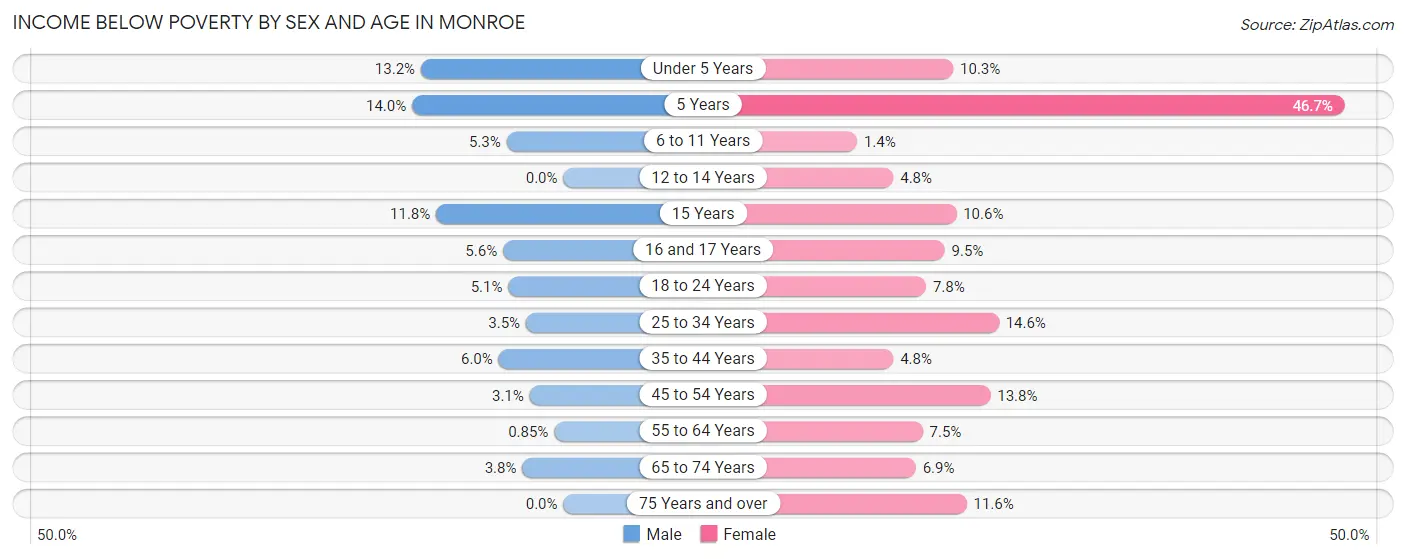
| Age Bracket | Male | Female |
| Under 5 Years | 99 (13.2%) | 66 (10.3%) |
| 5 Years | 8 (14.0%) | 28 (46.7%) |
| 6 to 11 Years | 27 (5.3%) | 9 (1.4%) |
| 12 to 14 Years | 0 (0.0%) | 14 (4.8%) |
| 15 Years | 17 (11.8%) | 17 (10.6%) |
| 16 and 17 Years | 14 (5.6%) | 27 (9.5%) |
| 18 to 24 Years | 41 (5.1%) | 58 (7.8%) |
| 25 to 34 Years | 53 (3.5%) | 189 (14.6%) |
| 35 to 44 Years | 72 (6.0%) | 55 (4.8%) |
| 45 to 54 Years | 35 (3.1%) | 159 (13.8%) |
| 55 to 64 Years | 8 (0.9%) | 73 (7.5%) |
| 65 to 74 Years | 17 (3.8%) | 41 (6.9%) |
| 75 Years and over | 0 (0.0%) | 47 (11.6%) |
| Total | 391 (4.7%) | 783 (9.3%) |
Income Above Poverty by Sex and Age in Monroe
According to the poverty statistics in Monroe, males aged 12 to 14 years and females aged 6 to 11 years are the age groups that are most secure financially, with 100.0% of males and 98.6% of females in these age groups living above the poverty line.
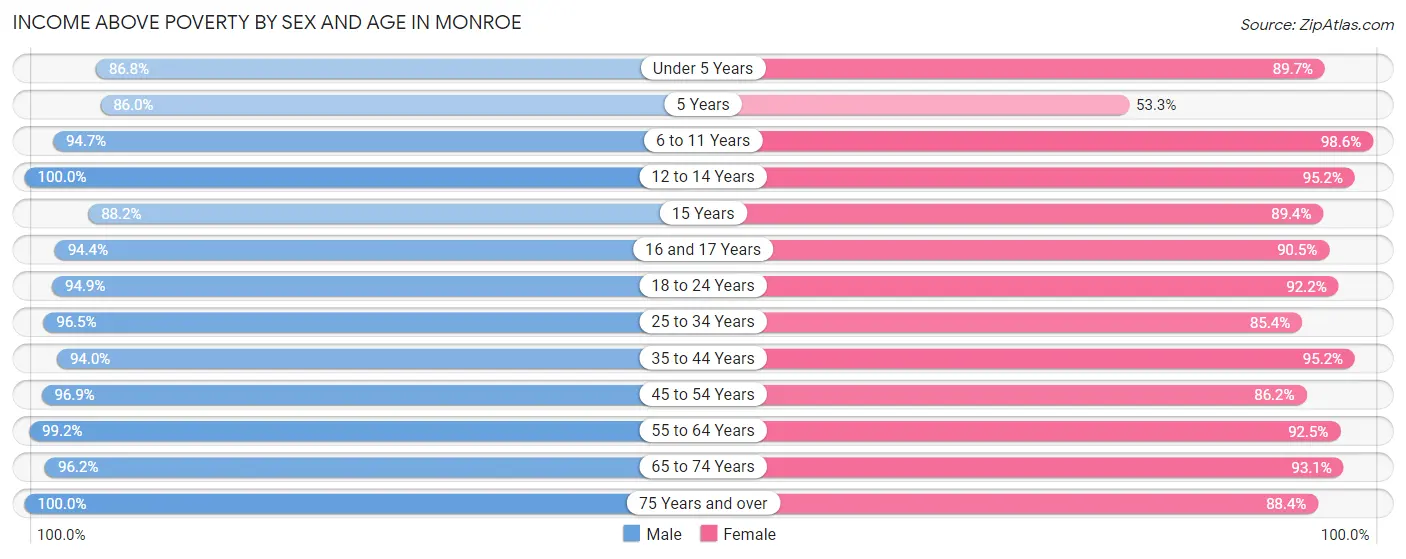
| Age Bracket | Male | Female |
| Under 5 Years | 650 (86.8%) | 573 (89.7%) |
| 5 Years | 49 (86.0%) | 32 (53.3%) |
| 6 to 11 Years | 485 (94.7%) | 628 (98.6%) |
| 12 to 14 Years | 394 (100.0%) | 279 (95.2%) |
| 15 Years | 127 (88.2%) | 143 (89.4%) |
| 16 and 17 Years | 236 (94.4%) | 256 (90.5%) |
| 18 to 24 Years | 762 (94.9%) | 685 (92.2%) |
| 25 to 34 Years | 1,476 (96.5%) | 1,109 (85.4%) |
| 35 to 44 Years | 1,126 (94.0%) | 1,098 (95.2%) |
| 45 to 54 Years | 1,082 (96.9%) | 995 (86.2%) |
| 55 to 64 Years | 933 (99.2%) | 900 (92.5%) |
| 65 to 74 Years | 429 (96.2%) | 557 (93.1%) |
| 75 Years and over | 243 (100.0%) | 359 (88.4%) |
| Total | 7,992 (95.3%) | 7,614 (90.7%) |
Income Below Poverty Among Married-Couple Families in Monroe
The poverty statistics for married-couple families in Monroe show that 3.2% or 111 of the total 3,512 families live below the poverty line. Families with 1 or 2 children have the highest poverty rate of 6.3%, comprising of 88 families. On the other hand, families with 3 or 4 children have the lowest poverty rate of 0.0%, which includes 0 families.
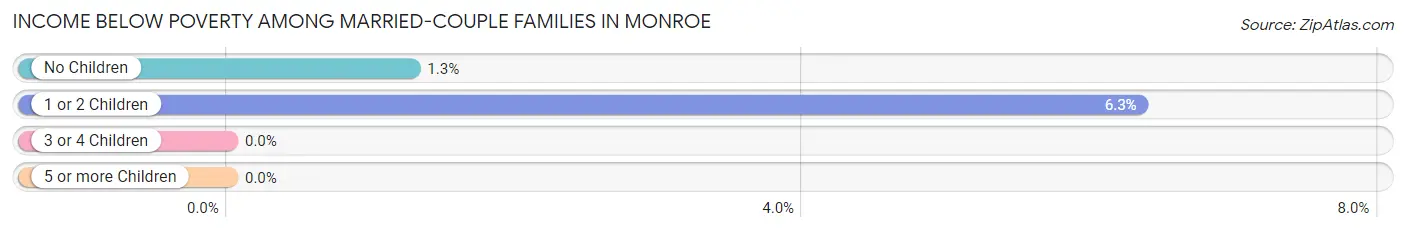
| Children | Above Poverty | Below Poverty |
| No Children | 1,781 (98.7%) | 23 (1.3%) |
| 1 or 2 Children | 1,299 (93.7%) | 88 (6.3%) |
| 3 or 4 Children | 297 (100.0%) | 0 (0.0%) |
| 5 or more Children | 24 (100.0%) | 0 (0.0%) |
| Total | 3,401 (96.8%) | 111 (3.2%) |
Income Below Poverty Among Single-Parent Households in Monroe
According to the poverty data in Monroe, 2.3% or 8 single-father households and 17.9% or 137 single-mother households are living below the poverty line. Among single-father households, those with 1 or 2 children have the highest poverty rate, with 8 households (4.5%) experiencing poverty. Likewise, among single-mother households, those with 3 or 4 children have the highest poverty rate, with 33 households (33.7%) falling below the poverty line.
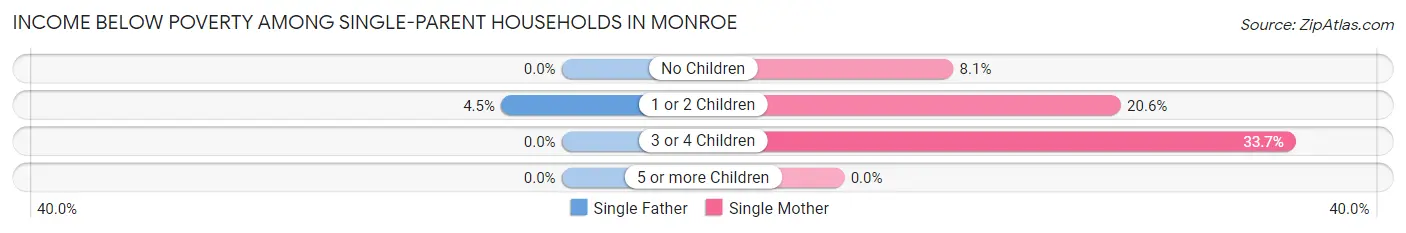
| Children | Single Father | Single Mother |
| No Children | 0 (0.0%) | 22 (8.1%) |
| 1 or 2 Children | 8 (4.5%) | 82 (20.6%) |
| 3 or 4 Children | 0 (0.0%) | 33 (33.7%) |
| 5 or more Children | 0 (0.0%) | 0 (0.0%) |
| Total | 8 (2.3%) | 137 (17.9%) |
Income Below Poverty Among Married-Couple vs Single-Parent Households in Monroe
The poverty data for Monroe shows that 111 of the married-couple family households (3.2%) and 145 of the single-parent households (13.1%) are living below the poverty level. Within the married-couple family households, those with 1 or 2 children have the highest poverty rate, with 88 households (6.3%) falling below the poverty line. Among the single-parent households, those with 3 or 4 children have the highest poverty rate, with 33 household (25.2%) living below poverty.
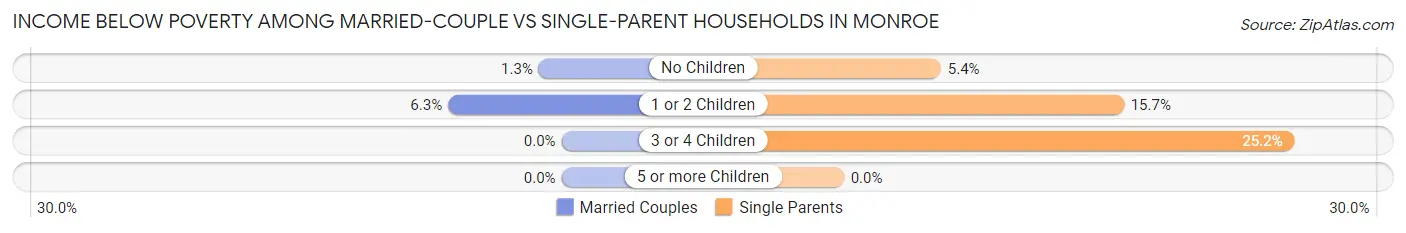
| Children | Married-Couple Families | Single-Parent Households |
| No Children | 23 (1.3%) | 22 (5.4%) |
| 1 or 2 Children | 88 (6.3%) | 90 (15.7%) |
| 3 or 4 Children | 0 (0.0%) | 33 (25.2%) |
| 5 or more Children | 0 (0.0%) | 0 (0.0%) |
| Total | 111 (3.2%) | 145 (13.1%) |
Race in Monroe
The most populous races in Monroe are White / Caucasian (14,246 | 72.6%), Hispanic or Latino (3,295 | 16.8%), and Two or more Races (2,076 | 10.6%).
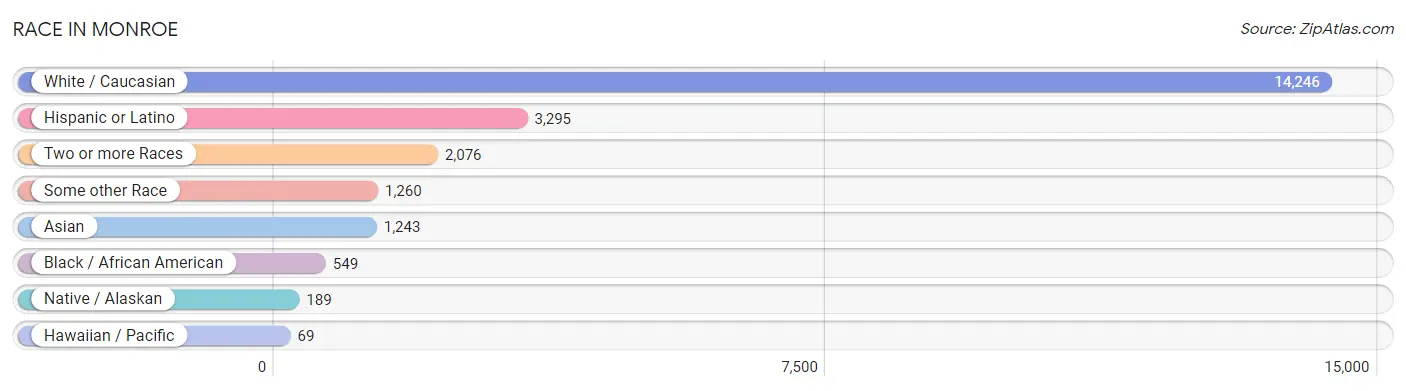
| Race | # Population | % Population |
| Asian | 1,243 | 6.3% |
| Black / African American | 549 | 2.8% |
| Hawaiian / Pacific | 69 | 0.4% |
| Hispanic or Latino | 3,295 | 16.8% |
| Native / Alaskan | 189 | 1.0% |
| White / Caucasian | 14,246 | 72.6% |
| Two or more Races | 2,076 | 10.6% |
| Some other Race | 1,260 | 6.4% |
| Total | 19,632 | 100.0% |
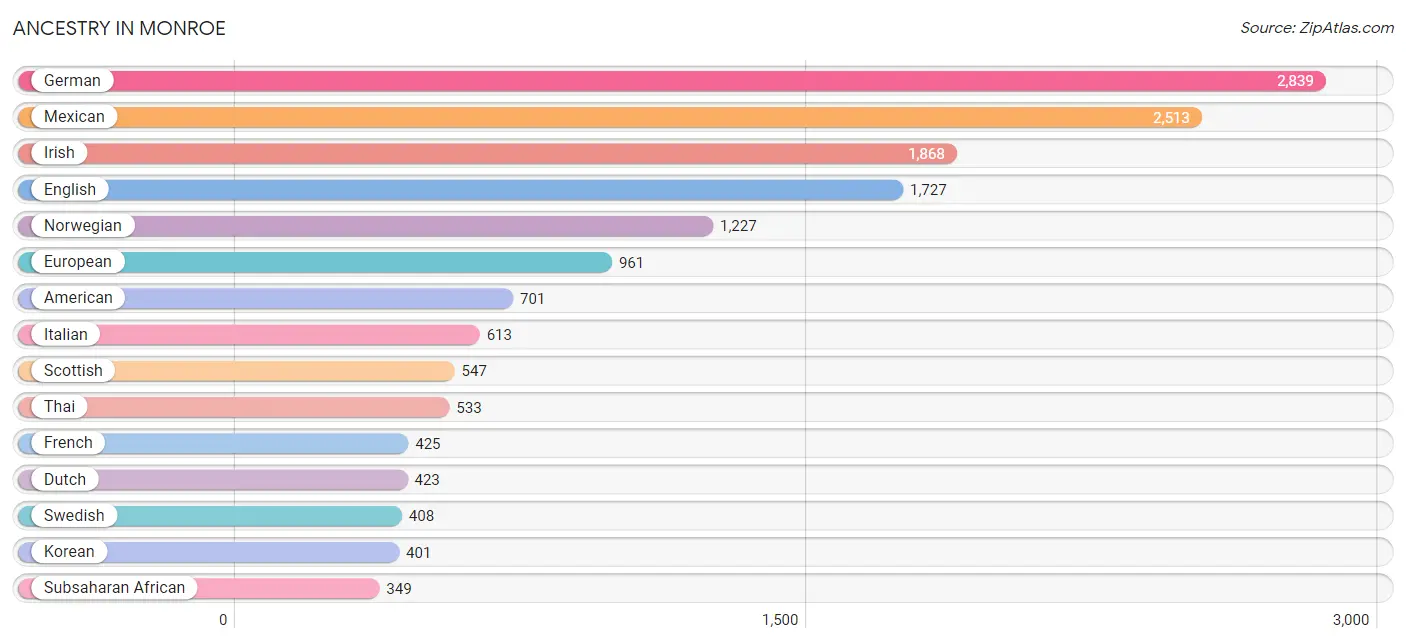
Ancestry in Monroe
The most populous ancestries reported in Monroe are German (2,839 | 14.5%), Mexican (2,513 | 12.8%), Irish (1,868 | 9.5%), English (1,727 | 8.8%), and Norwegian (1,227 | 6.2%), together accounting for 51.8% of all Monroe residents.
| Ancestry | # Population | % Population |
| Afghan | 5 | 0.0% |
| African | 261 | 1.3% |
| Aleut | 75 | 0.4% |
| American | 701 | 3.6% |
| Apache | 18 | 0.1% |
| Arab | 54 | 0.3% |
| Australian | 33 | 0.2% |
| Austrian | 13 | 0.1% |
| Bhutanese | 158 | 0.8% |
| Blackfeet | 42 | 0.2% |
| Brazilian | 116 | 0.6% |
| British | 51 | 0.3% |
| Burmese | 96 | 0.5% |
| Canadian | 74 | 0.4% |
| Celtic | 11 | 0.1% |
| Central American | 343 | 1.8% |
| Central American Indian | 13 | 0.1% |
| Cherokee | 71 | 0.4% |
| Chickasaw | 10 | 0.1% |
| Chippewa | 77 | 0.4% |
| Choctaw | 5 | 0.0% |
| Colombian | 124 | 0.6% |
| Croatian | 17 | 0.1% |
| Czech | 44 | 0.2% |
| Czechoslovakian | 16 | 0.1% |
| Danish | 162 | 0.8% |
| Dominican | 10 | 0.1% |
| Dutch | 423 | 2.1% |
| Eastern European | 23 | 0.1% |
| English | 1,727 | 8.8% |
| Estonian | 7 | 0.0% |
| European | 961 | 4.9% |
| Finnish | 79 | 0.4% |
| French | 425 | 2.2% |
| French American Indian | 5 | 0.0% |
| French Canadian | 22 | 0.1% |
| German | 2,839 | 14.5% |
| Greek | 114 | 0.6% |
| Guamanian / Chamorro | 12 | 0.1% |
| Guatemalan | 2 | 0.0% |
| Honduran | 213 | 1.1% |
| Hungarian | 22 | 0.1% |
| Indian (Asian) | 97 | 0.5% |
| Irish | 1,868 | 9.5% |
| Iroquois | 40 | 0.2% |
| Israeli | 6 | 0.0% |
| Italian | 613 | 3.1% |
| Jamaican | 4 | 0.0% |
| Japanese | 149 | 0.8% |
| Kenyan | 82 | 0.4% |
| Korean | 401 | 2.0% |
| Lebanese | 39 | 0.2% |
| Lithuanian | 22 | 0.1% |
| Malaysian | 10 | 0.1% |
| Mexican | 2,513 | 12.8% |
| Mexican American Indian | 57 | 0.3% |
| Native Hawaiian | 89 | 0.4% |
| Navajo | 6 | 0.0% |
| Nicaraguan | 27 | 0.1% |
| Northern European | 69 | 0.4% |
| Norwegian | 1,227 | 6.2% |
| Osage | 9 | 0.1% |
| Pakistani | 43 | 0.2% |
| Palestinian | 5 | 0.0% |
| Panamanian | 35 | 0.2% |
| Pennsylvania German | 11 | 0.1% |
| Polish | 84 | 0.4% |
| Portuguese | 131 | 0.7% |
| Puerto Rican | 107 | 0.5% |
| Romanian | 154 | 0.8% |
| Russian | 283 | 1.4% |
| Salvadoran | 59 | 0.3% |
| Samoan | 25 | 0.1% |
| Scandinavian | 53 | 0.3% |
| Scotch-Irish | 341 | 1.7% |
| Scottish | 547 | 2.8% |
| Seminole | 7 | 0.0% |
| Sioux | 32 | 0.2% |
| Slovak | 10 | 0.1% |
| South American | 182 | 0.9% |
| Spaniard | 69 | 0.4% |
| Spanish | 4 | 0.0% |
| Sri Lankan | 174 | 0.9% |
| Subsaharan African | 349 | 1.8% |
| Swedish | 408 | 2.1% |
| Swiss | 46 | 0.2% |
| Syrian | 10 | 0.1% |
| Thai | 533 | 2.7% |
| Tlingit-Haida | 145 | 0.7% |
| Turkish | 16 | 0.1% |
| Ukrainian | 51 | 0.3% |
| Welsh | 221 | 1.1% |
| Yugoslavian | 115 | 0.6% | View All 93 Rows |
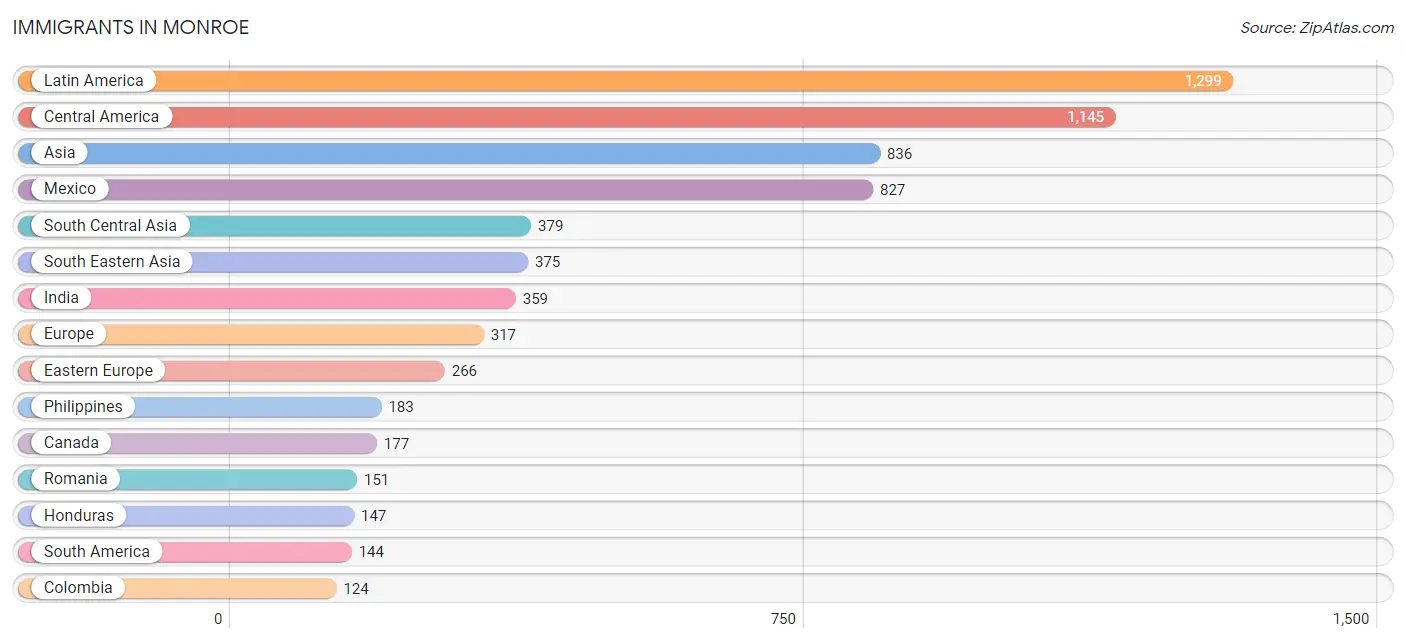
Immigrants in Monroe
The most numerous immigrant groups reported in Monroe came from Latin America (1,299 | 6.6%), Central America (1,145 | 5.8%), Asia (836 | 4.3%), Mexico (827 | 4.2%), and South Central Asia (379 | 1.9%), together accounting for 22.9% of all Monroe residents.
| Immigration Origin | # Population | % Population |
| Africa | 18 | 0.1% |
| Asia | 836 | 4.3% |
| Belize | 58 | 0.3% |
| Bosnia and Herzegovina | 35 | 0.2% |
| Brazil | 20 | 0.1% |
| Cambodia | 81 | 0.4% |
| Canada | 177 | 0.9% |
| Caribbean | 10 | 0.1% |
| Central America | 1,145 | 5.8% |
| China | 19 | 0.1% |
| Colombia | 124 | 0.6% |
| Dominican Republic | 10 | 0.1% |
| Eastern Africa | 12 | 0.1% |
| Eastern Asia | 82 | 0.4% |
| Eastern Europe | 266 | 1.3% |
| El Salvador | 72 | 0.4% |
| England | 6 | 0.0% |
| Europe | 317 | 1.6% |
| Fiji | 65 | 0.3% |
| Germany | 18 | 0.1% |
| Guatemala | 13 | 0.1% |
| Honduras | 147 | 0.7% |
| India | 359 | 1.8% |
| Iran | 20 | 0.1% |
| Italy | 10 | 0.1% |
| Japan | 27 | 0.1% |
| Korea | 36 | 0.2% |
| Laos | 10 | 0.1% |
| Latin America | 1,299 | 6.6% |
| Malaysia | 11 | 0.1% |
| Mexico | 827 | 4.2% |
| Netherlands | 6 | 0.0% |
| Nicaragua | 28 | 0.1% |
| Northern Europe | 17 | 0.1% |
| Oceania | 78 | 0.4% |
| Philippines | 183 | 0.9% |
| Romania | 151 | 0.8% |
| Russia | 80 | 0.4% |
| Somalia | 12 | 0.1% |
| South America | 144 | 0.7% |
| South Central Asia | 379 | 1.9% |
| South Eastern Asia | 375 | 1.9% |
| Southern Europe | 10 | 0.1% |
| Sweden | 11 | 0.1% |
| Taiwan | 19 | 0.1% |
| Thailand | 15 | 0.1% |
| Vietnam | 75 | 0.4% |
| Western Europe | 24 | 0.1% | View All 48 Rows |
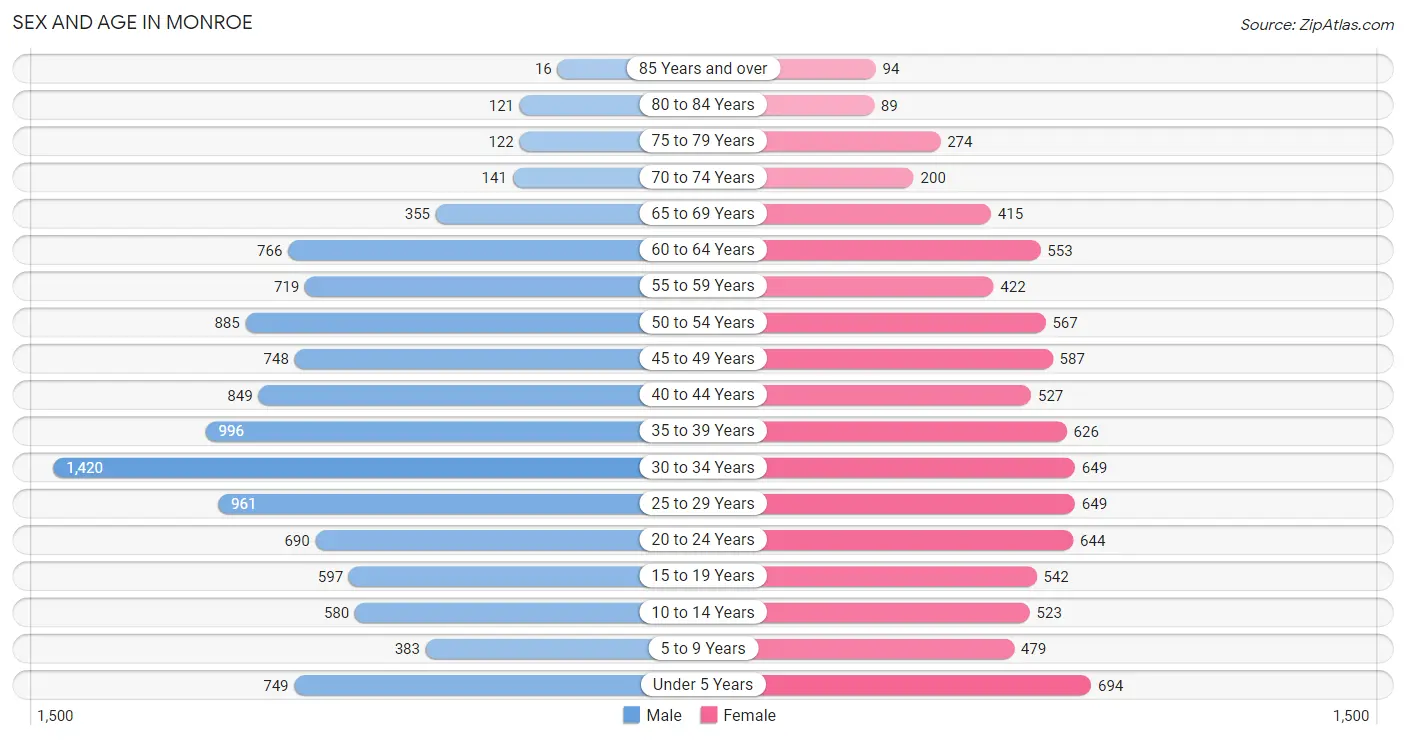
Sex and Age in Monroe
Sex and Age in Monroe
The most populous age groups in Monroe are 30 to 34 Years (1,420 | 12.8%) for men and Under 5 Years (694 | 8.1%) for women.
| Age Bracket | Male | Female |
| Under 5 Years | 749 (6.8%) | 694 (8.1%) |
| 5 to 9 Years | 383 (3.5%) | 479 (5.6%) |
| 10 to 14 Years | 580 (5.2%) | 523 (6.1%) |
| 15 to 19 Years | 597 (5.4%) | 542 (6.4%) |
| 20 to 24 Years | 690 (6.2%) | 644 (7.5%) |
| 25 to 29 Years | 961 (8.7%) | 649 (7.6%) |
| 30 to 34 Years | 1,420 (12.8%) | 649 (7.6%) |
| 35 to 39 Years | 996 (9.0%) | 626 (7.3%) |
| 40 to 44 Years | 849 (7.6%) | 527 (6.2%) |
| 45 to 49 Years | 748 (6.7%) | 587 (6.9%) |
| 50 to 54 Years | 885 (8.0%) | 567 (6.6%) |
| 55 to 59 Years | 719 (6.5%) | 422 (4.9%) |
| 60 to 64 Years | 766 (6.9%) | 553 (6.5%) |
| 65 to 69 Years | 355 (3.2%) | 415 (4.9%) |
| 70 to 74 Years | 141 (1.3%) | 200 (2.3%) |
| 75 to 79 Years | 122 (1.1%) | 274 (3.2%) |
| 80 to 84 Years | 121 (1.1%) | 89 (1.0%) |
| 85 Years and over | 16 (0.1%) | 94 (1.1%) |
| Total | 11,098 (100.0%) | 8,534 (100.0%) |
Families and Households in Monroe
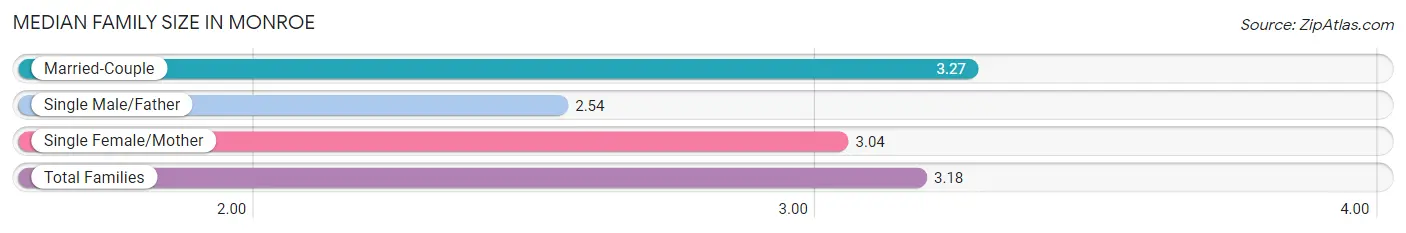
Median Family Size in Monroe
The median family size in Monroe is 3.18 persons per family, with married-couple families (3,512 | 76.0%) accounting for the largest median family size of 3.27 persons per family. On the other hand, single male/father families (344 | 7.4%) represent the smallest median family size with 2.54 persons per family.
| Family Type | # Families | Family Size |
| Married-Couple | 3,512 (76.0%) | 3.27 |
| Single Male/Father | 344 (7.4%) | 2.54 |
| Single Female/Mother | 767 (16.6%) | 3.04 |
| Total Families | 4,623 (100.0%) | 3.18 |
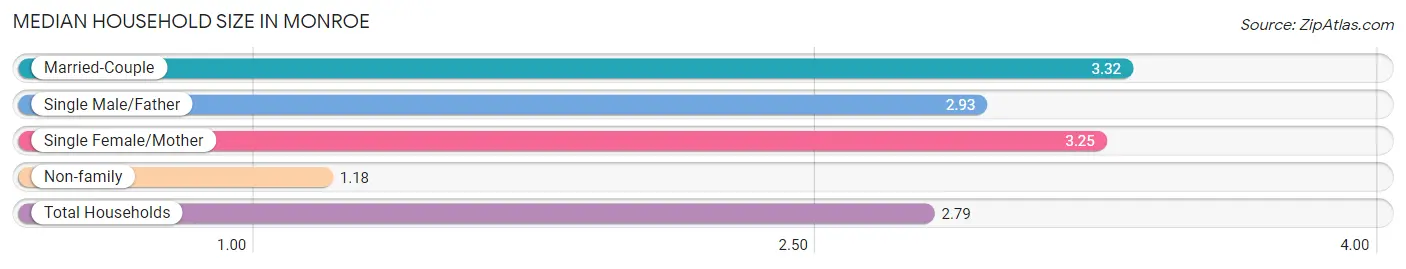
Median Household Size in Monroe
The median household size in Monroe is 2.79 persons per household, with married-couple households (3,512 | 58.2%) accounting for the largest median household size of 3.32 persons per household. non-family households (1,415 | 23.4%) represent the smallest median household size with 1.18 persons per household.
| Household Type | # Households | Household Size |
| Married-Couple | 3,512 (58.2%) | 3.32 |
| Single Male/Father | 344 (5.7%) | 2.93 |
| Single Female/Mother | 767 (12.7%) | 3.25 |
| Non-family | 1,415 (23.4%) | 1.18 |
| Total Households | 6,038 (100.0%) | 2.79 |
Household Size by Marriage Status in Monroe
Out of a total of 6,038 households in Monroe, 4,623 (76.6%) are family households, while 1,415 (23.4%) are nonfamily households. The most numerous type of family households are 2-person households, comprising 1,776, and the most common type of nonfamily households are 1-person households, comprising 1,192.
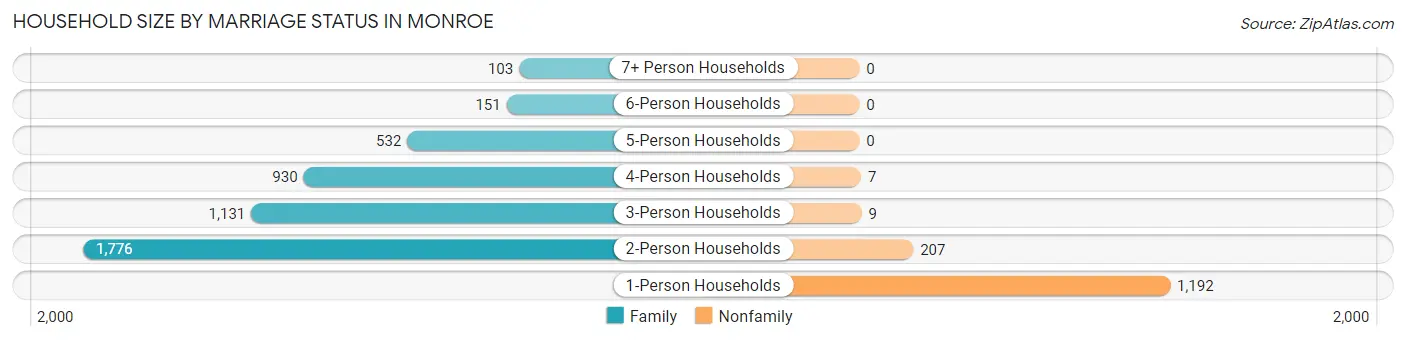
| Household Size | Family Households | Nonfamily Households |
| 1-Person Households | - | 1,192 (19.7%) |
| 2-Person Households | 1,776 (29.4%) | 207 (3.4%) |
| 3-Person Households | 1,131 (18.7%) | 9 (0.2%) |
| 4-Person Households | 930 (15.4%) | 7 (0.1%) |
| 5-Person Households | 532 (8.8%) | 0 (0.0%) |
| 6-Person Households | 151 (2.5%) | 0 (0.0%) |
| 7+ Person Households | 103 (1.7%) | 0 (0.0%) |
| Total | 4,623 (76.6%) | 1,415 (23.4%) |
Female Fertility in Monroe
Fertility by Age in Monroe
Average fertility rate in Monroe is 56.0 births per 1,000 women. Women in the age bracket of 20 to 34 years have the highest fertility rate with 104.0 births per 1,000 women. Women in the age bracket of 20 to 34 years acount for 84.5% of all women with births.
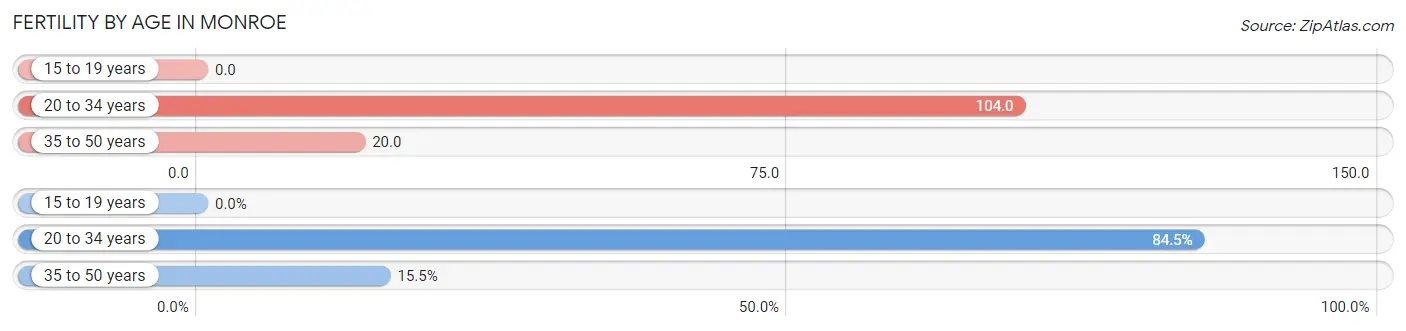
| Age Bracket | Women with Births | Births / 1,000 Women |
| 15 to 19 years | 0 (0.0%) | 0.0 |
| 20 to 34 years | 202 (84.5%) | 104.0 |
| 35 to 50 years | 37 (15.5%) | 20.0 |
| Total | 239 (100.0%) | 56.0 |
Fertility by Age by Marriage Status in Monroe
51.9% of women with births (239) in Monroe are married. The highest percentage of unmarried women with births falls into 20 to 34 years age bracket with 54.9% of them unmarried at the time of birth, while the lowest percentage of unmarried women with births belong to 35 to 50 years age bracket with 10.8% of them unmarried.
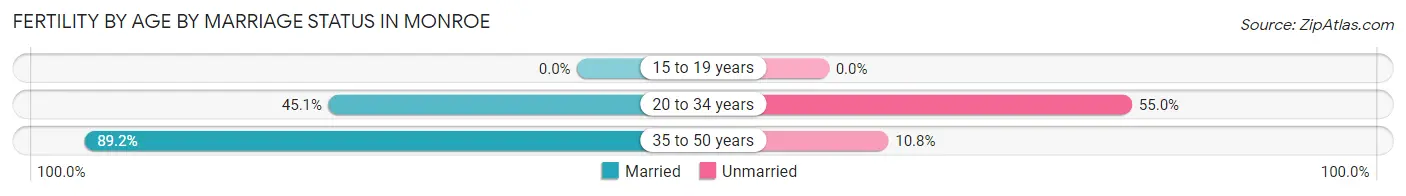
| Age Bracket | Married | Unmarried |
| 15 to 19 years | 0 (0.0%) | 0 (0.0%) |
| 20 to 34 years | 91 (45.1%) | 111 (54.9%) |
| 35 to 50 years | 33 (89.2%) | 4 (10.8%) |
| Total | 124 (51.9%) | 115 (48.1%) |
Fertility by Education in Monroe
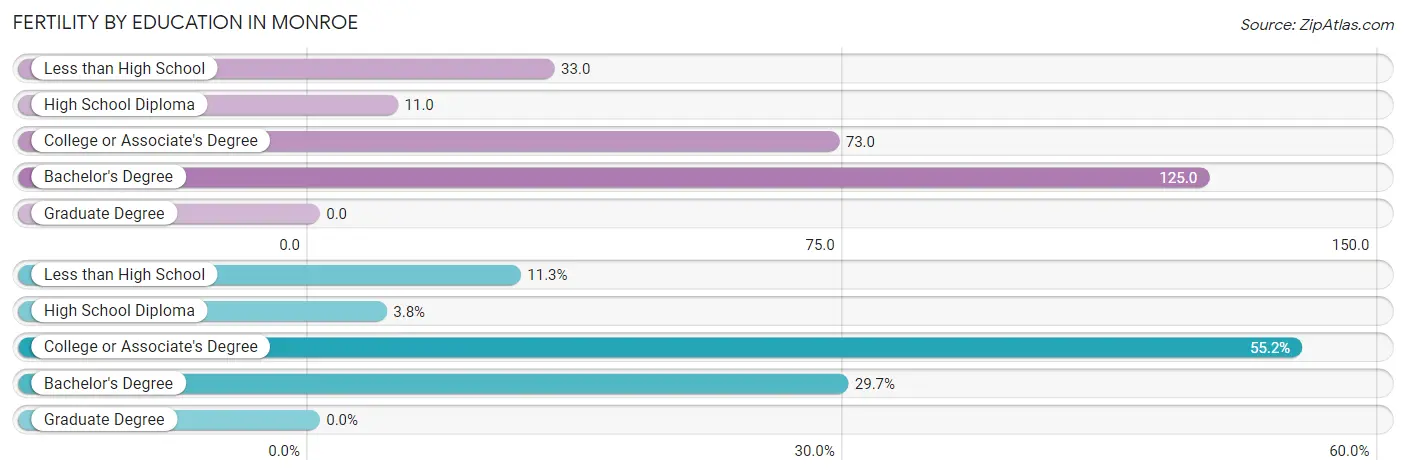
| Educational Attainment | Women with Births | Births / 1,000 Women |
| Less than High School | 27 (11.3%) | 33.0 |
| High School Diploma | 9 (3.8%) | 11.0 |
| College or Associate's Degree | 132 (55.2%) | 73.0 |
| Bachelor's Degree | 71 (29.7%) | 125.0 |
| Graduate Degree | 0 (0.0%) | 0.0 |
| Total | 239 (100.0%) | 56.0 |
Fertility by Education by Marriage Status in Monroe
48.1% of women with births in Monroe are unmarried. Women with the educational attainment of high school diploma are most likely to be married with 100.0% of them married at childbirth, while women with the educational attainment of less than high school are least likely to be married with 100.0% of them unmarried at childbirth.
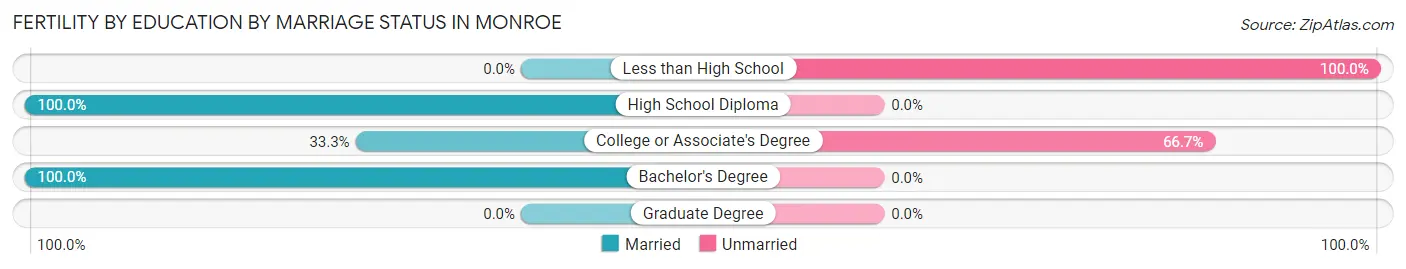
| Educational Attainment | Married | Unmarried |
| Less than High School | 0 (0.0%) | 27 (100.0%) |
| High School Diploma | 9 (100.0%) | 0 (0.0%) |
| College or Associate's Degree | 44 (33.3%) | 88 (66.7%) |
| Bachelor's Degree | 71 (100.0%) | 0 (0.0%) |
| Graduate Degree | 0 (0.0%) | 0 (0.0%) |
| Total | 124 (51.9%) | 115 (48.1%) |
Employment Characteristics in Monroe
Employment by Class of Employer in Monroe
Among the 8,907 employed individuals in Monroe, private company employees (6,517 | 73.2%), local government employees (796 | 8.9%), and not-for-profit organizations (485 | 5.4%) make up the most common classes of employment.
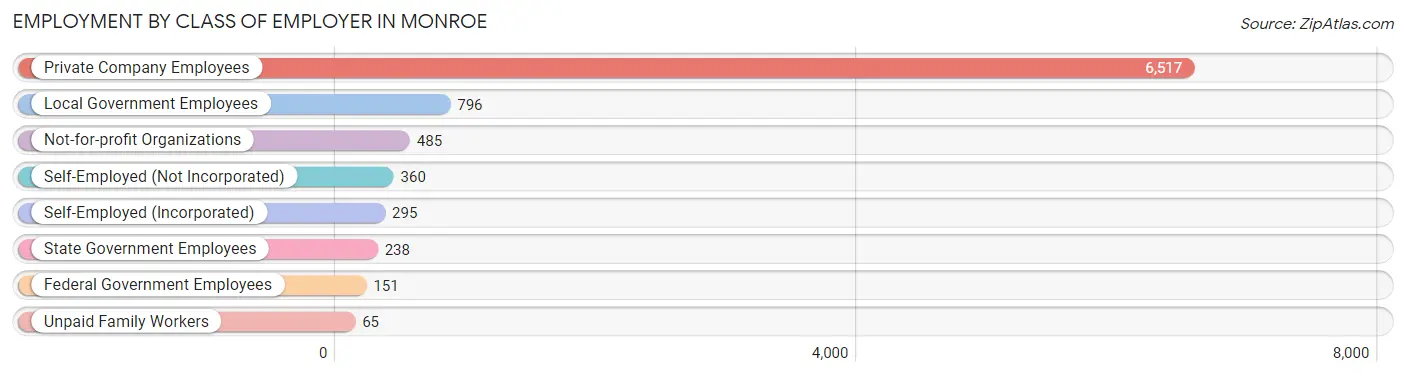
| Employer Class | # Employees | % Employees |
| Private Company Employees | 6,517 | 73.2% |
| Self-Employed (Incorporated) | 295 | 3.3% |
| Self-Employed (Not Incorporated) | 360 | 4.0% |
| Not-for-profit Organizations | 485 | 5.4% |
| Local Government Employees | 796 | 8.9% |
| State Government Employees | 238 | 2.7% |
| Federal Government Employees | 151 | 1.7% |
| Unpaid Family Workers | 65 | 0.7% |
| Total | 8,907 | 100.0% |
Employment Status by Age in Monroe
According to the labor force statistics for Monroe, out of the total population over 16 years of age (15,920), 59.8% or 9,520 individuals are in the labor force, with 4.3% or 409 of them unemployed. The age group with the highest labor force participation rate is 20 to 24 years, with 80.1% or 1,069 individuals in the labor force. Within the labor force, the 16 to 19 years age range has the highest percentage of unemployed individuals, with 12.3% or 47 of them being unemployed.
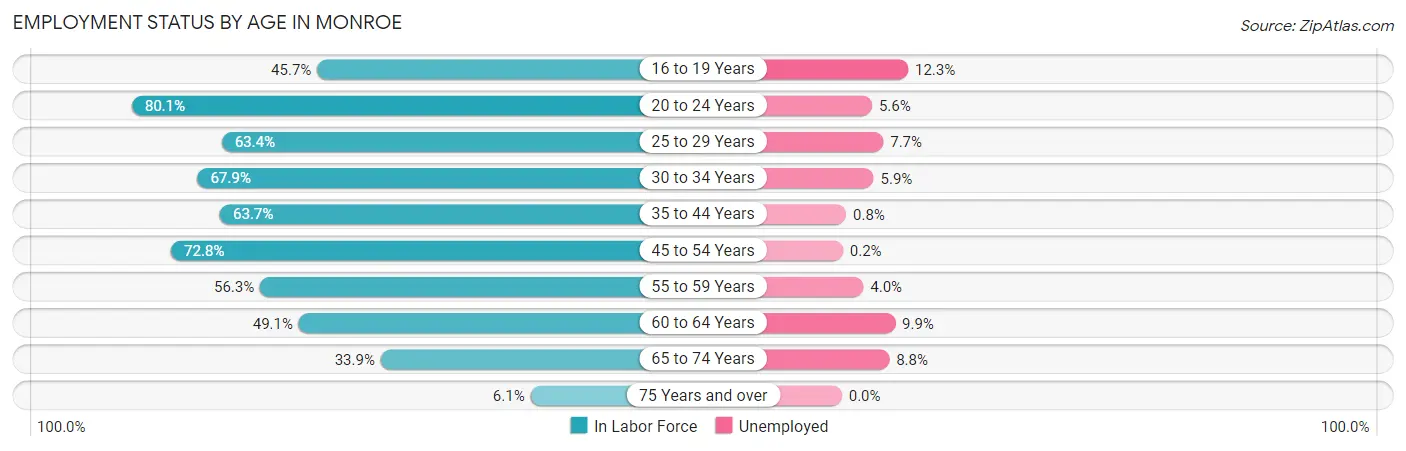
| Age Bracket | In Labor Force | Unemployed |
| 16 to 19 Years | 382 (45.7%) | 47 (12.3%) |
| 20 to 24 Years | 1,069 (80.1%) | 60 (5.6%) |
| 25 to 29 Years | 1,021 (63.4%) | 79 (7.7%) |
| 30 to 34 Years | 1,405 (67.9%) | 83 (5.9%) |
| 35 to 44 Years | 1,910 (63.7%) | 15 (0.8%) |
| 45 to 54 Years | 2,029 (72.8%) | 4 (0.2%) |
| 55 to 59 Years | 642 (56.3%) | 26 (4.0%) |
| 60 to 64 Years | 648 (49.1%) | 64 (9.9%) |
| 65 to 74 Years | 377 (33.9%) | 33 (8.8%) |
| 75 Years and over | 44 (6.1%) | 0 (0.0%) |
| Total | 9,520 (59.8%) | 409 (4.3%) |
Employment Status by Educational Attainment in Monroe
According to labor force statistics for Monroe, 64.2% of individuals (7,655) out of the total population between 25 and 64 years of age (11,924) are in the labor force, with 3.6% or 276 of them being unemployed. The group with the highest labor force participation rate are those with the educational attainment of bachelor's degree or higher, with 80.8% or 2,221 individuals in the labor force. Within the labor force, individuals with bachelor's degree or higher education have the highest percentage of unemployment, with 6.1% or 135 of them being unemployed.
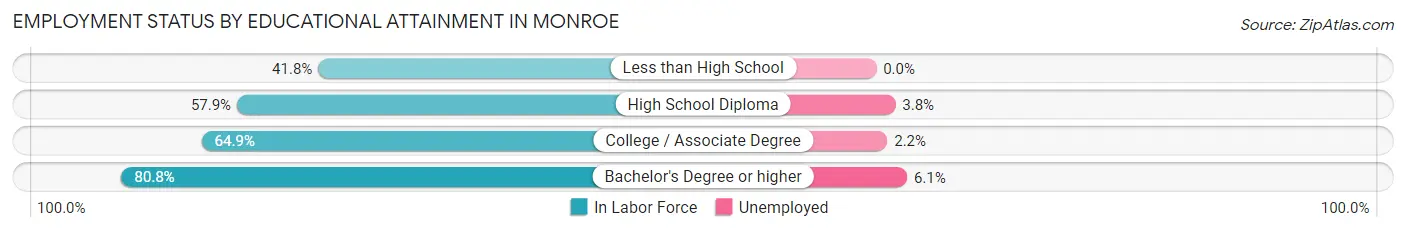
| Educational Attainment | In Labor Force | Unemployed |
| Less than High School | 527 (41.8%) | 0 (0.0%) |
| High School Diploma | 1,897 (57.9%) | 125 (3.8%) |
| College / Associate Degree | 3,010 (64.9%) | 102 (2.2%) |
| Bachelor's Degree or higher | 2,221 (80.8%) | 168 (6.1%) |
| Total | 7,655 (64.2%) | 429 (3.6%) |
Employment Occupations by Sex in Monroe
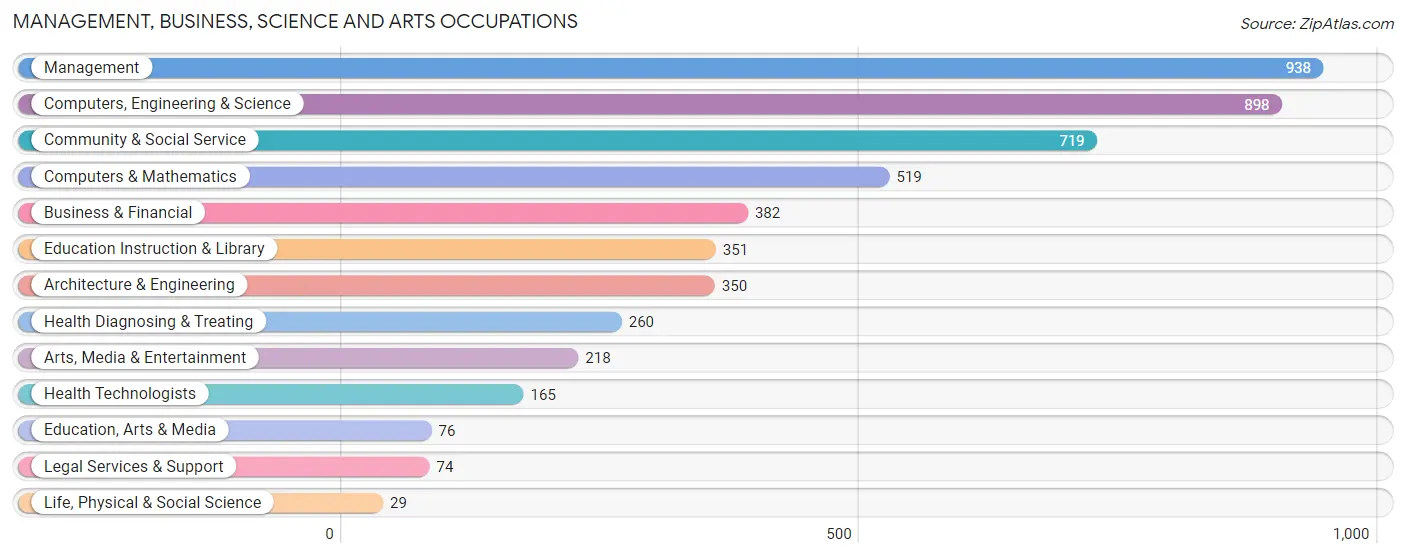
Management, Business, Science and Arts Occupations
The most common Management, Business, Science and Arts occupations in Monroe are Management (938 | 10.3%), Computers, Engineering & Science (898 | 9.9%), Community & Social Service (719 | 7.9%), Computers & Mathematics (519 | 5.7%), and Business & Financial (382 | 4.2%).
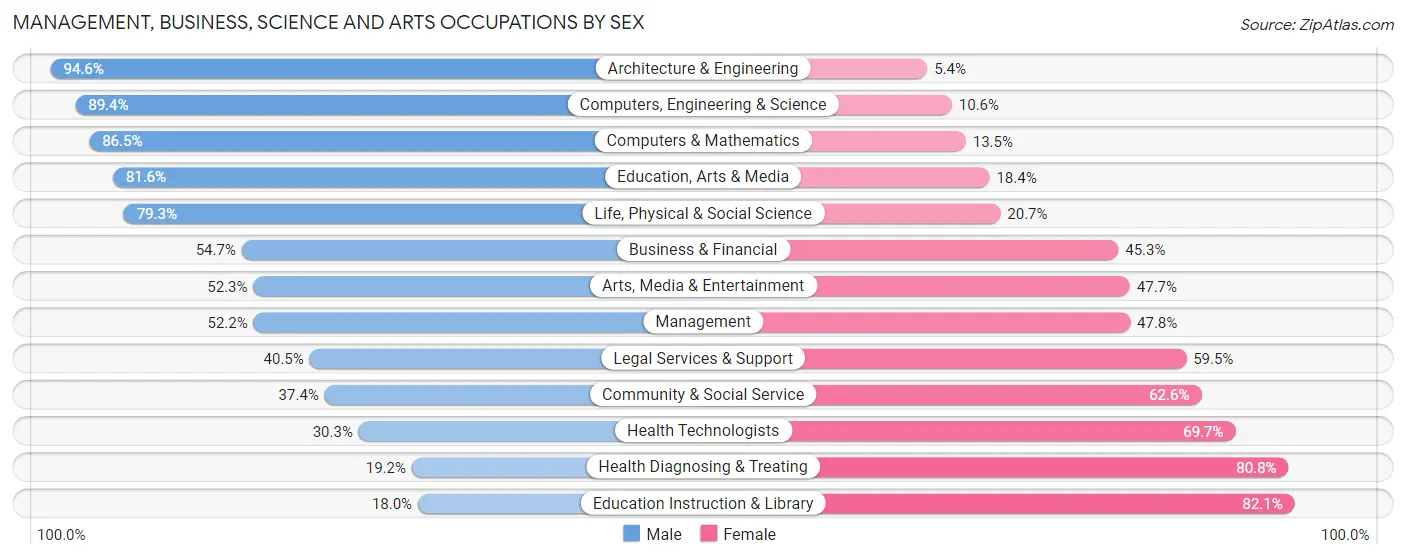
Management, Business, Science and Arts Occupations by Sex
Within the Management, Business, Science and Arts occupations in Monroe, the most male-oriented occupations are Architecture & Engineering (94.6%), Computers, Engineering & Science (89.4%), and Computers & Mathematics (86.5%), while the most female-oriented occupations are Education Instruction & Library (82.1%), Health Diagnosing & Treating (80.8%), and Health Technologists (69.7%).
| Occupation | Male | Female |
| Management | 490 (52.2%) | 448 (47.8%) |
| Business & Financial | 209 (54.7%) | 173 (45.3%) |
| Computers, Engineering & Science | 803 (89.4%) | 95 (10.6%) |
| Computers & Mathematics | 449 (86.5%) | 70 (13.5%) |
| Architecture & Engineering | 331 (94.6%) | 19 (5.4%) |
| Life, Physical & Social Science | 23 (79.3%) | 6 (20.7%) |
| Community & Social Service | 269 (37.4%) | 450 (62.6%) |
| Education, Arts & Media | 62 (81.6%) | 14 (18.4%) |
| Legal Services & Support | 30 (40.5%) | 44 (59.5%) |
| Education Instruction & Library | 63 (17.9%) | 288 (82.1%) |
| Arts, Media & Entertainment | 114 (52.3%) | 104 (47.7%) |
| Health Diagnosing & Treating | 50 (19.2%) | 210 (80.8%) |
| Health Technologists | 50 (30.3%) | 115 (69.7%) |
| Total (Category) | 1,821 (57.0%) | 1,376 (43.0%) |
| Total (Overall) | 5,283 (58.0%) | 3,828 (42.0%) |
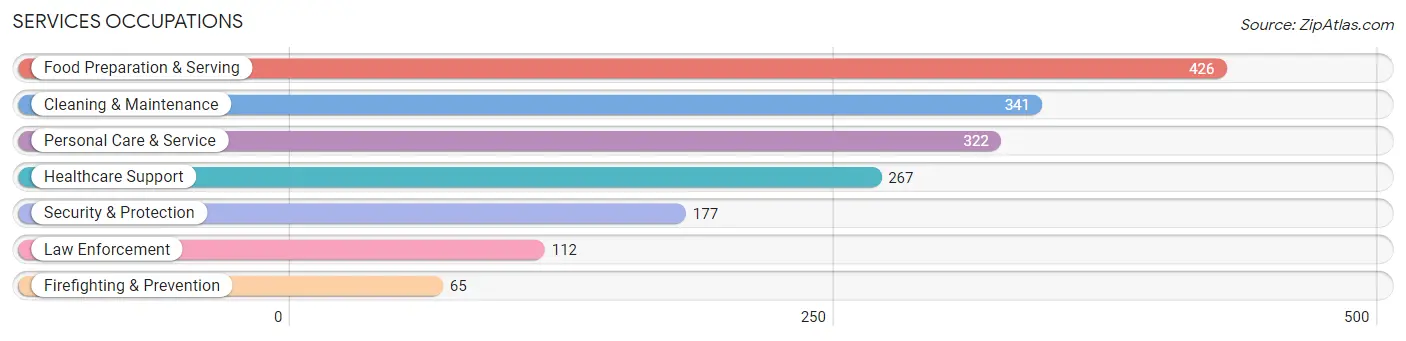
Services Occupations
The most common Services occupations in Monroe are Food Preparation & Serving (426 | 4.7%), Cleaning & Maintenance (341 | 3.7%), Personal Care & Service (322 | 3.5%), Healthcare Support (267 | 2.9%), and Security & Protection (177 | 1.9%).
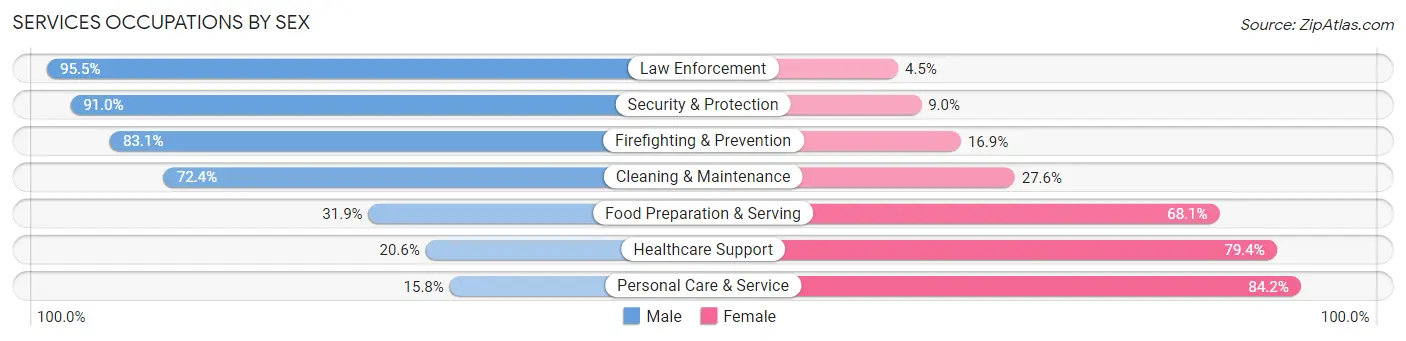
Services Occupations by Sex
Within the Services occupations in Monroe, the most male-oriented occupations are Law Enforcement (95.5%), Security & Protection (91.0%), and Firefighting & Prevention (83.1%), while the most female-oriented occupations are Personal Care & Service (84.2%), Healthcare Support (79.4%), and Food Preparation & Serving (68.1%).
| Occupation | Male | Female |
| Healthcare Support | 55 (20.6%) | 212 (79.4%) |
| Security & Protection | 161 (91.0%) | 16 (9.0%) |
| Firefighting & Prevention | 54 (83.1%) | 11 (16.9%) |
| Law Enforcement | 107 (95.5%) | 5 (4.5%) |
| Food Preparation & Serving | 136 (31.9%) | 290 (68.1%) |
| Cleaning & Maintenance | 247 (72.4%) | 94 (27.6%) |
| Personal Care & Service | 51 (15.8%) | 271 (84.2%) |
| Total (Category) | 650 (42.4%) | 883 (57.6%) |
| Total (Overall) | 5,283 (58.0%) | 3,828 (42.0%) |
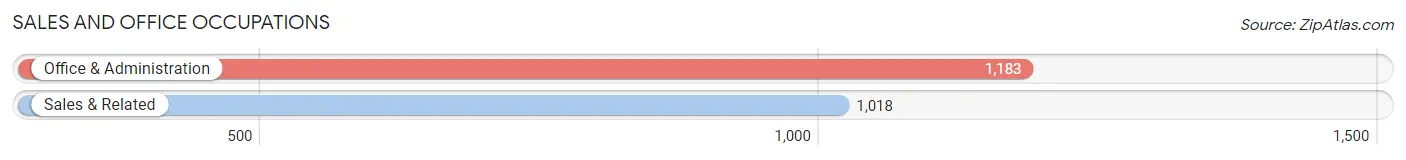
Sales and Office Occupations
The most common Sales and Office occupations in Monroe are Office & Administration (1,183 | 13.0%), and Sales & Related (1,018 | 11.2%).
Sales and Office Occupations by Sex
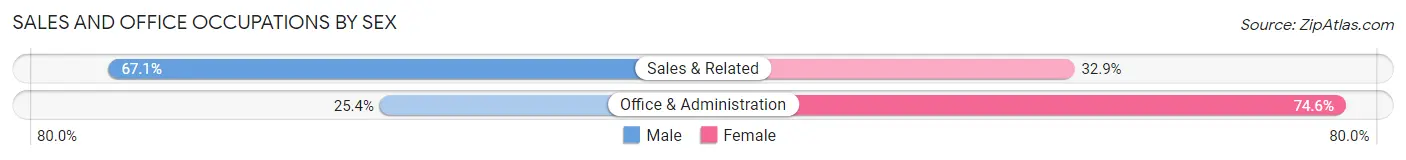
| Occupation | Male | Female |
| Sales & Related | 683 (67.1%) | 335 (32.9%) |
| Office & Administration | 300 (25.4%) | 883 (74.6%) |
| Total (Category) | 983 (44.7%) | 1,218 (55.3%) |
| Total (Overall) | 5,283 (58.0%) | 3,828 (42.0%) |
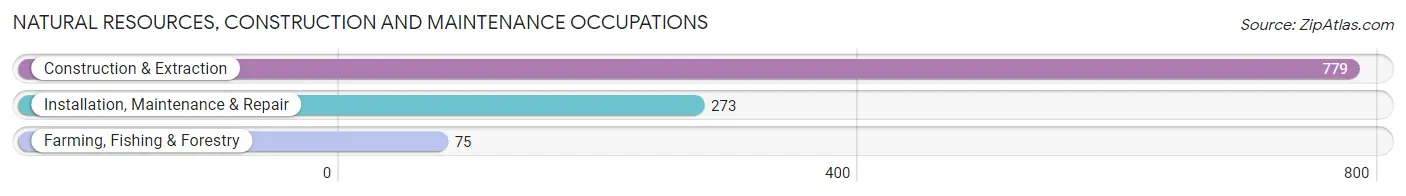
Natural Resources, Construction and Maintenance Occupations
The most common Natural Resources, Construction and Maintenance occupations in Monroe are Construction & Extraction (779 | 8.6%), Installation, Maintenance & Repair (273 | 3.0%), and Farming, Fishing & Forestry (75 | 0.8%).
Natural Resources, Construction and Maintenance Occupations by Sex
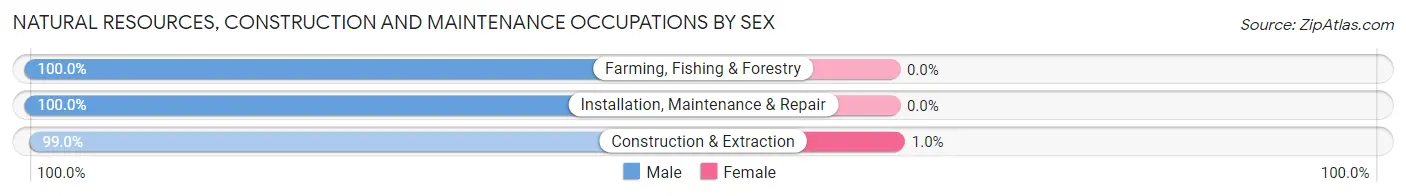
| Occupation | Male | Female |
| Farming, Fishing & Forestry | 75 (100.0%) | 0 (0.0%) |
| Construction & Extraction | 771 (99.0%) | 8 (1.0%) |
| Installation, Maintenance & Repair | 273 (100.0%) | 0 (0.0%) |
| Total (Category) | 1,119 (99.3%) | 8 (0.7%) |
| Total (Overall) | 5,283 (58.0%) | 3,828 (42.0%) |
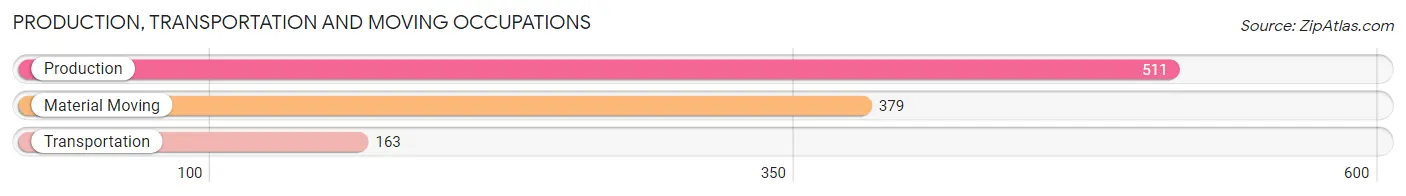
Production, Transportation and Moving Occupations
The most common Production, Transportation and Moving occupations in Monroe are Production (511 | 5.6%), Material Moving (379 | 4.2%), and Transportation (163 | 1.8%).
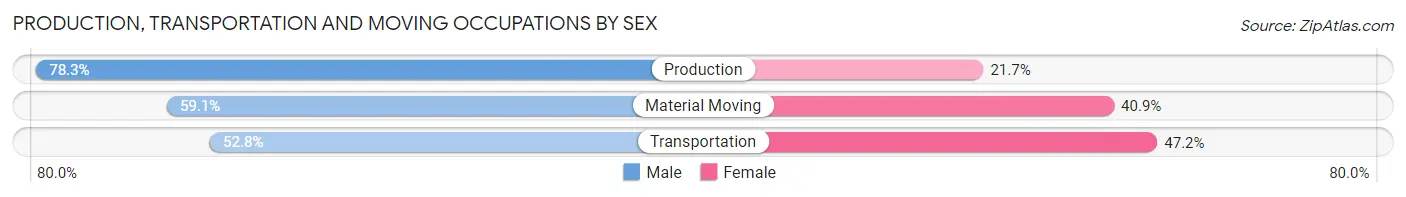
Production, Transportation and Moving Occupations by Sex
| Occupation | Male | Female |
| Production | 400 (78.3%) | 111 (21.7%) |
| Transportation | 86 (52.8%) | 77 (47.2%) |
| Material Moving | 224 (59.1%) | 155 (40.9%) |
| Total (Category) | 710 (67.4%) | 343 (32.6%) |
| Total (Overall) | 5,283 (58.0%) | 3,828 (42.0%) |
Employment Industries by Sex in Monroe
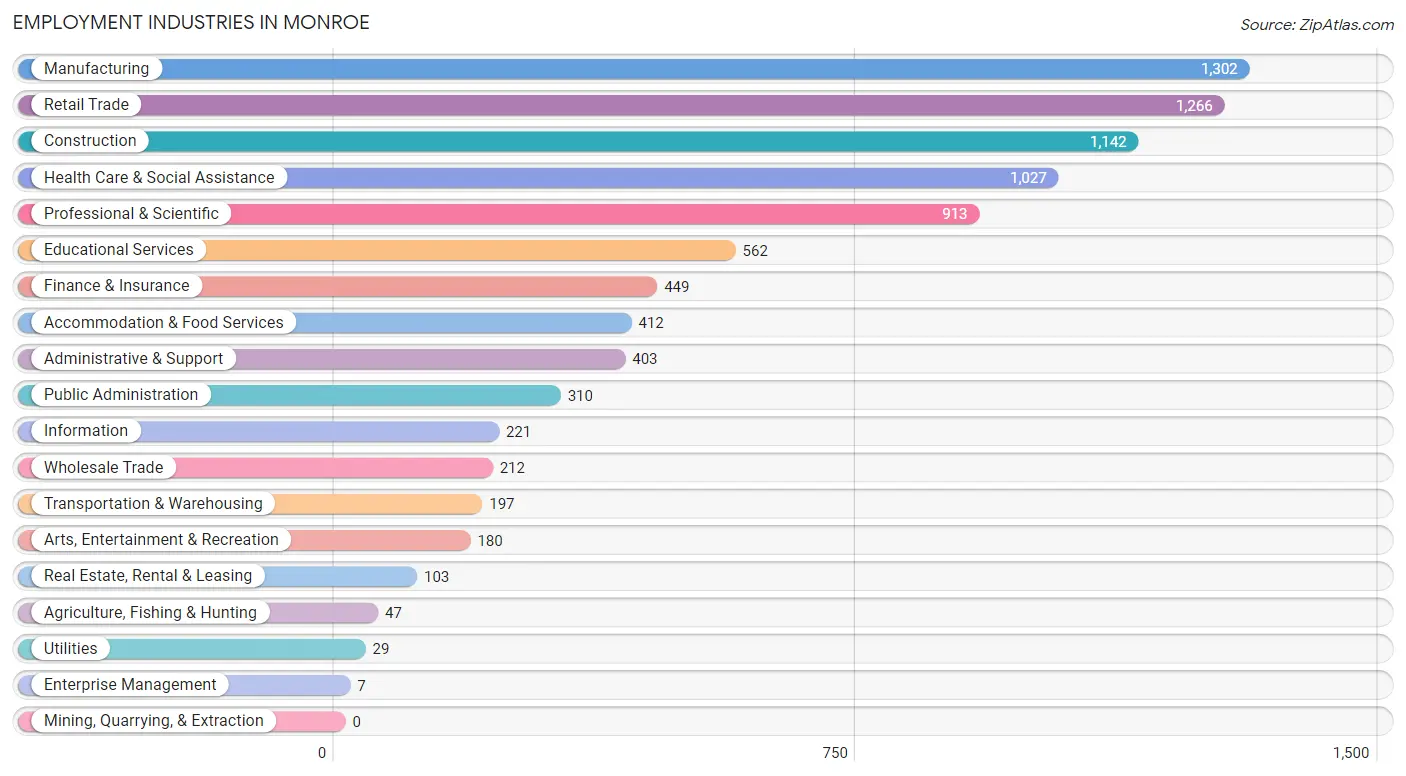
Employment Industries in Monroe
The major employment industries in Monroe include Manufacturing (1,302 | 14.3%), Retail Trade (1,266 | 13.9%), Construction (1,142 | 12.5%), Health Care & Social Assistance (1,027 | 11.3%), and Professional & Scientific (913 | 10.0%).
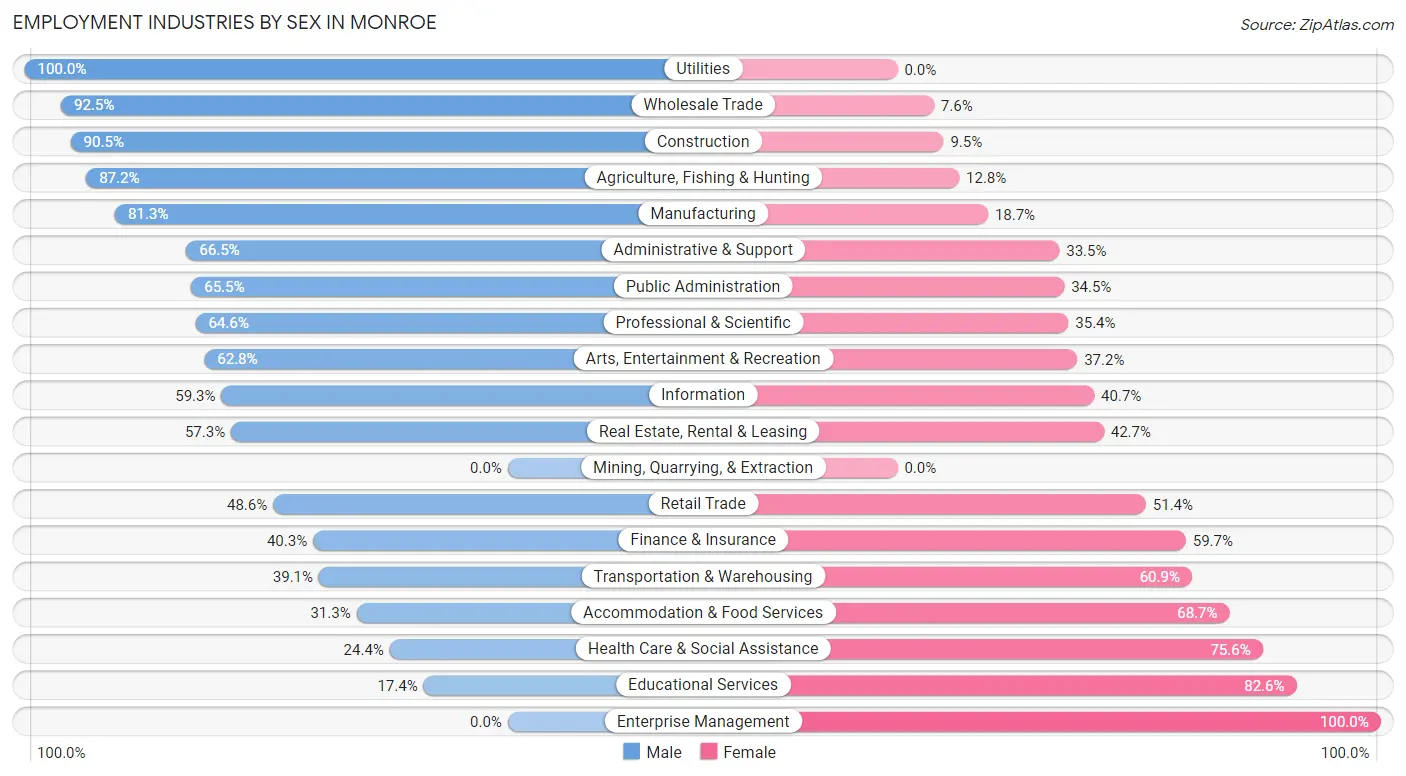
Employment Industries by Sex in Monroe
The Monroe industries that see more men than women are Utilities (100.0%), Wholesale Trade (92.4%), and Construction (90.5%), whereas the industries that tend to have a higher number of women are Enterprise Management (100.0%), Educational Services (82.6%), and Health Care & Social Assistance (75.6%).
| Industry | Male | Female |
| Agriculture, Fishing & Hunting | 41 (87.2%) | 6 (12.8%) |
| Mining, Quarrying, & Extraction | 0 (0.0%) | 0 (0.0%) |
| Construction | 1,033 (90.5%) | 109 (9.5%) |
| Manufacturing | 1,058 (81.3%) | 244 (18.7%) |
| Wholesale Trade | 196 (92.4%) | 16 (7.5%) |
| Retail Trade | 615 (48.6%) | 651 (51.4%) |
| Transportation & Warehousing | 77 (39.1%) | 120 (60.9%) |
| Utilities | 29 (100.0%) | 0 (0.0%) |
| Information | 131 (59.3%) | 90 (40.7%) |
| Finance & Insurance | 181 (40.3%) | 268 (59.7%) |
| Real Estate, Rental & Leasing | 59 (57.3%) | 44 (42.7%) |
| Professional & Scientific | 590 (64.6%) | 323 (35.4%) |
| Enterprise Management | 0 (0.0%) | 7 (100.0%) |
| Administrative & Support | 268 (66.5%) | 135 (33.5%) |
| Educational Services | 98 (17.4%) | 464 (82.6%) |
| Health Care & Social Assistance | 251 (24.4%) | 776 (75.6%) |
| Arts, Entertainment & Recreation | 113 (62.8%) | 67 (37.2%) |
| Accommodation & Food Services | 129 (31.3%) | 283 (68.7%) |
| Public Administration | 203 (65.5%) | 107 (34.5%) |
| Total | 5,283 (58.0%) | 3,828 (42.0%) |
Education in Monroe
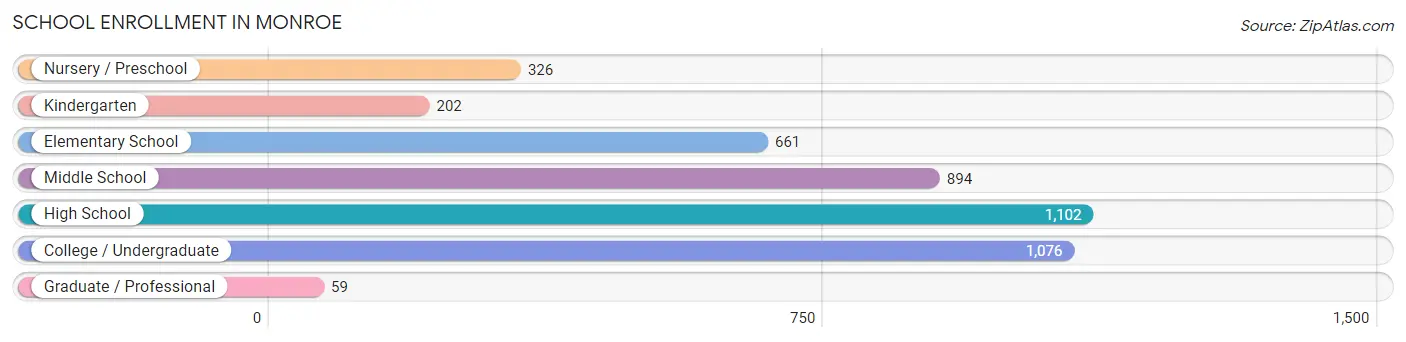
School Enrollment in Monroe
The most common levels of schooling among the 4,320 students in Monroe are high school (1,102 | 25.5%), college / undergraduate (1,076 | 24.9%), and middle school (894 | 20.7%).
| School Level | # Students | % Students |
| Nursery / Preschool | 326 | 7.5% |
| Kindergarten | 202 | 4.7% |
| Elementary School | 661 | 15.3% |
| Middle School | 894 | 20.7% |
| High School | 1,102 | 25.5% |
| College / Undergraduate | 1,076 | 24.9% |
| Graduate / Professional | 59 | 1.4% |
| Total | 4,320 | 100.0% |
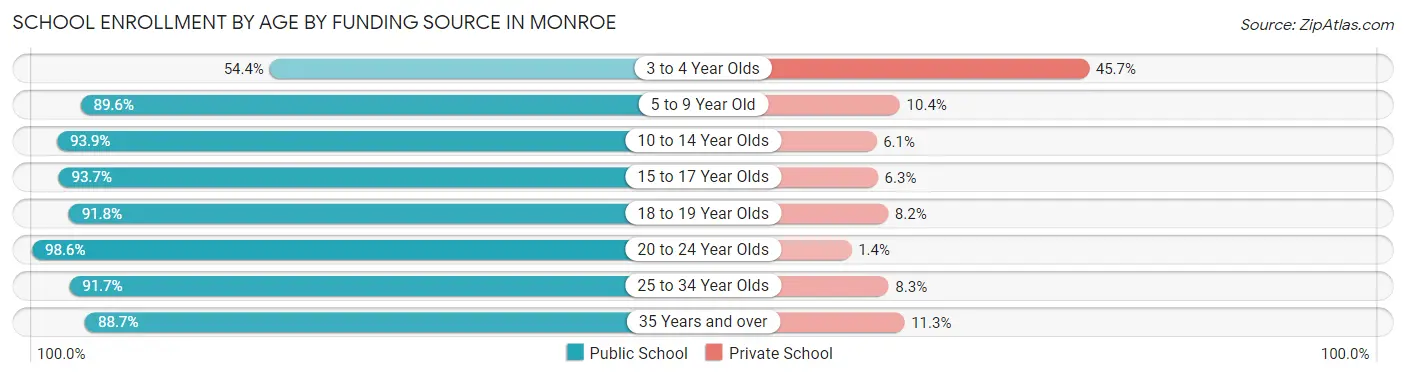
School Enrollment by Age by Funding Source in Monroe
Out of a total of 4,320 students who are enrolled in schools in Monroe, 428 (9.9%) attend a private institution, while the remaining 3,892 (90.1%) are enrolled in public schools. The age group of 3 to 4 year olds has the highest likelihood of being enrolled in private schools, with 126 (45.7% in the age bracket) enrolled. Conversely, the age group of 20 to 24 year olds has the lowest likelihood of being enrolled in a private school, with 350 (98.6% in the age bracket) attending a public institution.
| Age Bracket | Public School | Private School |
| 3 to 4 Year Olds | 150 (54.3%) | 126 (45.7%) |
| 5 to 9 Year Old | 747 (89.6%) | 87 (10.4%) |
| 10 to 14 Year Olds | 977 (93.9%) | 63 (6.1%) |
| 15 to 17 Year Olds | 740 (93.7%) | 50 (6.3%) |
| 18 to 19 Year Olds | 156 (91.8%) | 14 (8.2%) |
| 20 to 24 Year Olds | 350 (98.6%) | 5 (1.4%) |
| 25 to 34 Year Olds | 418 (91.7%) | 38 (8.3%) |
| 35 Years and over | 354 (88.7%) | 45 (11.3%) |
| Total | 3,892 (90.1%) | 428 (9.9%) |
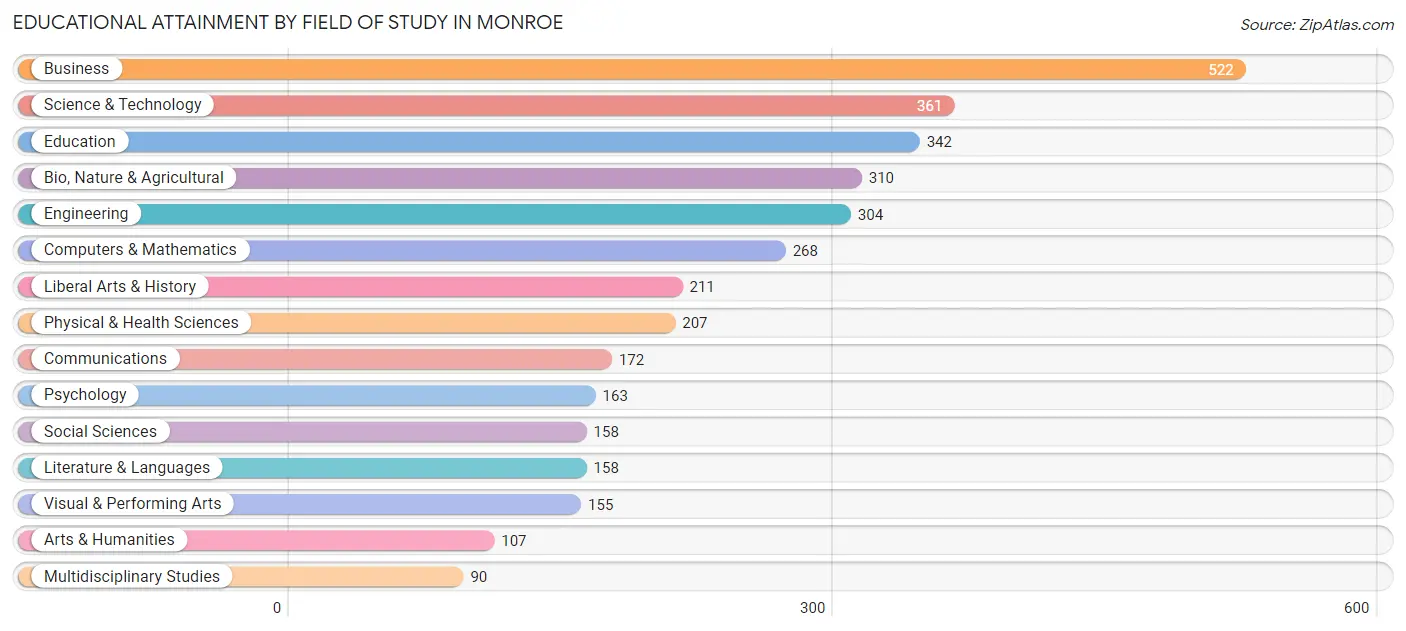
Educational Attainment by Field of Study in Monroe
Business (522 | 14.8%), science & technology (361 | 10.2%), education (342 | 9.7%), bio, nature & agricultural (310 | 8.8%), and engineering (304 | 8.6%) are the most common fields of study among 3,528 individuals in Monroe who have obtained a bachelor's degree or higher.
| Field of Study | # Graduates | % Graduates |
| Computers & Mathematics | 268 | 7.6% |
| Bio, Nature & Agricultural | 310 | 8.8% |
| Physical & Health Sciences | 207 | 5.9% |
| Psychology | 163 | 4.6% |
| Social Sciences | 158 | 4.5% |
| Engineering | 304 | 8.6% |
| Multidisciplinary Studies | 90 | 2.5% |
| Science & Technology | 361 | 10.2% |
| Business | 522 | 14.8% |
| Education | 342 | 9.7% |
| Literature & Languages | 158 | 4.5% |
| Liberal Arts & History | 211 | 6.0% |
| Visual & Performing Arts | 155 | 4.4% |
| Communications | 172 | 4.9% |
| Arts & Humanities | 107 | 3.0% |
| Total | 3,528 | 100.0% |
Transportation & Commute in Monroe
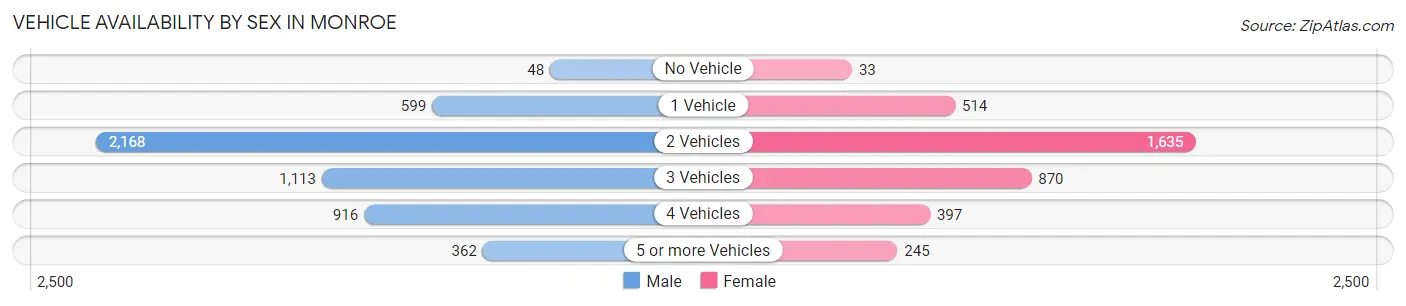
Vehicle Availability by Sex in Monroe
The most prevalent vehicle ownership categories in Monroe are males with 2 vehicles (2,168, accounting for 41.6%) and females with 2 vehicles (1,635, making up 58.7%).
| Vehicles Available | Male | Female |
| No Vehicle | 48 (0.9%) | 33 (0.9%) |
| 1 Vehicle | 599 (11.5%) | 514 (13.9%) |
| 2 Vehicles | 2,168 (41.6%) | 1,635 (44.3%) |
| 3 Vehicles | 1,113 (21.4%) | 870 (23.5%) |
| 4 Vehicles | 916 (17.6%) | 397 (10.7%) |
| 5 or more Vehicles | 362 (7.0%) | 245 (6.6%) |
| Total | 5,206 (100.0%) | 3,694 (100.0%) |
Commute Time in Monroe
The most frequently occuring commute durations in Monroe are 45 to 59 minutes (1,354 commuters, 17.6%), 5 to 9 minutes (972 commuters, 12.6%), and 30 to 34 minutes (961 commuters, 12.5%).
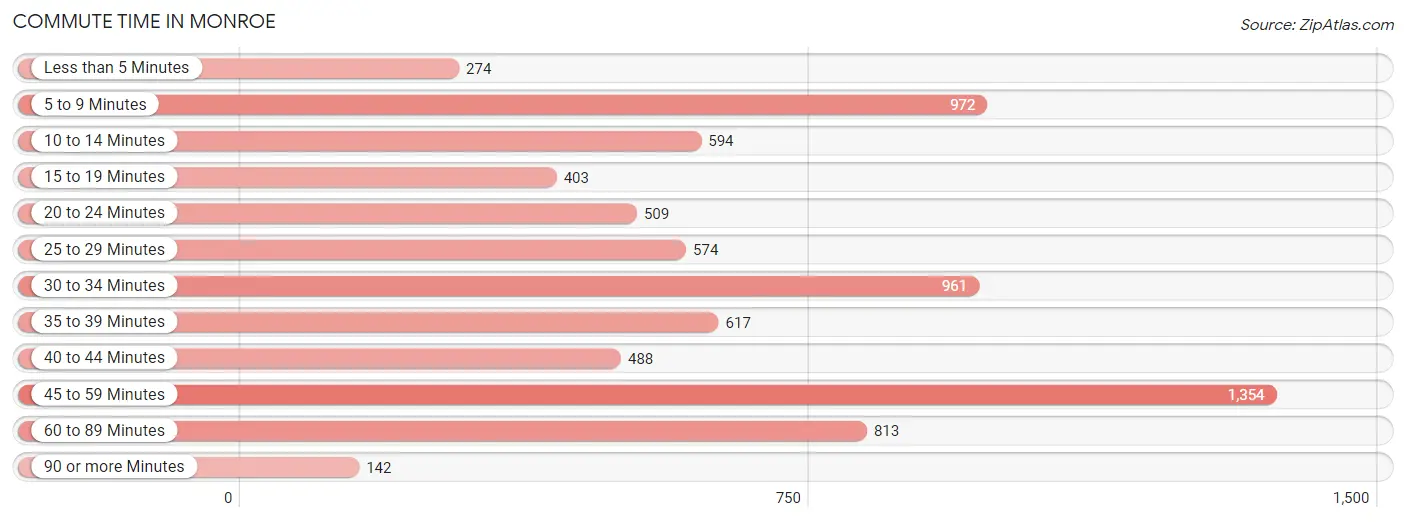
| Commute Time | # Commuters | % Commuters |
| Less than 5 Minutes | 274 | 3.6% |
| 5 to 9 Minutes | 972 | 12.6% |
| 10 to 14 Minutes | 594 | 7.7% |
| 15 to 19 Minutes | 403 | 5.2% |
| 20 to 24 Minutes | 509 | 6.6% |
| 25 to 29 Minutes | 574 | 7.4% |
| 30 to 34 Minutes | 961 | 12.5% |
| 35 to 39 Minutes | 617 | 8.0% |
| 40 to 44 Minutes | 488 | 6.3% |
| 45 to 59 Minutes | 1,354 | 17.6% |
| 60 to 89 Minutes | 813 | 10.6% |
| 90 or more Minutes | 142 | 1.8% |
Commute Time by Sex in Monroe
The most common commute times in Monroe are 45 to 59 minutes (841 commuters, 18.3%) for males and 5 to 9 minutes (598 commuters, 19.2%) for females.
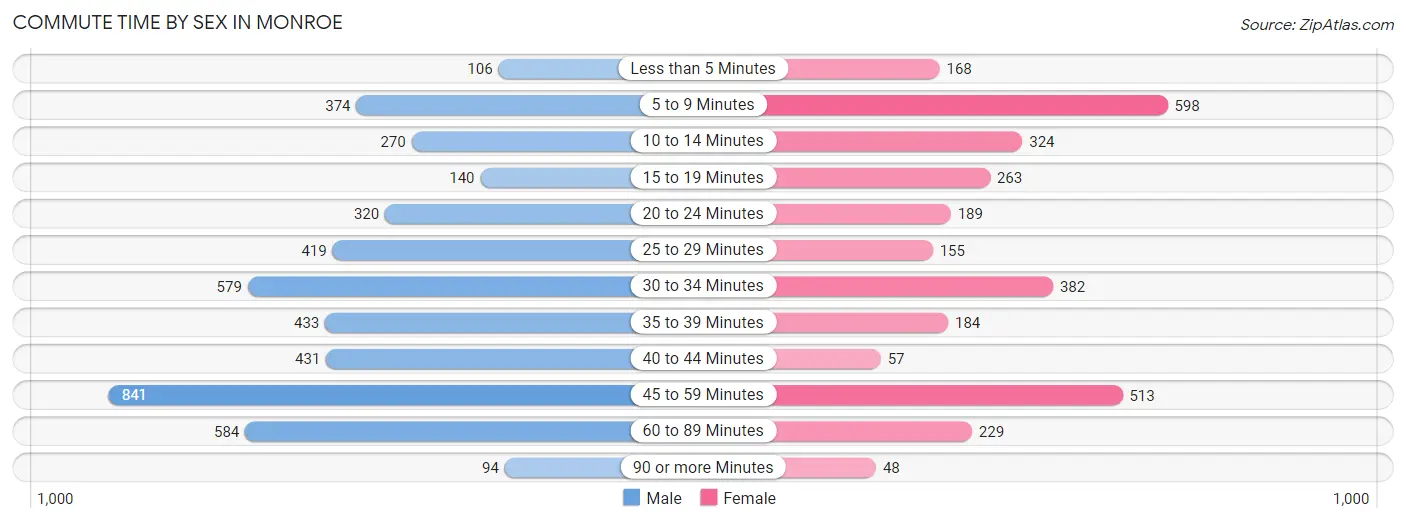
| Commute Time | Male | Female |
| Less than 5 Minutes | 106 (2.3%) | 168 (5.4%) |
| 5 to 9 Minutes | 374 (8.2%) | 598 (19.2%) |
| 10 to 14 Minutes | 270 (5.9%) | 324 (10.4%) |
| 15 to 19 Minutes | 140 (3.0%) | 263 (8.5%) |
| 20 to 24 Minutes | 320 (7.0%) | 189 (6.1%) |
| 25 to 29 Minutes | 419 (9.1%) | 155 (5.0%) |
| 30 to 34 Minutes | 579 (12.6%) | 382 (12.3%) |
| 35 to 39 Minutes | 433 (9.4%) | 184 (5.9%) |
| 40 to 44 Minutes | 431 (9.4%) | 57 (1.8%) |
| 45 to 59 Minutes | 841 (18.3%) | 513 (16.5%) |
| 60 to 89 Minutes | 584 (12.7%) | 229 (7.4%) |
| 90 or more Minutes | 94 (2.1%) | 48 (1.5%) |
Time of Departure to Work by Sex in Monroe
The most frequent times of departure to work in Monroe are 6:00 AM to 6:29 AM (676, 14.7%) for males and 7:30 AM to 7:59 AM (474, 15.2%) for females.
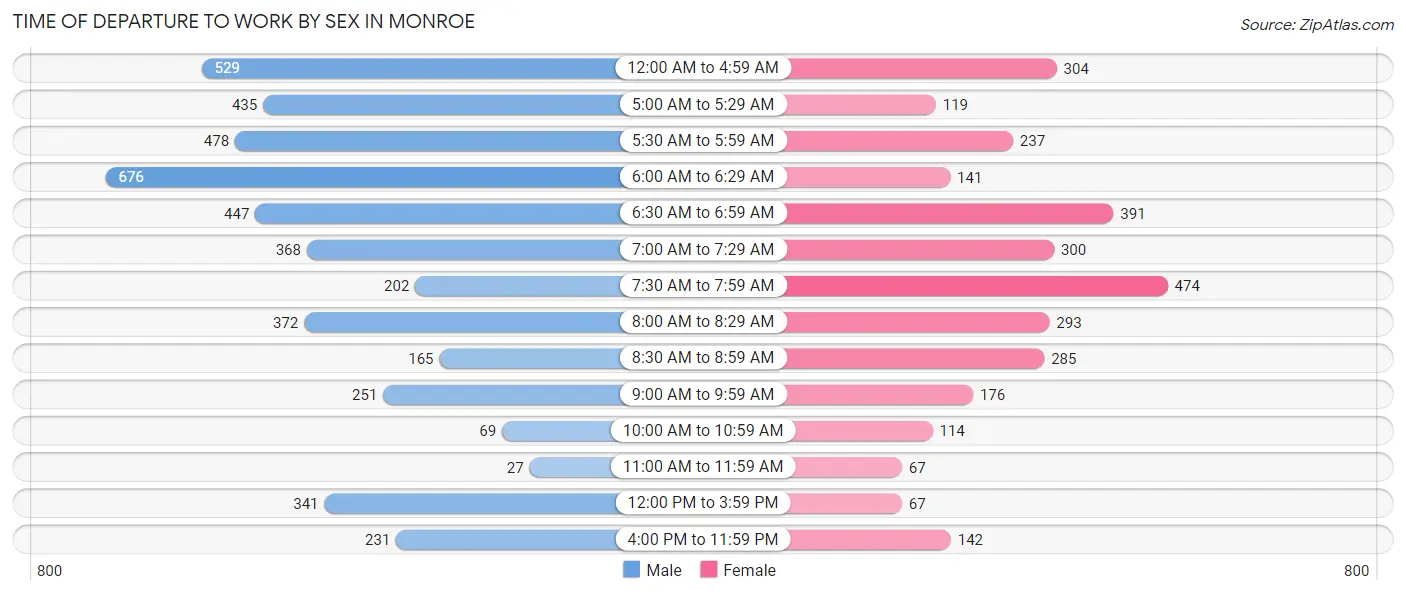
| Time of Departure | Male | Female |
| 12:00 AM to 4:59 AM | 529 (11.5%) | 304 (9.8%) |
| 5:00 AM to 5:29 AM | 435 (9.5%) | 119 (3.8%) |
| 5:30 AM to 5:59 AM | 478 (10.4%) | 237 (7.6%) |
| 6:00 AM to 6:29 AM | 676 (14.7%) | 141 (4.5%) |
| 6:30 AM to 6:59 AM | 447 (9.7%) | 391 (12.6%) |
| 7:00 AM to 7:29 AM | 368 (8.0%) | 300 (9.7%) |
| 7:30 AM to 7:59 AM | 202 (4.4%) | 474 (15.2%) |
| 8:00 AM to 8:29 AM | 372 (8.1%) | 293 (9.4%) |
| 8:30 AM to 8:59 AM | 165 (3.6%) | 285 (9.2%) |
| 9:00 AM to 9:59 AM | 251 (5.5%) | 176 (5.7%) |
| 10:00 AM to 10:59 AM | 69 (1.5%) | 114 (3.7%) |
| 11:00 AM to 11:59 AM | 27 (0.6%) | 67 (2.1%) |
| 12:00 PM to 3:59 PM | 341 (7.4%) | 67 (2.1%) |
| 4:00 PM to 11:59 PM | 231 (5.0%) | 142 (4.6%) |
| Total | 4,591 (100.0%) | 3,110 (100.0%) |
Housing Occupancy in Monroe
Occupancy by Ownership in Monroe
Of the total 6,038 dwellings in Monroe, owner-occupied units account for 4,197 (69.5%), while renter-occupied units make up 1,841 (30.5%).
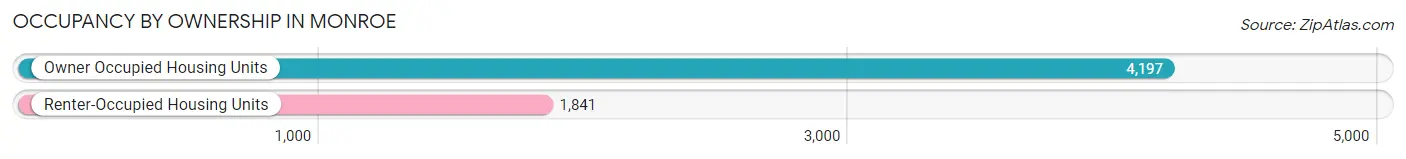
| Occupancy | # Housing Units | % Housing Units |
| Owner Occupied Housing Units | 4,197 | 69.5% |
| Renter-Occupied Housing Units | 1,841 | 30.5% |
| Total Occupied Housing Units | 6,038 | 100.0% |
Occupancy by Household Size in Monroe
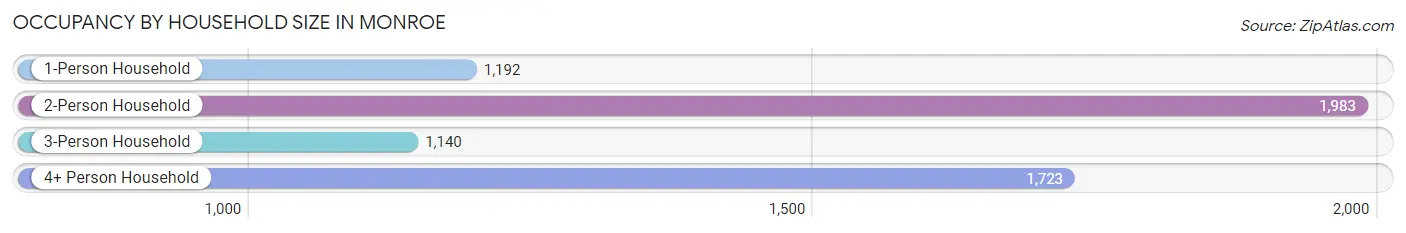
| Household Size | # Housing Units | % Housing Units |
| 1-Person Household | 1,192 | 19.7% |
| 2-Person Household | 1,983 | 32.8% |
| 3-Person Household | 1,140 | 18.9% |
| 4+ Person Household | 1,723 | 28.5% |
| Total Housing Units | 6,038 | 100.0% |
Occupancy by Ownership by Household Size in Monroe
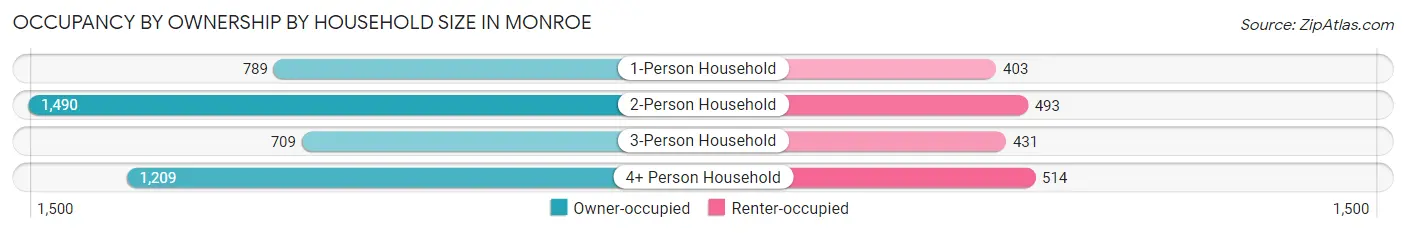
| Household Size | Owner-occupied | Renter-occupied |
| 1-Person Household | 789 (66.2%) | 403 (33.8%) |
| 2-Person Household | 1,490 (75.1%) | 493 (24.9%) |
| 3-Person Household | 709 (62.2%) | 431 (37.8%) |
| 4+ Person Household | 1,209 (70.2%) | 514 (29.8%) |
| Total Housing Units | 4,197 (69.5%) | 1,841 (30.5%) |
Occupancy by Educational Attainment in Monroe
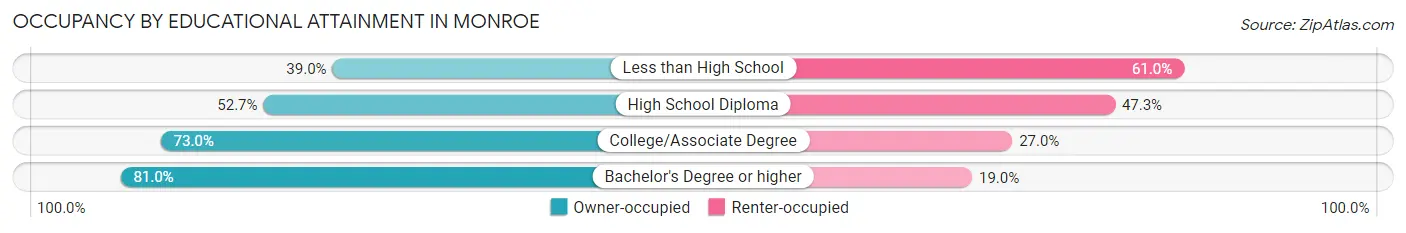
| Household Size | Owner-occupied | Renter-occupied |
| Less than High School | 152 (39.0%) | 238 (61.0%) |
| High School Diploma | 565 (52.7%) | 508 (47.3%) |
| College/Associate Degree | 2,066 (73.0%) | 763 (27.0%) |
| Bachelor's Degree or higher | 1,414 (81.0%) | 332 (19.0%) |
Occupancy by Age of Householder in Monroe
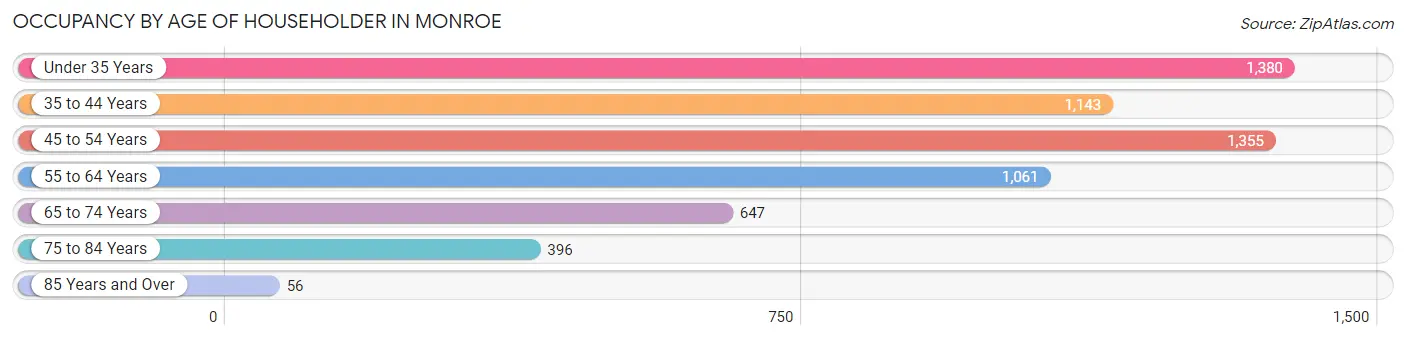
| Age Bracket | # Households | % Households |
| Under 35 Years | 1,380 | 22.9% |
| 35 to 44 Years | 1,143 | 18.9% |
| 45 to 54 Years | 1,355 | 22.4% |
| 55 to 64 Years | 1,061 | 17.6% |
| 65 to 74 Years | 647 | 10.7% |
| 75 to 84 Years | 396 | 6.6% |
| 85 Years and Over | 56 | 0.9% |
| Total | 6,038 | 100.0% |
Housing Finances in Monroe
Median Income by Occupancy in Monroe
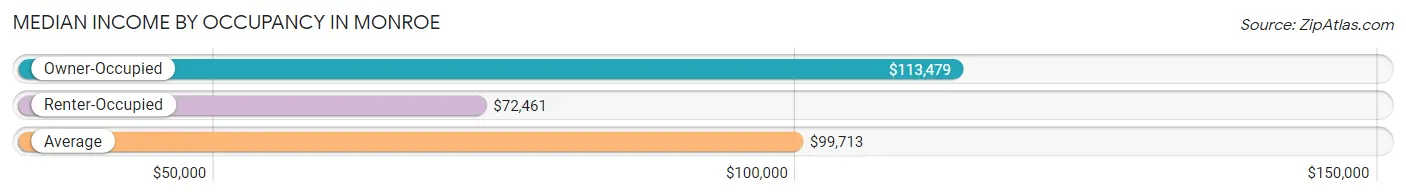
| Occupancy Type | # Households | Median Income |
| Owner-Occupied | 4,197 (69.5%) | $113,479 |
| Renter-Occupied | 1,841 (30.5%) | $72,461 |
| Average | 6,038 (100.0%) | $99,713 |
Occupancy by Householder Income Bracket in Monroe
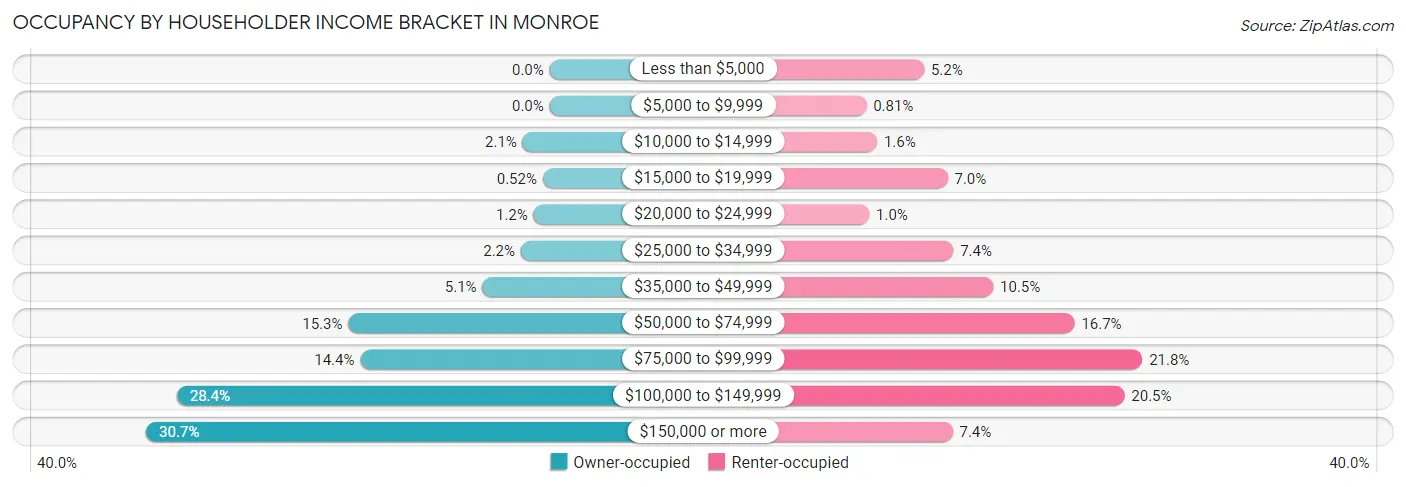
| Income Bracket | Owner-occupied | Renter-occupied |
| Less than $5,000 | 0 (0.0%) | 96 (5.2%) |
| $5,000 to $9,999 | 0 (0.0%) | 15 (0.8%) |
| $10,000 to $14,999 | 86 (2.1%) | 30 (1.6%) |
| $15,000 to $19,999 | 22 (0.5%) | 129 (7.0%) |
| $20,000 to $24,999 | 51 (1.2%) | 19 (1.0%) |
| $25,000 to $34,999 | 92 (2.2%) | 137 (7.4%) |
| $35,000 to $49,999 | 215 (5.1%) | 193 (10.5%) |
| $50,000 to $74,999 | 644 (15.3%) | 307 (16.7%) |
| $75,000 to $99,999 | 605 (14.4%) | 402 (21.8%) |
| $100,000 to $149,999 | 1,192 (28.4%) | 377 (20.5%) |
| $150,000 or more | 1,290 (30.7%) | 136 (7.4%) |
| Total | 4,197 (100.0%) | 1,841 (100.0%) |
Monthly Housing Cost Tiers in Monroe
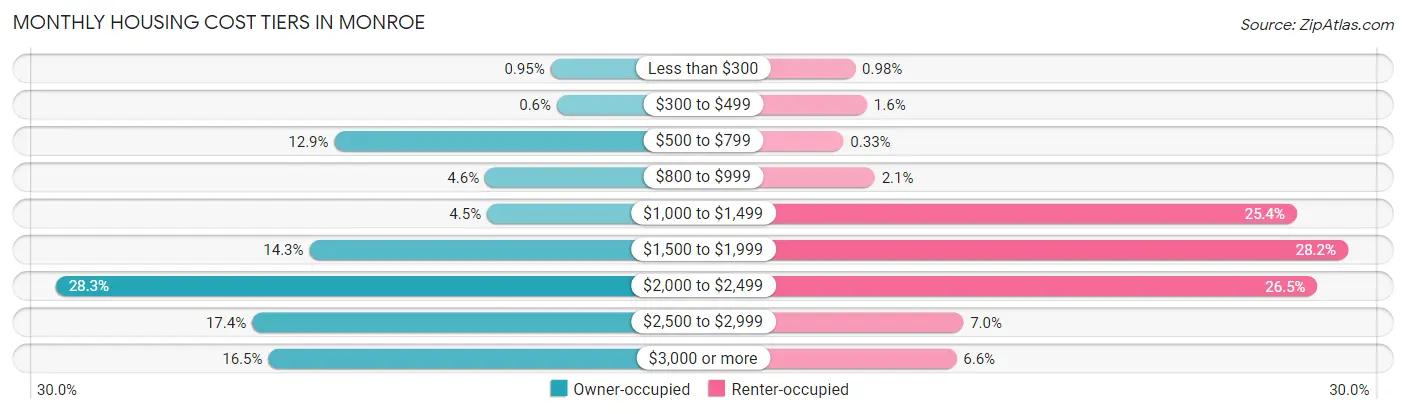
| Monthly Cost | Owner-occupied | Renter-occupied |
| Less than $300 | 40 (0.9%) | 18 (1.0%) |
| $300 to $499 | 25 (0.6%) | 30 (1.6%) |
| $500 to $799 | 541 (12.9%) | 6 (0.3%) |
| $800 to $999 | 192 (4.6%) | 38 (2.1%) |
| $1,000 to $1,499 | 187 (4.5%) | 467 (25.4%) |
| $1,500 to $1,999 | 599 (14.3%) | 519 (28.2%) |
| $2,000 to $2,499 | 1,187 (28.3%) | 488 (26.5%) |
| $2,500 to $2,999 | 732 (17.4%) | 128 (7.0%) |
| $3,000 or more | 694 (16.5%) | 121 (6.6%) |
| Total | 4,197 (100.0%) | 1,841 (100.0%) |
Physical Housing Characteristics in Monroe
Housing Structures in Monroe
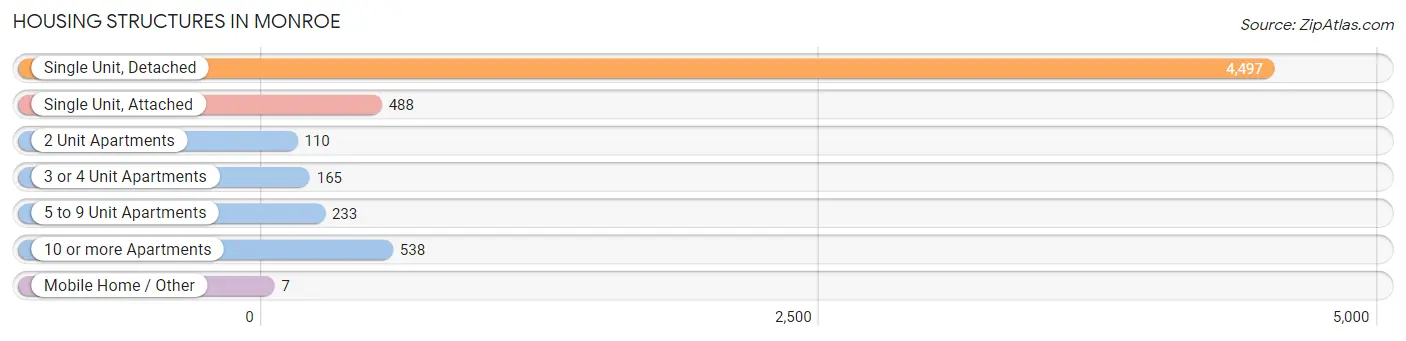
| Structure Type | # Housing Units | % Housing Units |
| Single Unit, Detached | 4,497 | 74.5% |
| Single Unit, Attached | 488 | 8.1% |
| 2 Unit Apartments | 110 | 1.8% |
| 3 or 4 Unit Apartments | 165 | 2.7% |
| 5 to 9 Unit Apartments | 233 | 3.9% |
| 10 or more Apartments | 538 | 8.9% |
| Mobile Home / Other | 7 | 0.1% |
| Total | 6,038 | 100.0% |
Housing Structures by Occupancy in Monroe
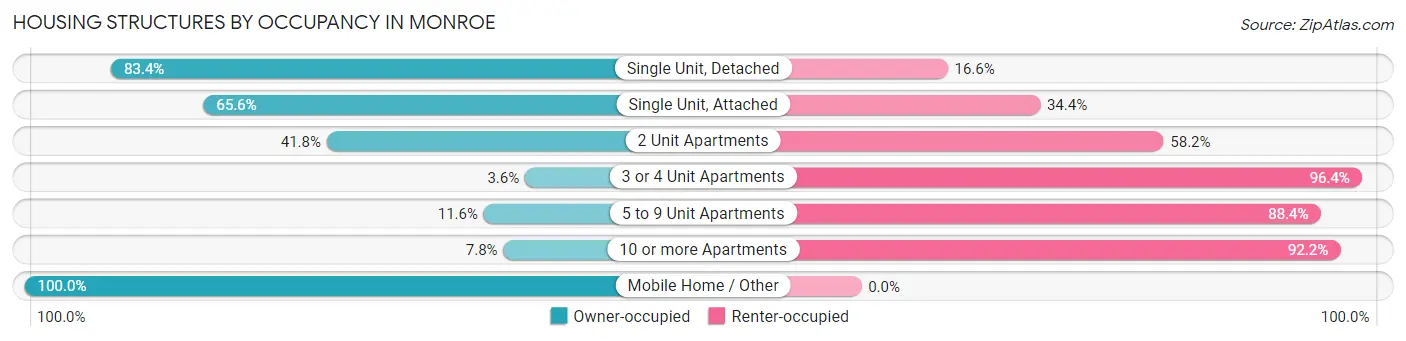
| Structure Type | Owner-occupied | Renter-occupied |
| Single Unit, Detached | 3,749 (83.4%) | 748 (16.6%) |
| Single Unit, Attached | 320 (65.6%) | 168 (34.4%) |
| 2 Unit Apartments | 46 (41.8%) | 64 (58.2%) |
| 3 or 4 Unit Apartments | 6 (3.6%) | 159 (96.4%) |
| 5 to 9 Unit Apartments | 27 (11.6%) | 206 (88.4%) |
| 10 or more Apartments | 42 (7.8%) | 496 (92.2%) |
| Mobile Home / Other | 7 (100.0%) | 0 (0.0%) |
| Total | 4,197 (69.5%) | 1,841 (30.5%) |
Housing Structures by Number of Rooms in Monroe
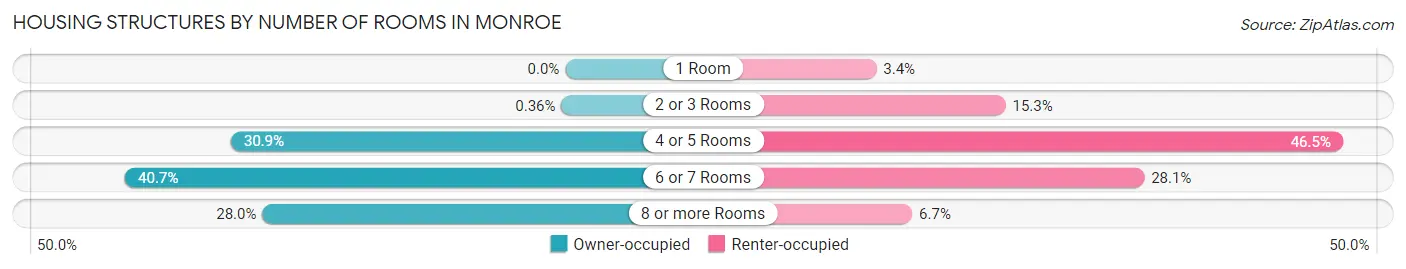
| Number of Rooms | Owner-occupied | Renter-occupied |
| 1 Room | 0 (0.0%) | 62 (3.4%) |
| 2 or 3 Rooms | 15 (0.4%) | 282 (15.3%) |
| 4 or 5 Rooms | 1,298 (30.9%) | 856 (46.5%) |
| 6 or 7 Rooms | 1,708 (40.7%) | 518 (28.1%) |
| 8 or more Rooms | 1,176 (28.0%) | 123 (6.7%) |
| Total | 4,197 (100.0%) | 1,841 (100.0%) |
Housing Structure by Heating Type in Monroe
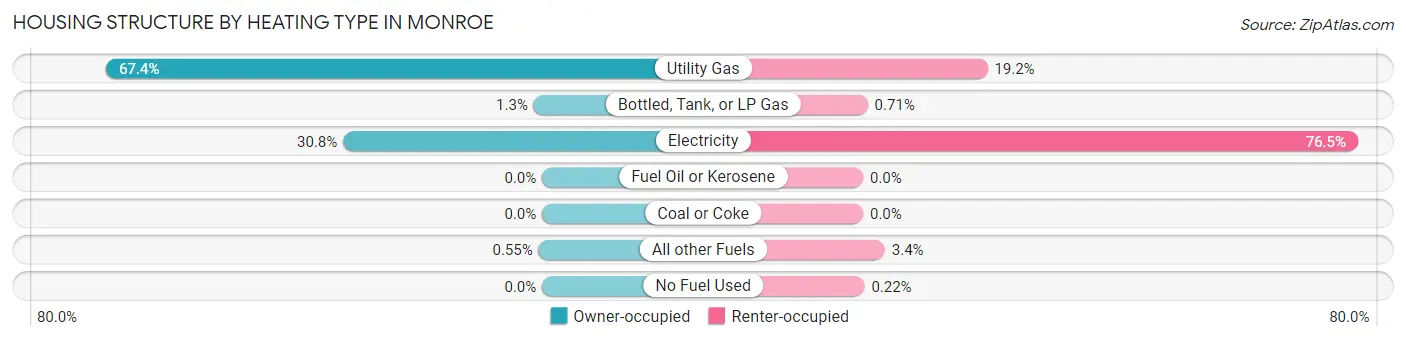
| Heating Type | Owner-occupied | Renter-occupied |
| Utility Gas | 2,829 (67.4%) | 354 (19.2%) |
| Bottled, Tank, or LP Gas | 54 (1.3%) | 13 (0.7%) |
| Electricity | 1,291 (30.8%) | 1,408 (76.5%) |
| Fuel Oil or Kerosene | 0 (0.0%) | 0 (0.0%) |
| Coal or Coke | 0 (0.0%) | 0 (0.0%) |
| All other Fuels | 23 (0.5%) | 62 (3.4%) |
| No Fuel Used | 0 (0.0%) | 4 (0.2%) |
| Total | 4,197 (100.0%) | 1,841 (100.0%) |
Household Vehicle Usage in Monroe
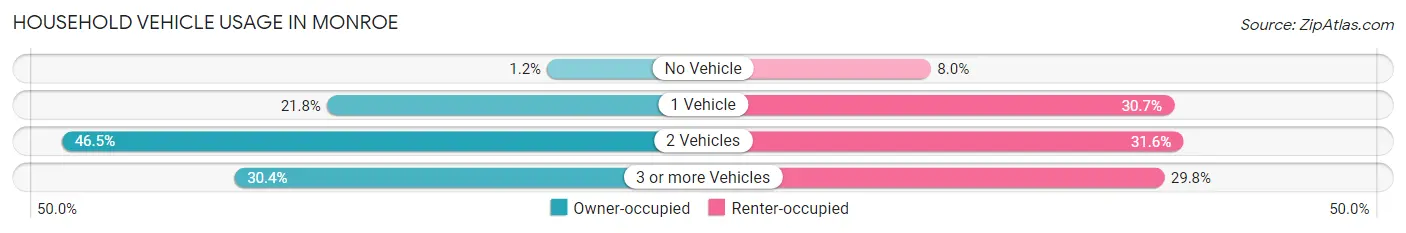
| Vehicles per Household | Owner-occupied | Renter-occupied |
| No Vehicle | 52 (1.2%) | 147 (8.0%) |
| 1 Vehicle | 915 (21.8%) | 565 (30.7%) |
| 2 Vehicles | 1,953 (46.5%) | 581 (31.6%) |
| 3 or more Vehicles | 1,277 (30.4%) | 548 (29.8%) |
| Total | 4,197 (100.0%) | 1,841 (100.0%) |
Real Estate & Mortgages in Monroe
Real Estate and Mortgage Overview in Monroe
| Characteristic | Without Mortgage | With Mortgage |
| Housing Units | 778 | 3,419 |
| Median Property Value | $481,300 | $527,000 |
| Median Household Income | $93,889 | $1,078 |
| Monthly Housing Costs | $705 | $694 |
| Real Estate Taxes | $4,310 | $23 |
Property Value by Mortgage Status in Monroe
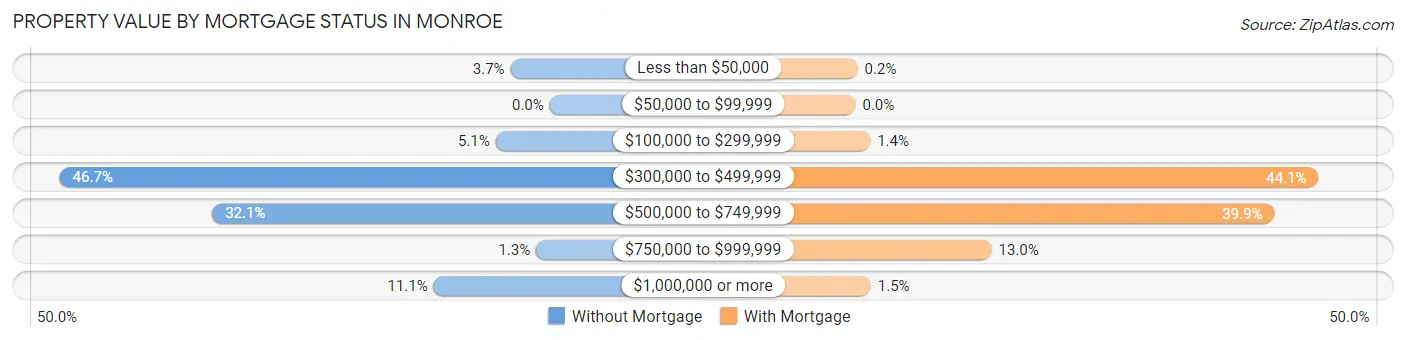
| Property Value | Without Mortgage | With Mortgage |
| Less than $50,000 | 29 (3.7%) | 7 (0.2%) |
| $50,000 to $99,999 | 0 (0.0%) | 0 (0.0%) |
| $100,000 to $299,999 | 40 (5.1%) | 48 (1.4%) |
| $300,000 to $499,999 | 363 (46.7%) | 1,507 (44.1%) |
| $500,000 to $749,999 | 250 (32.1%) | 1,364 (39.9%) |
| $750,000 to $999,999 | 10 (1.3%) | 443 (13.0%) |
| $1,000,000 or more | 86 (11.1%) | 50 (1.5%) |
| Total | 778 (100.0%) | 3,419 (100.0%) |
Household Income by Mortgage Status in Monroe
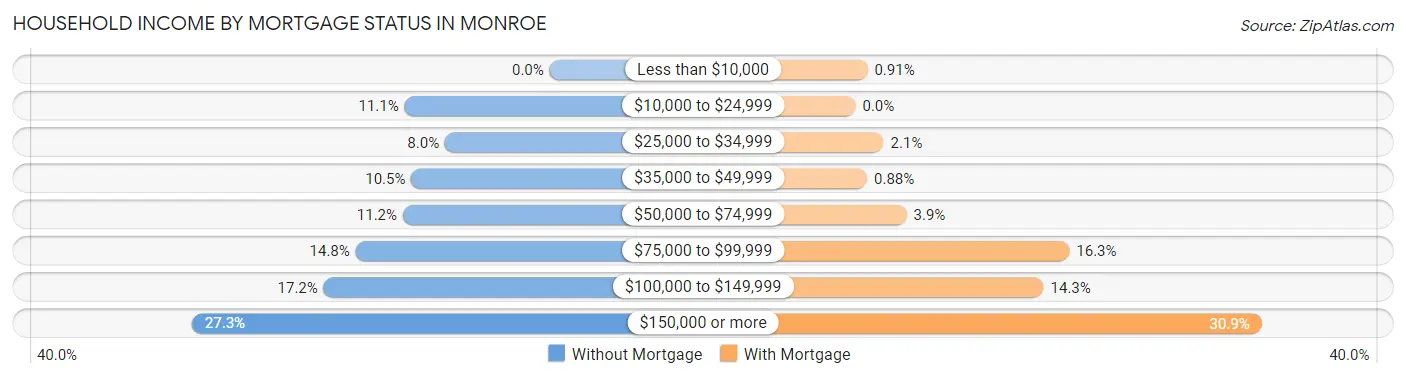
| Household Income | Without Mortgage | With Mortgage |
| Less than $10,000 | 0 (0.0%) | 31 (0.9%) |
| $10,000 to $24,999 | 86 (11.1%) | 0 (0.0%) |
| $25,000 to $34,999 | 62 (8.0%) | 73 (2.1%) |
| $35,000 to $49,999 | 82 (10.5%) | 30 (0.9%) |
| $50,000 to $74,999 | 87 (11.2%) | 133 (3.9%) |
| $75,000 to $99,999 | 115 (14.8%) | 557 (16.3%) |
| $100,000 to $149,999 | 134 (17.2%) | 490 (14.3%) |
| $150,000 or more | 212 (27.3%) | 1,058 (30.9%) |
| Total | 778 (100.0%) | 3,419 (100.0%) |
Property Value to Household Income Ratio in Monroe
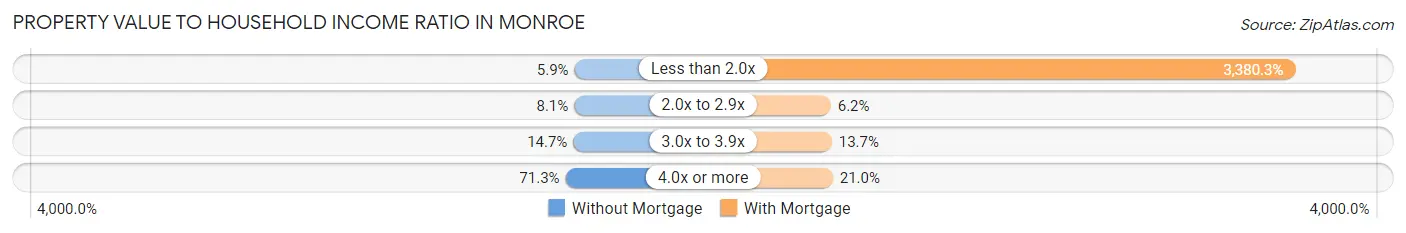
| Value-to-Income Ratio | Without Mortgage | With Mortgage |
| Less than 2.0x | 46 (5.9%) | 115,573 (3,380.3%) |
| 2.0x to 2.9x | 63 (8.1%) | 211 (6.2%) |
| 3.0x to 3.9x | 114 (14.6%) | 469 (13.7%) |
| 4.0x or more | 555 (71.3%) | 717 (21.0%) |
| Total | 778 (100.0%) | 3,419 (100.0%) |
Real Estate Taxes by Mortgage Status in Monroe
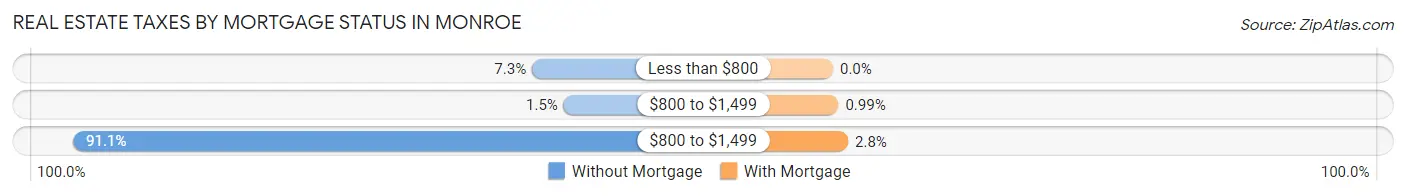
| Property Taxes | Without Mortgage | With Mortgage |
| Less than $800 | 57 (7.3%) | 0 (0.0%) |
| $800 to $1,499 | 12 (1.5%) | 34 (1.0%) |
| $800 to $1,499 | 709 (91.1%) | 94 (2.8%) |
| Total | 778 (100.0%) | 3,419 (100.0%) |
Health & Disability in Monroe
Health Insurance Coverage by Age in Monroe
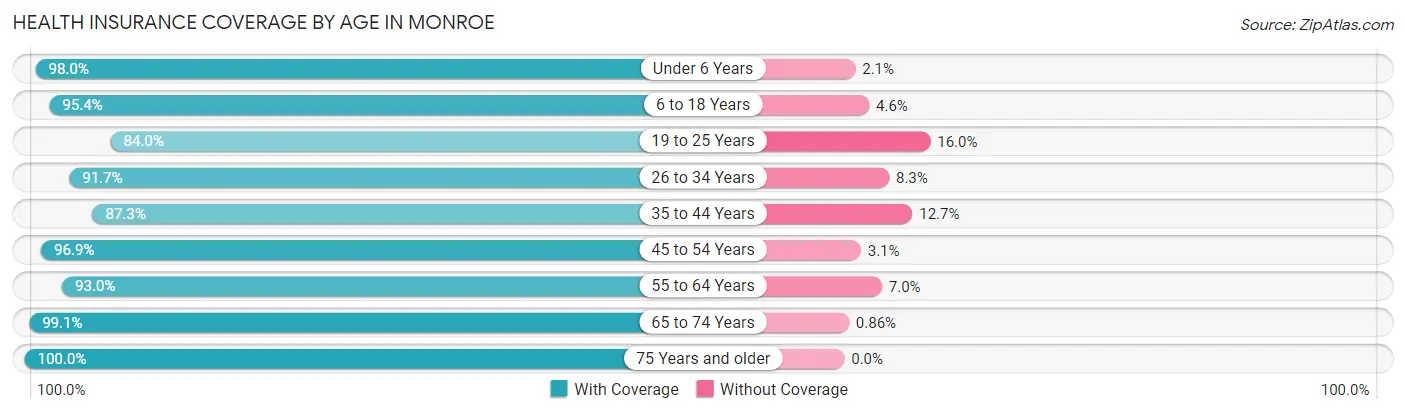
| Age Bracket | With Coverage | Without Coverage |
| Under 6 Years | 1,528 (98.0%) | 32 (2.1%) |
| 6 to 18 Years | 2,679 (95.4%) | 130 (4.6%) |
| 19 to 25 Years | 1,503 (84.0%) | 287 (16.0%) |
| 26 to 34 Years | 2,254 (91.7%) | 205 (8.3%) |
| 35 to 44 Years | 2,053 (87.3%) | 298 (12.7%) |
| 45 to 54 Years | 2,201 (96.9%) | 70 (3.1%) |
| 55 to 64 Years | 1,780 (93.0%) | 134 (7.0%) |
| 65 to 74 Years | 1,035 (99.1%) | 9 (0.9%) |
| 75 Years and older | 649 (100.0%) | 0 (0.0%) |
| Total | 15,682 (93.1%) | 1,165 (6.9%) |
Health Insurance Coverage by Citizenship Status in Monroe
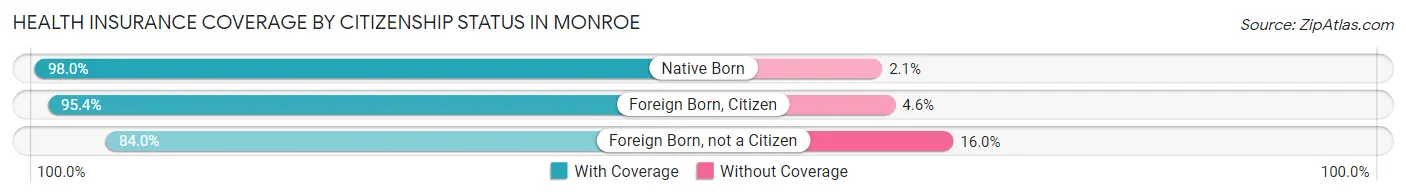
| Citizenship Status | With Coverage | Without Coverage |
| Native Born | 1,528 (98.0%) | 32 (2.1%) |
| Foreign Born, Citizen | 2,679 (95.4%) | 130 (4.6%) |
| Foreign Born, not a Citizen | 1,503 (84.0%) | 287 (16.0%) |
Health Insurance Coverage by Household Income in Monroe
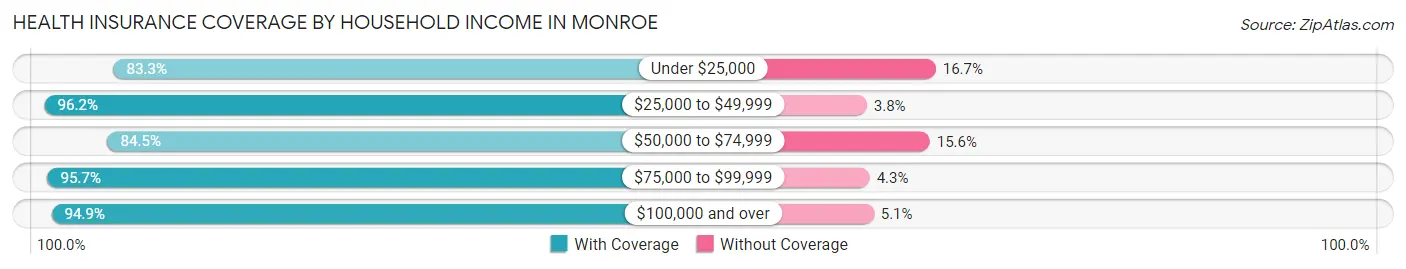
| Household Income | With Coverage | Without Coverage |
| Under $25,000 | 690 (83.3%) | 138 (16.7%) |
| $25,000 to $49,999 | 1,307 (96.2%) | 51 (3.8%) |
| $50,000 to $74,999 | 2,063 (84.5%) | 380 (15.5%) |
| $75,000 to $99,999 | 2,579 (95.7%) | 116 (4.3%) |
| $100,000 and over | 9,013 (94.9%) | 480 (5.1%) |
Public vs Private Health Insurance Coverage by Age in Monroe
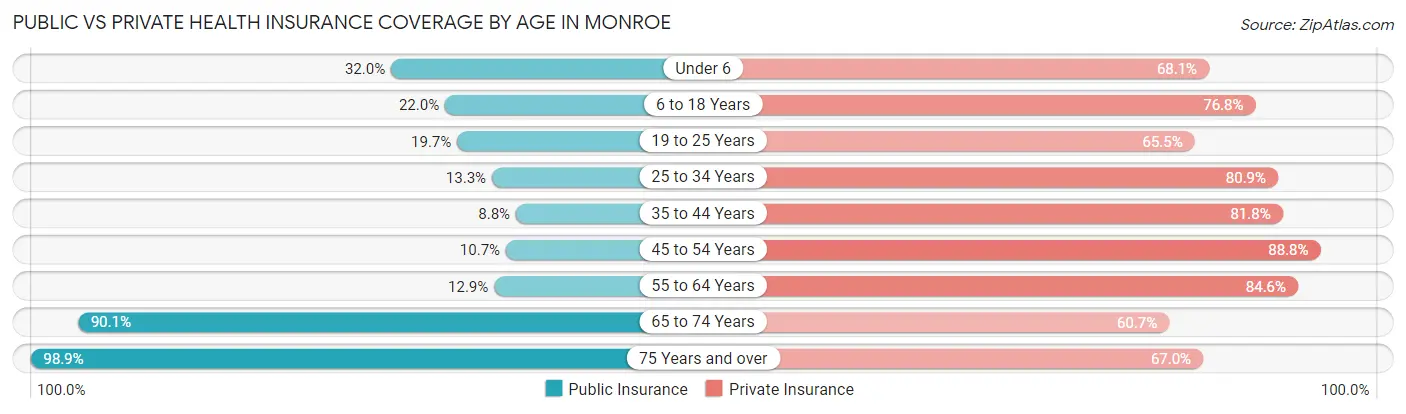
| Age Bracket | Public Insurance | Private Insurance |
| Under 6 | 499 (32.0%) | 1,063 (68.1%) |
| 6 to 18 Years | 617 (22.0%) | 2,156 (76.7%) |
| 19 to 25 Years | 353 (19.7%) | 1,172 (65.5%) |
| 25 to 34 Years | 326 (13.3%) | 1,990 (80.9%) |
| 35 to 44 Years | 207 (8.8%) | 1,923 (81.8%) |
| 45 to 54 Years | 242 (10.7%) | 2,017 (88.8%) |
| 55 to 64 Years | 246 (12.9%) | 1,620 (84.6%) |
| 65 to 74 Years | 941 (90.1%) | 634 (60.7%) |
| 75 Years and over | 642 (98.9%) | 435 (67.0%) |
| Total | 4,073 (24.2%) | 13,010 (77.2%) |
Disability Status by Sex by Age in Monroe
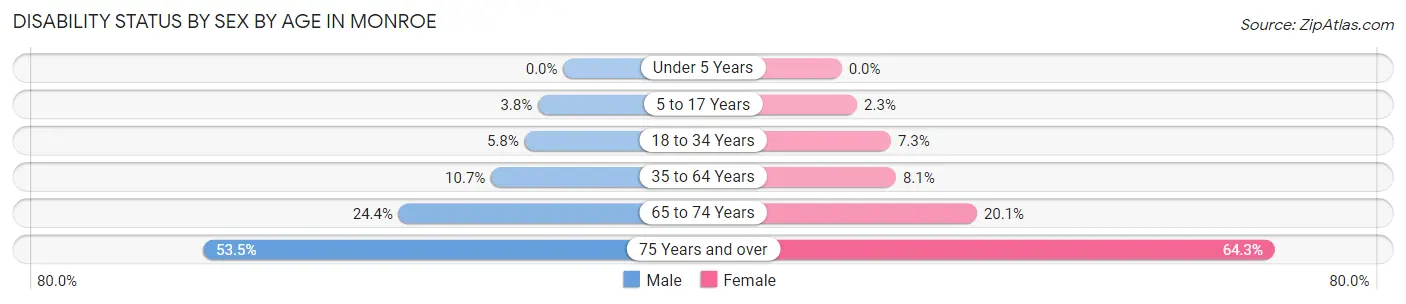
| Age Bracket | Male | Female |
| Under 5 Years | 0 (0.0%) | 0 (0.0%) |
| 5 to 17 Years | 51 (3.8%) | 33 (2.3%) |
| 18 to 34 Years | 134 (5.8%) | 149 (7.3%) |
| 35 to 64 Years | 349 (10.7%) | 264 (8.1%) |
| 65 to 74 Years | 109 (24.4%) | 120 (20.1%) |
| 75 Years and over | 130 (53.5%) | 261 (64.3%) |
Disability Class by Sex by Age in Monroe
Disability Class: Hearing Difficulty
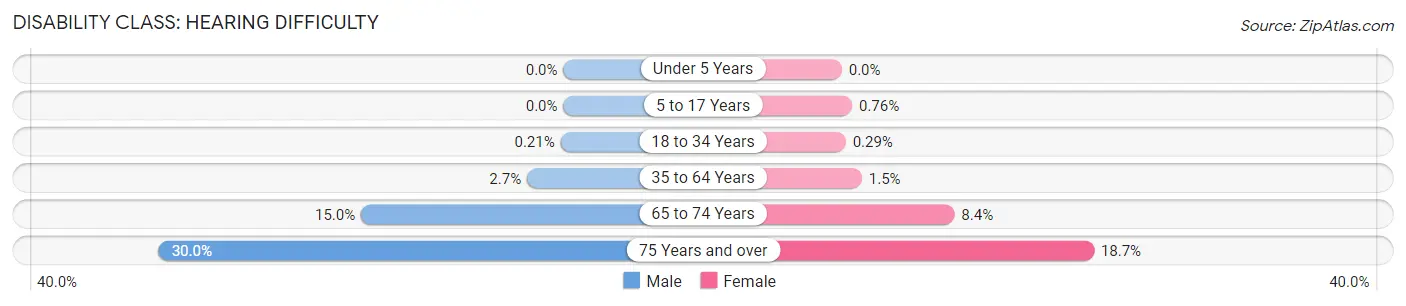
| Age Bracket | Male | Female |
| Under 5 Years | 0 (0.0%) | 0 (0.0%) |
| 5 to 17 Years | 0 (0.0%) | 11 (0.8%) |
| 18 to 34 Years | 5 (0.2%) | 6 (0.3%) |
| 35 to 64 Years | 88 (2.7%) | 49 (1.5%) |
| 65 to 74 Years | 67 (15.0%) | 50 (8.4%) |
| 75 Years and over | 73 (30.0%) | 76 (18.7%) |
Disability Class: Vision Difficulty
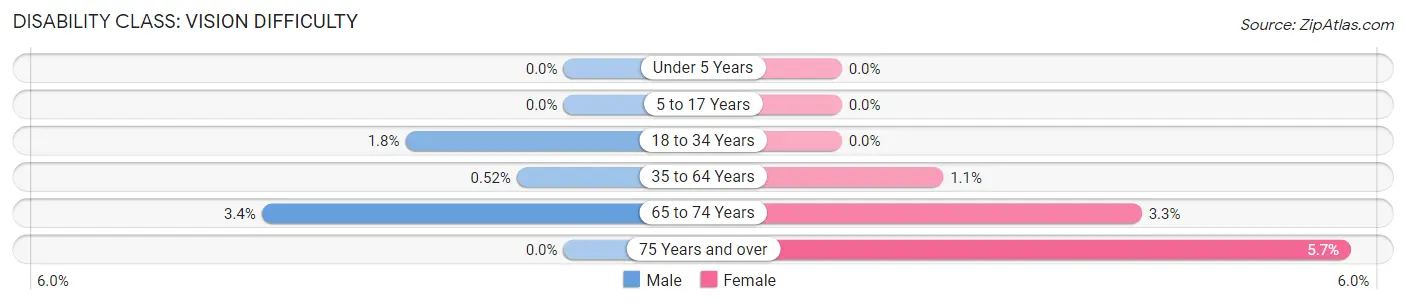
| Age Bracket | Male | Female |
| Under 5 Years | 0 (0.0%) | 0 (0.0%) |
| 5 to 17 Years | 0 (0.0%) | 0 (0.0%) |
| 18 to 34 Years | 41 (1.8%) | 0 (0.0%) |
| 35 to 64 Years | 17 (0.5%) | 37 (1.1%) |
| 65 to 74 Years | 15 (3.4%) | 20 (3.3%) |
| 75 Years and over | 0 (0.0%) | 23 (5.7%) |
Disability Class: Cognitive Difficulty
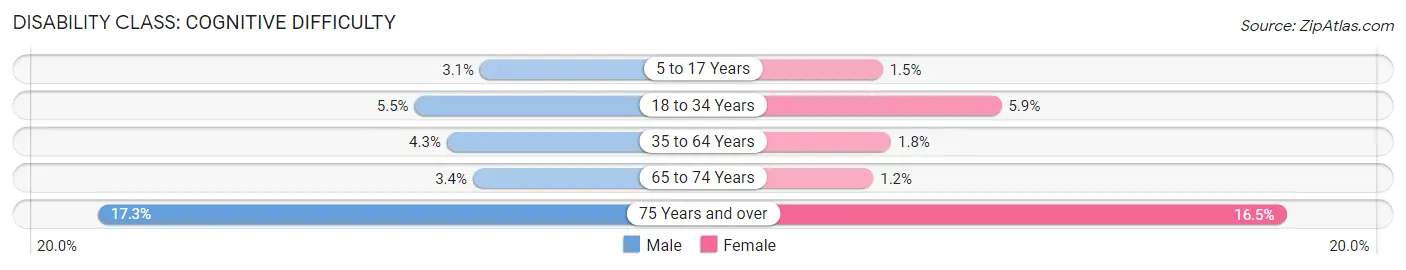
| Age Bracket | Male | Female |
| 5 to 17 Years | 42 (3.1%) | 22 (1.5%) |
| 18 to 34 Years | 129 (5.5%) | 121 (5.9%) |
| 35 to 64 Years | 141 (4.3%) | 60 (1.8%) |
| 65 to 74 Years | 15 (3.4%) | 7 (1.2%) |
| 75 Years and over | 42 (17.3%) | 67 (16.5%) |
Disability Class: Ambulatory Difficulty
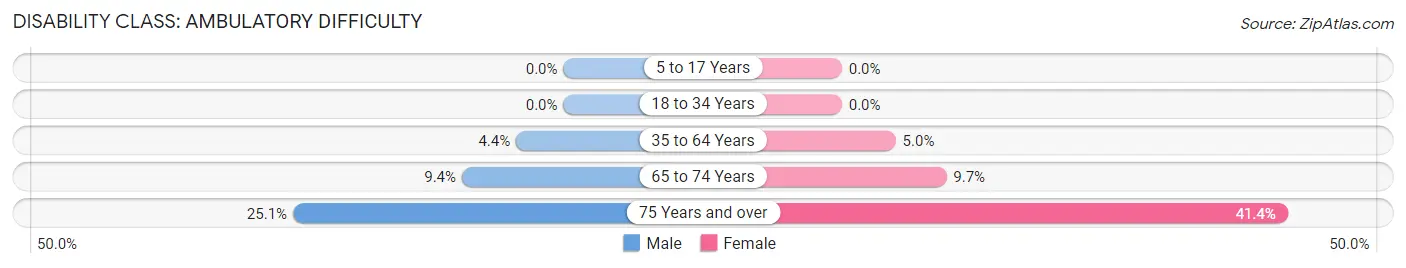
| Age Bracket | Male | Female |
| 5 to 17 Years | 0 (0.0%) | 0 (0.0%) |
| 18 to 34 Years | 0 (0.0%) | 0 (0.0%) |
| 35 to 64 Years | 143 (4.4%) | 164 (5.0%) |
| 65 to 74 Years | 42 (9.4%) | 58 (9.7%) |
| 75 Years and over | 61 (25.1%) | 168 (41.4%) |
Disability Class: Self-Care Difficulty
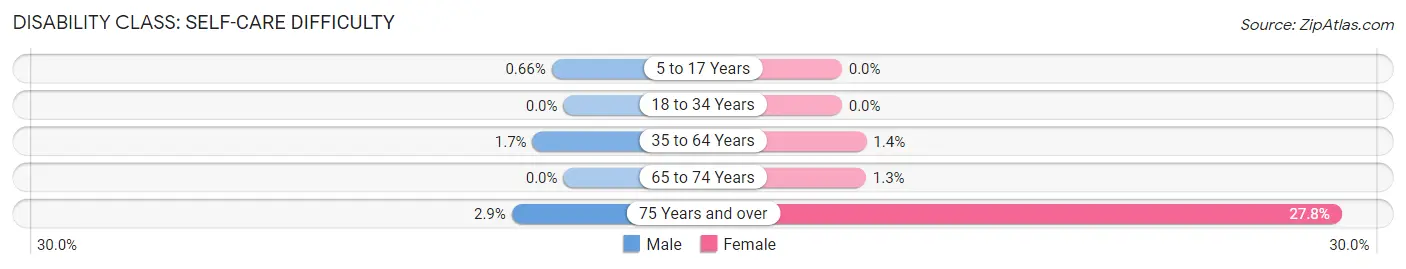
| Age Bracket | Male | Female |
| 5 to 17 Years | 9 (0.7%) | 0 (0.0%) |
| 18 to 34 Years | 0 (0.0%) | 0 (0.0%) |
| 35 to 64 Years | 56 (1.7%) | 45 (1.4%) |
| 65 to 74 Years | 0 (0.0%) | 8 (1.3%) |
| 75 Years and over | 7 (2.9%) | 113 (27.8%) |
Technology Access in Monroe
Computing Device Access in Monroe
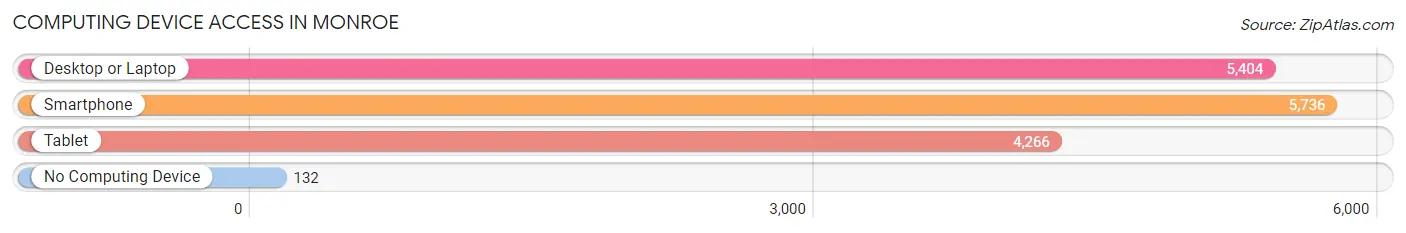
| Device Type | # Households | % Households |
| Desktop or Laptop | 5,404 | 89.5% |
| Smartphone | 5,736 | 95.0% |
| Tablet | 4,266 | 70.7% |
| No Computing Device | 132 | 2.2% |
| Total | 6,038 | 100.0% |
Internet Access in Monroe
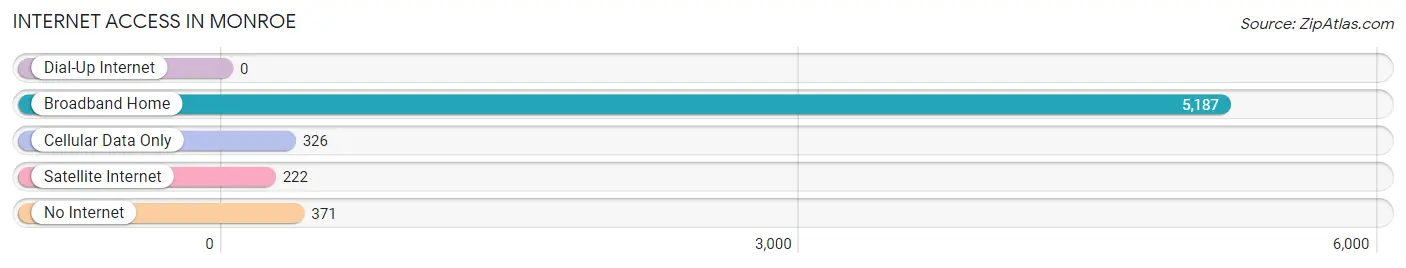
| Internet Type | # Households | % Households |
| Dial-Up Internet | 0 | 0.0% |
| Broadband Home | 5,187 | 85.9% |
| Cellular Data Only | 326 | 5.4% |
| Satellite Internet | 222 | 3.7% |
| No Internet | 371 | 6.1% |
| Total | 6,038 | 100.0% |
Monroe Summary
Monroe, Washington is a city located in Snohomish County, Washington, United States. The population was 17,304 at the 2010 census. The city is located in the Cascade foothills, about 25 miles northeast of Seattle.
History
Monroe was founded in 1864 by settler James Monroe, who named the town after himself. The town was originally a logging and farming community, and the first post office was established in 1871. In 1891, the Seattle, Lake Shore and Eastern Railway arrived in Monroe, connecting the town to Seattle and other cities in the region.
In the early 20th century, Monroe began to grow rapidly, and by the 1950s, it had become a major center for logging and farming. The city was incorporated in 1902, and the first mayor was elected in 1903.
Geography
Monroe is located in the Cascade foothills, about 25 miles northeast of Seattle. The city is situated on the Skykomish River, and is surrounded by the Cascade Mountains to the east and the Olympic Mountains to the west. The city has a total area of 8.3 square miles, of which 8.2 square miles is land and 0.1 square miles is water.
Economy
Monroe’s economy is largely based on agriculture and manufacturing. The city is home to several large agricultural companies, including the Monroe Fruit Company, which produces apples, pears, and other fruits. The city is also home to several manufacturing companies, including the Monroe Manufacturing Company, which produces furniture and other wood products.
The city is also home to several retail stores, restaurants, and other businesses. The city is served by the Monroe Municipal Airport, which provides air service to Seattle and other cities in the region.
Demographics
As of the 2010 census, there were 17,304 people, 6,845 households, and 4,717 families residing in the city. The population density was 2,093.3 people per square mile. The racial makeup of the city was 81.2% White, 1.2% African American, 0.9% Native American, 1.7% Asian, 0.2% Pacific Islander, 11.3% from other races, and 3.5% from two or more races. Hispanic or Latino of any race were 20.2% of the population.
The median income for a household in the city was $50,945, and the median income for a family was $60,945. The per capita income for the city was $24,945. About 8.3% of families and 11.2% of the population were below the poverty line, including 16.2% of those under age 18 and 6.2% of those age 65 or over.
Monroe is served by the Monroe School District, which includes five elementary schools, two middle schools, and one high school. The city is also home to several private schools, including the Monroe Christian School and the Monroe Academy of Arts and Sciences.
Common Questions
What is Per Capita Income in Monroe?
Per Capita income in Monroe is $36,580.
What is the Median Family Income in Monroe?
Median Family Income in Monroe is $106,181.
What is the Median Household income in Monroe?
Median Household Income in Monroe is $99,713.
What is Income or Wage Gap in Monroe?
Income or Wage Gap in Monroe is 24.6%.
Women in Monroe earn 75.4 cents for every dollar earned by a man.
What is Inequality or Gini Index in Monroe?
Inequality or Gini Index in Monroe is 0.36.
What is the Total Population of Monroe?
Total Population of Monroe is 19,632.
What is the Total Male Population of Monroe?
Total Male Population of Monroe is 11,098.
What is the Total Female Population of Monroe?
Total Female Population of Monroe is 8,534.
What is the Ratio of Males per 100 Females in Monroe?
There are 130.04 Males per 100 Females in Monroe.
What is the Ratio of Females per 100 Males in Monroe?
There are 76.90 Females per 100 Males in Monroe.
What is the Median Population Age in Monroe?
Median Population Age in Monroe is 35.8 Years.
What is the Average Family Size in Monroe
Average Family Size in Monroe is 3.2 People.
What is the Average Household Size in Monroe
Average Household Size in Monroe is 2.8 People.
How Large is the Labor Force in Monroe?
There are 9,520 People in the Labor Forcein in Monroe.
What is the Percentage of People in the Labor Force in Monroe?
59.8% of People are in the Labor Force in Monroe.
What is the Unemployment Rate in Monroe?
Unemployment Rate in Monroe is 4.3%.