East Port Orchard, WA Map & Demographics
East Port Orchard Map
East Port Orchard Overview
$41,719
PER CAPITA INCOME
$100,104
AVG FAMILY INCOME
$71,775
AVG HOUSEHOLD INCOME
24.1%
WAGE / INCOME GAP [ % ]
75.9¢/ $1
WAGE / INCOME GAP [ $ ]
0.52
INEQUALITY / GINI INDEX
5,501
TOTAL POPULATION
2,890
MALE POPULATION
2,611
FEMALE POPULATION
110.69
MALES / 100 FEMALES
90.35
FEMALES / 100 MALES
36.4
MEDIAN AGE
3.1
AVG FAMILY SIZE
2.7
AVG HOUSEHOLD SIZE
3,008
LABOR FORCE [ PEOPLE ]
67.3%
PERCENT IN LABOR FORCE
6.3%
UNEMPLOYMENT RATE
Income in East Port Orchard
Income Overview in East Port Orchard
Per Capita Income in East Port Orchard is $41,719, while median incomes of families and households are $100,104 and $71,775 respectively.
| Characteristic | Number | Measure |
| Per Capita Income | 5,501 | $41,719 |
| Median Family Income | 1,408 | $100,104 |
| Mean Family Income | 1,408 | $132,401 |
| Median Household Income | 2,011 | $71,775 |
| Mean Household Income | 2,011 | $110,484 |
| Income Deficit | 1,408 | $0 |
| Wage / Income Gap (%) | 5,501 | 24.15% |
| Wage / Income Gap ($) | 5,501 | 75.85¢ per $1 |
| Gini / Inequality Index | 5,501 | 0.52 |
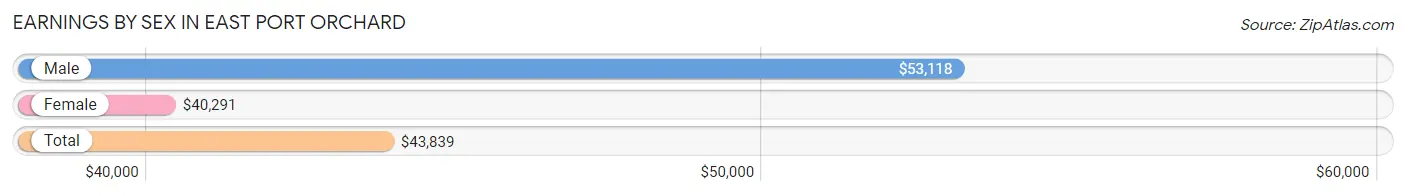
Earnings by Sex in East Port Orchard
Average Earnings in East Port Orchard are $43,839, $53,118 for men and $40,291 for women, a difference of 24.1%.
| Sex | Number | Average Earnings |
| Male | 1,630 (53.5%) | $53,118 |
| Female | 1,414 (46.5%) | $40,291 |
| Total | 3,044 (100.0%) | $43,839 |
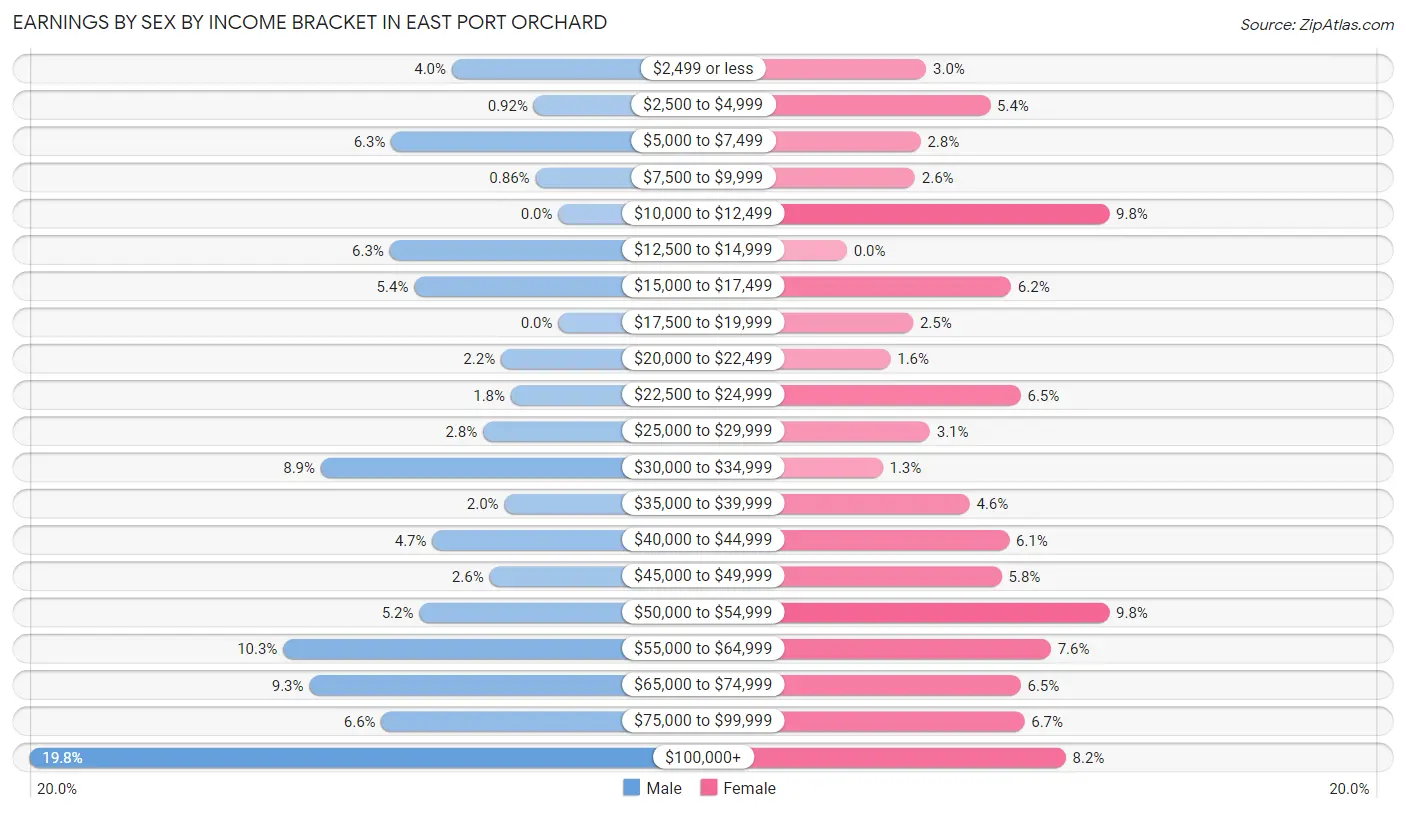
Earnings by Sex by Income Bracket in East Port Orchard
The most common earnings brackets in East Port Orchard are $100,000+ for men (323 | 19.8%) and $10,000 to $12,499 for women (139 | 9.8%).
| Income | Male | Female |
| $2,499 or less | 65 (4.0%) | 42 (3.0%) |
| $2,500 to $4,999 | 15 (0.9%) | 76 (5.4%) |
| $5,000 to $7,499 | 102 (6.3%) | 39 (2.8%) |
| $7,500 to $9,999 | 14 (0.9%) | 36 (2.5%) |
| $10,000 to $12,499 | 0 (0.0%) | 139 (9.8%) |
| $12,500 to $14,999 | 103 (6.3%) | 0 (0.0%) |
| $15,000 to $17,499 | 88 (5.4%) | 87 (6.1%) |
| $17,500 to $19,999 | 0 (0.0%) | 35 (2.5%) |
| $20,000 to $22,499 | 35 (2.1%) | 23 (1.6%) |
| $22,500 to $24,999 | 29 (1.8%) | 92 (6.5%) |
| $25,000 to $29,999 | 46 (2.8%) | 44 (3.1%) |
| $30,000 to $34,999 | 145 (8.9%) | 19 (1.3%) |
| $35,000 to $39,999 | 33 (2.0%) | 65 (4.6%) |
| $40,000 to $44,999 | 77 (4.7%) | 86 (6.1%) |
| $45,000 to $49,999 | 42 (2.6%) | 82 (5.8%) |
| $50,000 to $54,999 | 85 (5.2%) | 139 (9.8%) |
| $55,000 to $64,999 | 168 (10.3%) | 108 (7.6%) |
| $65,000 to $74,999 | 152 (9.3%) | 92 (6.5%) |
| $75,000 to $99,999 | 108 (6.6%) | 94 (6.7%) |
| $100,000+ | 323 (19.8%) | 116 (8.2%) |
| Total | 1,630 (100.0%) | 1,414 (100.0%) |
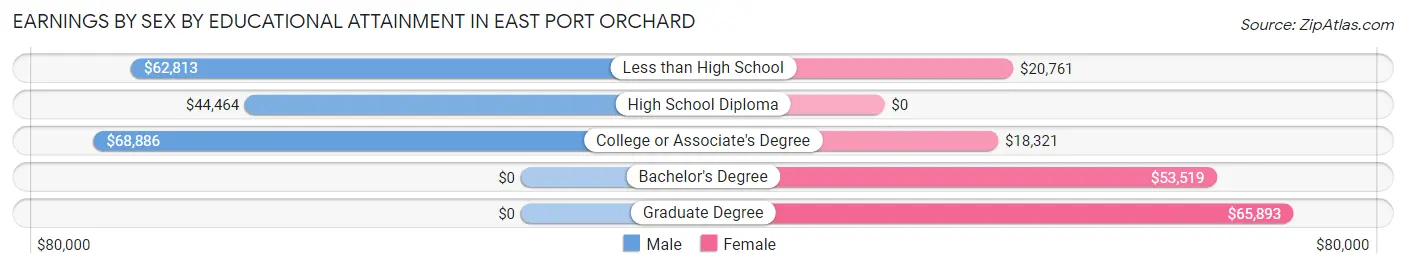
Earnings by Sex by Educational Attainment in East Port Orchard
Average earnings in East Port Orchard are $60,918 for men and $40,392 for women, a difference of 33.7%. Men with an educational attainment of college or associate's degree enjoy the highest average annual earnings of $68,886, while those with high school diploma education earn the least with $44,464. Women with an educational attainment of graduate degree earn the most with the average annual earnings of $65,893, while those with college or associate's degree education have the smallest earnings of $18,321.
| Educational Attainment | Male Income | Female Income |
| Less than High School | $62,813 | $20,761 |
| High School Diploma | $44,464 | $0 |
| College or Associate's Degree | $68,886 | $18,321 |
| Bachelor's Degree | - | - |
| Graduate Degree | - | - |
| Total | $60,918 | $40,392 |
Family Income in East Port Orchard
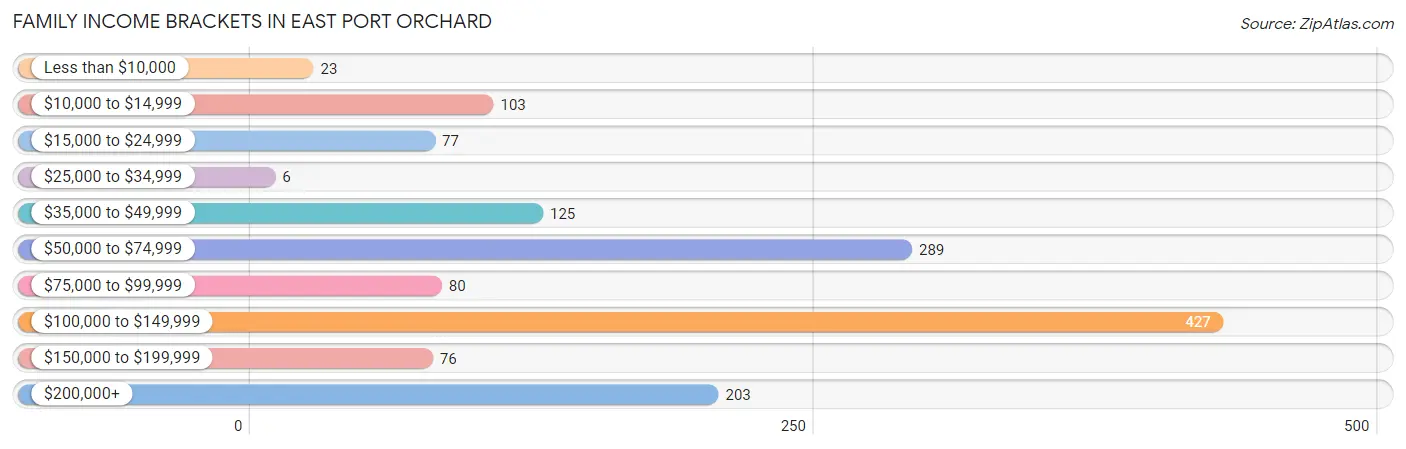
Family Income Brackets in East Port Orchard
According to the East Port Orchard family income data, there are 427 families falling into the $100,000 to $149,999 income range, which is the most common income bracket and makes up 30.3% of all families. Conversely, the $25,000 to $34,999 income bracket is the least frequent group with only 6 families (0.4%) belonging to this category.
| Income Bracket | # Families | % Families |
| Less than $10,000 | 23 | 1.6% |
| $10,000 to $14,999 | 103 | 7.3% |
| $15,000 to $24,999 | 77 | 5.5% |
| $25,000 to $34,999 | 6 | 0.4% |
| $35,000 to $49,999 | 125 | 8.9% |
| $50,000 to $74,999 | 289 | 20.5% |
| $75,000 to $99,999 | 80 | 5.7% |
| $100,000 to $149,999 | 427 | 30.3% |
| $150,000 to $199,999 | 76 | 5.4% |
| $200,000+ | 203 | 14.4% |
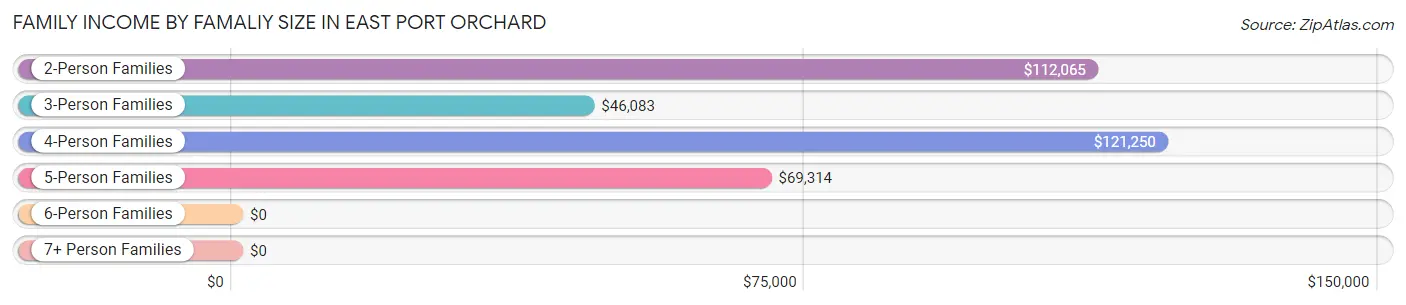
Family Income by Famaliy Size in East Port Orchard
4-person families (214 | 15.2%) account for the highest median family income in East Port Orchard with $121,250 per family, while 2-person families (618 | 43.9%) have the highest median income of $56,032 per family member.
| Income Bracket | # Families | Median Income |
| 2-Person Families | 618 (43.9%) | $112,065 |
| 3-Person Families | 344 (24.4%) | $46,083 |
| 4-Person Families | 214 (15.2%) | $121,250 |
| 5-Person Families | 160 (11.4%) | $69,314 |
| 6-Person Families | 52 (3.7%) | $0 |
| 7+ Person Families | 20 (1.4%) | $0 |
| Total | 1,408 (100.0%) | $100,104 |
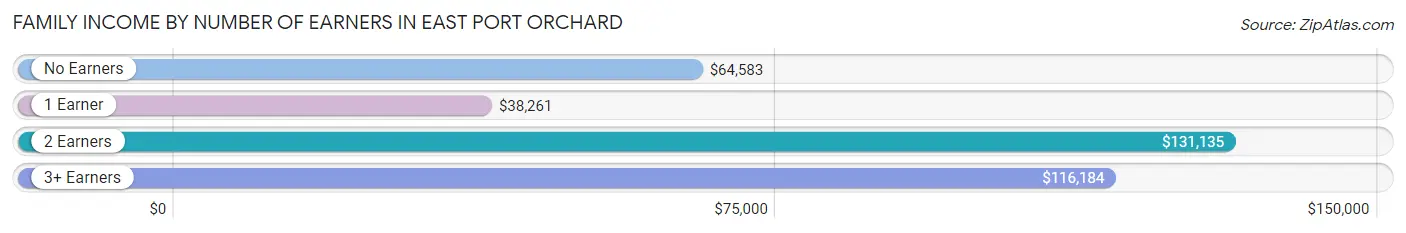
Family Income by Number of Earners in East Port Orchard
The median family income in East Port Orchard is $100,104, with families comprising 2 earners (717) having the highest median family income of $131,135, while families with 1 earner (360) have the lowest median family income of $38,261, accounting for 50.9% and 25.6% of families, respectively.
| Number of Earners | # Families | Median Income |
| No Earners | 191 (13.6%) | $64,583 |
| 1 Earner | 360 (25.6%) | $38,261 |
| 2 Earners | 717 (50.9%) | $131,135 |
| 3+ Earners | 140 (9.9%) | $116,184 |
| Total | 1,408 (100.0%) | $100,104 |
Household Income in East Port Orchard
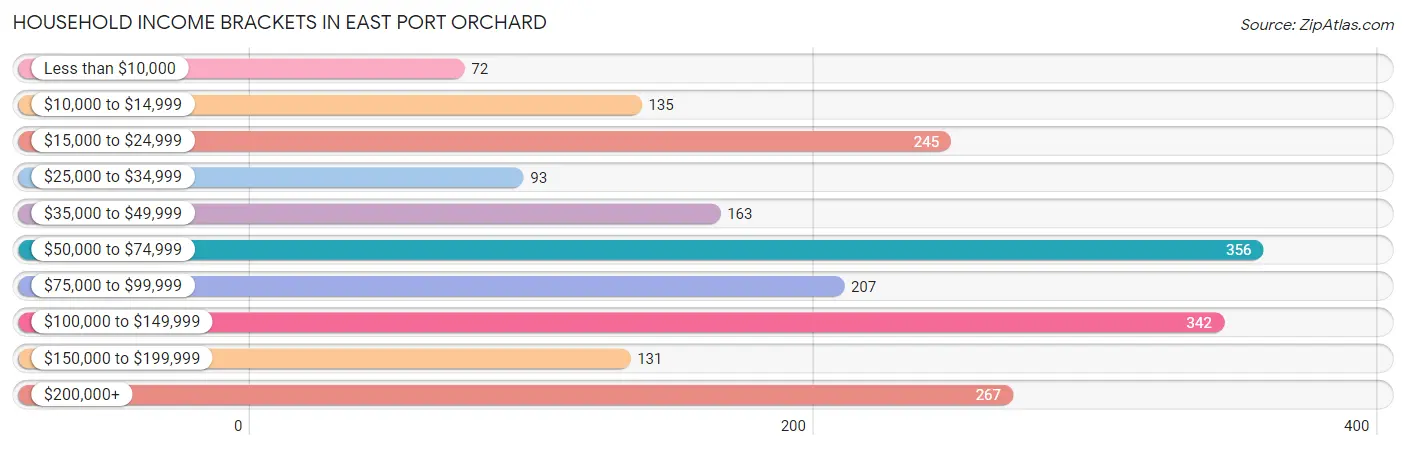
Household Income Brackets in East Port Orchard
With 356 households falling in the category, the $50,000 to $74,999 income range is the most frequent in East Port Orchard, accounting for 17.7% of all households. In contrast, only 72 households (3.6%) fall into the less than $10,000 income bracket, making it the least populous group.
| Income Bracket | # Households | % Households |
| Less than $10,000 | 72 | 3.6% |
| $10,000 to $14,999 | 135 | 6.7% |
| $15,000 to $24,999 | 245 | 12.2% |
| $25,000 to $34,999 | 93 | 4.6% |
| $35,000 to $49,999 | 163 | 8.1% |
| $50,000 to $74,999 | 356 | 17.7% |
| $75,000 to $99,999 | 207 | 10.3% |
| $100,000 to $149,999 | 342 | 17.0% |
| $150,000 to $199,999 | 131 | 6.5% |
| $200,000+ | 267 | 13.3% |
Household Income by Householder Age in East Port Orchard
The median household income in East Port Orchard is $71,775, with the highest median household income of $110,408 found in the 15 to 24 years age bracket for the primary householder. A total of 107 households (5.3%) fall into this category. Meanwhile, the 65+ years age bracket for the primary householder has the lowest median household income of $46,125, with 471 households (23.4%) in this group.
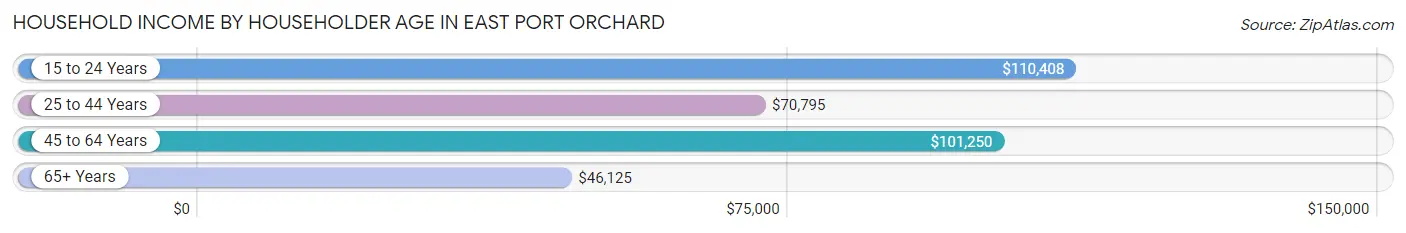
| Income Bracket | # Households | Median Income |
| 15 to 24 Years | 107 (5.3%) | $110,408 |
| 25 to 44 Years | 849 (42.2%) | $70,795 |
| 45 to 64 Years | 584 (29.0%) | $101,250 |
| 65+ Years | 471 (23.4%) | $46,125 |
| Total | 2,011 (100.0%) | $71,775 |
Poverty in East Port Orchard
Income Below Poverty by Sex and Age in East Port Orchard
With 9.2% poverty level for males and 13.9% for females among the residents of East Port Orchard, 45 to 54 year old males and under 5 year old females are the most vulnerable to poverty, with 41 males (14.2%) and 55 females (39.3%) in their respective age groups living below the poverty level.
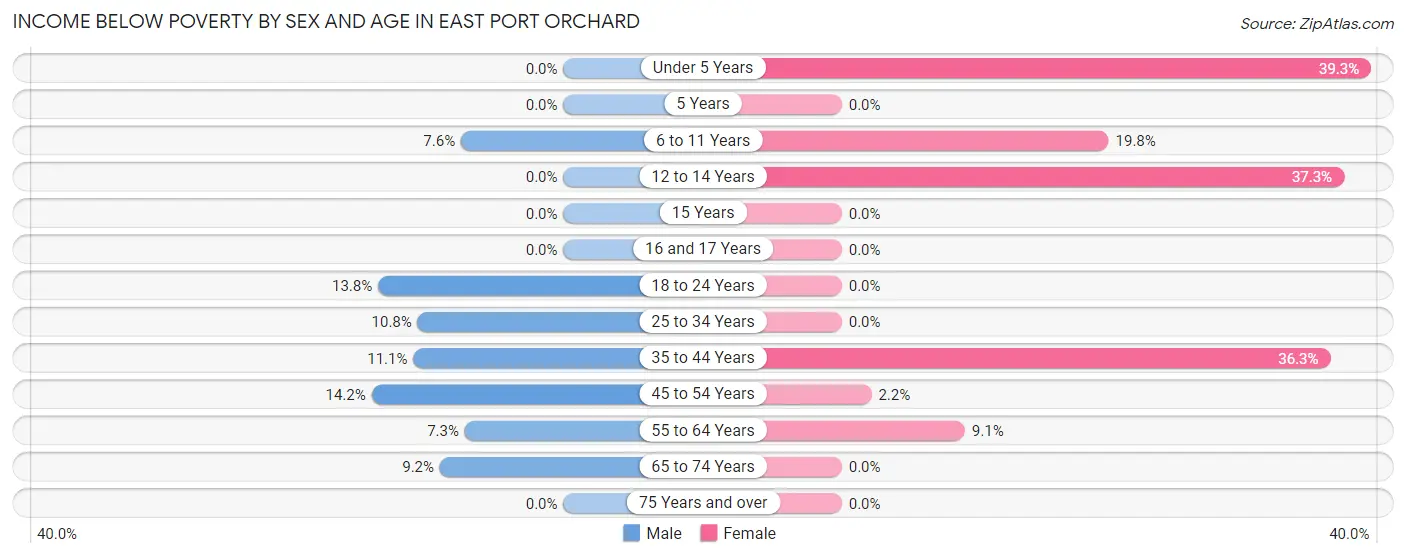
| Age Bracket | Male | Female |
| Under 5 Years | 0 (0.0%) | 55 (39.3%) |
| 5 Years | 0 (0.0%) | 0 (0.0%) |
| 6 to 11 Years | 19 (7.6%) | 21 (19.8%) |
| 12 to 14 Years | 0 (0.0%) | 63 (37.3%) |
| 15 Years | 0 (0.0%) | 0 (0.0%) |
| 16 and 17 Years | 0 (0.0%) | 0 (0.0%) |
| 18 to 24 Years | 67 (13.8%) | 0 (0.0%) |
| 25 to 34 Years | 37 (10.8%) | 0 (0.0%) |
| 35 to 44 Years | 47 (11.1%) | 181 (36.3%) |
| 45 to 54 Years | 41 (14.2%) | 8 (2.2%) |
| 55 to 64 Years | 26 (7.3%) | 31 (9.1%) |
| 65 to 74 Years | 30 (9.2%) | 0 (0.0%) |
| 75 Years and over | 0 (0.0%) | 0 (0.0%) |
| Total | 267 (9.2%) | 359 (13.9%) |
Income Above Poverty by Sex and Age in East Port Orchard
According to the poverty statistics in East Port Orchard, males aged under 5 years and females aged 15 years are the age groups that are most secure financially, with 100.0% of males and 100.0% of females in these age groups living above the poverty line.
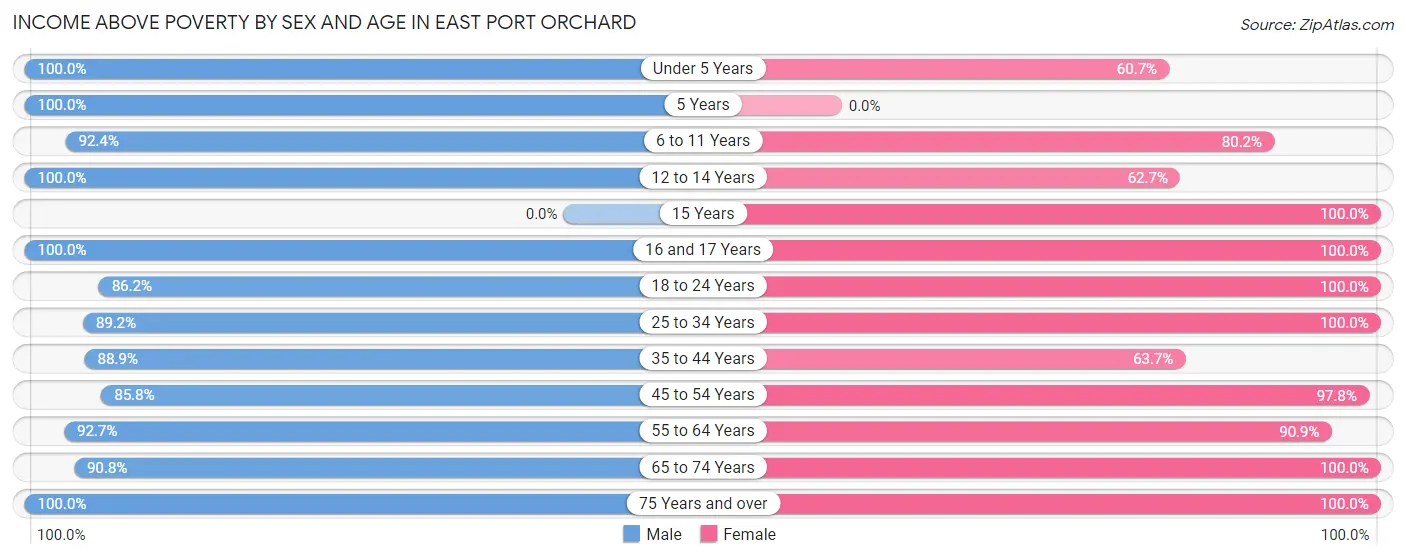
| Age Bracket | Male | Female |
| Under 5 Years | 135 (100.0%) | 85 (60.7%) |
| 5 Years | 7 (100.0%) | 0 (0.0%) |
| 6 to 11 Years | 231 (92.4%) | 85 (80.2%) |
| 12 to 14 Years | 170 (100.0%) | 106 (62.7%) |
| 15 Years | 0 (0.0%) | 24 (100.0%) |
| 16 and 17 Years | 63 (100.0%) | 120 (100.0%) |
| 18 to 24 Years | 420 (86.2%) | 151 (100.0%) |
| 25 to 34 Years | 305 (89.2%) | 350 (100.0%) |
| 35 to 44 Years | 375 (88.9%) | 318 (63.7%) |
| 45 to 54 Years | 247 (85.8%) | 356 (97.8%) |
| 55 to 64 Years | 329 (92.7%) | 308 (90.9%) |
| 65 to 74 Years | 297 (90.8%) | 191 (100.0%) |
| 75 Years and over | 44 (100.0%) | 127 (100.0%) |
| Total | 2,623 (90.8%) | 2,221 (86.1%) |
Income Below Poverty Among Married-Couple Families in East Port Orchard
The poverty statistics for married-couple families in East Port Orchard show that 2.2% or 23 of the total 1,048 families live below the poverty line. Families with no children have the highest poverty rate of 3.2%, comprising of 23 families. On the other hand, families with 1 or 2 children have the lowest poverty rate of 0.0%, which includes 0 families.
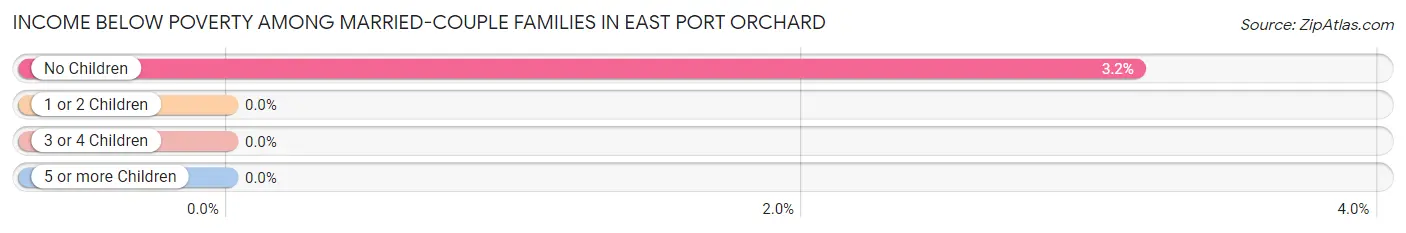
| Children | Above Poverty | Below Poverty |
| No Children | 706 (96.8%) | 23 (3.2%) |
| 1 or 2 Children | 227 (100.0%) | 0 (0.0%) |
| 3 or 4 Children | 72 (100.0%) | 0 (0.0%) |
| 5 or more Children | 20 (100.0%) | 0 (0.0%) |
| Total | 1,025 (97.8%) | 23 (2.2%) |
Income Below Poverty Among Single-Parent Households in East Port Orchard
According to the poverty data in East Port Orchard, 9.9% or 7 single-father households and 44.3% or 128 single-mother households are living below the poverty line. Among single-father households, those with no children have the highest poverty rate, with 7 households (100.0%) experiencing poverty. Likewise, among single-mother households, those with 3 or 4 children have the highest poverty rate, with 24 households (100.0%) falling below the poverty line.
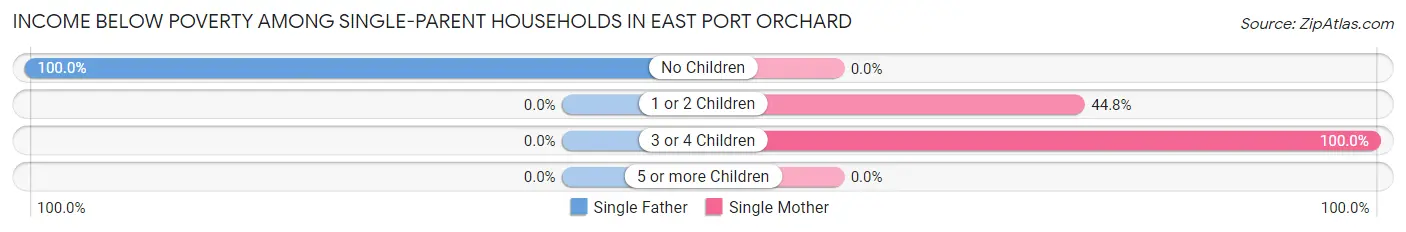
| Children | Single Father | Single Mother |
| No Children | 7 (100.0%) | 0 (0.0%) |
| 1 or 2 Children | 0 (0.0%) | 104 (44.8%) |
| 3 or 4 Children | 0 (0.0%) | 24 (100.0%) |
| 5 or more Children | 0 (0.0%) | 0 (0.0%) |
| Total | 7 (9.9%) | 128 (44.3%) |
Income Below Poverty Among Married-Couple vs Single-Parent Households in East Port Orchard
The poverty data for East Port Orchard shows that 23 of the married-couple family households (2.2%) and 135 of the single-parent households (37.5%) are living below the poverty level. Within the married-couple family households, those with no children have the highest poverty rate, with 23 households (3.2%) falling below the poverty line. Among the single-parent households, those with 3 or 4 children have the highest poverty rate, with 24 household (46.2%) living below poverty.
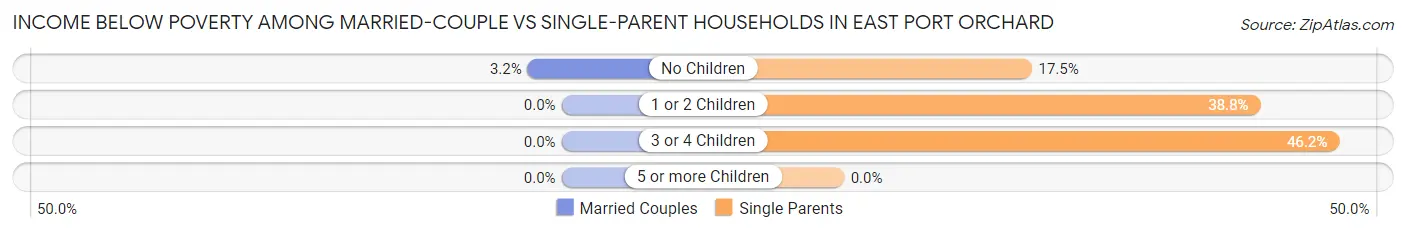
| Children | Married-Couple Families | Single-Parent Households |
| No Children | 23 (3.2%) | 7 (17.5%) |
| 1 or 2 Children | 0 (0.0%) | 104 (38.8%) |
| 3 or 4 Children | 0 (0.0%) | 24 (46.2%) |
| 5 or more Children | 0 (0.0%) | 0 (0.0%) |
| Total | 23 (2.2%) | 135 (37.5%) |
Race in East Port Orchard
The most populous races in East Port Orchard are White / Caucasian (4,049 | 73.6%), Two or more Races (705 | 12.8%), and Hispanic or Latino (678 | 12.3%).
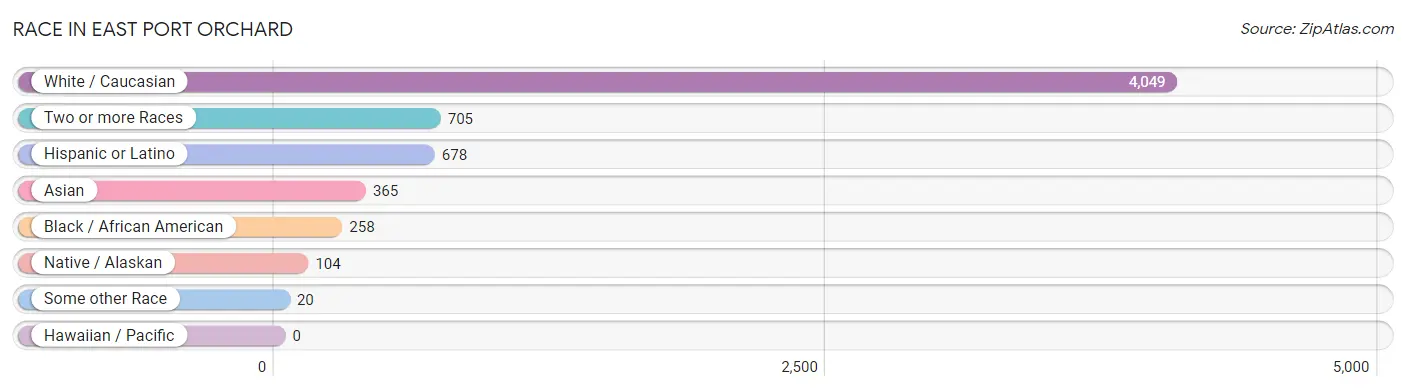
| Race | # Population | % Population |
| Asian | 365 | 6.6% |
| Black / African American | 258 | 4.7% |
| Hawaiian / Pacific | 0 | 0.0% |
| Hispanic or Latino | 678 | 12.3% |
| Native / Alaskan | 104 | 1.9% |
| White / Caucasian | 4,049 | 73.6% |
| Two or more Races | 705 | 12.8% |
| Some other Race | 20 | 0.4% |
| Total | 5,501 | 100.0% |
Ancestry in East Port Orchard
The most populous ancestries reported in East Port Orchard are German (992 | 18.0%), European (738 | 13.4%), Irish (305 | 5.5%), Bhutanese (282 | 5.1%), and Puerto Rican (280 | 5.1%), together accounting for 47.2% of all East Port Orchard residents.
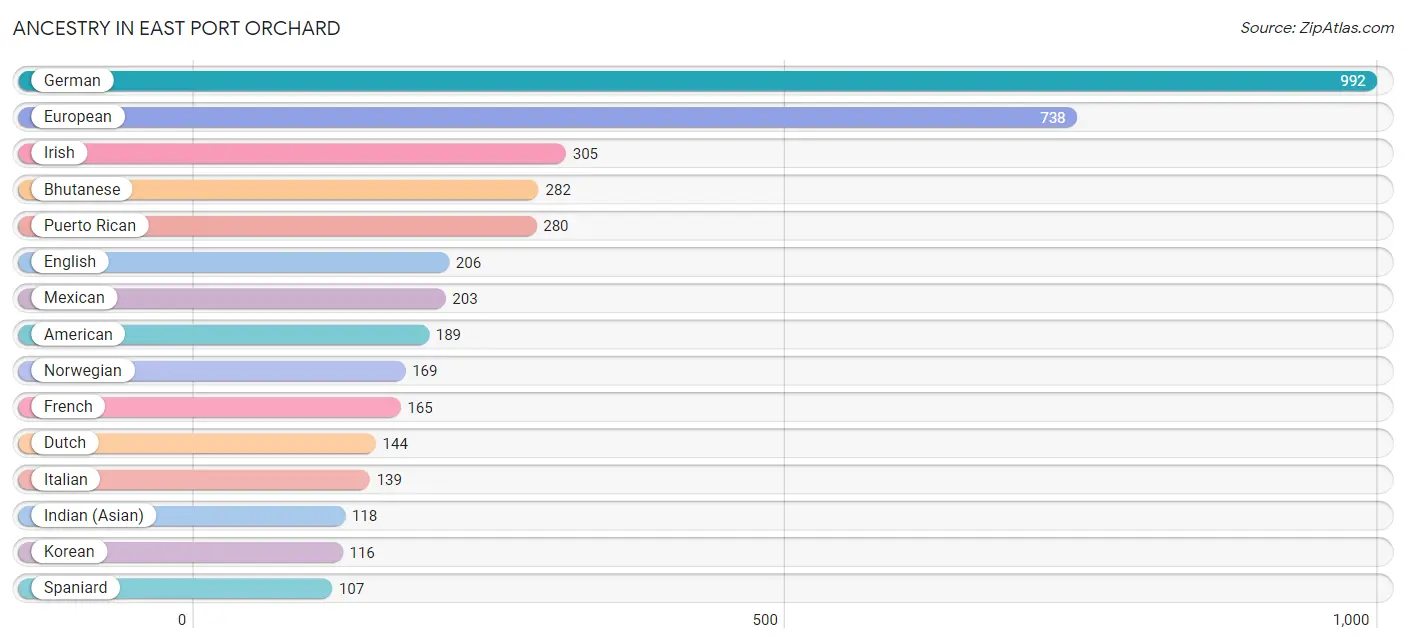
| Ancestry | # Population | % Population |
| Alaskan Athabascan | 15 | 0.3% |
| American | 189 | 3.4% |
| Bhutanese | 282 | 5.1% |
| Bolivian | 13 | 0.2% |
| British | 34 | 0.6% |
| Burmese | 23 | 0.4% |
| Central American | 75 | 1.4% |
| Cherokee | 47 | 0.9% |
| Chippewa | 69 | 1.3% |
| Choctaw | 7 | 0.1% |
| Czechoslovakian | 28 | 0.5% |
| Dutch | 144 | 2.6% |
| English | 206 | 3.7% |
| European | 738 | 13.4% |
| French | 165 | 3.0% |
| French Canadian | 65 | 1.2% |
| German | 992 | 18.0% |
| Indian (Asian) | 118 | 2.1% |
| Irish | 305 | 5.5% |
| Italian | 139 | 2.5% |
| Korean | 116 | 2.1% |
| Laotian | 70 | 1.3% |
| Lithuanian | 20 | 0.4% |
| Mexican | 203 | 3.7% |
| Native Hawaiian | 6 | 0.1% |
| Nigerian | 5 | 0.1% |
| Norwegian | 169 | 3.1% |
| Polish | 32 | 0.6% |
| Portuguese | 53 | 1.0% |
| Puerto Rican | 280 | 5.1% |
| Russian | 27 | 0.5% |
| Salvadoran | 75 | 1.4% |
| Scandinavian | 17 | 0.3% |
| Scotch-Irish | 17 | 0.3% |
| Scottish | 15 | 0.3% |
| Slovene | 14 | 0.3% |
| South American | 13 | 0.2% |
| Spaniard | 107 | 1.9% |
| Subsaharan African | 5 | 0.1% |
| Swedish | 30 | 0.5% |
| Ukrainian | 27 | 0.5% |
| Welsh | 47 | 0.9% | View All 42 Rows |
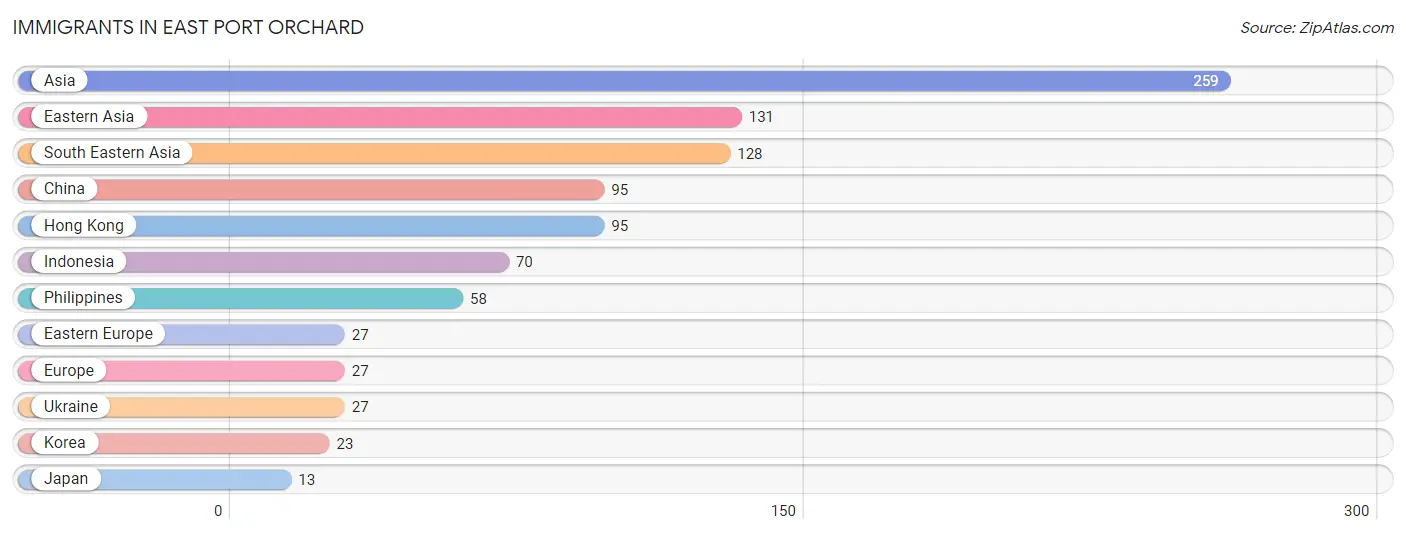
Immigrants in East Port Orchard
The most numerous immigrant groups reported in East Port Orchard came from Asia (259 | 4.7%), Eastern Asia (131 | 2.4%), South Eastern Asia (128 | 2.3%), China (95 | 1.7%), and Hong Kong (95 | 1.7%), together accounting for 12.9% of all East Port Orchard residents.
| Immigration Origin | # Population | % Population |
| Asia | 259 | 4.7% |
| China | 95 | 1.7% |
| Eastern Asia | 131 | 2.4% |
| Eastern Europe | 27 | 0.5% |
| Europe | 27 | 0.5% |
| Hong Kong | 95 | 1.7% |
| Indonesia | 70 | 1.3% |
| Japan | 13 | 0.2% |
| Korea | 23 | 0.4% |
| Philippines | 58 | 1.1% |
| South Eastern Asia | 128 | 2.3% |
| Ukraine | 27 | 0.5% | View All 12 Rows |
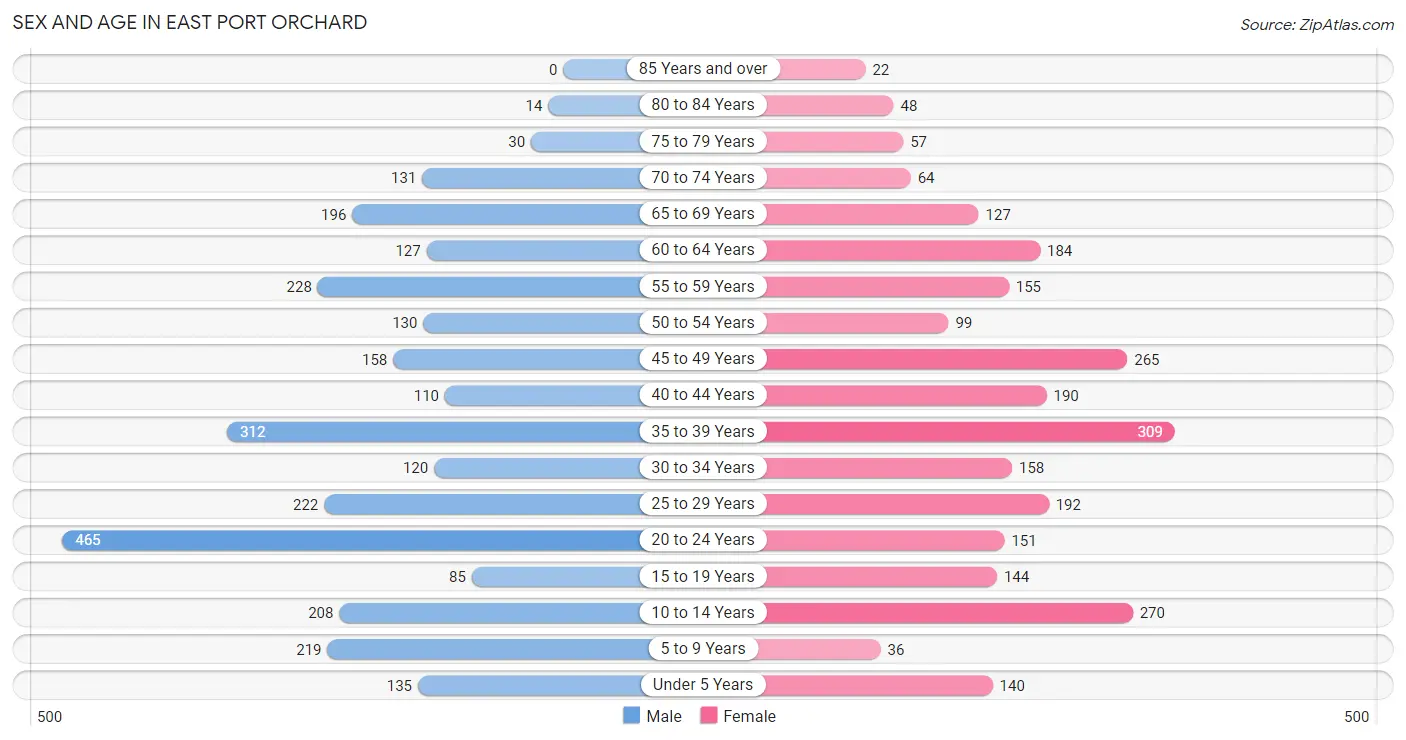
Sex and Age in East Port Orchard
Sex and Age in East Port Orchard
The most populous age groups in East Port Orchard are 20 to 24 Years (465 | 16.1%) for men and 35 to 39 Years (309 | 11.8%) for women.
| Age Bracket | Male | Female |
| Under 5 Years | 135 (4.7%) | 140 (5.4%) |
| 5 to 9 Years | 219 (7.6%) | 36 (1.4%) |
| 10 to 14 Years | 208 (7.2%) | 270 (10.3%) |
| 15 to 19 Years | 85 (2.9%) | 144 (5.5%) |
| 20 to 24 Years | 465 (16.1%) | 151 (5.8%) |
| 25 to 29 Years | 222 (7.7%) | 192 (7.3%) |
| 30 to 34 Years | 120 (4.2%) | 158 (6.0%) |
| 35 to 39 Years | 312 (10.8%) | 309 (11.8%) |
| 40 to 44 Years | 110 (3.8%) | 190 (7.3%) |
| 45 to 49 Years | 158 (5.5%) | 265 (10.2%) |
| 50 to 54 Years | 130 (4.5%) | 99 (3.8%) |
| 55 to 59 Years | 228 (7.9%) | 155 (5.9%) |
| 60 to 64 Years | 127 (4.4%) | 184 (7.0%) |
| 65 to 69 Years | 196 (6.8%) | 127 (4.9%) |
| 70 to 74 Years | 131 (4.5%) | 64 (2.5%) |
| 75 to 79 Years | 30 (1.0%) | 57 (2.2%) |
| 80 to 84 Years | 14 (0.5%) | 48 (1.8%) |
| 85 Years and over | 0 (0.0%) | 22 (0.8%) |
| Total | 2,890 (100.0%) | 2,611 (100.0%) |
Families and Households in East Port Orchard
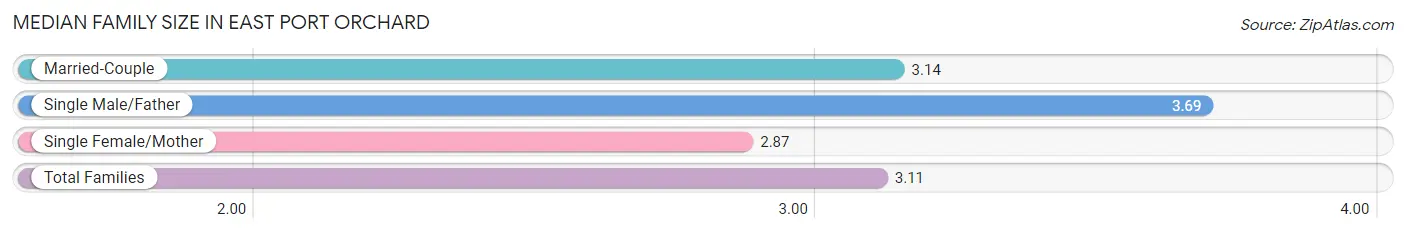
Median Family Size in East Port Orchard
The median family size in East Port Orchard is 3.11 persons per family, with single male/father families (71 | 5.0%) accounting for the largest median family size of 3.69 persons per family. On the other hand, single female/mother families (289 | 20.5%) represent the smallest median family size with 2.87 persons per family.
| Family Type | # Families | Family Size |
| Married-Couple | 1,048 (74.4%) | 3.14 |
| Single Male/Father | 71 (5.0%) | 3.69 |
| Single Female/Mother | 289 (20.5%) | 2.87 |
| Total Families | 1,408 (100.0%) | 3.11 |
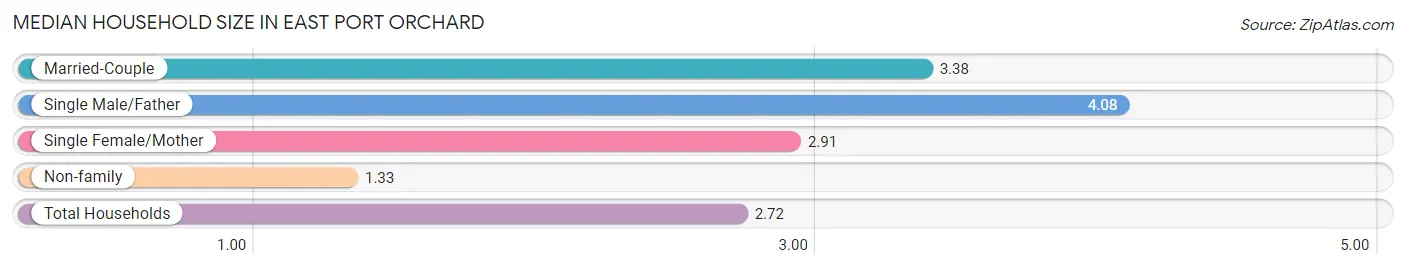
Median Household Size in East Port Orchard
The median household size in East Port Orchard is 2.72 persons per household, with single male/father households (71 | 3.5%) accounting for the largest median household size of 4.08 persons per household. non-family households (603 | 30.0%) represent the smallest median household size with 1.33 persons per household.
| Household Type | # Households | Household Size |
| Married-Couple | 1,048 (52.1%) | 3.38 |
| Single Male/Father | 71 (3.5%) | 4.08 |
| Single Female/Mother | 289 (14.4%) | 2.91 |
| Non-family | 603 (30.0%) | 1.33 |
| Total Households | 2,011 (100.0%) | 2.72 |
Household Size by Marriage Status in East Port Orchard
Out of a total of 2,011 households in East Port Orchard, 1,408 (70.0%) are family households, while 603 (30.0%) are nonfamily households. The most numerous type of family households are 2-person households, comprising 545, and the most common type of nonfamily households are 1-person households, comprising 447.
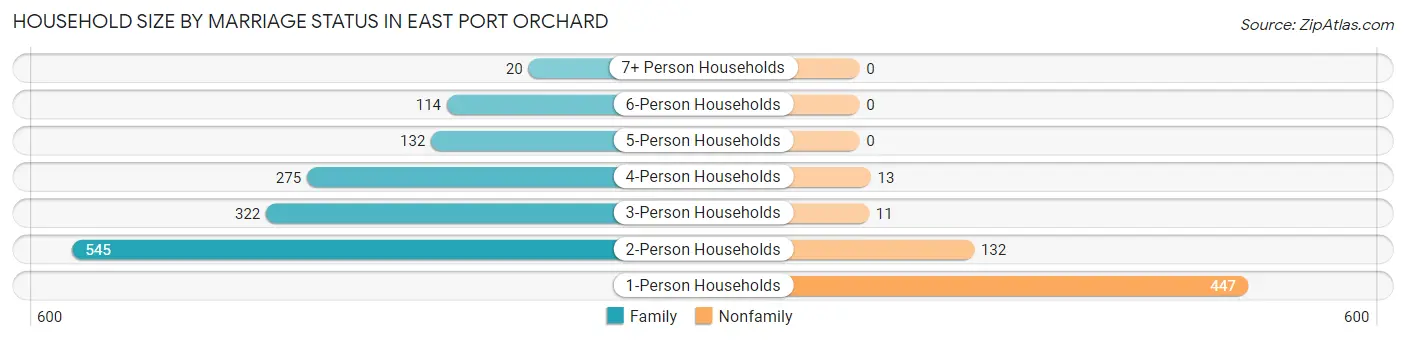
| Household Size | Family Households | Nonfamily Households |
| 1-Person Households | - | 447 (22.2%) |
| 2-Person Households | 545 (27.1%) | 132 (6.6%) |
| 3-Person Households | 322 (16.0%) | 11 (0.5%) |
| 4-Person Households | 275 (13.7%) | 13 (0.6%) |
| 5-Person Households | 132 (6.6%) | 0 (0.0%) |
| 6-Person Households | 114 (5.7%) | 0 (0.0%) |
| 7+ Person Households | 20 (1.0%) | 0 (0.0%) |
| Total | 1,408 (70.0%) | 603 (30.0%) |
Female Fertility in East Port Orchard
Fertility by Age in East Port Orchard
Average fertility rate in East Port Orchard is 62.0 births per 1,000 women. Women in the age bracket of 20 to 34 years have the highest fertility rate with 126.0 births per 1,000 women. Women in the age bracket of 20 to 34 years acount for 70.0% of all women with births.
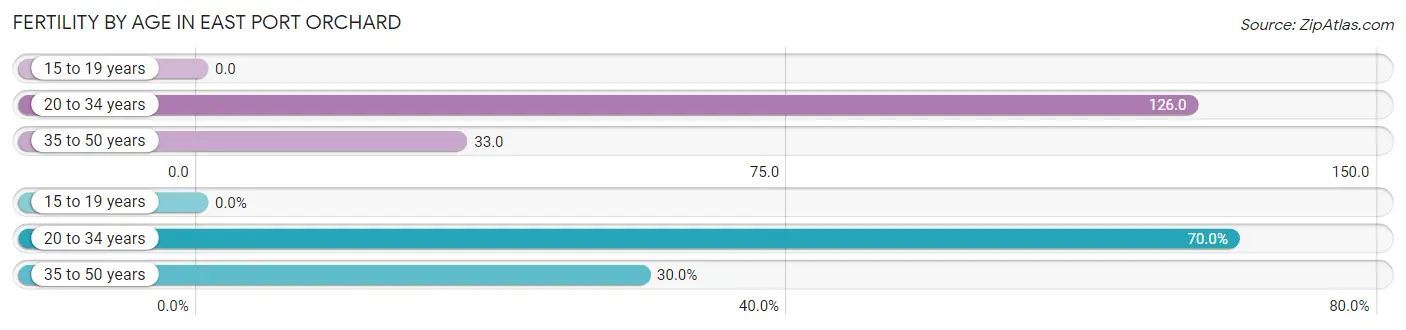
| Age Bracket | Women with Births | Births / 1,000 Women |
| 15 to 19 years | 0 (0.0%) | 0.0 |
| 20 to 34 years | 63 (70.0%) | 126.0 |
| 35 to 50 years | 27 (30.0%) | 33.0 |
| Total | 90 (100.0%) | 62.0 |
Fertility by Age by Marriage Status in East Port Orchard
70.0% of women with births (90) in East Port Orchard are married. The highest percentage of unmarried women with births falls into 35 to 50 years age bracket with 100.0% of them unmarried at the time of birth, while the lowest percentage of unmarried women with births belong to 20 to 34 years age bracket with 0.0% of them unmarried.
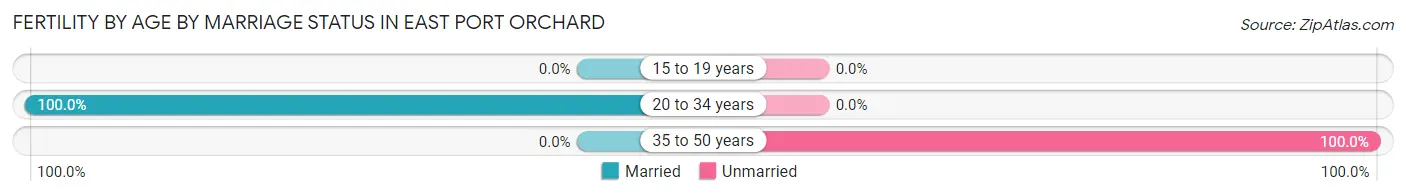
| Age Bracket | Married | Unmarried |
| 15 to 19 years | 0 (0.0%) | 0 (0.0%) |
| 20 to 34 years | 63 (100.0%) | 0 (0.0%) |
| 35 to 50 years | 0 (0.0%) | 27 (100.0%) |
| Total | 63 (70.0%) | 27 (30.0%) |
Fertility by Education in East Port Orchard
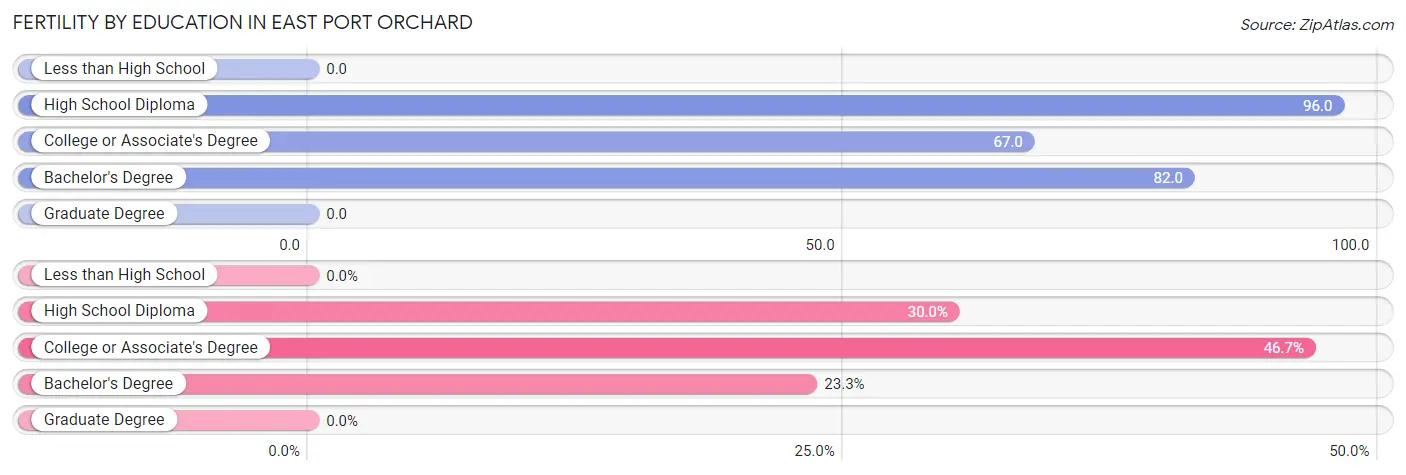
| Educational Attainment | Women with Births | Births / 1,000 Women |
| Less than High School | 0 (0.0%) | 0.0 |
| High School Diploma | 27 (30.0%) | 96.0 |
| College or Associate's Degree | 42 (46.7%) | 67.0 |
| Bachelor's Degree | 21 (23.3%) | 82.0 |
| Graduate Degree | 0 (0.0%) | 0.0 |
| Total | 90 (100.0%) | 62.0 |
Fertility by Education by Marriage Status in East Port Orchard
30.0% of women with births in East Port Orchard are unmarried. Women with the educational attainment of college or associate's degree are most likely to be married with 100.0% of them married at childbirth, while women with the educational attainment of high school diploma are least likely to be married with 100.0% of them unmarried at childbirth.
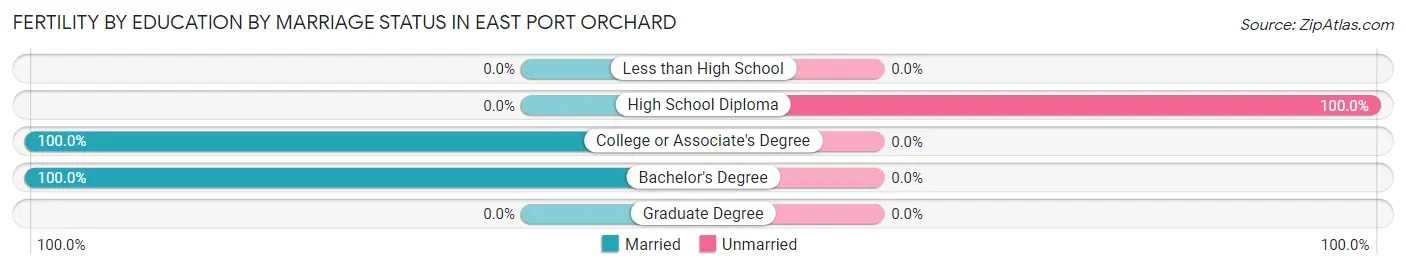
| Educational Attainment | Married | Unmarried |
| Less than High School | 0 (0.0%) | 0 (0.0%) |
| High School Diploma | 0 (0.0%) | 27 (100.0%) |
| College or Associate's Degree | 42 (100.0%) | 0 (0.0%) |
| Bachelor's Degree | 21 (100.0%) | 0 (0.0%) |
| Graduate Degree | 0 (0.0%) | 0 (0.0%) |
| Total | 63 (70.0%) | 27 (30.0%) |
Employment Characteristics in East Port Orchard
Employment by Class of Employer in East Port Orchard
Among the 2,808 employed individuals in East Port Orchard, private company employees (1,413 | 50.3%), federal government employees (369 | 13.1%), and self-employed (not incorporated) (309 | 11.0%) make up the most common classes of employment.
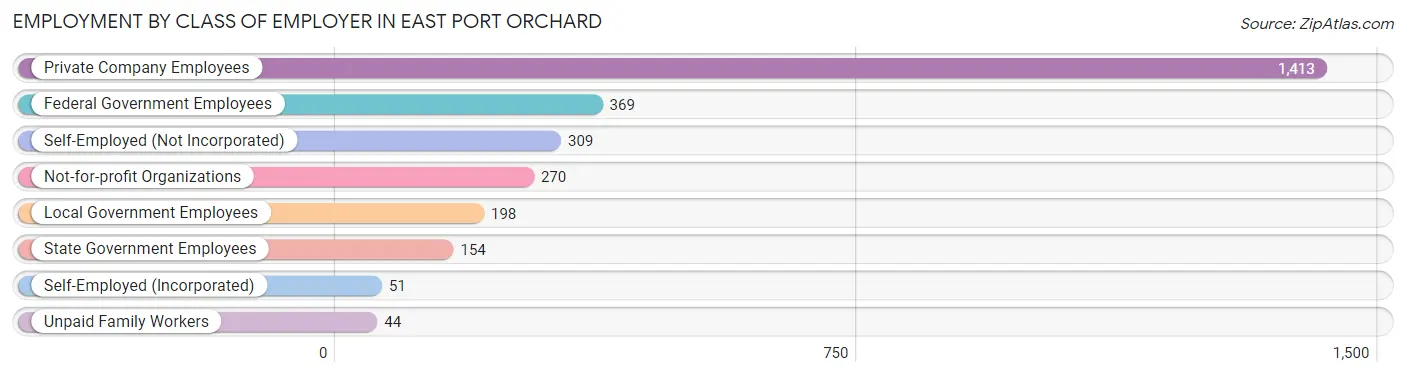
| Employer Class | # Employees | % Employees |
| Private Company Employees | 1,413 | 50.3% |
| Self-Employed (Incorporated) | 51 | 1.8% |
| Self-Employed (Not Incorporated) | 309 | 11.0% |
| Not-for-profit Organizations | 270 | 9.6% |
| Local Government Employees | 198 | 7.0% |
| State Government Employees | 154 | 5.5% |
| Federal Government Employees | 369 | 13.1% |
| Unpaid Family Workers | 44 | 1.6% |
| Total | 2,808 | 100.0% |
Employment Status by Age in East Port Orchard
According to the labor force statistics for East Port Orchard, out of the total population over 16 years of age (4,469), 67.3% or 3,008 individuals are in the labor force, with 6.3% or 190 of them unemployed. The age group with the highest labor force participation rate is 35 to 44 years, with 90.6% or 834 individuals in the labor force. Within the labor force, the 16 to 19 years age range has the highest percentage of unemployed individuals, with 100.0% or 30 of them being unemployed.
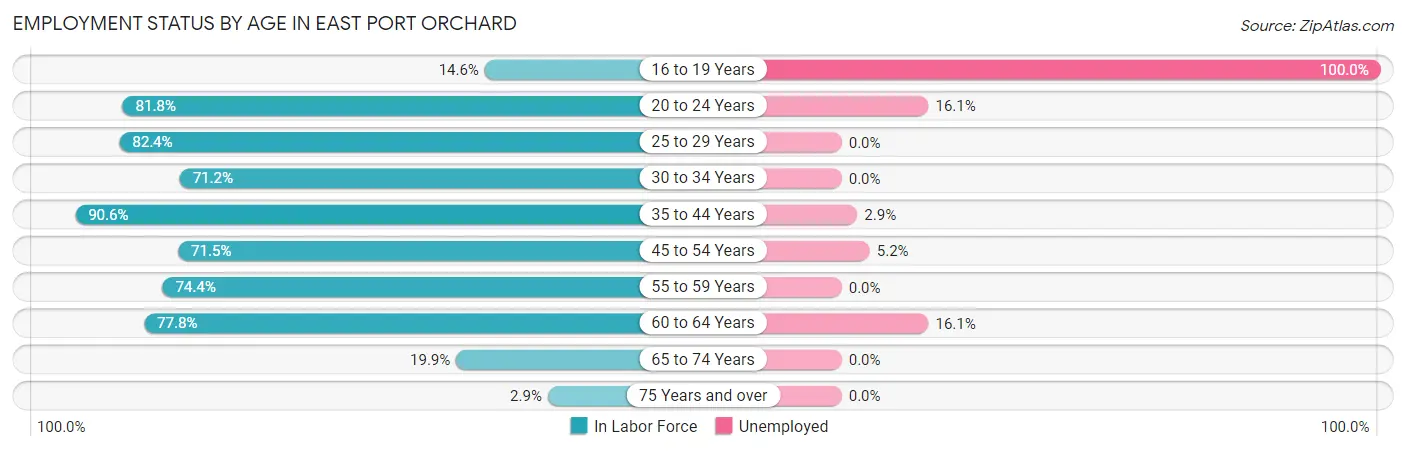
| Age Bracket | In Labor Force | Unemployed |
| 16 to 19 Years | 30 (14.6%) | 30 (100.0%) |
| 20 to 24 Years | 504 (81.8%) | 81 (16.1%) |
| 25 to 29 Years | 341 (82.4%) | 0 (0.0%) |
| 30 to 34 Years | 198 (71.2%) | 0 (0.0%) |
| 35 to 44 Years | 834 (90.6%) | 24 (2.9%) |
| 45 to 54 Years | 466 (71.5%) | 24 (5.2%) |
| 55 to 59 Years | 285 (74.4%) | 0 (0.0%) |
| 60 to 64 Years | 242 (77.8%) | 39 (16.1%) |
| 65 to 74 Years | 103 (19.9%) | 0 (0.0%) |
| 75 Years and over | 5 (2.9%) | 0 (0.0%) |
| Total | 3,008 (67.3%) | 190 (6.3%) |
Employment Status by Educational Attainment in East Port Orchard
According to labor force statistics for East Port Orchard, 80.0% of individuals (2,367) out of the total population between 25 and 64 years of age (2,959) are in the labor force, with 3.7% or 88 of them being unemployed. The group with the highest labor force participation rate are those with the educational attainment of bachelor's degree or higher, with 93.9% or 605 individuals in the labor force. Within the labor force, individuals with college / associate degree education have the highest percentage of unemployment, with 5.5% or 60 of them being unemployed.
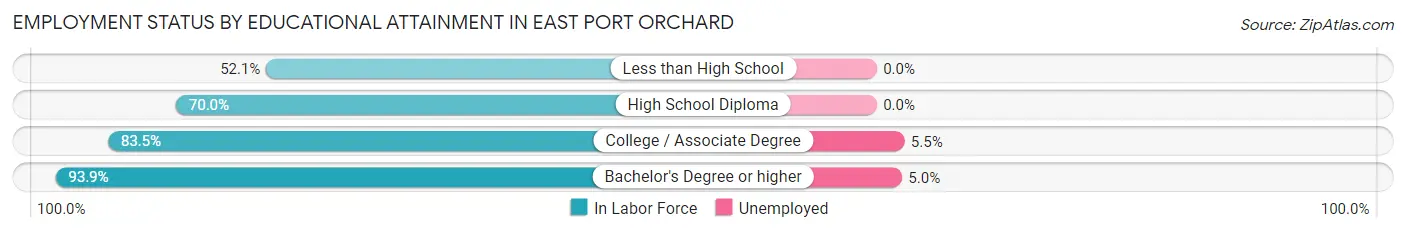
| Educational Attainment | In Labor Force | Unemployed |
| Less than High School | 101 (52.1%) | 0 (0.0%) |
| High School Diploma | 577 (70.0%) | 0 (0.0%) |
| College / Associate Degree | 1,083 (83.5%) | 71 (5.5%) |
| Bachelor's Degree or higher | 605 (93.9%) | 32 (5.0%) |
| Total | 2,367 (80.0%) | 109 (3.7%) |
Employment Occupations by Sex in East Port Orchard
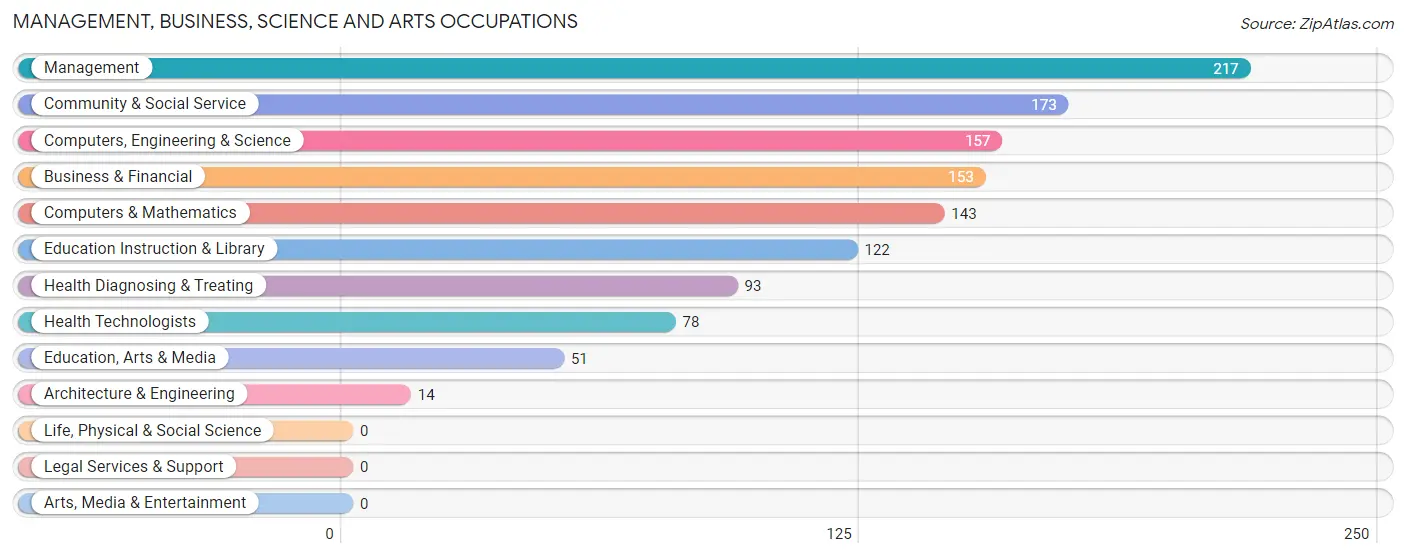
Management, Business, Science and Arts Occupations
The most common Management, Business, Science and Arts occupations in East Port Orchard are Management (217 | 8.1%), Community & Social Service (173 | 6.5%), Computers, Engineering & Science (157 | 5.9%), Business & Financial (153 | 5.7%), and Computers & Mathematics (143 | 5.4%).
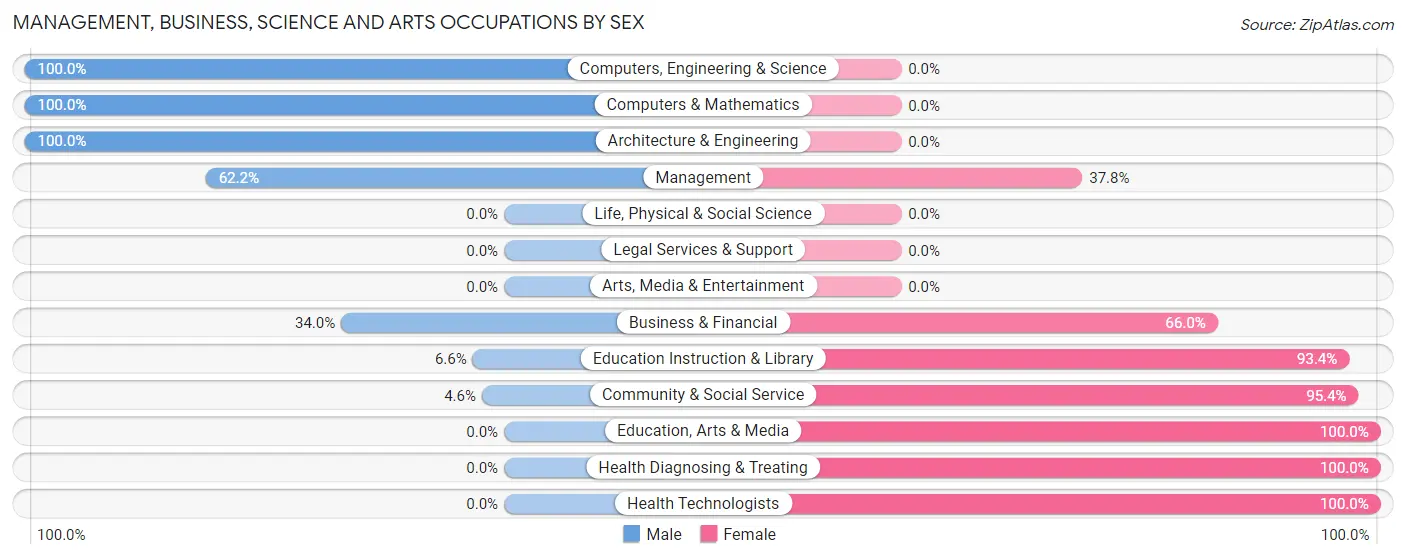
Management, Business, Science and Arts Occupations by Sex
Within the Management, Business, Science and Arts occupations in East Port Orchard, the most male-oriented occupations are Computers, Engineering & Science (100.0%), Computers & Mathematics (100.0%), and Architecture & Engineering (100.0%), while the most female-oriented occupations are Education, Arts & Media (100.0%), Health Diagnosing & Treating (100.0%), and Health Technologists (100.0%).
| Occupation | Male | Female |
| Management | 135 (62.2%) | 82 (37.8%) |
| Business & Financial | 52 (34.0%) | 101 (66.0%) |
| Computers, Engineering & Science | 157 (100.0%) | 0 (0.0%) |
| Computers & Mathematics | 143 (100.0%) | 0 (0.0%) |
| Architecture & Engineering | 14 (100.0%) | 0 (0.0%) |
| Life, Physical & Social Science | 0 (0.0%) | 0 (0.0%) |
| Community & Social Service | 8 (4.6%) | 165 (95.4%) |
| Education, Arts & Media | 0 (0.0%) | 51 (100.0%) |
| Legal Services & Support | 0 (0.0%) | 0 (0.0%) |
| Education Instruction & Library | 8 (6.6%) | 114 (93.4%) |
| Arts, Media & Entertainment | 0 (0.0%) | 0 (0.0%) |
| Health Diagnosing & Treating | 0 (0.0%) | 93 (100.0%) |
| Health Technologists | 0 (0.0%) | 78 (100.0%) |
| Total (Category) | 352 (44.4%) | 441 (55.6%) |
| Total (Overall) | 1,431 (53.6%) | 1,238 (46.4%) |
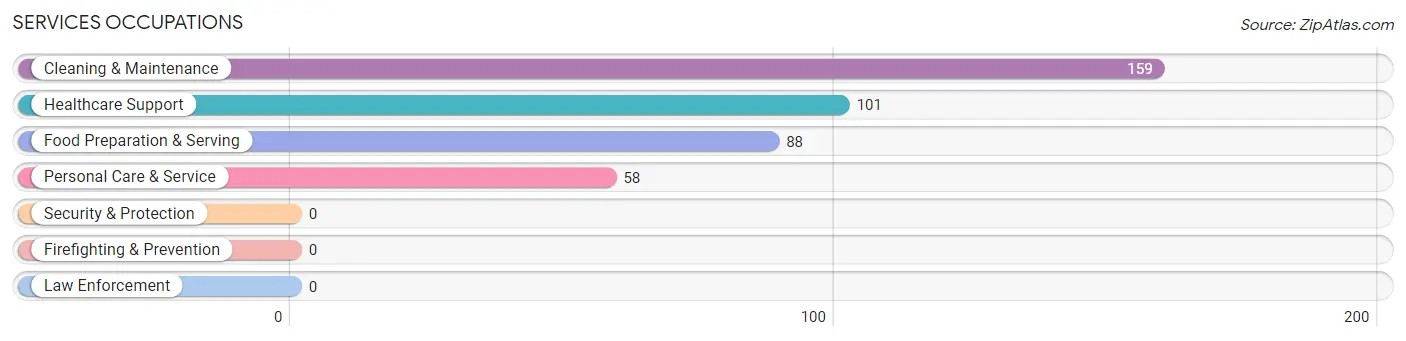
Services Occupations
The most common Services occupations in East Port Orchard are Cleaning & Maintenance (159 | 6.0%), Healthcare Support (101 | 3.8%), Food Preparation & Serving (88 | 3.3%), and Personal Care & Service (58 | 2.2%).
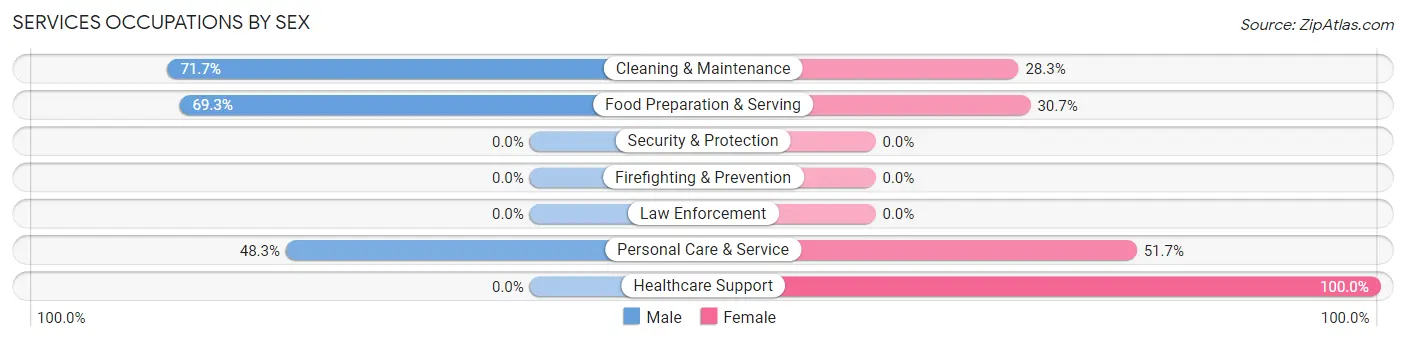
Services Occupations by Sex
Within the Services occupations in East Port Orchard, the most male-oriented occupations are Cleaning & Maintenance (71.7%), Food Preparation & Serving (69.3%), and Personal Care & Service (48.3%), while the most female-oriented occupations are Healthcare Support (100.0%), Personal Care & Service (51.7%), and Food Preparation & Serving (30.7%).
| Occupation | Male | Female |
| Healthcare Support | 0 (0.0%) | 101 (100.0%) |
| Security & Protection | 0 (0.0%) | 0 (0.0%) |
| Firefighting & Prevention | 0 (0.0%) | 0 (0.0%) |
| Law Enforcement | 0 (0.0%) | 0 (0.0%) |
| Food Preparation & Serving | 61 (69.3%) | 27 (30.7%) |
| Cleaning & Maintenance | 114 (71.7%) | 45 (28.3%) |
| Personal Care & Service | 28 (48.3%) | 30 (51.7%) |
| Total (Category) | 203 (50.0%) | 203 (50.0%) |
| Total (Overall) | 1,431 (53.6%) | 1,238 (46.4%) |
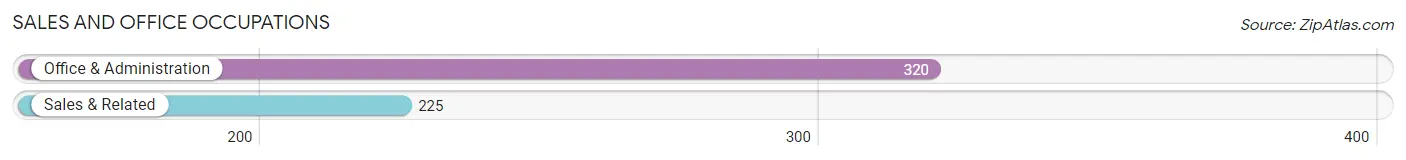
Sales and Office Occupations
The most common Sales and Office occupations in East Port Orchard are Office & Administration (320 | 12.0%), and Sales & Related (225 | 8.4%).
Sales and Office Occupations by Sex
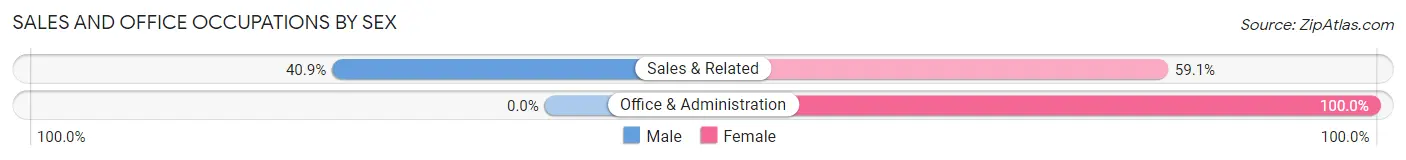
| Occupation | Male | Female |
| Sales & Related | 92 (40.9%) | 133 (59.1%) |
| Office & Administration | 0 (0.0%) | 320 (100.0%) |
| Total (Category) | 92 (16.9%) | 453 (83.1%) |
| Total (Overall) | 1,431 (53.6%) | 1,238 (46.4%) |
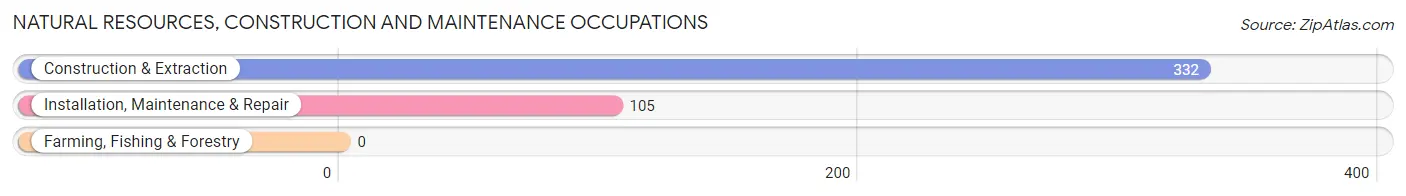
Natural Resources, Construction and Maintenance Occupations
The most common Natural Resources, Construction and Maintenance occupations in East Port Orchard are Construction & Extraction (332 | 12.4%), and Installation, Maintenance & Repair (105 | 3.9%).
Natural Resources, Construction and Maintenance Occupations by Sex
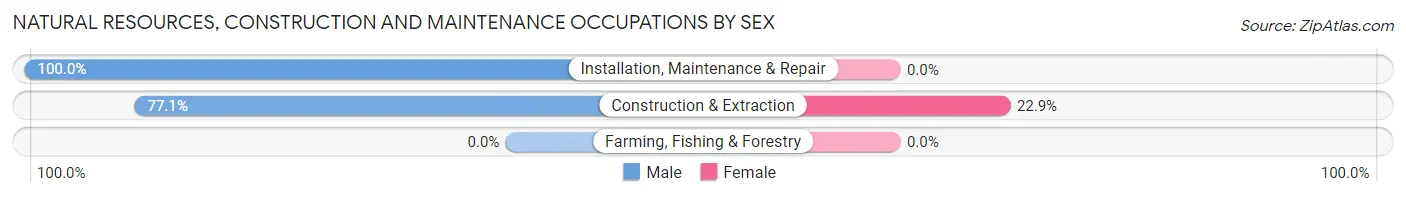
| Occupation | Male | Female |
| Farming, Fishing & Forestry | 0 (0.0%) | 0 (0.0%) |
| Construction & Extraction | 256 (77.1%) | 76 (22.9%) |
| Installation, Maintenance & Repair | 105 (100.0%) | 0 (0.0%) |
| Total (Category) | 361 (82.6%) | 76 (17.4%) |
| Total (Overall) | 1,431 (53.6%) | 1,238 (46.4%) |
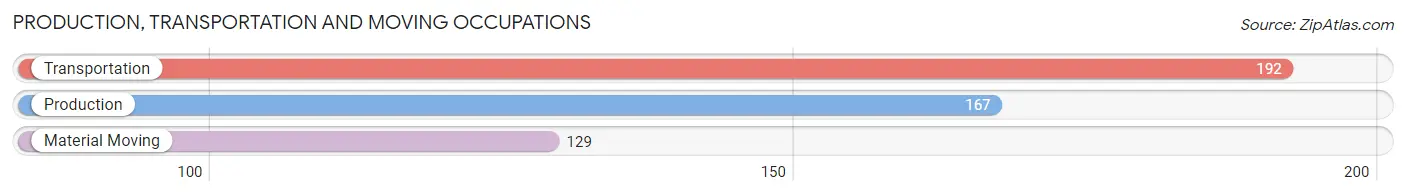
Production, Transportation and Moving Occupations
The most common Production, Transportation and Moving occupations in East Port Orchard are Transportation (192 | 7.2%), Production (167 | 6.3%), and Material Moving (129 | 4.8%).
Production, Transportation and Moving Occupations by Sex
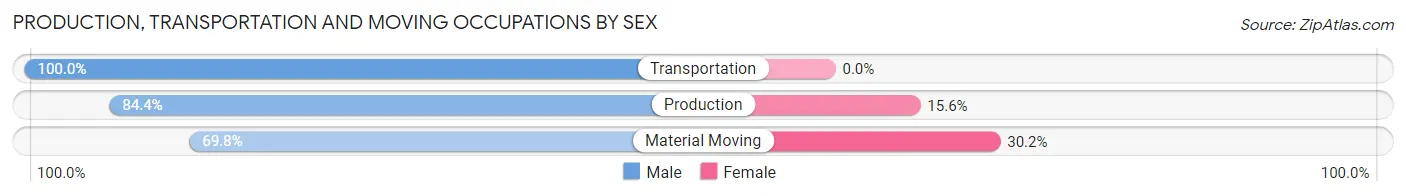
| Occupation | Male | Female |
| Production | 141 (84.4%) | 26 (15.6%) |
| Transportation | 192 (100.0%) | 0 (0.0%) |
| Material Moving | 90 (69.8%) | 39 (30.2%) |
| Total (Category) | 423 (86.7%) | 65 (13.3%) |
| Total (Overall) | 1,431 (53.6%) | 1,238 (46.4%) |
Employment Industries by Sex in East Port Orchard
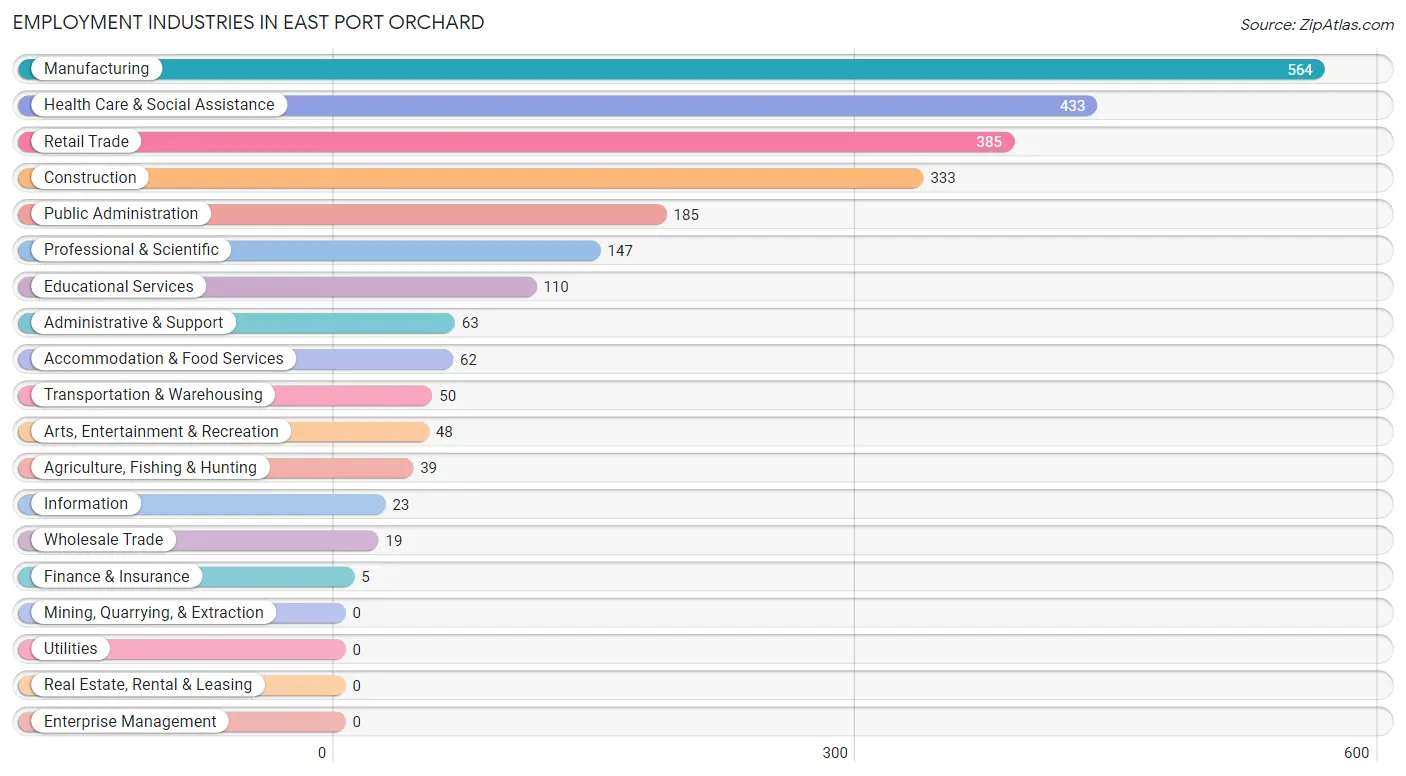
Employment Industries in East Port Orchard
The major employment industries in East Port Orchard include Manufacturing (564 | 21.1%), Health Care & Social Assistance (433 | 16.2%), Retail Trade (385 | 14.4%), Construction (333 | 12.5%), and Public Administration (185 | 6.9%).
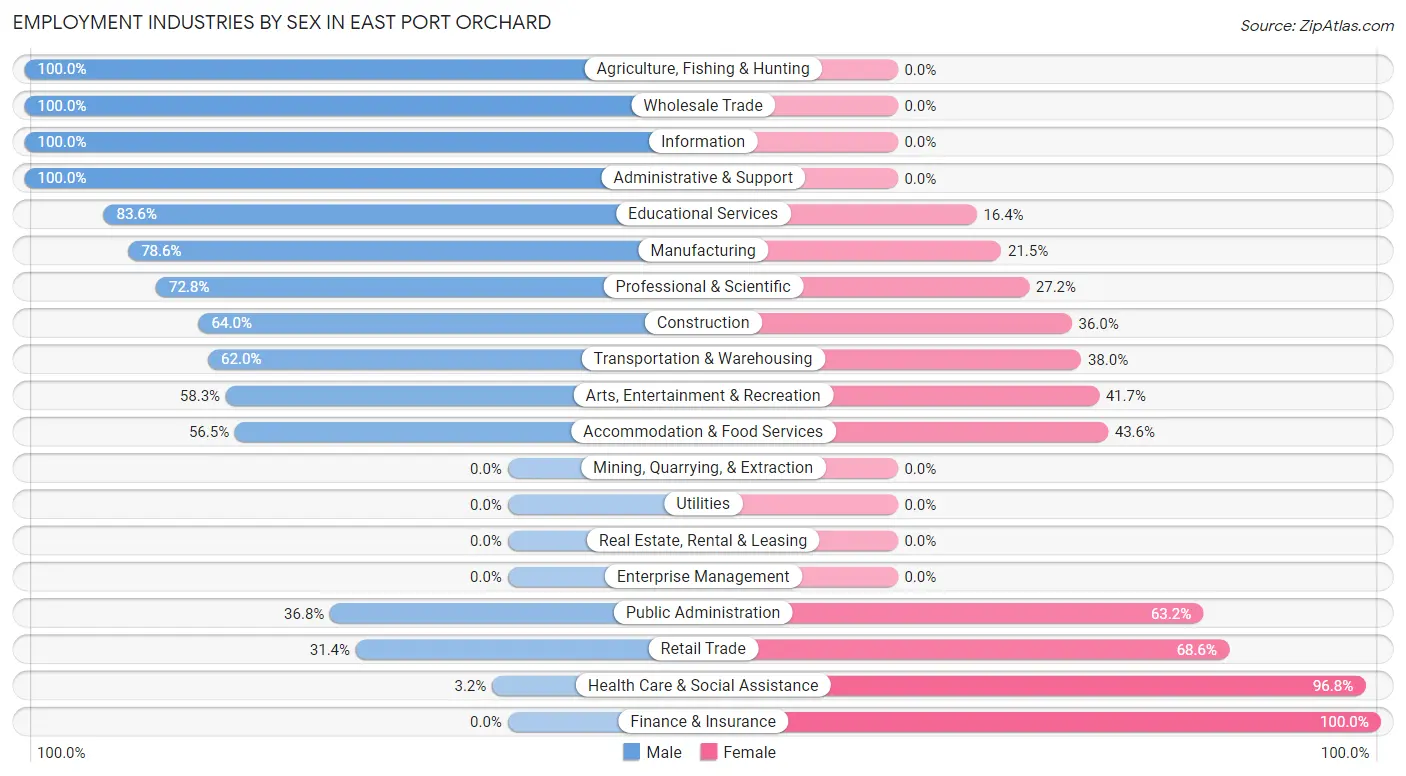
Employment Industries by Sex in East Port Orchard
The East Port Orchard industries that see more men than women are Agriculture, Fishing & Hunting (100.0%), Wholesale Trade (100.0%), and Information (100.0%), whereas the industries that tend to have a higher number of women are Finance & Insurance (100.0%), Health Care & Social Assistance (96.8%), and Retail Trade (68.6%).
| Industry | Male | Female |
| Agriculture, Fishing & Hunting | 39 (100.0%) | 0 (0.0%) |
| Mining, Quarrying, & Extraction | 0 (0.0%) | 0 (0.0%) |
| Construction | 213 (64.0%) | 120 (36.0%) |
| Manufacturing | 443 (78.5%) | 121 (21.4%) |
| Wholesale Trade | 19 (100.0%) | 0 (0.0%) |
| Retail Trade | 121 (31.4%) | 264 (68.6%) |
| Transportation & Warehousing | 31 (62.0%) | 19 (38.0%) |
| Utilities | 0 (0.0%) | 0 (0.0%) |
| Information | 23 (100.0%) | 0 (0.0%) |
| Finance & Insurance | 0 (0.0%) | 5 (100.0%) |
| Real Estate, Rental & Leasing | 0 (0.0%) | 0 (0.0%) |
| Professional & Scientific | 107 (72.8%) | 40 (27.2%) |
| Enterprise Management | 0 (0.0%) | 0 (0.0%) |
| Administrative & Support | 63 (100.0%) | 0 (0.0%) |
| Educational Services | 92 (83.6%) | 18 (16.4%) |
| Health Care & Social Assistance | 14 (3.2%) | 419 (96.8%) |
| Arts, Entertainment & Recreation | 28 (58.3%) | 20 (41.7%) |
| Accommodation & Food Services | 35 (56.5%) | 27 (43.5%) |
| Public Administration | 68 (36.8%) | 117 (63.2%) |
| Total | 1,431 (53.6%) | 1,238 (46.4%) |
Education in East Port Orchard
School Enrollment in East Port Orchard
The most common levels of schooling among the 1,274 students in East Port Orchard are middle school (325 | 25.5%), high school (260 | 20.4%), and elementary school (244 | 19.2%).
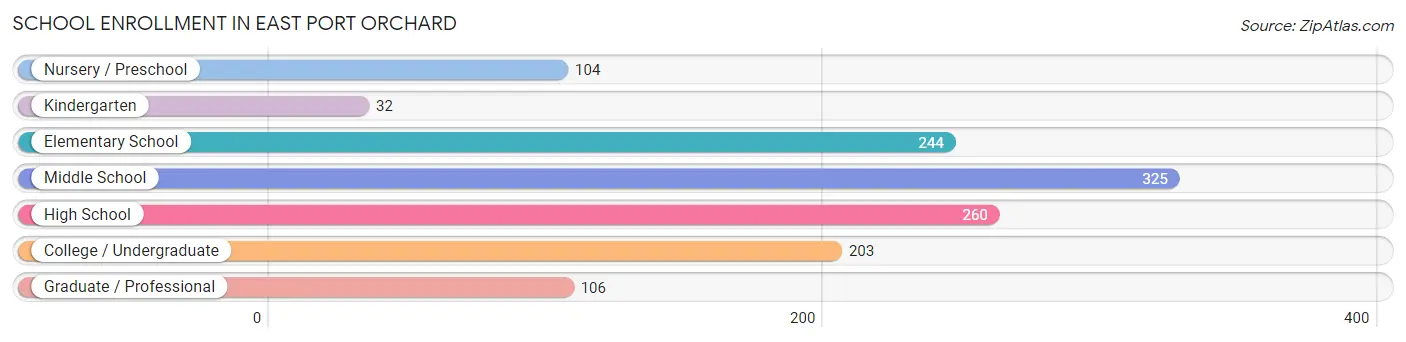
| School Level | # Students | % Students |
| Nursery / Preschool | 104 | 8.2% |
| Kindergarten | 32 | 2.5% |
| Elementary School | 244 | 19.2% |
| Middle School | 325 | 25.5% |
| High School | 260 | 20.4% |
| College / Undergraduate | 203 | 15.9% |
| Graduate / Professional | 106 | 8.3% |
| Total | 1,274 | 100.0% |
School Enrollment by Age by Funding Source in East Port Orchard
Out of a total of 1,274 students who are enrolled in schools in East Port Orchard, 280 (22.0%) attend a private institution, while the remaining 994 (78.0%) are enrolled in public schools. The age group of 3 to 4 year olds has the highest likelihood of being enrolled in private schools, with 54 (51.9% in the age bracket) enrolled. Conversely, the age group of 25 to 34 year olds has the lowest likelihood of being enrolled in a private school, with 119 (100.0% in the age bracket) attending a public institution.
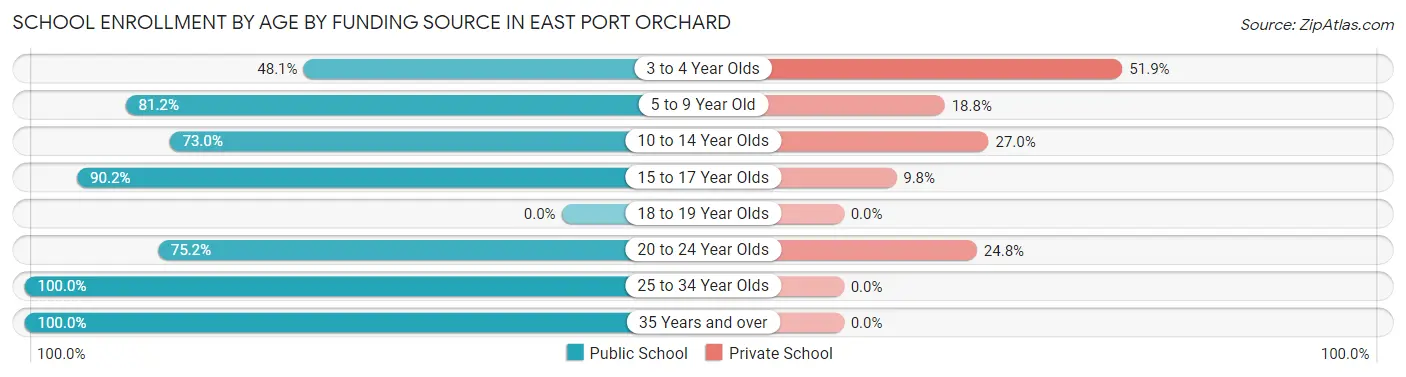
| Age Bracket | Public School | Private School |
| 3 to 4 Year Olds | 50 (48.1%) | 54 (51.9%) |
| 5 to 9 Year Old | 207 (81.2%) | 48 (18.8%) |
| 10 to 14 Year Olds | 349 (73.0%) | 129 (27.0%) |
| 15 to 17 Year Olds | 138 (90.2%) | 15 (9.8%) |
| 18 to 19 Year Olds | 0 (0.0%) | 0 (0.0%) |
| 20 to 24 Year Olds | 103 (75.2%) | 34 (24.8%) |
| 25 to 34 Year Olds | 119 (100.0%) | 0 (0.0%) |
| 35 Years and over | 28 (100.0%) | 0 (0.0%) |
| Total | 994 (78.0%) | 280 (22.0%) |
Educational Attainment by Field of Study in East Port Orchard
Psychology (100 | 13.2%), education (97 | 12.8%), engineering (82 | 10.8%), business (77 | 10.1%), and visual & performing arts (77 | 10.1%) are the most common fields of study among 760 individuals in East Port Orchard who have obtained a bachelor's degree or higher.
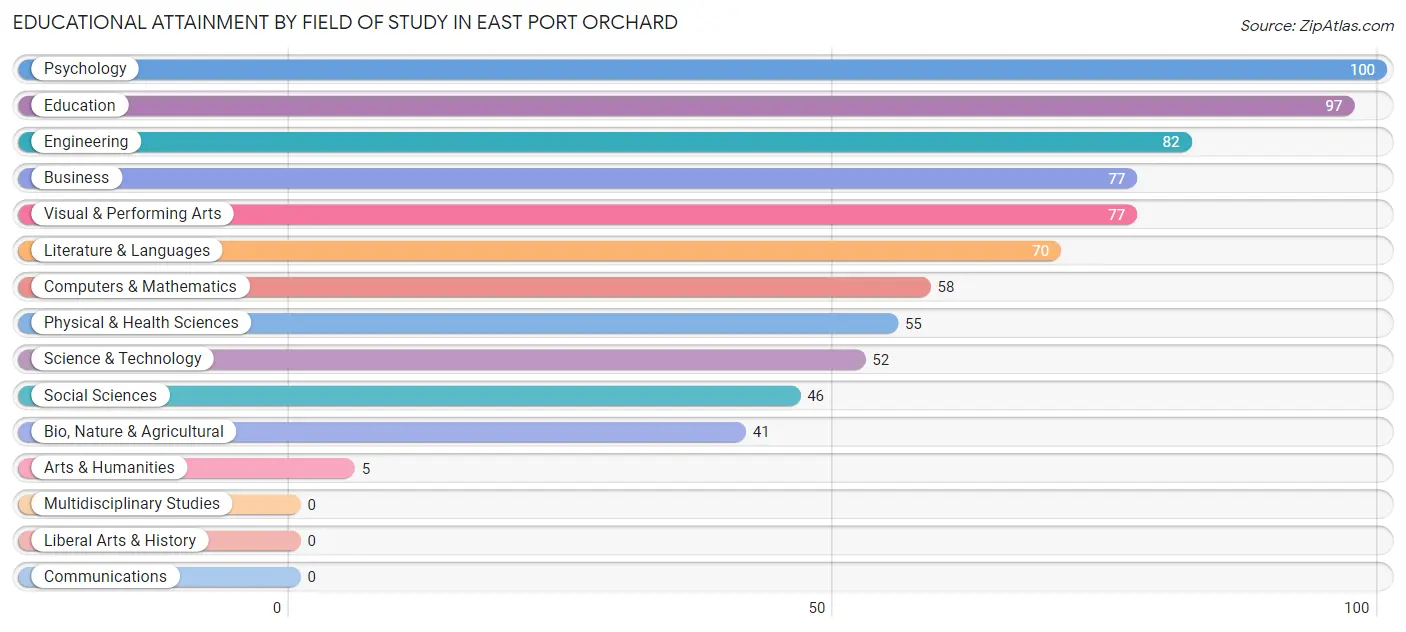
| Field of Study | # Graduates | % Graduates |
| Computers & Mathematics | 58 | 7.6% |
| Bio, Nature & Agricultural | 41 | 5.4% |
| Physical & Health Sciences | 55 | 7.2% |
| Psychology | 100 | 13.2% |
| Social Sciences | 46 | 6.0% |
| Engineering | 82 | 10.8% |
| Multidisciplinary Studies | 0 | 0.0% |
| Science & Technology | 52 | 6.8% |
| Business | 77 | 10.1% |
| Education | 97 | 12.8% |
| Literature & Languages | 70 | 9.2% |
| Liberal Arts & History | 0 | 0.0% |
| Visual & Performing Arts | 77 | 10.1% |
| Communications | 0 | 0.0% |
| Arts & Humanities | 5 | 0.7% |
| Total | 760 | 100.0% |
Transportation & Commute in East Port Orchard
Vehicle Availability by Sex in East Port Orchard
The most prevalent vehicle ownership categories in East Port Orchard are males with 3 vehicles (774, accounting for 50.8%) and females with 3 vehicles (596, making up 60.3%).
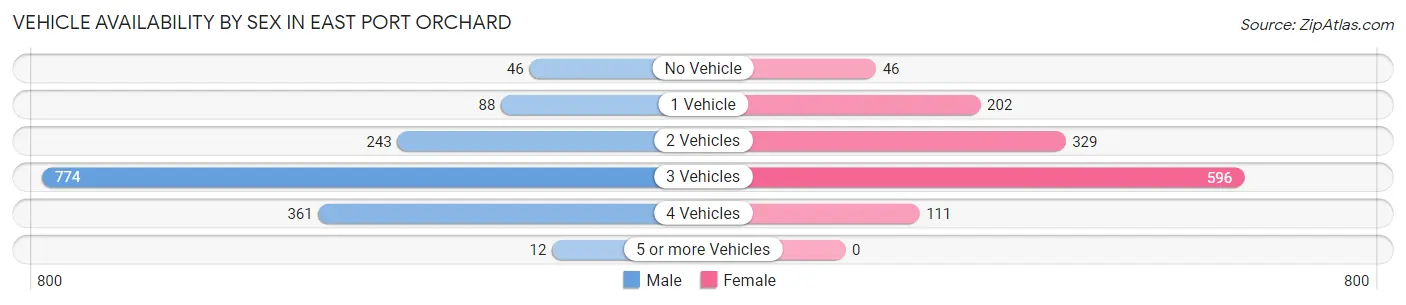
| Vehicles Available | Male | Female |
| No Vehicle | 46 (3.0%) | 46 (3.6%) |
| 1 Vehicle | 88 (5.8%) | 202 (15.7%) |
| 2 Vehicles | 243 (15.9%) | 329 (25.6%) |
| 3 Vehicles | 774 (50.8%) | 596 (46.4%) |
| 4 Vehicles | 361 (23.7%) | 111 (8.6%) |
| 5 or more Vehicles | 12 (0.8%) | 0 (0.0%) |
| Total | 1,524 (100.0%) | 1,284 (100.0%) |
Commute Time in East Port Orchard
The most frequently occuring commute durations in East Port Orchard are 10 to 14 minutes (472 commuters, 17.6%), 5 to 9 minutes (398 commuters, 14.8%), and 30 to 34 minutes (389 commuters, 14.5%).
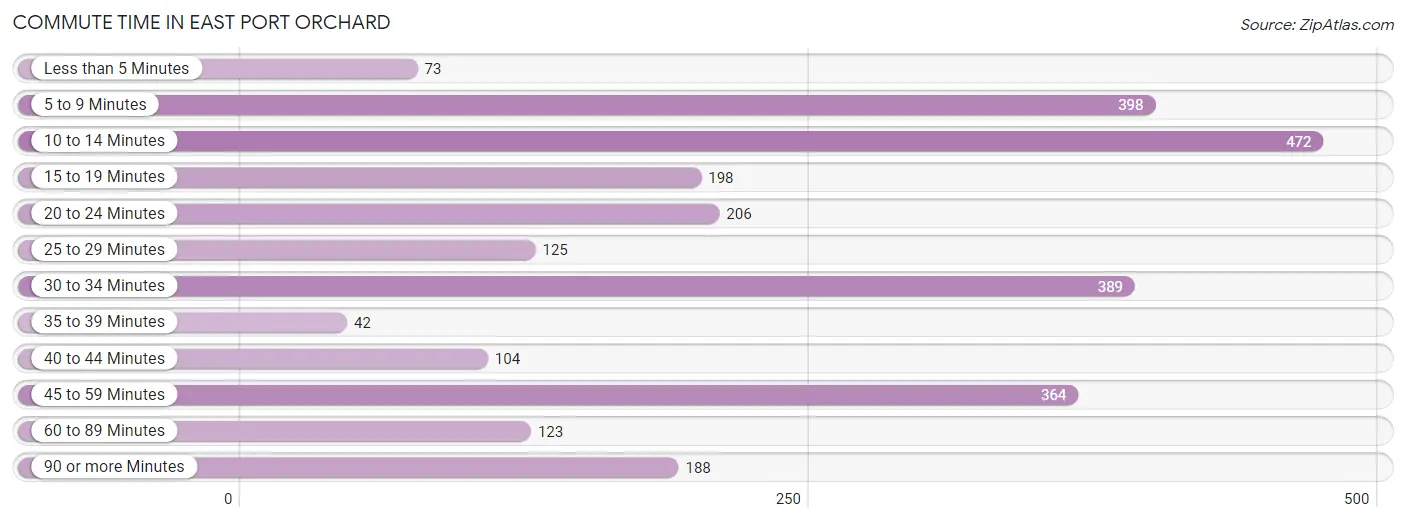
| Commute Time | # Commuters | % Commuters |
| Less than 5 Minutes | 73 | 2.7% |
| 5 to 9 Minutes | 398 | 14.8% |
| 10 to 14 Minutes | 472 | 17.6% |
| 15 to 19 Minutes | 198 | 7.4% |
| 20 to 24 Minutes | 206 | 7.7% |
| 25 to 29 Minutes | 125 | 4.7% |
| 30 to 34 Minutes | 389 | 14.5% |
| 35 to 39 Minutes | 42 | 1.6% |
| 40 to 44 Minutes | 104 | 3.9% |
| 45 to 59 Minutes | 364 | 13.6% |
| 60 to 89 Minutes | 123 | 4.6% |
| 90 or more Minutes | 188 | 7.0% |
Commute Time by Sex in East Port Orchard
The most common commute times in East Port Orchard are 5 to 9 minutes (338 commuters, 23.2%) for males and 10 to 14 minutes (285 commuters, 23.2%) for females.
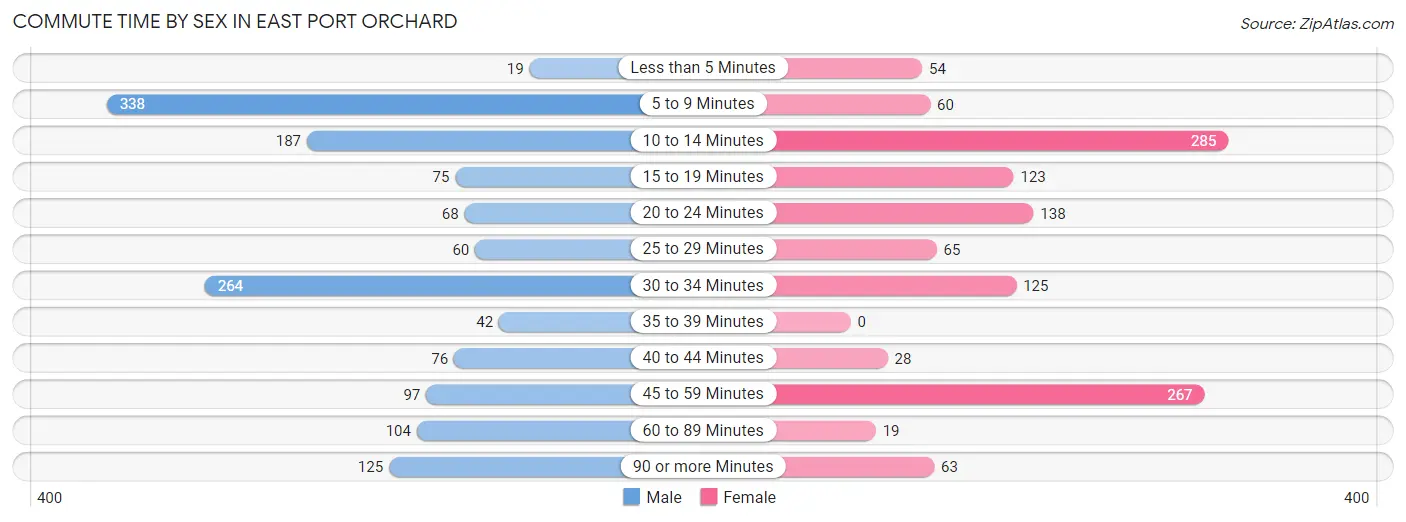
| Commute Time | Male | Female |
| Less than 5 Minutes | 19 (1.3%) | 54 (4.4%) |
| 5 to 9 Minutes | 338 (23.2%) | 60 (4.9%) |
| 10 to 14 Minutes | 187 (12.9%) | 285 (23.2%) |
| 15 to 19 Minutes | 75 (5.1%) | 123 (10.0%) |
| 20 to 24 Minutes | 68 (4.7%) | 138 (11.3%) |
| 25 to 29 Minutes | 60 (4.1%) | 65 (5.3%) |
| 30 to 34 Minutes | 264 (18.1%) | 125 (10.2%) |
| 35 to 39 Minutes | 42 (2.9%) | 0 (0.0%) |
| 40 to 44 Minutes | 76 (5.2%) | 28 (2.3%) |
| 45 to 59 Minutes | 97 (6.7%) | 267 (21.8%) |
| 60 to 89 Minutes | 104 (7.1%) | 19 (1.5%) |
| 90 or more Minutes | 125 (8.6%) | 63 (5.1%) |
Time of Departure to Work by Sex in East Port Orchard
The most frequent times of departure to work in East Port Orchard are 12:00 AM to 4:59 AM (258, 17.7%) for males and 7:30 AM to 7:59 AM (253, 20.6%) for females.
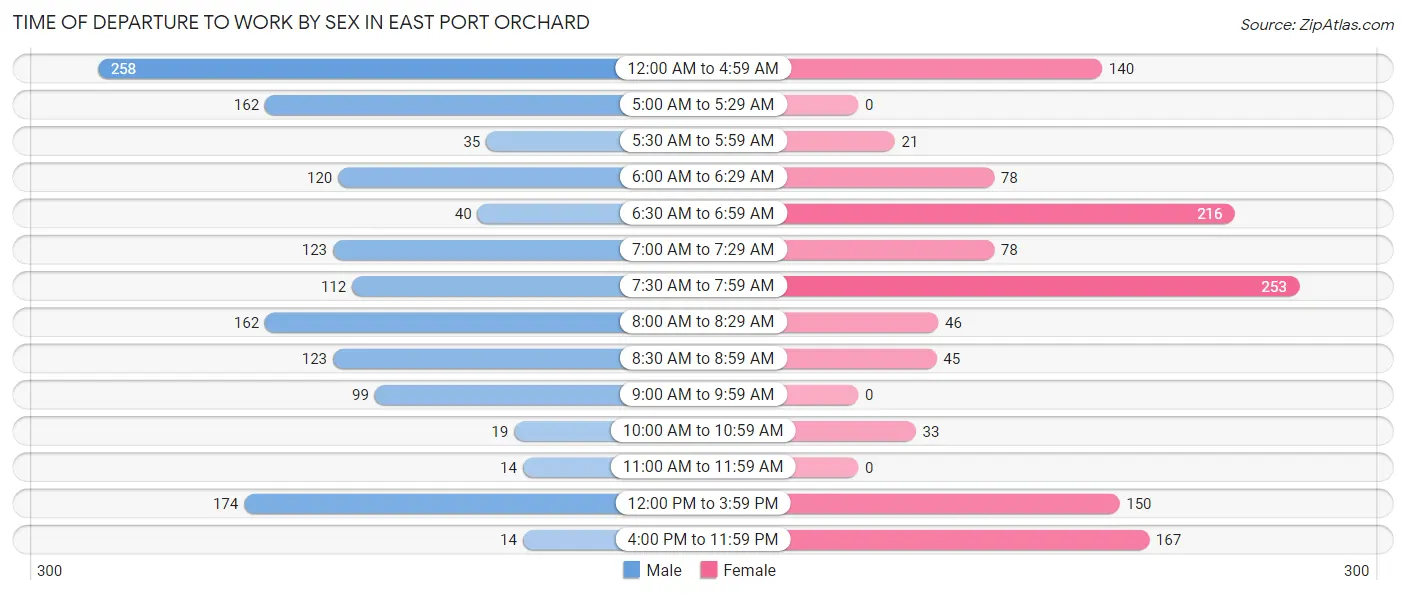
| Time of Departure | Male | Female |
| 12:00 AM to 4:59 AM | 258 (17.7%) | 140 (11.4%) |
| 5:00 AM to 5:29 AM | 162 (11.1%) | 0 (0.0%) |
| 5:30 AM to 5:59 AM | 35 (2.4%) | 21 (1.7%) |
| 6:00 AM to 6:29 AM | 120 (8.3%) | 78 (6.4%) |
| 6:30 AM to 6:59 AM | 40 (2.8%) | 216 (17.6%) |
| 7:00 AM to 7:29 AM | 123 (8.5%) | 78 (6.4%) |
| 7:30 AM to 7:59 AM | 112 (7.7%) | 253 (20.6%) |
| 8:00 AM to 8:29 AM | 162 (11.1%) | 46 (3.7%) |
| 8:30 AM to 8:59 AM | 123 (8.5%) | 45 (3.7%) |
| 9:00 AM to 9:59 AM | 99 (6.8%) | 0 (0.0%) |
| 10:00 AM to 10:59 AM | 19 (1.3%) | 33 (2.7%) |
| 11:00 AM to 11:59 AM | 14 (1.0%) | 0 (0.0%) |
| 12:00 PM to 3:59 PM | 174 (12.0%) | 150 (12.2%) |
| 4:00 PM to 11:59 PM | 14 (1.0%) | 167 (13.6%) |
| Total | 1,455 (100.0%) | 1,227 (100.0%) |
Housing Occupancy in East Port Orchard
Occupancy by Ownership in East Port Orchard
Of the total 2,011 dwellings in East Port Orchard, owner-occupied units account for 1,237 (61.5%), while renter-occupied units make up 774 (38.5%).
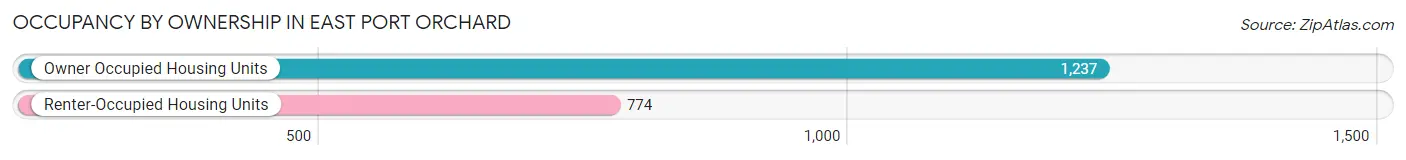
| Occupancy | # Housing Units | % Housing Units |
| Owner Occupied Housing Units | 1,237 | 61.5% |
| Renter-Occupied Housing Units | 774 | 38.5% |
| Total Occupied Housing Units | 2,011 | 100.0% |
Occupancy by Household Size in East Port Orchard
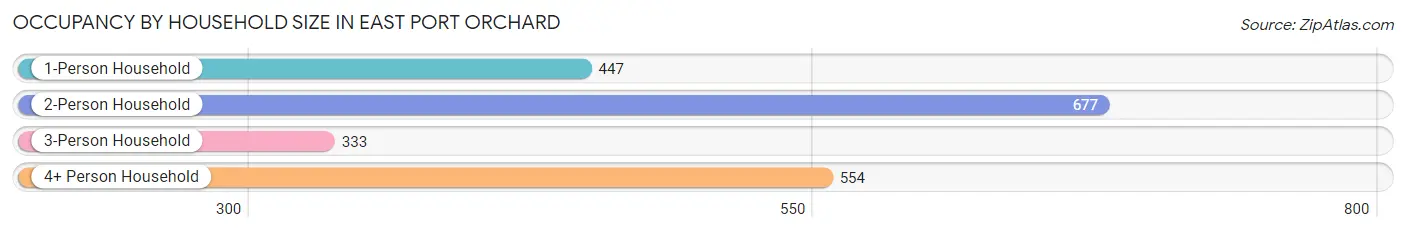
| Household Size | # Housing Units | % Housing Units |
| 1-Person Household | 447 | 22.2% |
| 2-Person Household | 677 | 33.7% |
| 3-Person Household | 333 | 16.6% |
| 4+ Person Household | 554 | 27.6% |
| Total Housing Units | 2,011 | 100.0% |
Occupancy by Ownership by Household Size in East Port Orchard
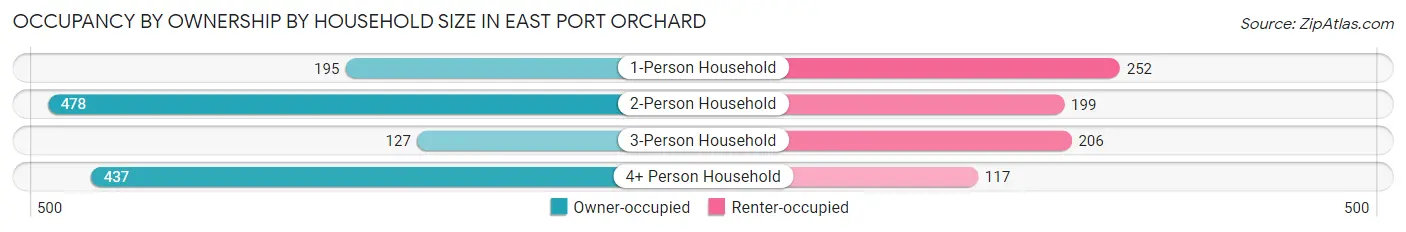
| Household Size | Owner-occupied | Renter-occupied |
| 1-Person Household | 195 (43.6%) | 252 (56.4%) |
| 2-Person Household | 478 (70.6%) | 199 (29.4%) |
| 3-Person Household | 127 (38.1%) | 206 (61.9%) |
| 4+ Person Household | 437 (78.9%) | 117 (21.1%) |
| Total Housing Units | 1,237 (61.5%) | 774 (38.5%) |
Occupancy by Educational Attainment in East Port Orchard
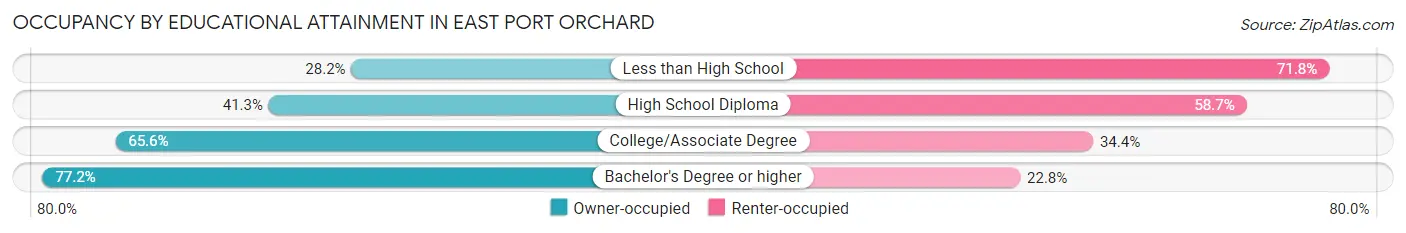
| Household Size | Owner-occupied | Renter-occupied |
| Less than High School | 29 (28.2%) | 74 (71.8%) |
| High School Diploma | 149 (41.3%) | 212 (58.7%) |
| College/Associate Degree | 765 (65.6%) | 401 (34.4%) |
| Bachelor's Degree or higher | 294 (77.2%) | 87 (22.8%) |
Occupancy by Age of Householder in East Port Orchard
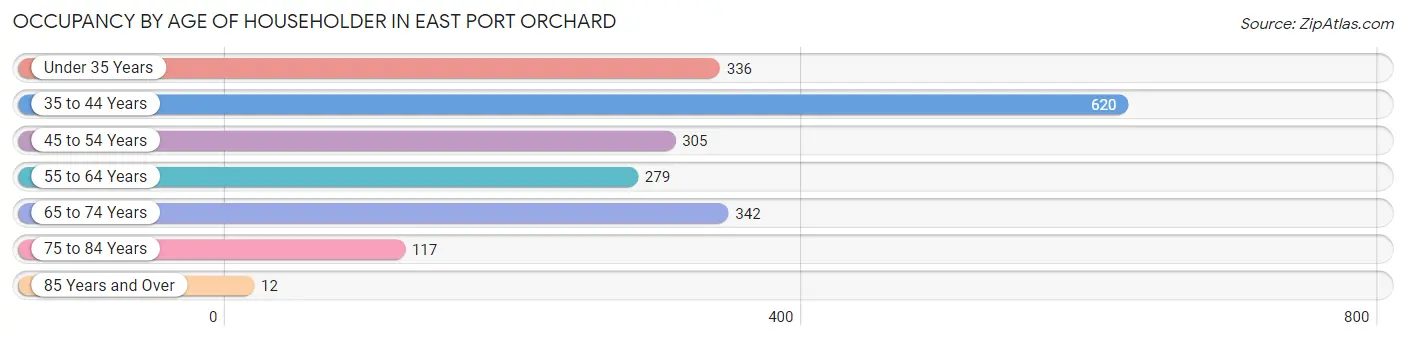
| Age Bracket | # Households | % Households |
| Under 35 Years | 336 | 16.7% |
| 35 to 44 Years | 620 | 30.8% |
| 45 to 54 Years | 305 | 15.2% |
| 55 to 64 Years | 279 | 13.9% |
| 65 to 74 Years | 342 | 17.0% |
| 75 to 84 Years | 117 | 5.8% |
| 85 Years and Over | 12 | 0.6% |
| Total | 2,011 | 100.0% |
Housing Finances in East Port Orchard
Median Income by Occupancy in East Port Orchard
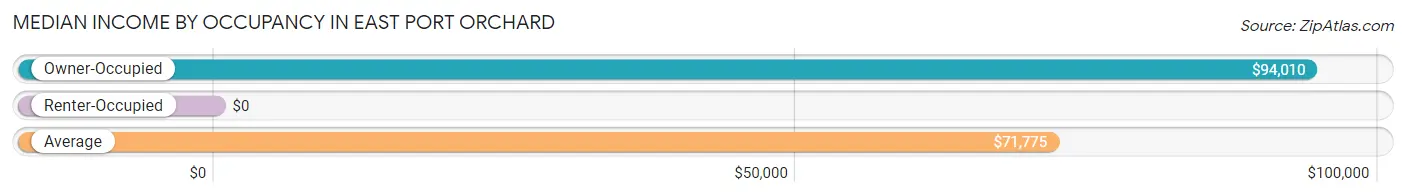
| Occupancy Type | # Households | Median Income |
| Owner-Occupied | 1,237 (61.5%) | $94,010 |
| Renter-Occupied | 774 (38.5%) | $0 |
| Average | 2,011 (100.0%) | $71,775 |
Occupancy by Householder Income Bracket in East Port Orchard
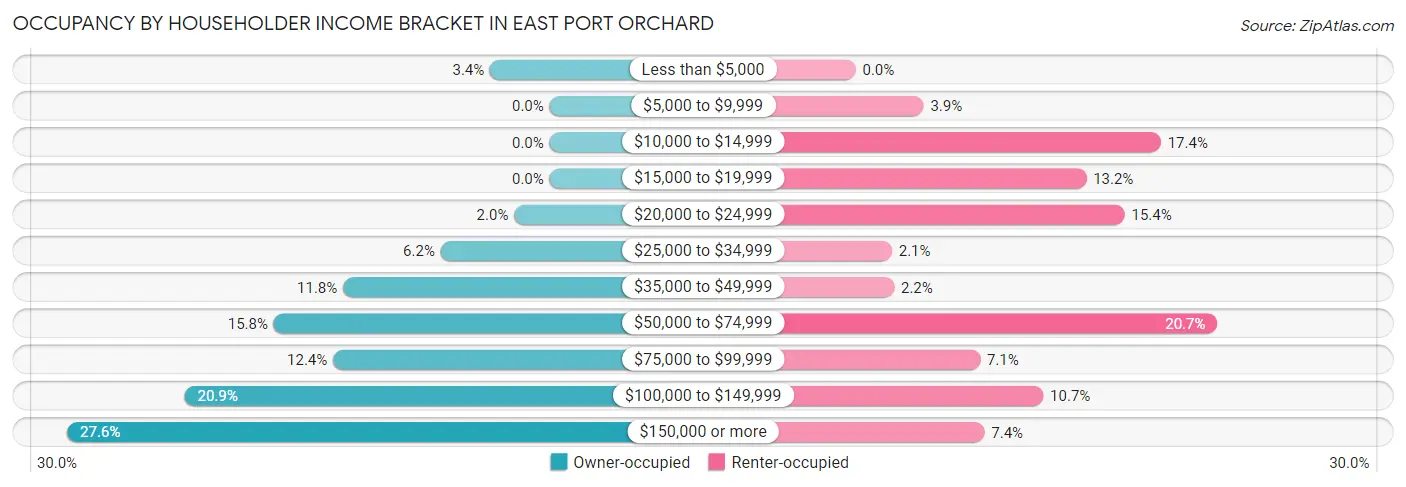
| Income Bracket | Owner-occupied | Renter-occupied |
| Less than $5,000 | 42 (3.4%) | 0 (0.0%) |
| $5,000 to $9,999 | 0 (0.0%) | 30 (3.9%) |
| $10,000 to $14,999 | 0 (0.0%) | 135 (17.4%) |
| $15,000 to $19,999 | 0 (0.0%) | 102 (13.2%) |
| $20,000 to $24,999 | 25 (2.0%) | 119 (15.4%) |
| $25,000 to $34,999 | 77 (6.2%) | 16 (2.1%) |
| $35,000 to $49,999 | 146 (11.8%) | 17 (2.2%) |
| $50,000 to $74,999 | 195 (15.8%) | 160 (20.7%) |
| $75,000 to $99,999 | 153 (12.4%) | 55 (7.1%) |
| $100,000 to $149,999 | 258 (20.9%) | 83 (10.7%) |
| $150,000 or more | 341 (27.6%) | 57 (7.4%) |
| Total | 1,237 (100.0%) | 774 (100.0%) |
Monthly Housing Cost Tiers in East Port Orchard
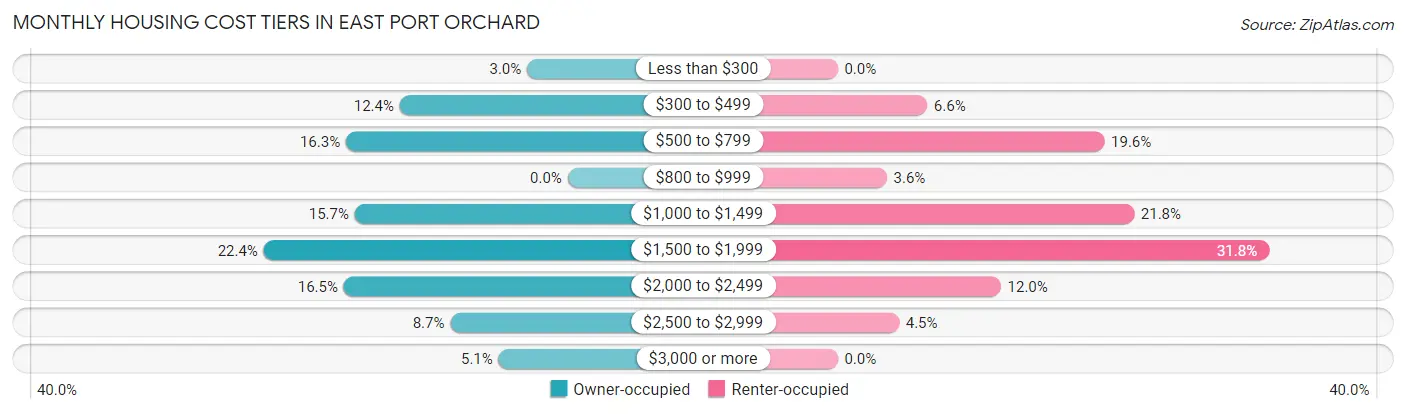
| Monthly Cost | Owner-occupied | Renter-occupied |
| Less than $300 | 37 (3.0%) | 0 (0.0%) |
| $300 to $499 | 153 (12.4%) | 51 (6.6%) |
| $500 to $799 | 202 (16.3%) | 152 (19.6%) |
| $800 to $999 | 0 (0.0%) | 28 (3.6%) |
| $1,000 to $1,499 | 194 (15.7%) | 169 (21.8%) |
| $1,500 to $1,999 | 277 (22.4%) | 246 (31.8%) |
| $2,000 to $2,499 | 204 (16.5%) | 93 (12.0%) |
| $2,500 to $2,999 | 107 (8.6%) | 35 (4.5%) |
| $3,000 or more | 63 (5.1%) | 0 (0.0%) |
| Total | 1,237 (100.0%) | 774 (100.0%) |
Physical Housing Characteristics in East Port Orchard
Housing Structures in East Port Orchard
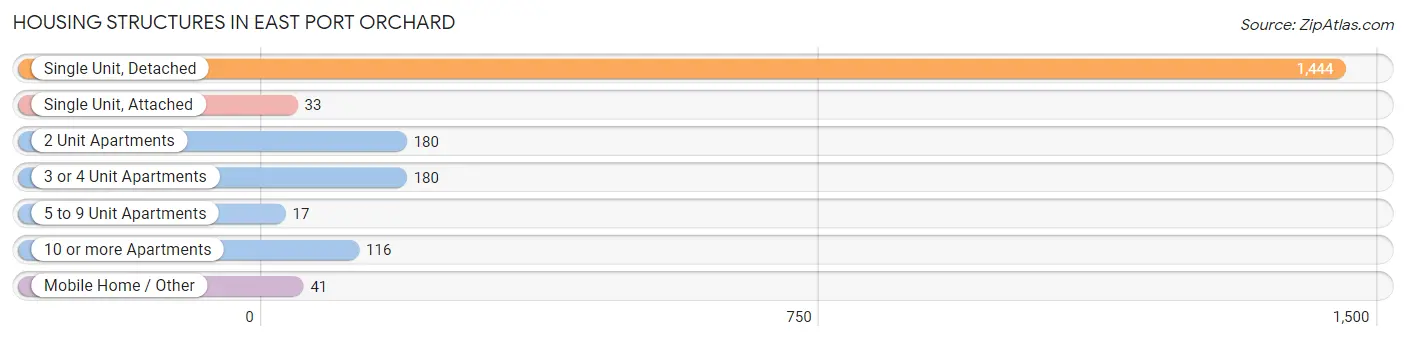
| Structure Type | # Housing Units | % Housing Units |
| Single Unit, Detached | 1,444 | 71.8% |
| Single Unit, Attached | 33 | 1.6% |
| 2 Unit Apartments | 180 | 8.9% |
| 3 or 4 Unit Apartments | 180 | 8.9% |
| 5 to 9 Unit Apartments | 17 | 0.9% |
| 10 or more Apartments | 116 | 5.8% |
| Mobile Home / Other | 41 | 2.0% |
| Total | 2,011 | 100.0% |
Housing Structures by Occupancy in East Port Orchard
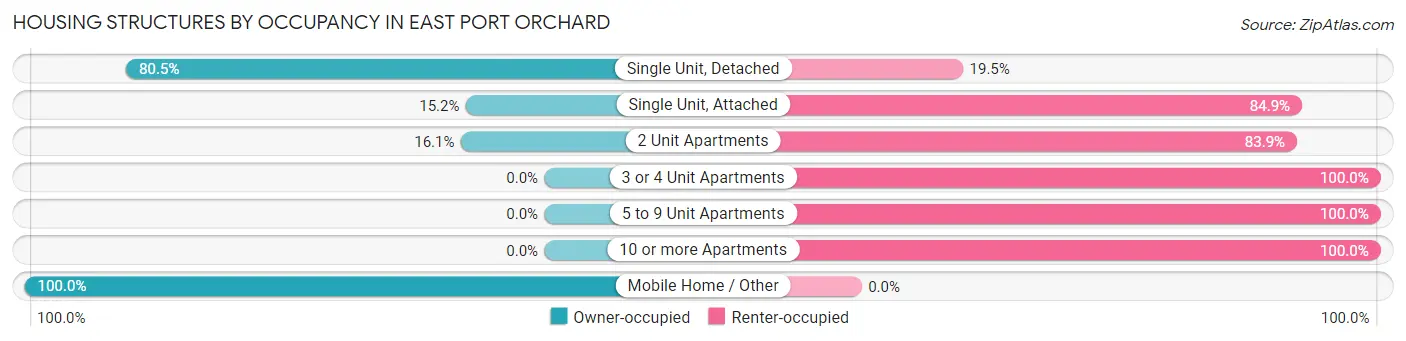
| Structure Type | Owner-occupied | Renter-occupied |
| Single Unit, Detached | 1,162 (80.5%) | 282 (19.5%) |
| Single Unit, Attached | 5 (15.1%) | 28 (84.9%) |
| 2 Unit Apartments | 29 (16.1%) | 151 (83.9%) |
| 3 or 4 Unit Apartments | 0 (0.0%) | 180 (100.0%) |
| 5 to 9 Unit Apartments | 0 (0.0%) | 17 (100.0%) |
| 10 or more Apartments | 0 (0.0%) | 116 (100.0%) |
| Mobile Home / Other | 41 (100.0%) | 0 (0.0%) |
| Total | 1,237 (61.5%) | 774 (38.5%) |
Housing Structures by Number of Rooms in East Port Orchard
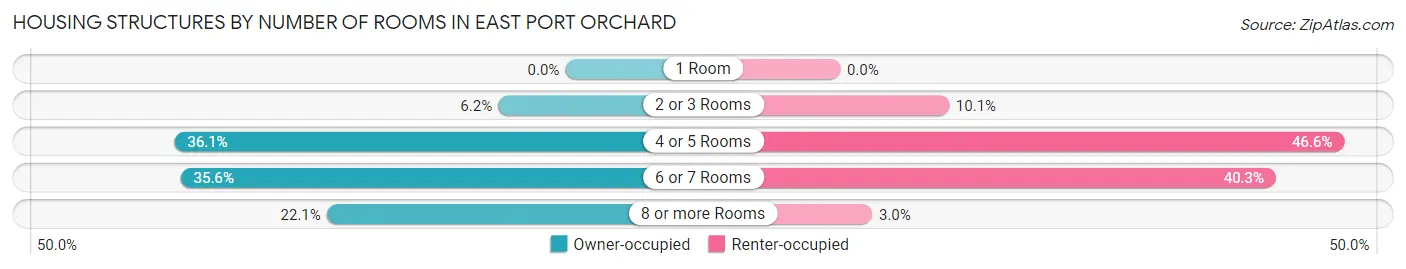
| Number of Rooms | Owner-occupied | Renter-occupied |
| 1 Room | 0 (0.0%) | 0 (0.0%) |
| 2 or 3 Rooms | 77 (6.2%) | 78 (10.1%) |
| 4 or 5 Rooms | 447 (36.1%) | 361 (46.6%) |
| 6 or 7 Rooms | 440 (35.6%) | 312 (40.3%) |
| 8 or more Rooms | 273 (22.1%) | 23 (3.0%) |
| Total | 1,237 (100.0%) | 774 (100.0%) |
Housing Structure by Heating Type in East Port Orchard
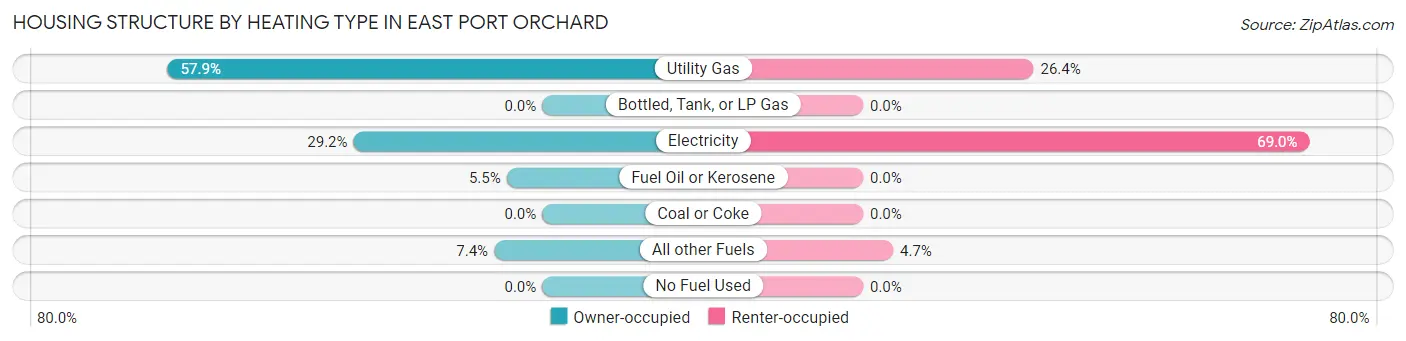
| Heating Type | Owner-occupied | Renter-occupied |
| Utility Gas | 716 (57.9%) | 204 (26.4%) |
| Bottled, Tank, or LP Gas | 0 (0.0%) | 0 (0.0%) |
| Electricity | 361 (29.2%) | 534 (69.0%) |
| Fuel Oil or Kerosene | 68 (5.5%) | 0 (0.0%) |
| Coal or Coke | 0 (0.0%) | 0 (0.0%) |
| All other Fuels | 92 (7.4%) | 36 (4.6%) |
| No Fuel Used | 0 (0.0%) | 0 (0.0%) |
| Total | 1,237 (100.0%) | 774 (100.0%) |
Household Vehicle Usage in East Port Orchard
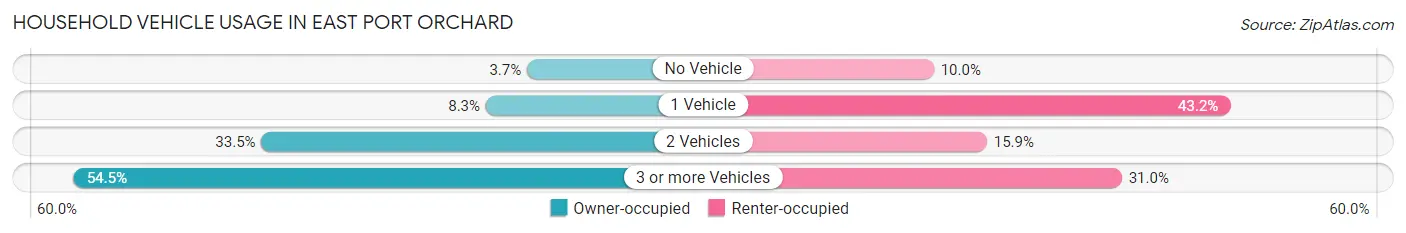
| Vehicles per Household | Owner-occupied | Renter-occupied |
| No Vehicle | 46 (3.7%) | 77 (10.0%) |
| 1 Vehicle | 103 (8.3%) | 334 (43.1%) |
| 2 Vehicles | 414 (33.5%) | 123 (15.9%) |
| 3 or more Vehicles | 674 (54.5%) | 240 (31.0%) |
| Total | 1,237 (100.0%) | 774 (100.0%) |
Real Estate & Mortgages in East Port Orchard
Real Estate and Mortgage Overview in East Port Orchard
| Characteristic | Without Mortgage | With Mortgage |
| Housing Units | 350 | 887 |
| Median Property Value | $329,800 | $337,400 |
| Median Household Income | $100,750 | $225 |
| Monthly Housing Costs | $485 | $63 |
| Real Estate Taxes | $2,497 | $27 |
Property Value by Mortgage Status in East Port Orchard
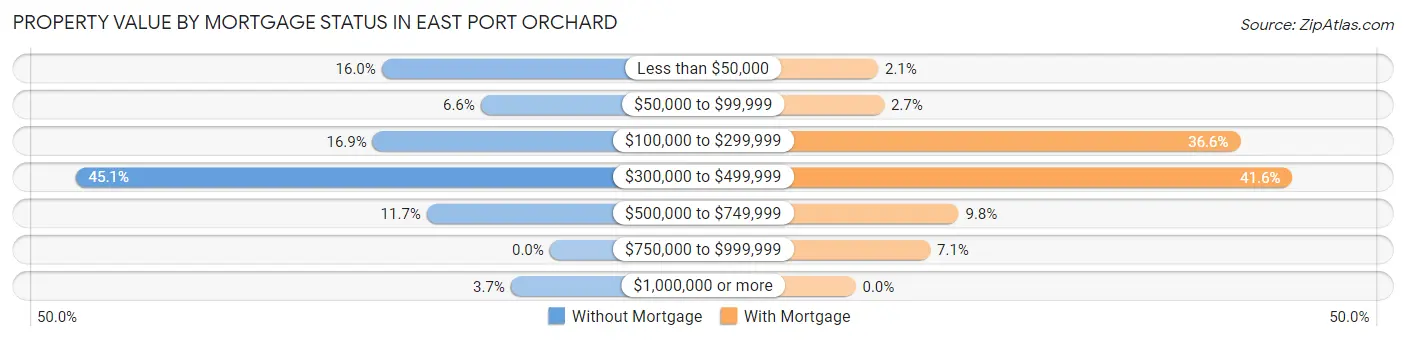
| Property Value | Without Mortgage | With Mortgage |
| Less than $50,000 | 56 (16.0%) | 19 (2.1%) |
| $50,000 to $99,999 | 23 (6.6%) | 24 (2.7%) |
| $100,000 to $299,999 | 59 (16.9%) | 325 (36.6%) |
| $300,000 to $499,999 | 158 (45.1%) | 369 (41.6%) |
| $500,000 to $749,999 | 41 (11.7%) | 87 (9.8%) |
| $750,000 to $999,999 | 0 (0.0%) | 63 (7.1%) |
| $1,000,000 or more | 13 (3.7%) | 0 (0.0%) |
| Total | 350 (100.0%) | 887 (100.0%) |
Household Income by Mortgage Status in East Port Orchard
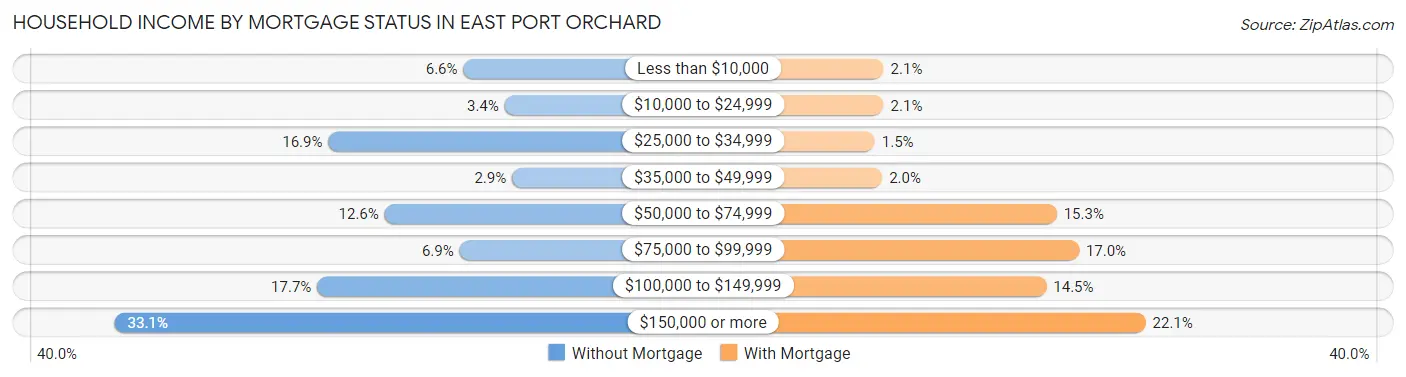
| Household Income | Without Mortgage | With Mortgage |
| Less than $10,000 | 23 (6.6%) | 19 (2.1%) |
| $10,000 to $24,999 | 12 (3.4%) | 19 (2.1%) |
| $25,000 to $34,999 | 59 (16.9%) | 13 (1.5%) |
| $35,000 to $49,999 | 10 (2.9%) | 18 (2.0%) |
| $50,000 to $74,999 | 44 (12.6%) | 136 (15.3%) |
| $75,000 to $99,999 | 24 (6.9%) | 151 (17.0%) |
| $100,000 to $149,999 | 62 (17.7%) | 129 (14.5%) |
| $150,000 or more | 116 (33.1%) | 196 (22.1%) |
| Total | 350 (100.0%) | 887 (100.0%) |
Property Value to Household Income Ratio in East Port Orchard
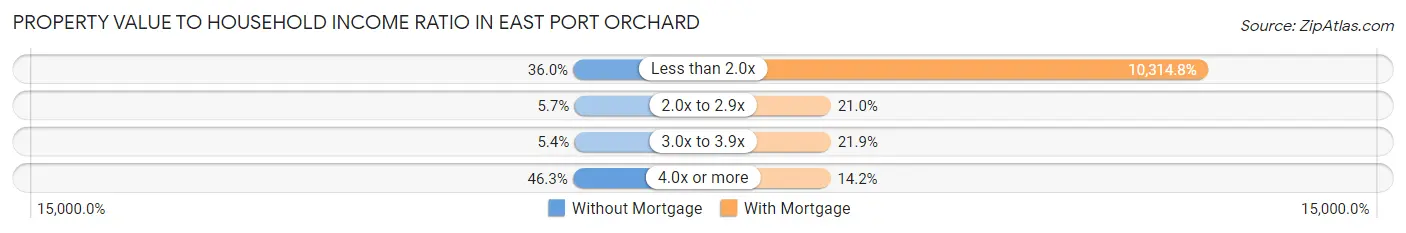
| Value-to-Income Ratio | Without Mortgage | With Mortgage |
| Less than 2.0x | 126 (36.0%) | 91,492 (10,314.8%) |
| 2.0x to 2.9x | 20 (5.7%) | 186 (21.0%) |
| 3.0x to 3.9x | 19 (5.4%) | 194 (21.9%) |
| 4.0x or more | 162 (46.3%) | 126 (14.2%) |
| Total | 350 (100.0%) | 887 (100.0%) |
Real Estate Taxes by Mortgage Status in East Port Orchard
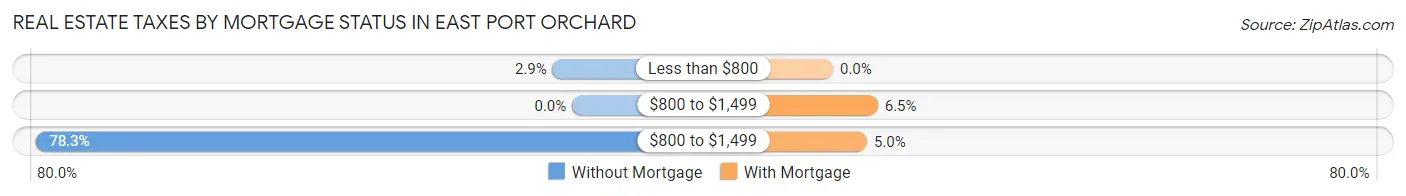
| Property Taxes | Without Mortgage | With Mortgage |
| Less than $800 | 10 (2.9%) | 0 (0.0%) |
| $800 to $1,499 | 0 (0.0%) | 58 (6.5%) |
| $800 to $1,499 | 274 (78.3%) | 44 (5.0%) |
| Total | 350 (100.0%) | 887 (100.0%) |
Health & Disability in East Port Orchard
Health Insurance Coverage by Age in East Port Orchard
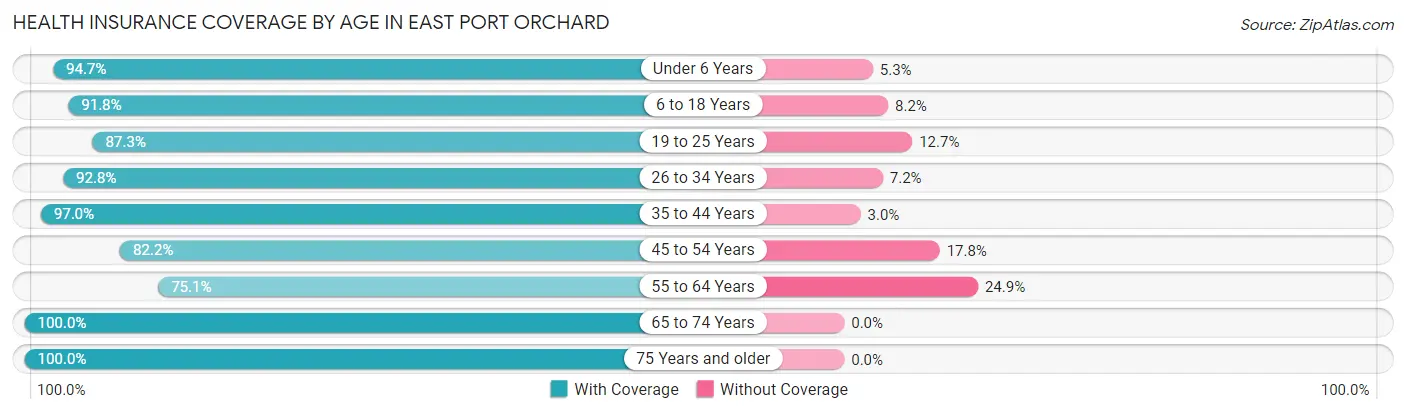
| Age Bracket | With Coverage | Without Coverage |
| Under 6 Years | 267 (94.7%) | 15 (5.3%) |
| 6 to 18 Years | 877 (91.8%) | 78 (8.2%) |
| 19 to 25 Years | 517 (87.3%) | 75 (12.7%) |
| 26 to 34 Years | 516 (92.8%) | 40 (7.2%) |
| 35 to 44 Years | 893 (97.0%) | 28 (3.0%) |
| 45 to 54 Years | 536 (82.2%) | 116 (17.8%) |
| 55 to 64 Years | 521 (75.1%) | 173 (24.9%) |
| 65 to 74 Years | 518 (100.0%) | 0 (0.0%) |
| 75 Years and older | 171 (100.0%) | 0 (0.0%) |
| Total | 4,816 (90.2%) | 525 (9.8%) |
Health Insurance Coverage by Citizenship Status in East Port Orchard
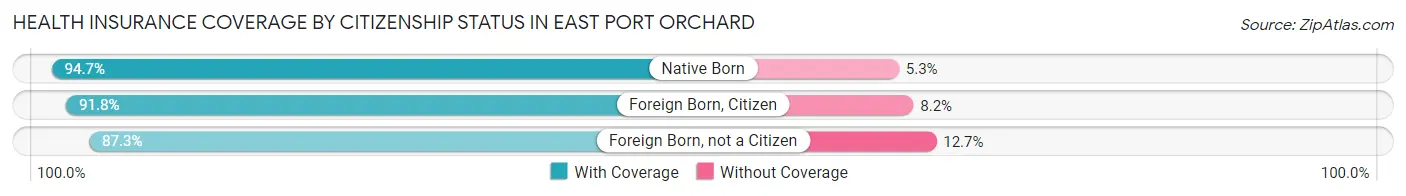
| Citizenship Status | With Coverage | Without Coverage |
| Native Born | 267 (94.7%) | 15 (5.3%) |
| Foreign Born, Citizen | 877 (91.8%) | 78 (8.2%) |
| Foreign Born, not a Citizen | 517 (87.3%) | 75 (12.7%) |
Health Insurance Coverage by Household Income in East Port Orchard
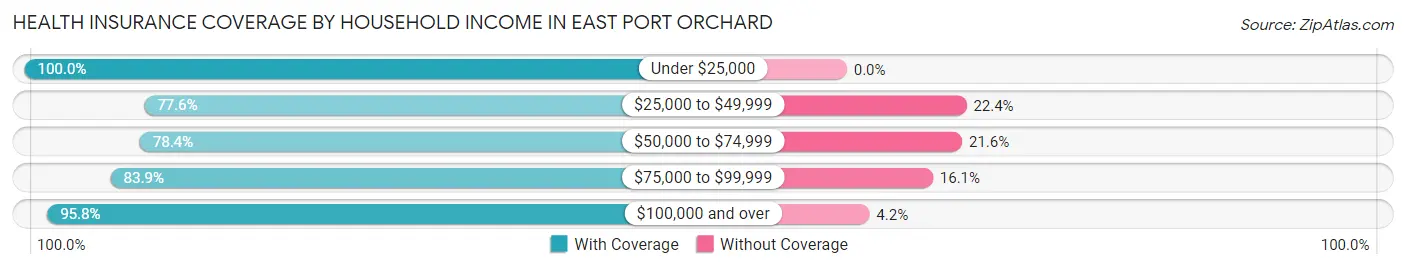
| Household Income | With Coverage | Without Coverage |
| Under $25,000 | 731 (100.0%) | 0 (0.0%) |
| $25,000 to $49,999 | 443 (77.6%) | 128 (22.4%) |
| $50,000 to $74,999 | 715 (78.4%) | 197 (21.6%) |
| $75,000 to $99,999 | 484 (83.9%) | 93 (16.1%) |
| $100,000 and over | 2,415 (95.8%) | 107 (4.2%) |
Public vs Private Health Insurance Coverage by Age in East Port Orchard
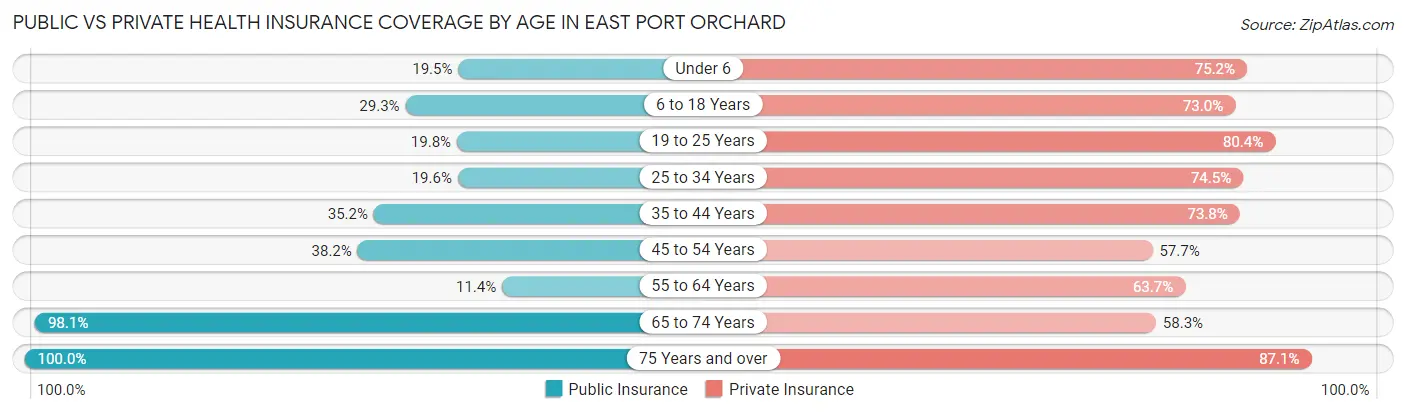
| Age Bracket | Public Insurance | Private Insurance |
| Under 6 | 55 (19.5%) | 212 (75.2%) |
| 6 to 18 Years | 280 (29.3%) | 697 (73.0%) |
| 19 to 25 Years | 117 (19.8%) | 476 (80.4%) |
| 25 to 34 Years | 109 (19.6%) | 414 (74.5%) |
| 35 to 44 Years | 324 (35.2%) | 680 (73.8%) |
| 45 to 54 Years | 249 (38.2%) | 376 (57.7%) |
| 55 to 64 Years | 79 (11.4%) | 442 (63.7%) |
| 65 to 74 Years | 508 (98.1%) | 302 (58.3%) |
| 75 Years and over | 171 (100.0%) | 149 (87.1%) |
| Total | 1,892 (35.4%) | 3,748 (70.2%) |
Disability Status by Sex by Age in East Port Orchard
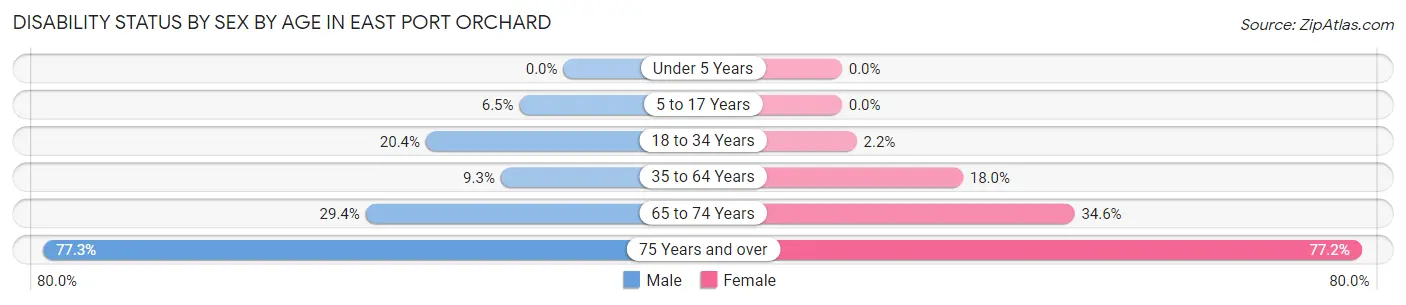
| Age Bracket | Male | Female |
| Under 5 Years | 0 (0.0%) | 0 (0.0%) |
| 5 to 17 Years | 32 (6.5%) | 0 (0.0%) |
| 18 to 34 Years | 146 (20.4%) | 10 (2.2%) |
| 35 to 64 Years | 99 (9.3%) | 216 (18.0%) |
| 65 to 74 Years | 96 (29.4%) | 66 (34.5%) |
| 75 Years and over | 34 (77.3%) | 98 (77.2%) |
Disability Class by Sex by Age in East Port Orchard
Disability Class: Hearing Difficulty
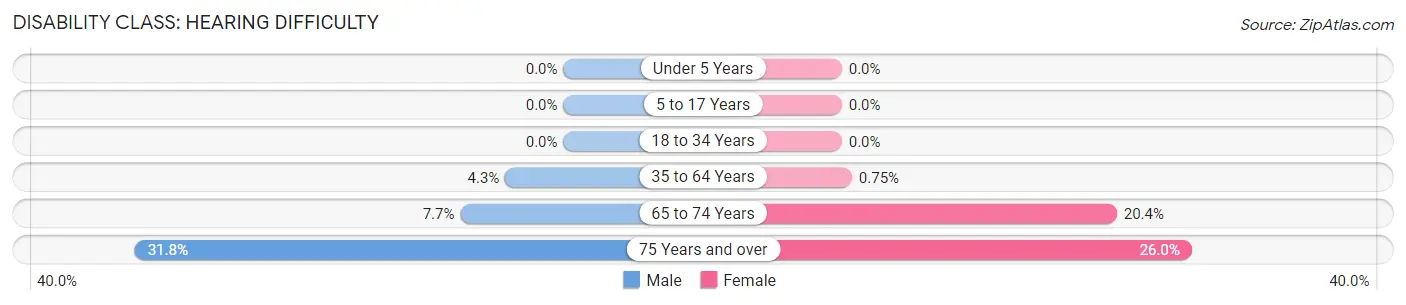
| Age Bracket | Male | Female |
| Under 5 Years | 0 (0.0%) | 0 (0.0%) |
| 5 to 17 Years | 0 (0.0%) | 0 (0.0%) |
| 18 to 34 Years | 0 (0.0%) | 0 (0.0%) |
| 35 to 64 Years | 46 (4.3%) | 9 (0.7%) |
| 65 to 74 Years | 25 (7.6%) | 39 (20.4%) |
| 75 Years and over | 14 (31.8%) | 33 (26.0%) |
Disability Class: Vision Difficulty
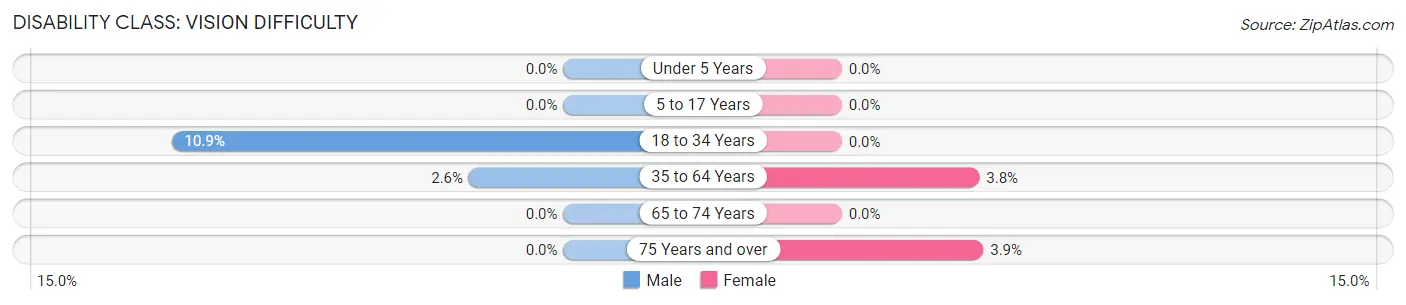
| Age Bracket | Male | Female |
| Under 5 Years | 0 (0.0%) | 0 (0.0%) |
| 5 to 17 Years | 0 (0.0%) | 0 (0.0%) |
| 18 to 34 Years | 78 (10.9%) | 0 (0.0%) |
| 35 to 64 Years | 28 (2.6%) | 46 (3.8%) |
| 65 to 74 Years | 0 (0.0%) | 0 (0.0%) |
| 75 Years and over | 0 (0.0%) | 5 (3.9%) |
Disability Class: Cognitive Difficulty
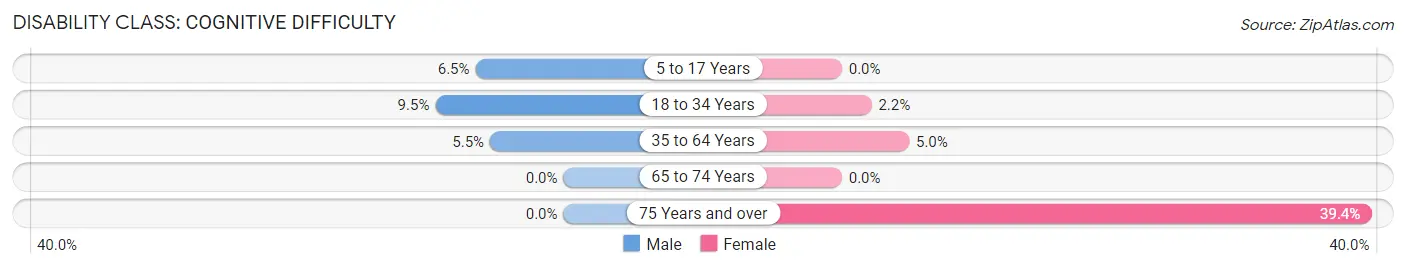
| Age Bracket | Male | Female |
| 5 to 17 Years | 32 (6.5%) | 0 (0.0%) |
| 18 to 34 Years | 68 (9.5%) | 10 (2.2%) |
| 35 to 64 Years | 58 (5.4%) | 60 (5.0%) |
| 65 to 74 Years | 0 (0.0%) | 0 (0.0%) |
| 75 Years and over | 0 (0.0%) | 50 (39.4%) |
Disability Class: Ambulatory Difficulty
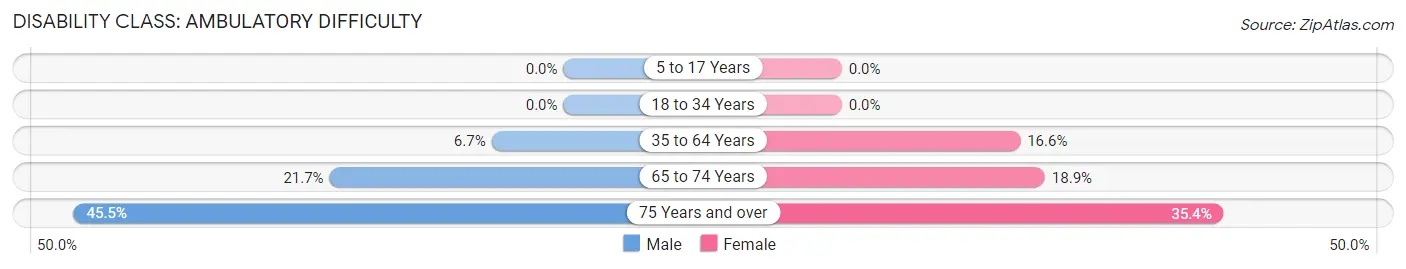
| Age Bracket | Male | Female |
| 5 to 17 Years | 0 (0.0%) | 0 (0.0%) |
| 18 to 34 Years | 0 (0.0%) | 0 (0.0%) |
| 35 to 64 Years | 71 (6.7%) | 199 (16.6%) |
| 65 to 74 Years | 71 (21.7%) | 36 (18.9%) |
| 75 Years and over | 20 (45.5%) | 45 (35.4%) |
Disability Class: Self-Care Difficulty
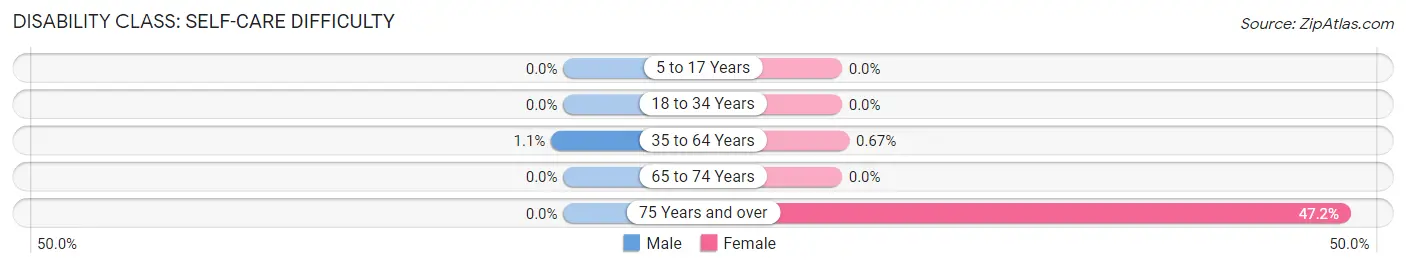
| Age Bracket | Male | Female |
| 5 to 17 Years | 0 (0.0%) | 0 (0.0%) |
| 18 to 34 Years | 0 (0.0%) | 0 (0.0%) |
| 35 to 64 Years | 12 (1.1%) | 8 (0.7%) |
| 65 to 74 Years | 0 (0.0%) | 0 (0.0%) |
| 75 Years and over | 0 (0.0%) | 60 (47.2%) |
Technology Access in East Port Orchard
Computing Device Access in East Port Orchard
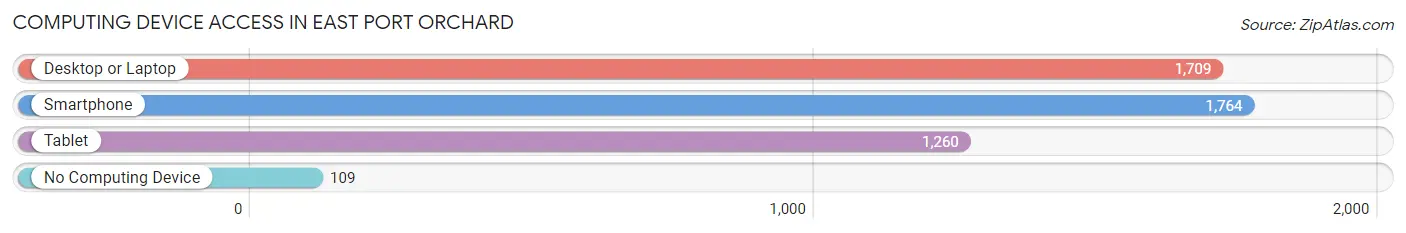
| Device Type | # Households | % Households |
| Desktop or Laptop | 1,709 | 85.0% |
| Smartphone | 1,764 | 87.7% |
| Tablet | 1,260 | 62.7% |
| No Computing Device | 109 | 5.4% |
| Total | 2,011 | 100.0% |
Internet Access in East Port Orchard
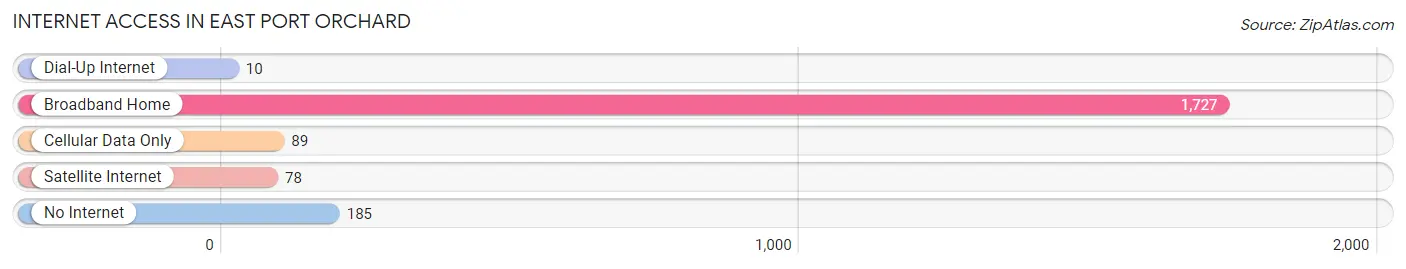
| Internet Type | # Households | % Households |
| Dial-Up Internet | 10 | 0.5% |
| Broadband Home | 1,727 | 85.9% |
| Cellular Data Only | 89 | 4.4% |
| Satellite Internet | 78 | 3.9% |
| No Internet | 185 | 9.2% |
| Total | 2,011 | 100.0% |
East Port Orchard Summary
East Port Orchard is a small unincorporated community located in Kitsap County, Washington, United States. It is situated on the eastern shore of Sinclair Inlet, just south of the city of Port Orchard. The population of East Port Orchard was estimated to be 1,845 in 2019.
History
East Port Orchard was first settled in the late 1800s by homesteaders who were attracted to the area by its abundant natural resources. The area was originally known as "East Port" and was part of the larger Port Orchard community. In the early 1900s, the area was renamed East Port Orchard to distinguish it from the larger Port Orchard community.
The area was primarily agricultural until the 1950s, when the construction of the Hood Canal Bridge and the development of the nearby Naval Base Kitsap-Bangor brought an influx of new residents and businesses to the area. The population of East Port Orchard has grown steadily since then, and the area is now home to a variety of businesses, including restaurants, retail stores, and professional services.
Geography
East Port Orchard is located on the eastern shore of Sinclair Inlet, just south of the city of Port Orchard. The area is bordered by the Kitsap Peninsula to the west, the Olympic Mountains to the east, and the Puget Sound to the south. The area is characterized by rolling hills, forests, and wetlands.
Economy
East Port Orchard is primarily a residential community, but it is also home to a variety of businesses, including restaurants, retail stores, and professional services. The area is also home to several marinas, which provide access to the Puget Sound and the nearby Hood Canal.
Demographics
As of 2019, the population of East Port Orchard was estimated to be 1,845. The population is primarily white (90.2%), with smaller percentages of Hispanic (3.2%), Asian (2.2%), and African American (1.2%) residents. The median household income in East Port Orchard is $60,945, and the median home value is $310,000. The area is served by the South Kitsap School District.
Common Questions
What is Per Capita Income in East Port Orchard?
Per Capita income in East Port Orchard is $41,719.
What is the Median Family Income in East Port Orchard?
Median Family Income in East Port Orchard is $100,104.
What is the Median Household income in East Port Orchard?
Median Household Income in East Port Orchard is $71,775.
What is Income or Wage Gap in East Port Orchard?
Income or Wage Gap in East Port Orchard is 24.1%.
Women in East Port Orchard earn 75.9 cents for every dollar earned by a man.
What is Inequality or Gini Index in East Port Orchard?
Inequality or Gini Index in East Port Orchard is 0.52.
What is the Total Population of East Port Orchard?
Total Population of East Port Orchard is 5,501.
What is the Total Male Population of East Port Orchard?
Total Male Population of East Port Orchard is 2,890.
What is the Total Female Population of East Port Orchard?
Total Female Population of East Port Orchard is 2,611.
What is the Ratio of Males per 100 Females in East Port Orchard?
There are 110.69 Males per 100 Females in East Port Orchard.
What is the Ratio of Females per 100 Males in East Port Orchard?
There are 90.35 Females per 100 Males in East Port Orchard.
What is the Median Population Age in East Port Orchard?
Median Population Age in East Port Orchard is 36.4 Years.
What is the Average Family Size in East Port Orchard
Average Family Size in East Port Orchard is 3.1 People.
What is the Average Household Size in East Port Orchard
Average Household Size in East Port Orchard is 2.7 People.
How Large is the Labor Force in East Port Orchard?
There are 3,008 People in the Labor Forcein in East Port Orchard.
What is the Percentage of People in the Labor Force in East Port Orchard?
67.3% of People are in the Labor Force in East Port Orchard.
What is the Unemployment Rate in East Port Orchard?
Unemployment Rate in East Port Orchard is 6.3%.