Kent, WA Map & Demographics
Kent Map
Kent Overview
$39,714
PER CAPITA INCOME
$97,310
AVG FAMILY INCOME
$86,966
AVG HOUSEHOLD INCOME
18.0%
WAGE / INCOME GAP [ % ]
82.0¢/ $1
WAGE / INCOME GAP [ $ ]
$11,971
FAMILY INCOME DEFICIT
0.42
INEQUALITY / GINI INDEX
135,169
TOTAL POPULATION
69,099
MALE POPULATION
66,070
FEMALE POPULATION
104.58
MALES / 100 FEMALES
95.62
FEMALES / 100 MALES
34.7
MEDIAN AGE
3.5
AVG FAMILY SIZE
2.9
AVG HOUSEHOLD SIZE
73,169
LABOR FORCE [ PEOPLE ]
69.7%
PERCENT IN LABOR FORCE
7.6%
UNEMPLOYMENT RATE
Income in Kent
Income Overview in Kent
Per Capita Income in Kent is $39,714, while median incomes of families and households are $97,310 and $86,966 respectively.
| Characteristic | Number | Measure |
| Per Capita Income | 135,169 | $39,714 |
| Median Family Income | 31,457 | $97,310 |
| Mean Family Income | 31,457 | $121,593 |
| Median Household Income | 45,699 | $86,966 |
| Mean Household Income | 45,699 | $113,369 |
| Income Deficit | 31,457 | $11,971 |
| Wage / Income Gap (%) | 135,169 | 18.04% |
| Wage / Income Gap ($) | 135,169 | 81.96¢ per $1 |
| Gini / Inequality Index | 135,169 | 0.42 |
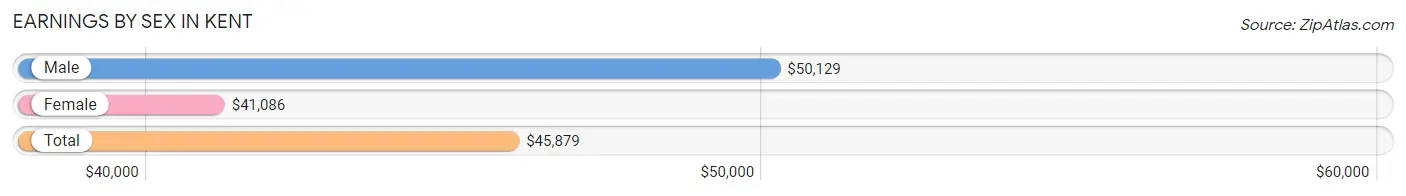
Earnings by Sex in Kent
Average Earnings in Kent are $45,879, $50,129 for men and $41,086 for women, a difference of 18.0%.
| Sex | Number | Average Earnings |
| Male | 41,218 (54.2%) | $50,129 |
| Female | 34,769 (45.8%) | $41,086 |
| Total | 75,987 (100.0%) | $45,879 |
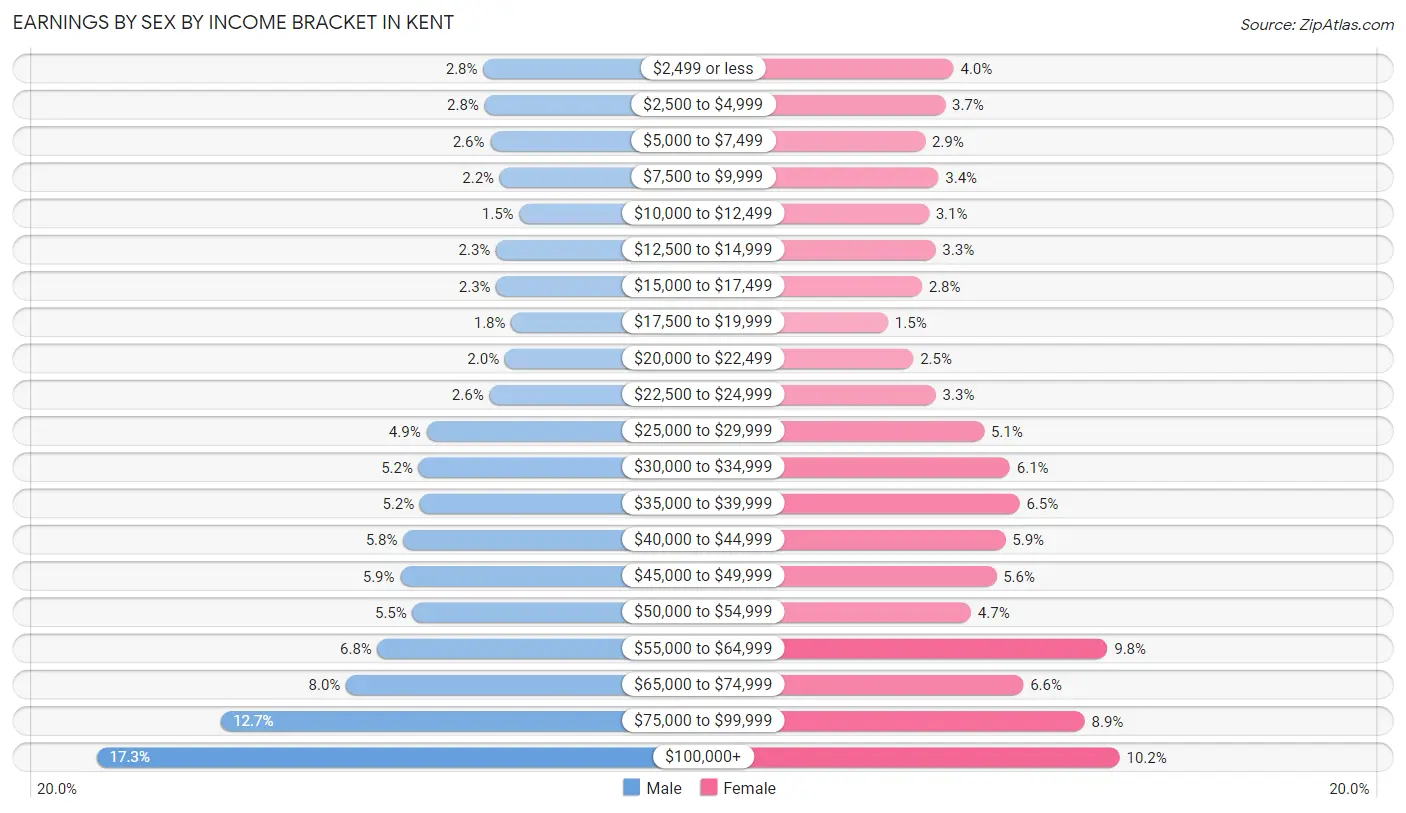
Earnings by Sex by Income Bracket in Kent
The most common earnings brackets in Kent are $100,000+ for men (7,130 | 17.3%) and $100,000+ for women (3,552 | 10.2%).
| Income | Male | Female |
| $2,499 or less | 1,158 (2.8%) | 1,390 (4.0%) |
| $2,500 to $4,999 | 1,137 (2.8%) | 1,278 (3.7%) |
| $5,000 to $7,499 | 1,053 (2.5%) | 1,017 (2.9%) |
| $7,500 to $9,999 | 903 (2.2%) | 1,192 (3.4%) |
| $10,000 to $12,499 | 603 (1.5%) | 1,066 (3.1%) |
| $12,500 to $14,999 | 961 (2.3%) | 1,154 (3.3%) |
| $15,000 to $17,499 | 956 (2.3%) | 977 (2.8%) |
| $17,500 to $19,999 | 725 (1.8%) | 536 (1.5%) |
| $20,000 to $22,499 | 823 (2.0%) | 867 (2.5%) |
| $22,500 to $24,999 | 1,065 (2.6%) | 1,159 (3.3%) |
| $25,000 to $29,999 | 2,038 (4.9%) | 1,788 (5.1%) |
| $30,000 to $34,999 | 2,154 (5.2%) | 2,126 (6.1%) |
| $35,000 to $39,999 | 2,136 (5.2%) | 2,248 (6.5%) |
| $40,000 to $44,999 | 2,394 (5.8%) | 2,067 (5.9%) |
| $45,000 to $49,999 | 2,439 (5.9%) | 1,947 (5.6%) |
| $50,000 to $54,999 | 2,252 (5.5%) | 1,616 (4.6%) |
| $55,000 to $64,999 | 2,791 (6.8%) | 3,395 (9.8%) |
| $65,000 to $74,999 | 3,276 (8.0%) | 2,297 (6.6%) |
| $75,000 to $99,999 | 5,224 (12.7%) | 3,097 (8.9%) |
| $100,000+ | 7,130 (17.3%) | 3,552 (10.2%) |
| Total | 41,218 (100.0%) | 34,769 (100.0%) |
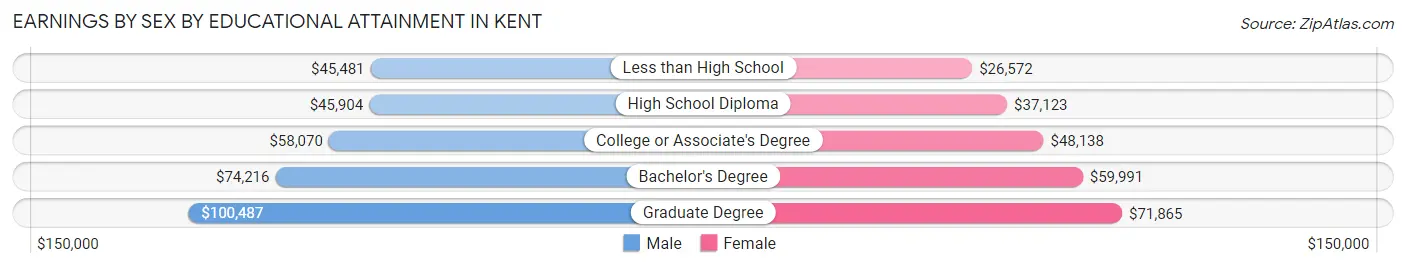
Earnings by Sex by Educational Attainment in Kent
Average earnings in Kent are $55,910 for men and $46,467 for women, a difference of 16.9%. Men with an educational attainment of graduate degree enjoy the highest average annual earnings of $100,487, while those with less than high school education earn the least with $45,481. Women with an educational attainment of graduate degree earn the most with the average annual earnings of $71,865, while those with less than high school education have the smallest earnings of $26,572.
| Educational Attainment | Male Income | Female Income |
| Less than High School | $45,481 | $26,572 |
| High School Diploma | $45,904 | $37,123 |
| College or Associate's Degree | $58,070 | $48,138 |
| Bachelor's Degree | $74,216 | $59,991 |
| Graduate Degree | $100,487 | $71,865 |
| Total | $55,910 | $46,467 |
Family Income in Kent
Family Income Brackets in Kent
According to the Kent family income data, there are 6,732 families falling into the $100,000 to $149,999 income range, which is the most common income bracket and makes up 21.4% of all families. Conversely, the $10,000 to $14,999 income bracket is the least frequent group with only 503 families (1.6%) belonging to this category.
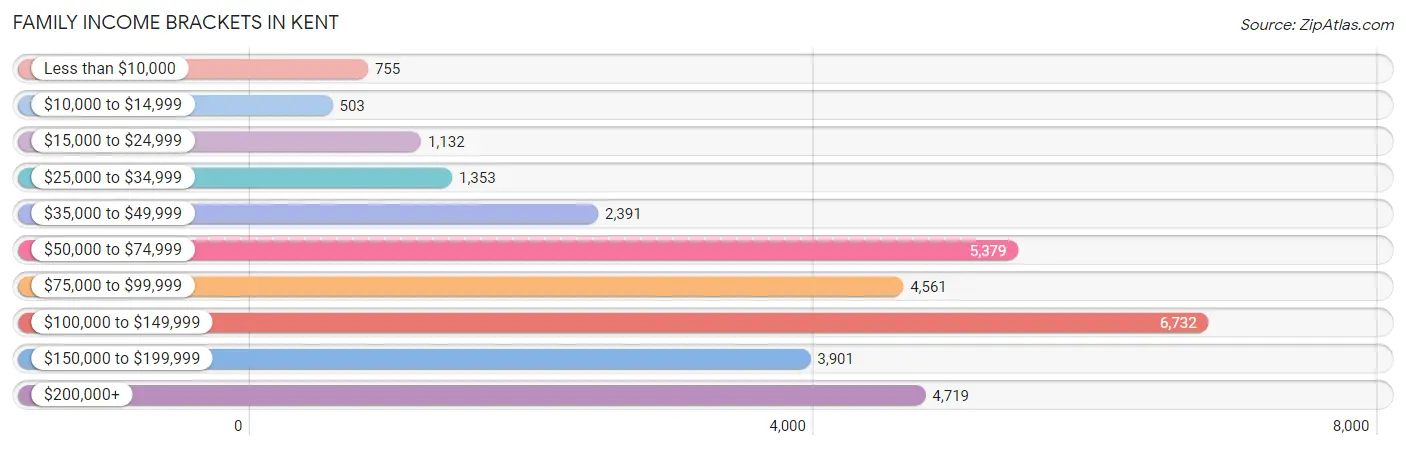
| Income Bracket | # Families | % Families |
| Less than $10,000 | 755 | 2.4% |
| $10,000 to $14,999 | 503 | 1.6% |
| $15,000 to $24,999 | 1,132 | 3.6% |
| $25,000 to $34,999 | 1,353 | 4.3% |
| $35,000 to $49,999 | 2,391 | 7.6% |
| $50,000 to $74,999 | 5,379 | 17.1% |
| $75,000 to $99,999 | 4,561 | 14.5% |
| $100,000 to $149,999 | 6,732 | 21.4% |
| $150,000 to $199,999 | 3,901 | 12.4% |
| $200,000+ | 4,719 | 15.0% |
Family Income by Famaliy Size in Kent
6-person families (1,158 | 3.7%) account for the highest median family income in Kent with $133,935 per family, while 2-person families (11,575 | 36.8%) have the highest median income of $44,998 per family member.
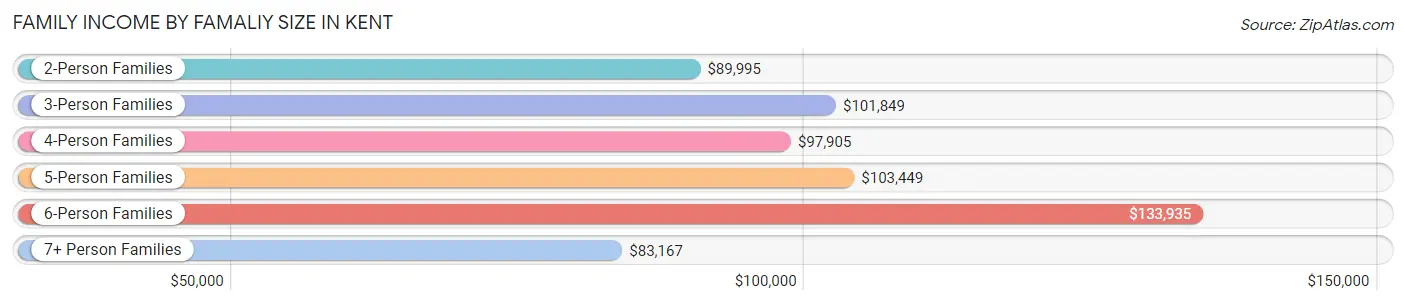
| Income Bracket | # Families | Median Income |
| 2-Person Families | 11,575 (36.8%) | $89,995 |
| 3-Person Families | 6,717 (21.3%) | $101,849 |
| 4-Person Families | 6,962 (22.1%) | $97,905 |
| 5-Person Families | 3,527 (11.2%) | $103,449 |
| 6-Person Families | 1,158 (3.7%) | $133,935 |
| 7+ Person Families | 1,518 (4.8%) | $83,167 |
| Total | 31,457 (100.0%) | $97,310 |
Family Income by Number of Earners in Kent
The median family income in Kent is $97,310, with families comprising 3+ earners (5,333) having the highest median family income of $162,445, while families with no earners (2,488) have the lowest median family income of $57,500, accounting for 17.0% and 7.9% of families, respectively.
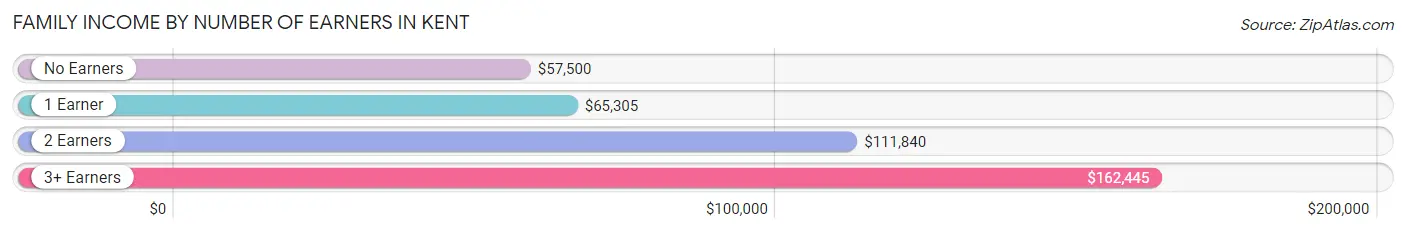
| Number of Earners | # Families | Median Income |
| No Earners | 2,488 (7.9%) | $57,500 |
| 1 Earner | 9,808 (31.2%) | $65,305 |
| 2 Earners | 13,828 (44.0%) | $111,840 |
| 3+ Earners | 5,333 (17.0%) | $162,445 |
| Total | 31,457 (100.0%) | $97,310 |
Household Income in Kent
Household Income Brackets in Kent
With 9,551 households falling in the category, the $100,000 to $149,999 income range is the most frequent in Kent, accounting for 20.9% of all households. In contrast, only 1,005 households (2.2%) fall into the $10,000 to $14,999 income bracket, making it the least populous group.
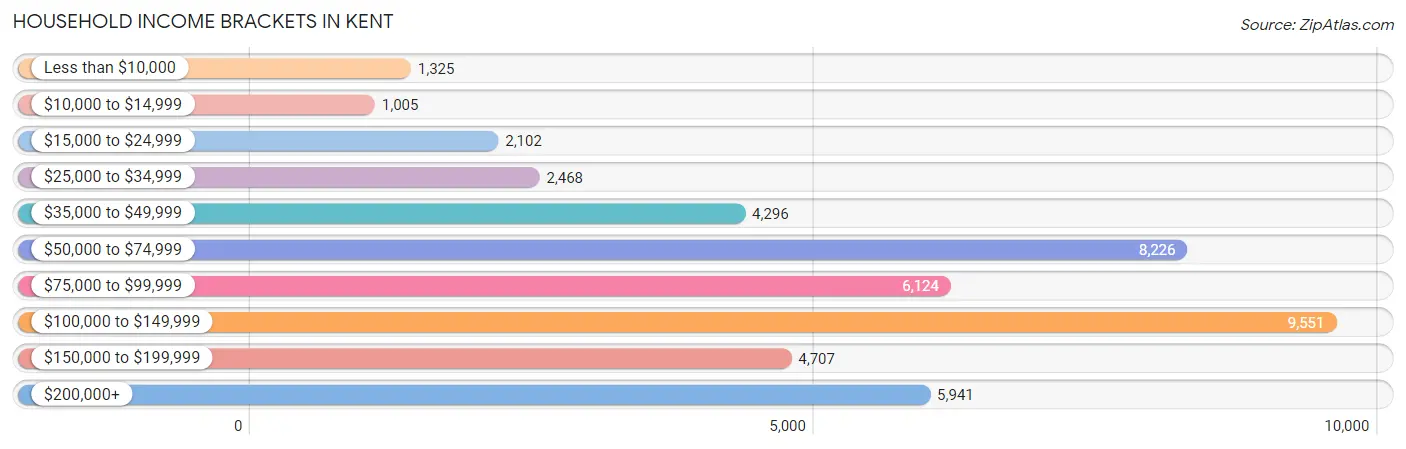
| Income Bracket | # Households | % Households |
| Less than $10,000 | 1,325 | 2.9% |
| $10,000 to $14,999 | 1,005 | 2.2% |
| $15,000 to $24,999 | 2,102 | 4.6% |
| $25,000 to $34,999 | 2,468 | 5.4% |
| $35,000 to $49,999 | 4,296 | 9.4% |
| $50,000 to $74,999 | 8,226 | 18.0% |
| $75,000 to $99,999 | 6,124 | 13.4% |
| $100,000 to $149,999 | 9,551 | 20.9% |
| $150,000 to $199,999 | 4,707 | 10.3% |
| $200,000+ | 5,941 | 13.0% |
Household Income by Householder Age in Kent
The median household income in Kent is $86,966, with the highest median household income of $106,276 found in the 45 to 64 years age bracket for the primary householder. A total of 17,195 households (37.6%) fall into this category. Meanwhile, the 15 to 24 years age bracket for the primary householder has the lowest median household income of $57,467, with 1,531 households (3.4%) in this group.
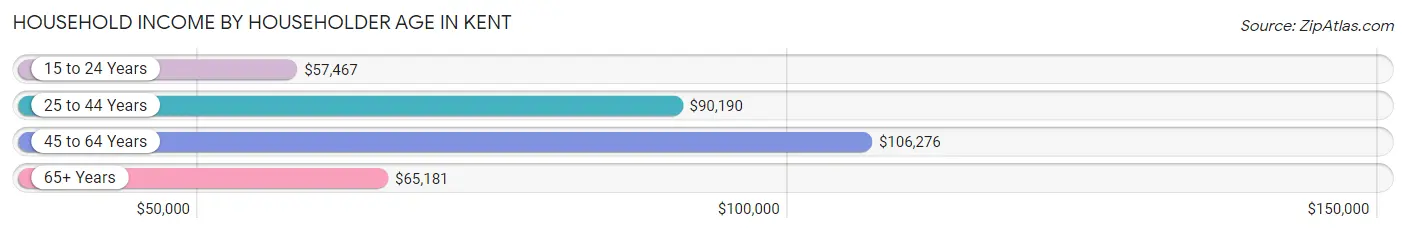
| Income Bracket | # Households | Median Income |
| 15 to 24 Years | 1,531 (3.4%) | $57,467 |
| 25 to 44 Years | 19,343 (42.3%) | $90,190 |
| 45 to 64 Years | 17,195 (37.6%) | $106,276 |
| 65+ Years | 7,630 (16.7%) | $65,181 |
| Total | 45,699 (100.0%) | $86,966 |
Poverty in Kent
Income Below Poverty by Sex and Age in Kent
With 9.1% poverty level for males and 11.9% for females among the residents of Kent, 5 year old males and 5 year old females are the most vulnerable to poverty, with 271 males (25.2%) and 275 females (23.3%) in their respective age groups living below the poverty level.
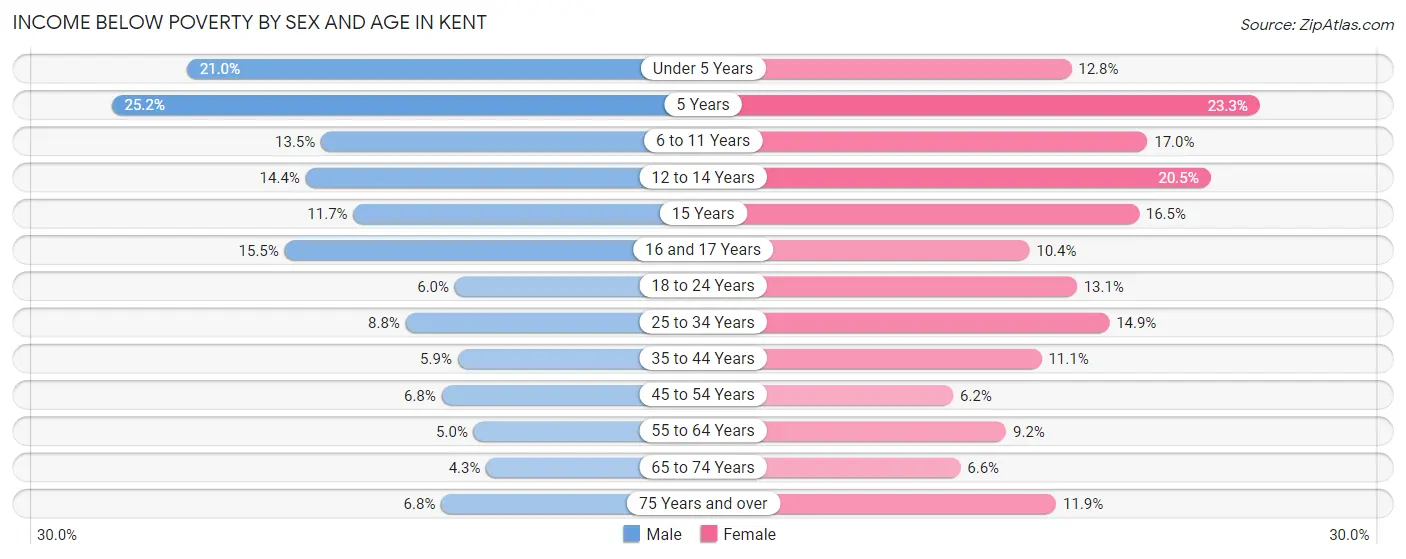
| Age Bracket | Male | Female |
| Under 5 Years | 1,008 (21.0%) | 470 (12.8%) |
| 5 Years | 271 (25.2%) | 275 (23.3%) |
| 6 to 11 Years | 841 (13.5%) | 905 (17.0%) |
| 12 to 14 Years | 467 (14.3%) | 524 (20.5%) |
| 15 Years | 106 (11.7%) | 113 (16.5%) |
| 16 and 17 Years | 277 (15.5%) | 131 (10.4%) |
| 18 to 24 Years | 391 (6.0%) | 818 (13.1%) |
| 25 to 34 Years | 1,021 (8.8%) | 1,542 (14.9%) |
| 35 to 44 Years | 578 (5.9%) | 1,066 (11.1%) |
| 45 to 54 Years | 548 (6.8%) | 496 (6.2%) |
| 55 to 64 Years | 387 (5.0%) | 780 (9.1%) |
| 65 to 74 Years | 165 (4.3%) | 335 (6.6%) |
| 75 Years and over | 161 (6.8%) | 364 (11.9%) |
| Total | 6,221 (9.1%) | 7,819 (11.9%) |
Income Above Poverty by Sex and Age in Kent
According to the poverty statistics in Kent, males aged 65 to 74 years and females aged 45 to 54 years are the age groups that are most secure financially, with 95.7% of males and 93.8% of females in these age groups living above the poverty line.
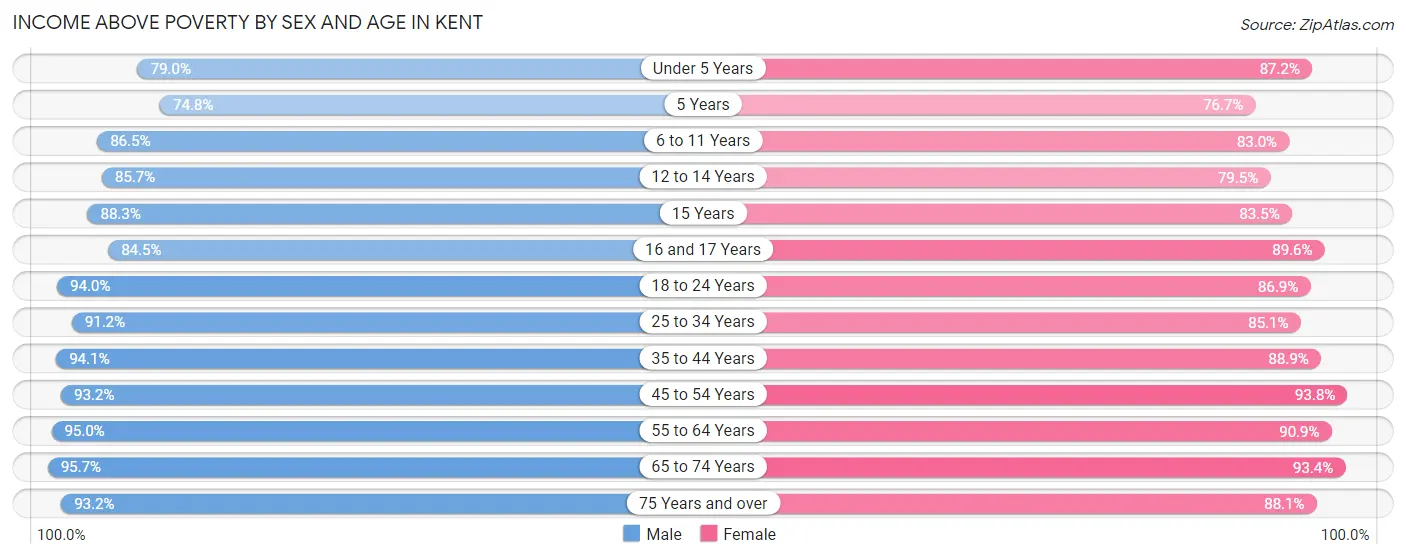
| Age Bracket | Male | Female |
| Under 5 Years | 3,798 (79.0%) | 3,208 (87.2%) |
| 5 Years | 806 (74.8%) | 907 (76.7%) |
| 6 to 11 Years | 5,392 (86.5%) | 4,415 (83.0%) |
| 12 to 14 Years | 2,788 (85.7%) | 2,028 (79.5%) |
| 15 Years | 801 (88.3%) | 570 (83.5%) |
| 16 and 17 Years | 1,508 (84.5%) | 1,124 (89.6%) |
| 18 to 24 Years | 6,083 (94.0%) | 5,437 (86.9%) |
| 25 to 34 Years | 10,606 (91.2%) | 8,817 (85.1%) |
| 35 to 44 Years | 9,253 (94.1%) | 8,521 (88.9%) |
| 45 to 54 Years | 7,533 (93.2%) | 7,499 (93.8%) |
| 55 to 64 Years | 7,362 (95.0%) | 7,743 (90.8%) |
| 65 to 74 Years | 3,684 (95.7%) | 4,743 (93.4%) |
| 75 Years and over | 2,207 (93.2%) | 2,687 (88.1%) |
| Total | 61,821 (90.9%) | 57,699 (88.1%) |
Income Below Poverty Among Married-Couple Families in Kent
The poverty statistics for married-couple families in Kent show that 3.8% or 835 of the total 21,665 families live below the poverty line. Families with 5 or more children have the highest poverty rate of 43.7%, comprising of 304 families. On the other hand, families with no children have the lowest poverty rate of 1.4%, which includes 148 families.
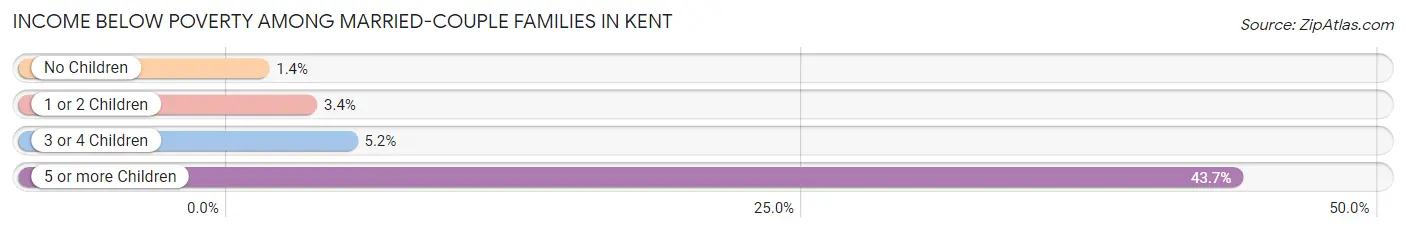
| Children | Above Poverty | Below Poverty |
| No Children | 10,724 (98.6%) | 148 (1.4%) |
| 1 or 2 Children | 7,781 (96.6%) | 277 (3.4%) |
| 3 or 4 Children | 1,934 (94.8%) | 106 (5.2%) |
| 5 or more Children | 391 (56.3%) | 304 (43.7%) |
| Total | 20,830 (96.2%) | 835 (3.8%) |
Income Below Poverty Among Single-Parent Households in Kent
According to the poverty data in Kent, 5.0% or 141 single-father households and 21.3% or 1,485 single-mother households are living below the poverty line. Among single-father households, those with 3 or 4 children have the highest poverty rate, with 109 households (45.0%) experiencing poverty. Likewise, among single-mother households, those with 3 or 4 children have the highest poverty rate, with 305 households (40.4%) falling below the poverty line.
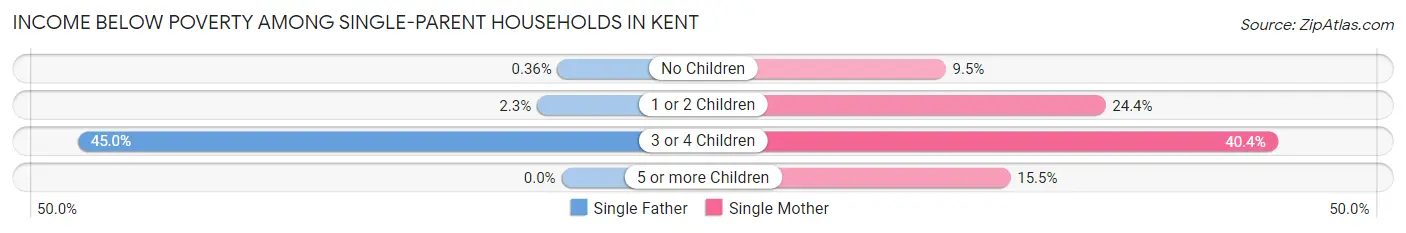
| Children | Single Father | Single Mother |
| No Children | 5 (0.4%) | 209 (9.5%) |
| 1 or 2 Children | 27 (2.3%) | 962 (24.4%) |
| 3 or 4 Children | 109 (45.0%) | 305 (40.4%) |
| 5 or more Children | 0 (0.0%) | 9 (15.5%) |
| Total | 141 (5.0%) | 1,485 (21.3%) |
Income Below Poverty Among Married-Couple vs Single-Parent Households in Kent
The poverty data for Kent shows that 835 of the married-couple family households (3.8%) and 1,626 of the single-parent households (16.6%) are living below the poverty level. Within the married-couple family households, those with 5 or more children have the highest poverty rate, with 304 households (43.7%) falling below the poverty line. Among the single-parent households, those with 3 or 4 children have the highest poverty rate, with 414 household (41.5%) living below poverty.
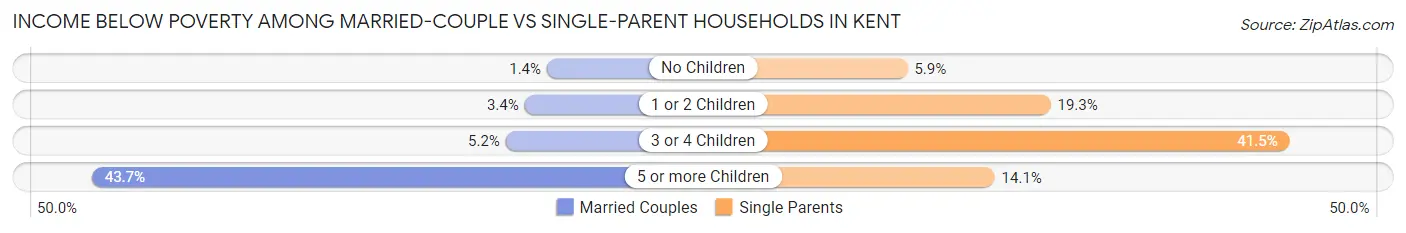
| Children | Married-Couple Families | Single-Parent Households |
| No Children | 148 (1.4%) | 214 (5.9%) |
| 1 or 2 Children | 277 (3.4%) | 989 (19.3%) |
| 3 or 4 Children | 106 (5.2%) | 414 (41.5%) |
| 5 or more Children | 304 (43.7%) | 9 (14.1%) |
| Total | 835 (3.8%) | 1,626 (16.6%) |
Race in Kent
The most populous races in Kent are White / Caucasian (55,121 | 40.8%), Asian (30,295 | 22.4%), and Hispanic or Latino (21,993 | 16.3%).
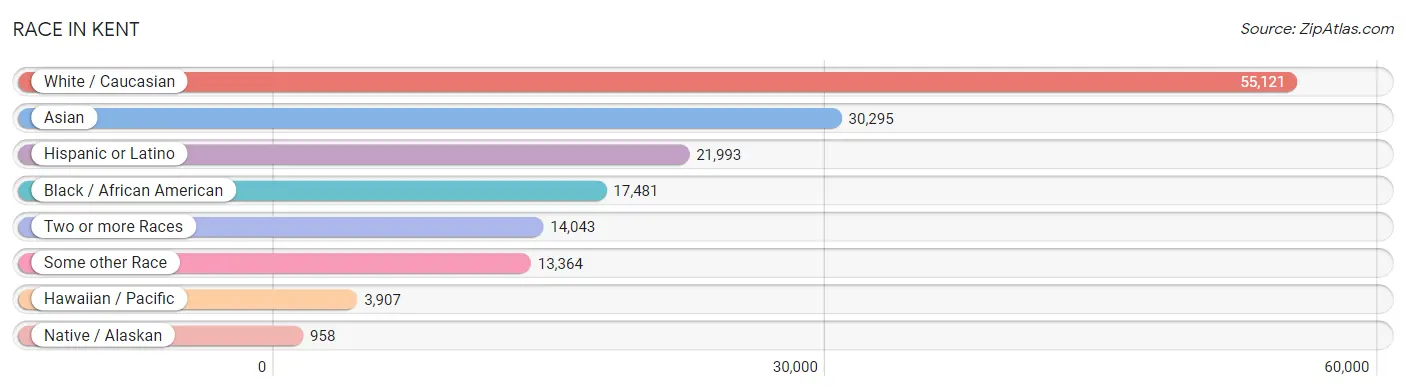
| Race | # Population | % Population |
| Asian | 30,295 | 22.4% |
| Black / African American | 17,481 | 12.9% |
| Hawaiian / Pacific | 3,907 | 2.9% |
| Hispanic or Latino | 21,993 | 16.3% |
| Native / Alaskan | 958 | 0.7% |
| White / Caucasian | 55,121 | 40.8% |
| Two or more Races | 14,043 | 10.4% |
| Some other Race | 13,364 | 9.9% |
| Total | 135,169 | 100.0% |
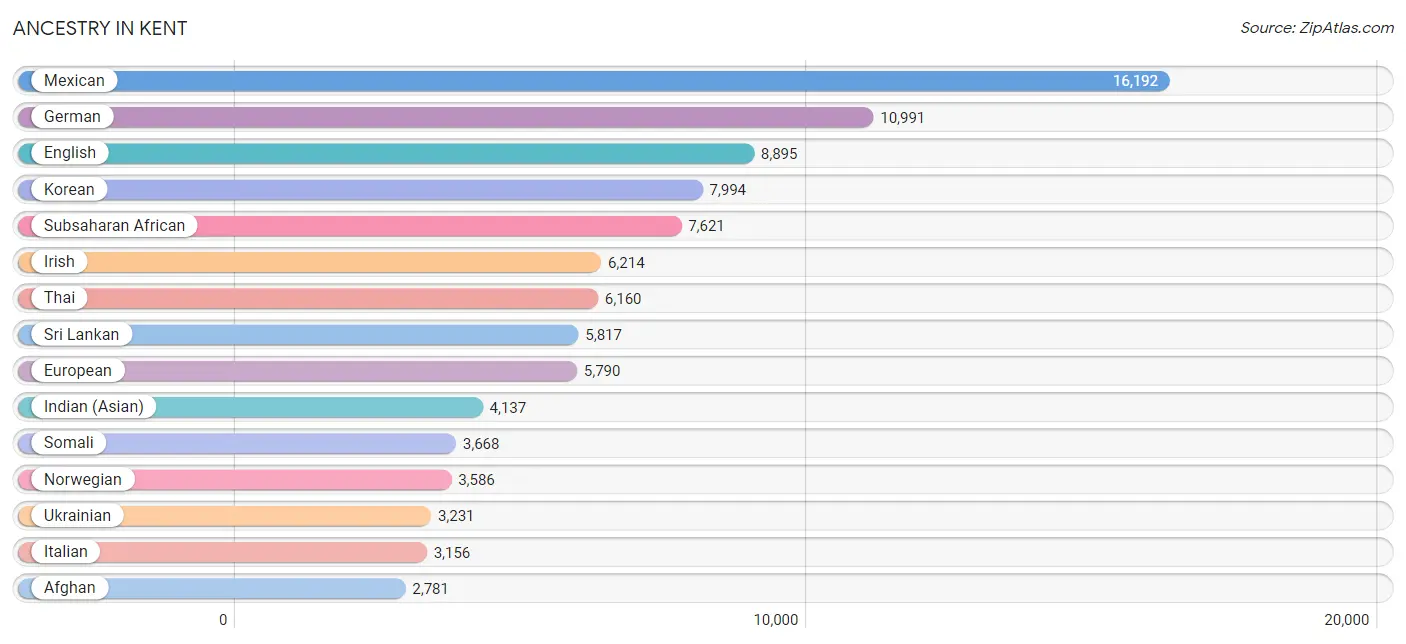
Ancestry in Kent
The most populous ancestries reported in Kent are Mexican (16,192 | 12.0%), German (10,991 | 8.1%), English (8,895 | 6.6%), Korean (7,994 | 5.9%), and Subsaharan African (7,621 | 5.6%), together accounting for 38.2% of all Kent residents.
| Ancestry | # Population | % Population |
| Afghan | 2,781 | 2.1% |
| African | 953 | 0.7% |
| Alaska Native | 48 | 0.0% |
| American | 2,652 | 2.0% |
| Apache | 31 | 0.0% |
| Arab | 1,837 | 1.4% |
| Argentinean | 54 | 0.0% |
| Armenian | 45 | 0.0% |
| Australian | 9 | 0.0% |
| Austrian | 353 | 0.3% |
| Bangladeshi | 324 | 0.2% |
| Barbadian | 88 | 0.1% |
| Belgian | 34 | 0.0% |
| Belizean | 45 | 0.0% |
| Bhutanese | 1,265 | 0.9% |
| Blackfeet | 343 | 0.3% |
| Brazilian | 37 | 0.0% |
| British | 526 | 0.4% |
| Bulgarian | 158 | 0.1% |
| Burmese | 911 | 0.7% |
| Cajun | 12 | 0.0% |
| Canadian | 208 | 0.2% |
| Central American | 2,686 | 2.0% |
| Central American Indian | 208 | 0.2% |
| Cherokee | 144 | 0.1% |
| Chickasaw | 22 | 0.0% |
| Chippewa | 112 | 0.1% |
| Choctaw | 25 | 0.0% |
| Colombian | 329 | 0.2% |
| Colville | 41 | 0.0% |
| Comanche | 19 | 0.0% |
| Costa Rican | 162 | 0.1% |
| Creek | 8 | 0.0% |
| Croatian | 144 | 0.1% |
| Cuban | 138 | 0.1% |
| Czech | 609 | 0.4% |
| Danish | 940 | 0.7% |
| Dominican | 42 | 0.0% |
| Dutch | 1,186 | 0.9% |
| Eastern European | 165 | 0.1% |
| Ecuadorian | 165 | 0.1% |
| Egyptian | 60 | 0.0% |
| English | 8,895 | 6.6% |
| Ethiopian | 784 | 0.6% |
| European | 5,790 | 4.3% |
| Fijian | 443 | 0.3% |
| Filipino | 74 | 0.1% |
| Finnish | 237 | 0.2% |
| French | 2,279 | 1.7% |
| French American Indian | 33 | 0.0% |
| French Canadian | 246 | 0.2% |
| German | 10,991 | 8.1% |
| Ghanaian | 98 | 0.1% |
| Greek | 85 | 0.1% |
| Guamanian / Chamorro | 626 | 0.5% |
| Guatemalan | 941 | 0.7% |
| Guyanese | 9 | 0.0% |
| Haitian | 124 | 0.1% |
| Honduran | 525 | 0.4% |
| Hungarian | 142 | 0.1% |
| Icelander | 129 | 0.1% |
| Indian (Asian) | 4,137 | 3.1% |
| Indonesian | 1,304 | 1.0% |
| Inupiat | 17 | 0.0% |
| Iranian | 246 | 0.2% |
| Iraqi | 974 | 0.7% |
| Irish | 6,214 | 4.6% |
| Iroquois | 5 | 0.0% |
| Italian | 3,156 | 2.3% |
| Jamaican | 110 | 0.1% |
| Japanese | 1,568 | 1.2% |
| Jordanian | 27 | 0.0% |
| Kenyan | 429 | 0.3% |
| Korean | 7,994 | 5.9% |
| Laotian | 161 | 0.1% |
| Latvian | 1 | 0.0% |
| Lebanese | 246 | 0.2% |
| Liberian | 55 | 0.0% |
| Lithuanian | 71 | 0.1% |
| Luxembourger | 8 | 0.0% |
| Malaysian | 914 | 0.7% |
| Mexican | 16,192 | 12.0% |
| Mexican American Indian | 99 | 0.1% |
| Mongolian | 12 | 0.0% |
| Moroccan | 18 | 0.0% |
| Native Hawaiian | 786 | 0.6% |
| Navajo | 213 | 0.2% |
| Nepalese | 45 | 0.0% |
| Nicaraguan | 30 | 0.0% |
| Nigerian | 550 | 0.4% |
| Northern European | 393 | 0.3% |
| Norwegian | 3,586 | 2.6% |
| Osage | 6 | 0.0% |
| Pakistani | 392 | 0.3% |
| Palestinian | 203 | 0.2% |
| Panamanian | 5 | 0.0% |
| Pennsylvania German | 73 | 0.1% |
| Peruvian | 331 | 0.2% |
| Polish | 1,284 | 0.9% |
| Portuguese | 328 | 0.2% |
| Puerto Rican | 773 | 0.6% |
| Puget Sound Salish | 202 | 0.2% |
| Romanian | 194 | 0.1% |
| Russian | 1,152 | 0.9% |
| Salvadoran | 1,023 | 0.8% |
| Samoan | 1,922 | 1.4% |
| Scandinavian | 471 | 0.4% |
| Scotch-Irish | 709 | 0.5% |
| Scottish | 1,663 | 1.2% |
| Senegalese | 61 | 0.1% |
| Serbian | 13 | 0.0% |
| Shoshone | 32 | 0.0% |
| Sierra Leonean | 21 | 0.0% |
| Sioux | 134 | 0.1% |
| Slavic | 26 | 0.0% |
| Slovak | 38 | 0.0% |
| Slovene | 21 | 0.0% |
| Somali | 3,668 | 2.7% |
| South American | 1,030 | 0.8% |
| Spaniard | 331 | 0.2% |
| Spanish | 356 | 0.3% |
| Sri Lankan | 5,817 | 4.3% |
| Subsaharan African | 7,621 | 5.6% |
| Sudanese | 15 | 0.0% |
| Swedish | 1,738 | 1.3% |
| Swiss | 187 | 0.1% |
| Syrian | 16 | 0.0% |
| Thai | 6,160 | 4.6% |
| Tlingit-Haida | 16 | 0.0% |
| Tongan | 215 | 0.2% |
| Turkish | 770 | 0.6% |
| Ugandan | 83 | 0.1% |
| Ukrainian | 3,231 | 2.4% |
| Uruguayan | 31 | 0.0% |
| Venezuelan | 120 | 0.1% |
| Welsh | 641 | 0.5% |
| West Indian | 72 | 0.1% |
| Yakama | 159 | 0.1% |
| Yugoslavian | 139 | 0.1% |
| Yup'ik | 11 | 0.0% | View All 140 Rows |
Immigrants in Kent
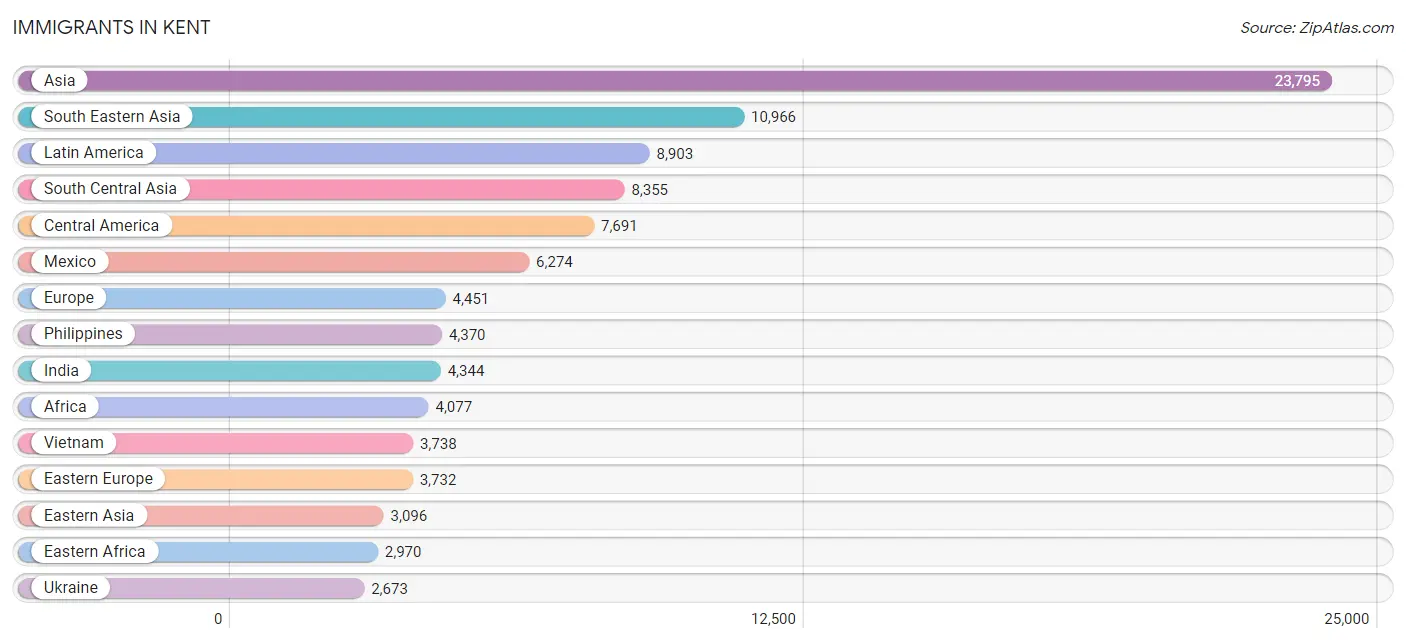
The most numerous immigrant groups reported in Kent came from Asia (23,795 | 17.6%), South Eastern Asia (10,966 | 8.1%), Latin America (8,903 | 6.6%), South Central Asia (8,355 | 6.2%), and Central America (7,691 | 5.7%), together accounting for 44.2% of all Kent residents.
| Immigration Origin | # Population | % Population |
| Afghanistan | 2,584 | 1.9% |
| Africa | 4,077 | 3.0% |
| Argentina | 24 | 0.0% |
| Asia | 23,795 | 17.6% |
| Australia | 15 | 0.0% |
| Bahamas | 27 | 0.0% |
| Belarus | 148 | 0.1% |
| Bosnia and Herzegovina | 64 | 0.1% |
| Brazil | 27 | 0.0% |
| Bulgaria | 38 | 0.0% |
| Cambodia | 633 | 0.5% |
| Canada | 361 | 0.3% |
| Caribbean | 435 | 0.3% |
| Central America | 7,691 | 5.7% |
| China | 2,270 | 1.7% |
| Colombia | 255 | 0.2% |
| Congo | 22 | 0.0% |
| Costa Rica | 10 | 0.0% |
| Cuba | 10 | 0.0% |
| Czechoslovakia | 40 | 0.0% |
| Dominican Republic | 32 | 0.0% |
| Eastern Africa | 2,970 | 2.2% |
| Eastern Asia | 3,096 | 2.3% |
| Eastern Europe | 3,732 | 2.8% |
| Ecuador | 165 | 0.1% |
| Egypt | 60 | 0.0% |
| El Salvador | 541 | 0.4% |
| England | 74 | 0.1% |
| Eritrea | 145 | 0.1% |
| Ethiopia | 686 | 0.5% |
| Europe | 4,451 | 3.3% |
| Fiji | 242 | 0.2% |
| France | 68 | 0.1% |
| Germany | 286 | 0.2% |
| Ghana | 30 | 0.0% |
| Guatemala | 608 | 0.4% |
| Guyana | 9 | 0.0% |
| Haiti | 171 | 0.1% |
| Honduras | 258 | 0.2% |
| Hong Kong | 223 | 0.2% |
| Hungary | 25 | 0.0% |
| India | 4,344 | 3.2% |
| Indonesia | 138 | 0.1% |
| Iran | 239 | 0.2% |
| Iraq | 1,127 | 0.8% |
| Ireland | 53 | 0.0% |
| Israel | 8 | 0.0% |
| Italy | 106 | 0.1% |
| Jamaica | 154 | 0.1% |
| Japan | 210 | 0.2% |
| Jordan | 60 | 0.0% |
| Kazakhstan | 48 | 0.0% |
| Kenya | 793 | 0.6% |
| Korea | 616 | 0.5% |
| Kuwait | 24 | 0.0% |
| Laos | 438 | 0.3% |
| Latin America | 8,903 | 6.6% |
| Lebanon | 69 | 0.1% |
| Liberia | 73 | 0.1% |
| Malaysia | 173 | 0.1% |
| Mexico | 6,274 | 4.6% |
| Micronesia | 390 | 0.3% |
| Middle Africa | 58 | 0.0% |
| Moldova | 113 | 0.1% |
| Morocco | 9 | 0.0% |
| Nepal | 243 | 0.2% |
| Netherlands | 47 | 0.0% |
| Nigeria | 168 | 0.1% |
| Northern Africa | 84 | 0.1% |
| Northern Europe | 196 | 0.2% |
| Norway | 17 | 0.0% |
| Oceania | 1,893 | 1.4% |
| Pakistan | 202 | 0.2% |
| Peru | 171 | 0.1% |
| Philippines | 4,370 | 3.2% |
| Poland | 104 | 0.1% |
| Romania | 39 | 0.0% |
| Russia | 387 | 0.3% |
| Senegal | 61 | 0.1% |
| Sierra Leone | 21 | 0.0% |
| Somalia | 1,138 | 0.8% |
| South Africa | 19 | 0.0% |
| South America | 777 | 0.6% |
| South Central Asia | 8,355 | 6.2% |
| South Eastern Asia | 10,966 | 8.1% |
| Southern Europe | 122 | 0.1% |
| Spain | 16 | 0.0% |
| Sudan | 15 | 0.0% |
| Taiwan | 196 | 0.2% |
| Thailand | 529 | 0.4% |
| Trinidad and Tobago | 23 | 0.0% |
| Uganda | 83 | 0.1% |
| Ukraine | 2,673 | 2.0% |
| Uruguay | 22 | 0.0% |
| Uzbekistan | 278 | 0.2% |
| Venezuela | 104 | 0.1% |
| Vietnam | 3,738 | 2.8% |
| Western Africa | 946 | 0.7% |
| Western Asia | 1,319 | 1.0% |
| Western Europe | 401 | 0.3% |
| Zaire | 36 | 0.0% | View All 101 Rows |
Sex and Age in Kent
Sex and Age in Kent
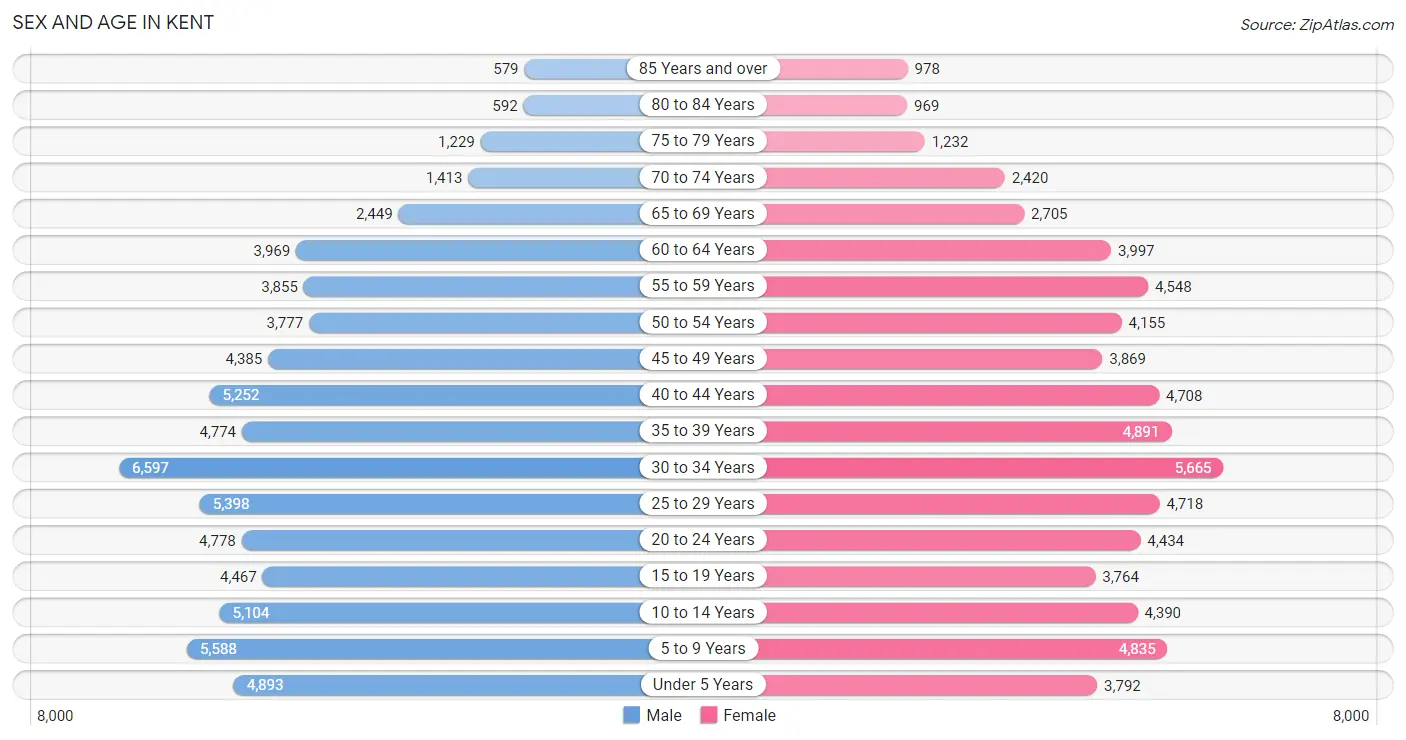
The most populous age groups in Kent are 30 to 34 Years (6,597 | 9.6%) for men and 30 to 34 Years (5,665 | 8.6%) for women.
| Age Bracket | Male | Female |
| Under 5 Years | 4,893 (7.1%) | 3,792 (5.7%) |
| 5 to 9 Years | 5,588 (8.1%) | 4,835 (7.3%) |
| 10 to 14 Years | 5,104 (7.4%) | 4,390 (6.6%) |
| 15 to 19 Years | 4,467 (6.5%) | 3,764 (5.7%) |
| 20 to 24 Years | 4,778 (6.9%) | 4,434 (6.7%) |
| 25 to 29 Years | 5,398 (7.8%) | 4,718 (7.1%) |
| 30 to 34 Years | 6,597 (9.6%) | 5,665 (8.6%) |
| 35 to 39 Years | 4,774 (6.9%) | 4,891 (7.4%) |
| 40 to 44 Years | 5,252 (7.6%) | 4,708 (7.1%) |
| 45 to 49 Years | 4,385 (6.4%) | 3,869 (5.9%) |
| 50 to 54 Years | 3,777 (5.5%) | 4,155 (6.3%) |
| 55 to 59 Years | 3,855 (5.6%) | 4,548 (6.9%) |
| 60 to 64 Years | 3,969 (5.7%) | 3,997 (6.0%) |
| 65 to 69 Years | 2,449 (3.5%) | 2,705 (4.1%) |
| 70 to 74 Years | 1,413 (2.0%) | 2,420 (3.7%) |
| 75 to 79 Years | 1,229 (1.8%) | 1,232 (1.9%) |
| 80 to 84 Years | 592 (0.9%) | 969 (1.5%) |
| 85 Years and over | 579 (0.8%) | 978 (1.5%) |
| Total | 69,099 (100.0%) | 66,070 (100.0%) |
Families and Households in Kent
Median Family Size in Kent
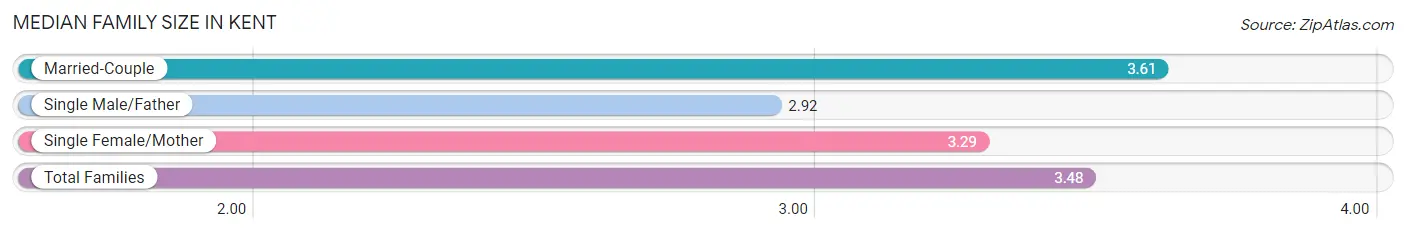
The median family size in Kent is 3.48 persons per family, with married-couple families (21,665 | 68.9%) accounting for the largest median family size of 3.61 persons per family. On the other hand, single male/father families (2,829 | 9.0%) represent the smallest median family size with 2.92 persons per family.
| Family Type | # Families | Family Size |
| Married-Couple | 21,665 (68.9%) | 3.61 |
| Single Male/Father | 2,829 (9.0%) | 2.92 |
| Single Female/Mother | 6,963 (22.1%) | 3.29 |
| Total Families | 31,457 (100.0%) | 3.48 |
Median Household Size in Kent
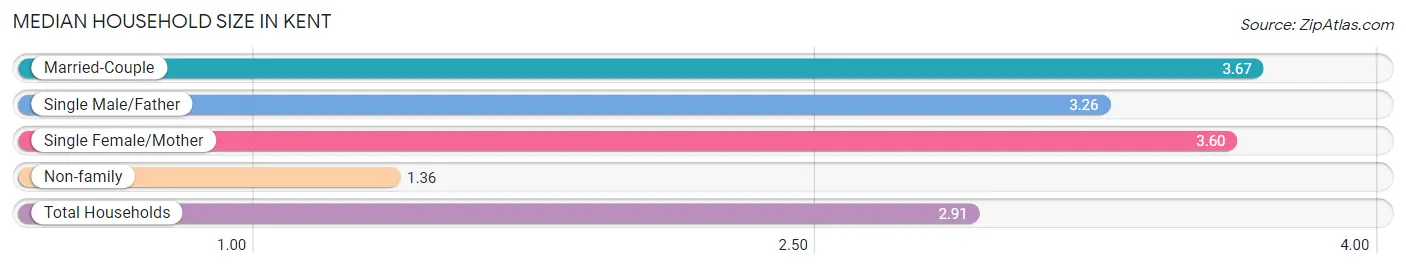
The median household size in Kent is 2.91 persons per household, with married-couple households (21,665 | 47.4%) accounting for the largest median household size of 3.67 persons per household. non-family households (14,242 | 31.2%) represent the smallest median household size with 1.36 persons per household.
| Household Type | # Households | Household Size |
| Married-Couple | 21,665 (47.4%) | 3.67 |
| Single Male/Father | 2,829 (6.2%) | 3.26 |
| Single Female/Mother | 6,963 (15.2%) | 3.60 |
| Non-family | 14,242 (31.2%) | 1.36 |
| Total Households | 45,699 (100.0%) | 2.91 |
Household Size by Marriage Status in Kent
Out of a total of 45,699 households in Kent, 31,457 (68.8%) are family households, while 14,242 (31.2%) are nonfamily households. The most numerous type of family households are 2-person households, comprising 10,432, and the most common type of nonfamily households are 1-person households, comprising 10,524.
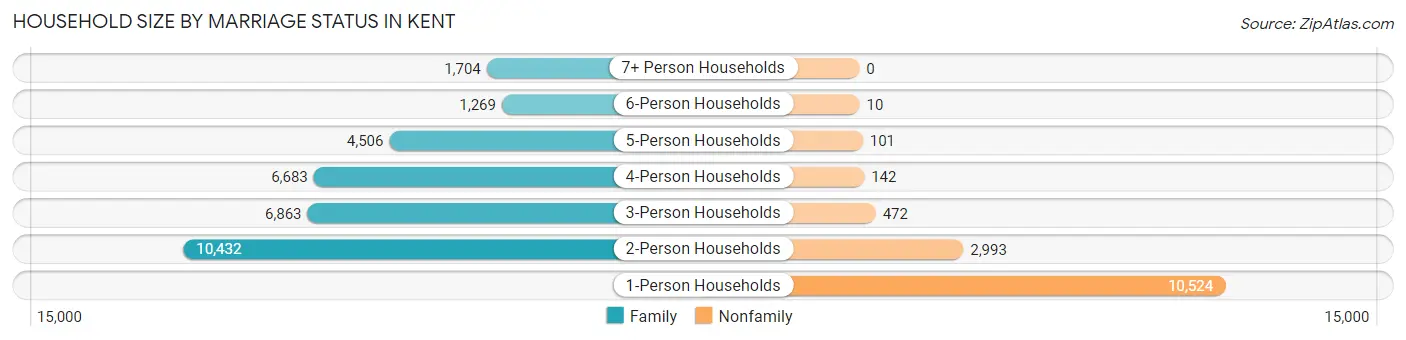
| Household Size | Family Households | Nonfamily Households |
| 1-Person Households | - | 10,524 (23.0%) |
| 2-Person Households | 10,432 (22.8%) | 2,993 (6.6%) |
| 3-Person Households | 6,863 (15.0%) | 472 (1.0%) |
| 4-Person Households | 6,683 (14.6%) | 142 (0.3%) |
| 5-Person Households | 4,506 (9.9%) | 101 (0.2%) |
| 6-Person Households | 1,269 (2.8%) | 10 (0.0%) |
| 7+ Person Households | 1,704 (3.7%) | 0 (0.0%) |
| Total | 31,457 (68.8%) | 14,242 (31.2%) |
Female Fertility in Kent
Fertility by Age in Kent
Average fertility rate in Kent is 55.0 births per 1,000 women. Women in the age bracket of 20 to 34 years have the highest fertility rate with 83.0 births per 1,000 women. Women in the age bracket of 20 to 34 years acount for 67.4% of all women with births.
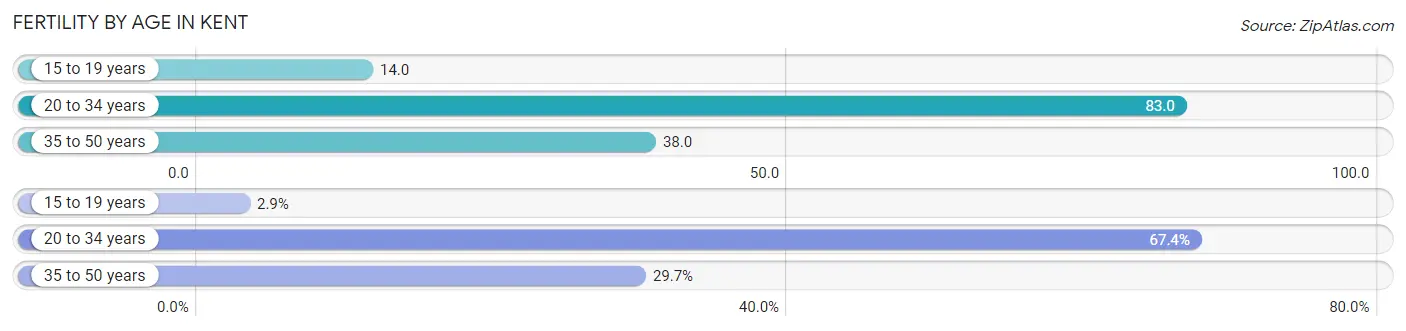
| Age Bracket | Women with Births | Births / 1,000 Women |
| 15 to 19 years | 52 (2.9%) | 14.0 |
| 20 to 34 years | 1,232 (67.4%) | 83.0 |
| 35 to 50 years | 543 (29.7%) | 38.0 |
| Total | 1,827 (100.0%) | 55.0 |
Fertility by Age by Marriage Status in Kent
80.4% of women with births (1,827) in Kent are married. The highest percentage of unmarried women with births falls into 20 to 34 years age bracket with 22.8% of them unmarried at the time of birth, while the lowest percentage of unmarried women with births belong to 15 to 19 years age bracket with 0.0% of them unmarried.
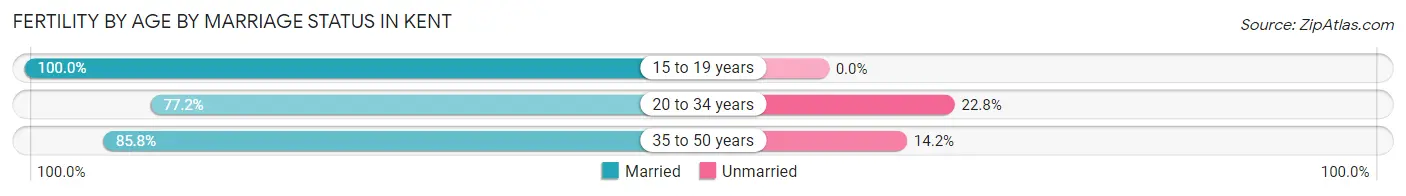
| Age Bracket | Married | Unmarried |
| 15 to 19 years | 52 (100.0%) | 0 (0.0%) |
| 20 to 34 years | 951 (77.2%) | 281 (22.8%) |
| 35 to 50 years | 466 (85.8%) | 77 (14.2%) |
| Total | 1,469 (80.4%) | 358 (19.6%) |
Fertility by Education in Kent
Average fertility rate in Kent is 55.0 births per 1,000 women. Women with the education attainment of less than high school have the highest fertility rate of 66.0 births per 1,000 women, while women with the education attainment of college or associate's degree have the lowest fertility at 42.0 births per 1,000 women. Women with the education attainment of high school diploma represent 27.5% of all women with births.
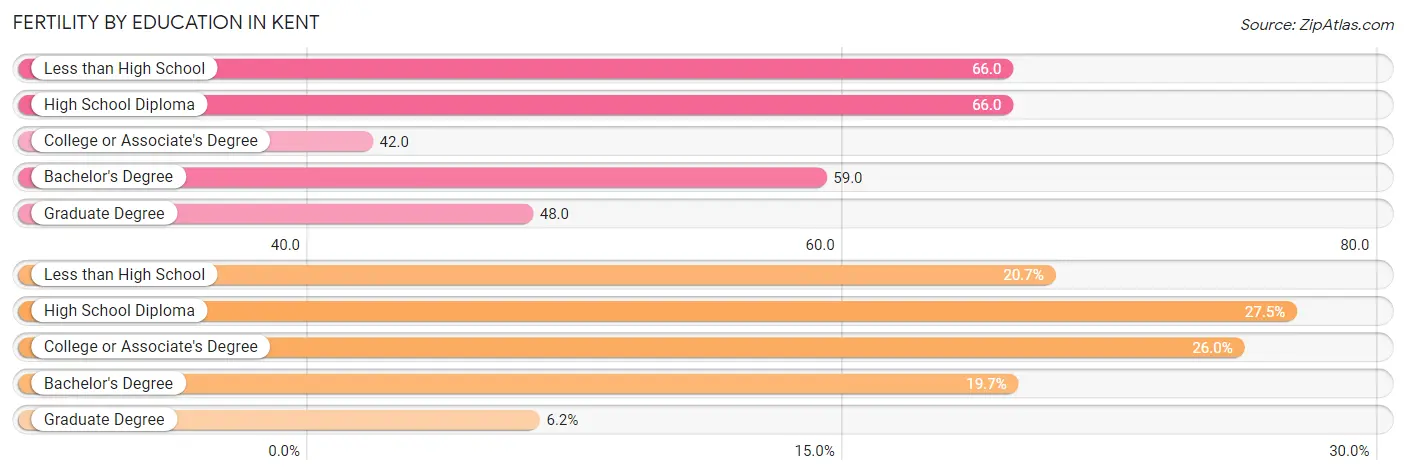
| Educational Attainment | Women with Births | Births / 1,000 Women |
| Less than High School | 378 (20.7%) | 66.0 |
| High School Diploma | 502 (27.5%) | 66.0 |
| College or Associate's Degree | 475 (26.0%) | 42.0 |
| Bachelor's Degree | 359 (19.7%) | 59.0 |
| Graduate Degree | 113 (6.2%) | 48.0 |
| Total | 1,827 (100.0%) | 55.0 |
Fertility by Education by Marriage Status in Kent
19.6% of women with births in Kent are unmarried. Women with the educational attainment of graduate degree are most likely to be married with 100.0% of them married at childbirth, while women with the educational attainment of college or associate's degree are least likely to be married with 48.4% of them unmarried at childbirth.
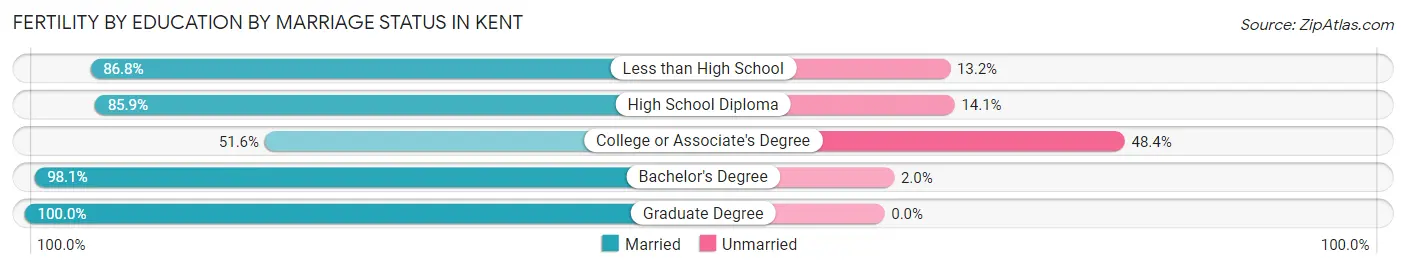
| Educational Attainment | Married | Unmarried |
| Less than High School | 328 (86.8%) | 50 (13.2%) |
| High School Diploma | 431 (85.9%) | 71 (14.1%) |
| College or Associate's Degree | 245 (51.6%) | 230 (48.4%) |
| Bachelor's Degree | 352 (98.1%) | 7 (1.9%) |
| Graduate Degree | 113 (100.0%) | 0 (0.0%) |
| Total | 1,469 (80.4%) | 358 (19.6%) |
Employment Characteristics in Kent
Employment by Class of Employer in Kent
Among the 65,854 employed individuals in Kent, private company employees (46,647 | 70.8%), not-for-profit organizations (5,032 | 7.6%), and self-employed (not incorporated) (4,761 | 7.2%) make up the most common classes of employment.
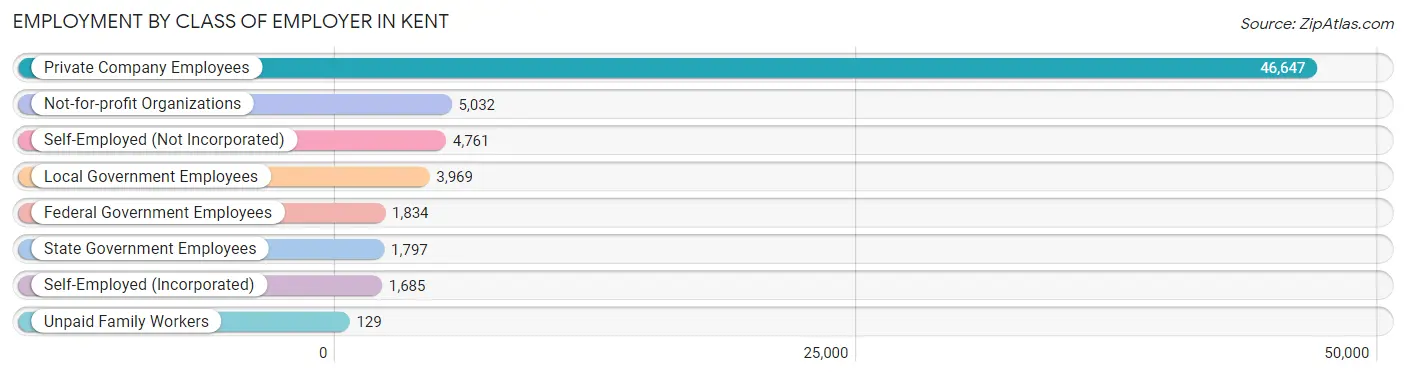
| Employer Class | # Employees | % Employees |
| Private Company Employees | 46,647 | 70.8% |
| Self-Employed (Incorporated) | 1,685 | 2.6% |
| Self-Employed (Not Incorporated) | 4,761 | 7.2% |
| Not-for-profit Organizations | 5,032 | 7.6% |
| Local Government Employees | 3,969 | 6.0% |
| State Government Employees | 1,797 | 2.7% |
| Federal Government Employees | 1,834 | 2.8% |
| Unpaid Family Workers | 129 | 0.2% |
| Total | 65,854 | 100.0% |
Employment Status by Age in Kent
According to the labor force statistics for Kent, out of the total population over 16 years of age (104,977), 69.7% or 73,169 individuals are in the labor force, with 7.6% or 5,561 of them unemployed. The age group with the highest labor force participation rate is 35 to 44 years, with 84.9% or 16,662 individuals in the labor force. Within the labor force, the 16 to 19 years age range has the highest percentage of unemployed individuals, with 28.5% or 812 of them being unemployed.
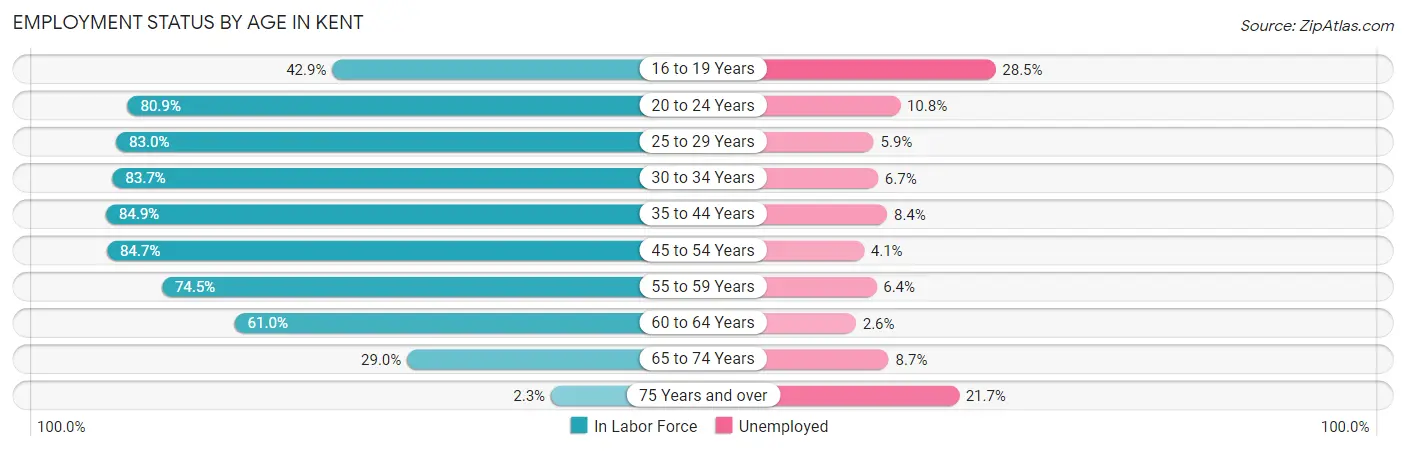
| Age Bracket | In Labor Force | Unemployed |
| 16 to 19 Years | 2,849 (42.9%) | 812 (28.5%) |
| 20 to 24 Years | 7,453 (80.9%) | 805 (10.8%) |
| 25 to 29 Years | 8,396 (83.0%) | 495 (5.9%) |
| 30 to 34 Years | 10,263 (83.7%) | 688 (6.7%) |
| 35 to 44 Years | 16,662 (84.9%) | 1,400 (8.4%) |
| 45 to 54 Years | 13,710 (84.7%) | 562 (4.1%) |
| 55 to 59 Years | 6,260 (74.5%) | 401 (6.4%) |
| 60 to 64 Years | 4,859 (61.0%) | 126 (2.6%) |
| 65 to 74 Years | 2,606 (29.0%) | 227 (8.7%) |
| 75 Years and over | 128 (2.3%) | 28 (21.7%) |
| Total | 73,169 (69.7%) | 5,561 (7.6%) |
Employment Status by Educational Attainment in Kent
According to labor force statistics for Kent, 80.7% of individuals (60,168) out of the total population between 25 and 64 years of age (74,558) are in the labor force, with 6.1% or 3,670 of them being unemployed. The group with the highest labor force participation rate are those with the educational attainment of bachelor's degree or higher, with 87.1% or 18,126 individuals in the labor force. Within the labor force, individuals with less than high school education have the highest percentage of unemployment, with 10.3% or 723 of them being unemployed.
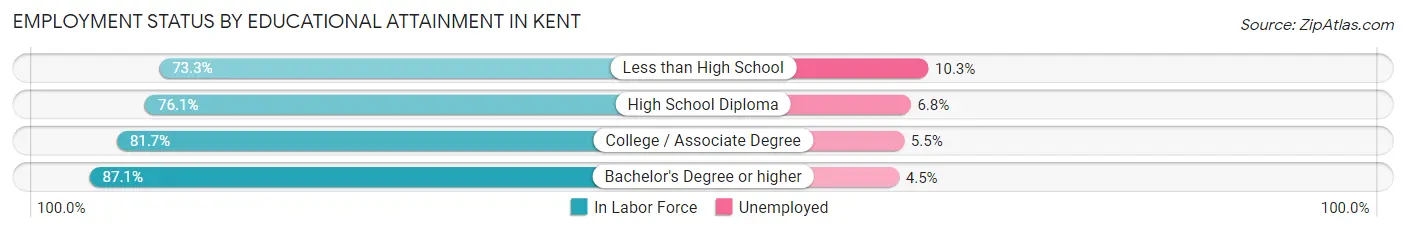
| Educational Attainment | In Labor Force | Unemployed |
| Less than High School | 7,020 (73.3%) | 986 (10.3%) |
| High School Diploma | 14,800 (76.1%) | 1,322 (6.8%) |
| College / Associate Degree | 20,198 (81.7%) | 1,360 (5.5%) |
| Bachelor's Degree or higher | 18,126 (87.1%) | 936 (4.5%) |
| Total | 60,168 (80.7%) | 4,548 (6.1%) |
Employment Occupations by Sex in Kent
Management, Business, Science and Arts Occupations
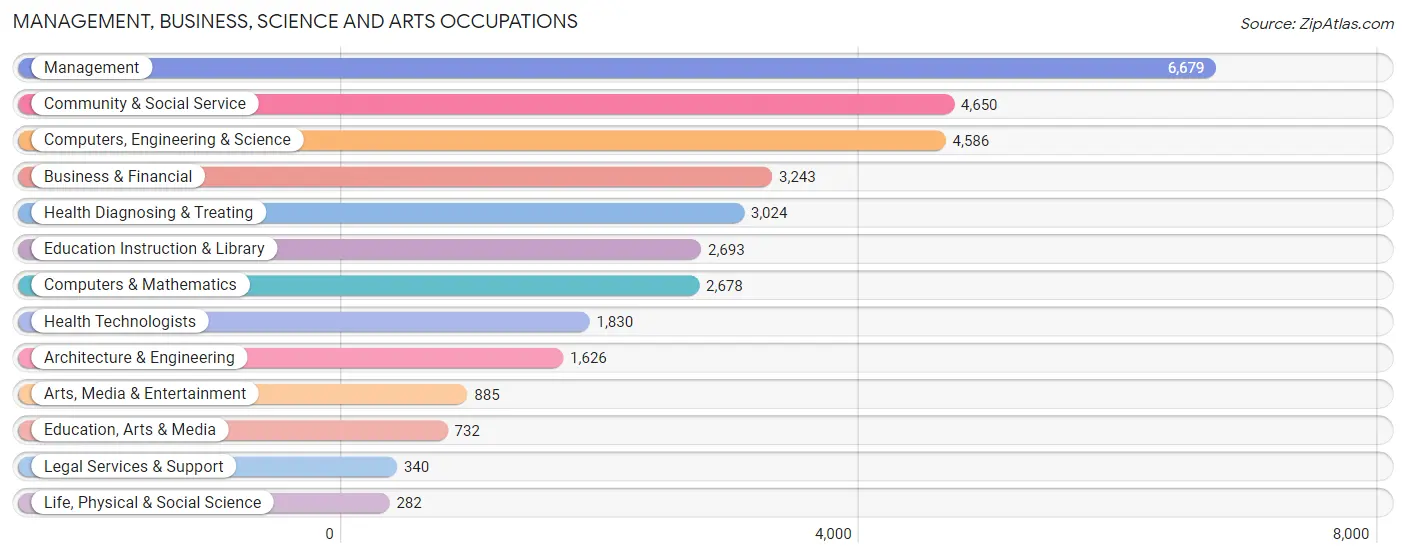
The most common Management, Business, Science and Arts occupations in Kent are Management (6,679 | 9.9%), Community & Social Service (4,650 | 6.9%), Computers, Engineering & Science (4,586 | 6.8%), Business & Financial (3,243 | 4.8%), and Health Diagnosing & Treating (3,024 | 4.5%).
Management, Business, Science and Arts Occupations by Sex
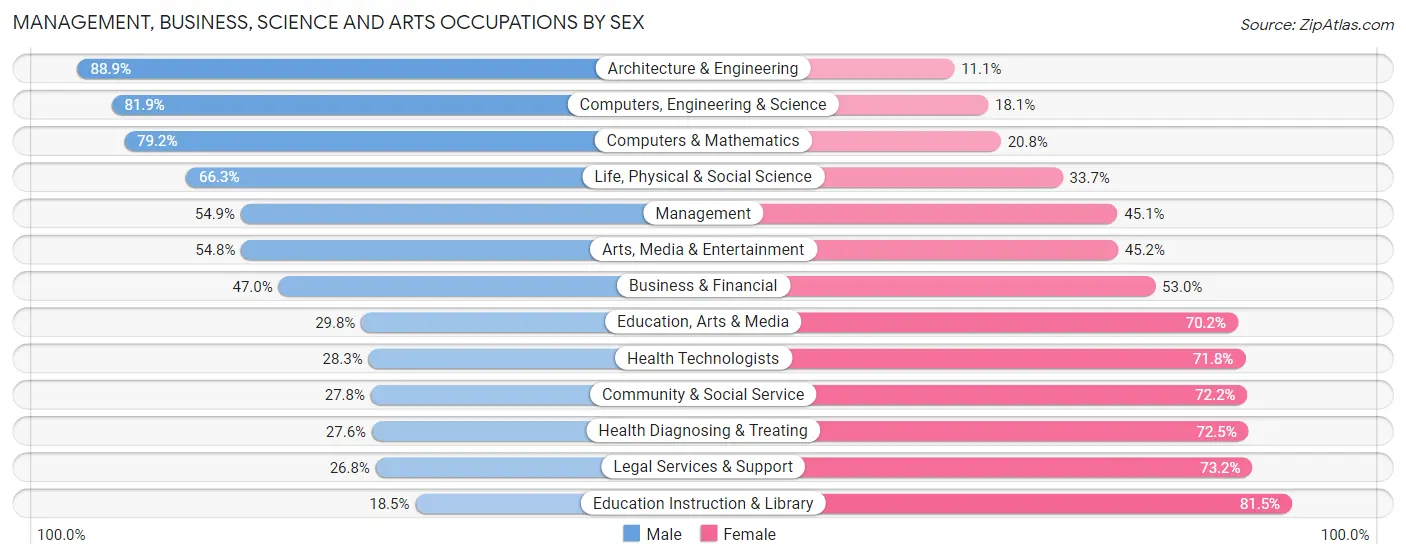
Within the Management, Business, Science and Arts occupations in Kent, the most male-oriented occupations are Architecture & Engineering (88.9%), Computers, Engineering & Science (81.9%), and Computers & Mathematics (79.2%), while the most female-oriented occupations are Education Instruction & Library (81.5%), Legal Services & Support (73.2%), and Health Diagnosing & Treating (72.5%).
| Occupation | Male | Female |
| Management | 3,666 (54.9%) | 3,013 (45.1%) |
| Business & Financial | 1,525 (47.0%) | 1,718 (53.0%) |
| Computers, Engineering & Science | 3,755 (81.9%) | 831 (18.1%) |
| Computers & Mathematics | 2,122 (79.2%) | 556 (20.8%) |
| Architecture & Engineering | 1,446 (88.9%) | 180 (11.1%) |
| Life, Physical & Social Science | 187 (66.3%) | 95 (33.7%) |
| Community & Social Service | 1,292 (27.8%) | 3,358 (72.2%) |
| Education, Arts & Media | 218 (29.8%) | 514 (70.2%) |
| Legal Services & Support | 91 (26.8%) | 249 (73.2%) |
| Education Instruction & Library | 498 (18.5%) | 2,195 (81.5%) |
| Arts, Media & Entertainment | 485 (54.8%) | 400 (45.2%) |
| Health Diagnosing & Treating | 833 (27.6%) | 2,191 (72.5%) |
| Health Technologists | 517 (28.2%) | 1,313 (71.8%) |
| Total (Category) | 11,071 (49.9%) | 11,111 (50.1%) |
| Total (Overall) | 36,953 (54.7%) | 30,562 (45.3%) |
Services Occupations
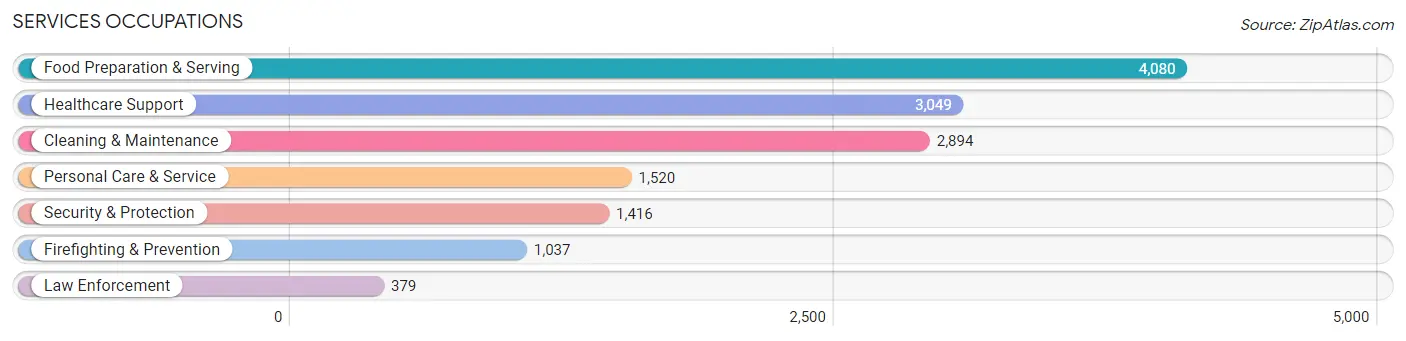
The most common Services occupations in Kent are Food Preparation & Serving (4,080 | 6.0%), Healthcare Support (3,049 | 4.5%), Cleaning & Maintenance (2,894 | 4.3%), Personal Care & Service (1,520 | 2.2%), and Security & Protection (1,416 | 2.1%).
Services Occupations by Sex
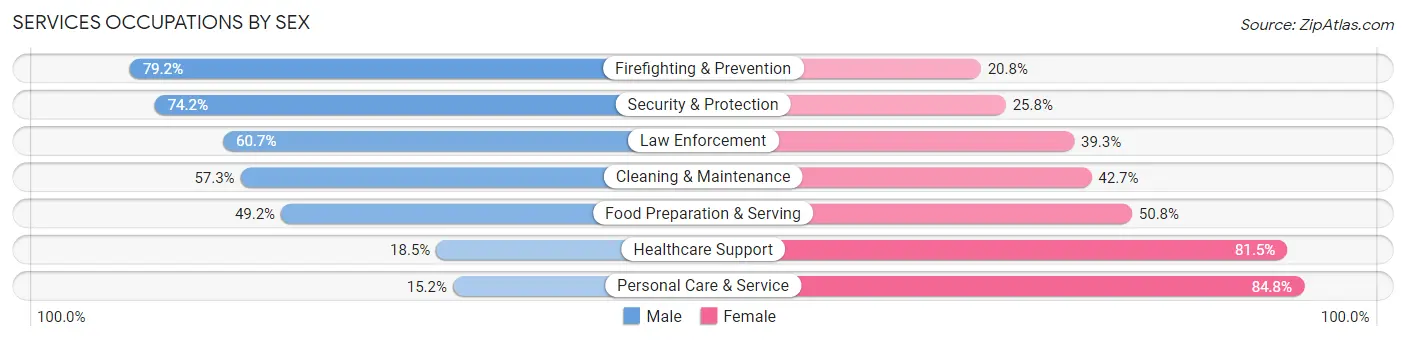
Within the Services occupations in Kent, the most male-oriented occupations are Firefighting & Prevention (79.2%), Security & Protection (74.2%), and Law Enforcement (60.7%), while the most female-oriented occupations are Personal Care & Service (84.8%), Healthcare Support (81.5%), and Food Preparation & Serving (50.8%).
| Occupation | Male | Female |
| Healthcare Support | 564 (18.5%) | 2,485 (81.5%) |
| Security & Protection | 1,051 (74.2%) | 365 (25.8%) |
| Firefighting & Prevention | 821 (79.2%) | 216 (20.8%) |
| Law Enforcement | 230 (60.7%) | 149 (39.3%) |
| Food Preparation & Serving | 2,009 (49.2%) | 2,071 (50.8%) |
| Cleaning & Maintenance | 1,657 (57.3%) | 1,237 (42.7%) |
| Personal Care & Service | 231 (15.2%) | 1,289 (84.8%) |
| Total (Category) | 5,512 (42.5%) | 7,447 (57.5%) |
| Total (Overall) | 36,953 (54.7%) | 30,562 (45.3%) |
Sales and Office Occupations
The most common Sales and Office occupations in Kent are Office & Administration (8,471 | 12.6%), and Sales & Related (4,860 | 7.2%).

Sales and Office Occupations by Sex
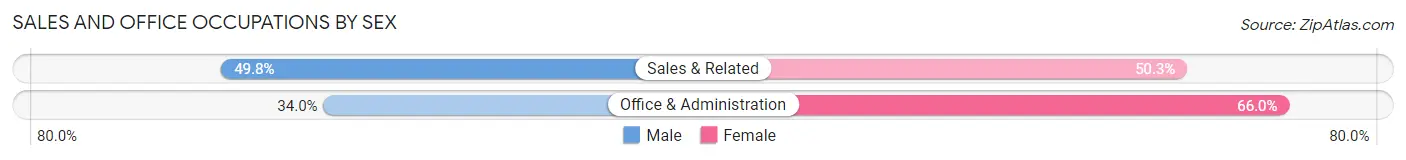
| Occupation | Male | Female |
| Sales & Related | 2,418 (49.7%) | 2,442 (50.2%) |
| Office & Administration | 2,883 (34.0%) | 5,588 (66.0%) |
| Total (Category) | 5,301 (39.8%) | 8,030 (60.2%) |
| Total (Overall) | 36,953 (54.7%) | 30,562 (45.3%) |
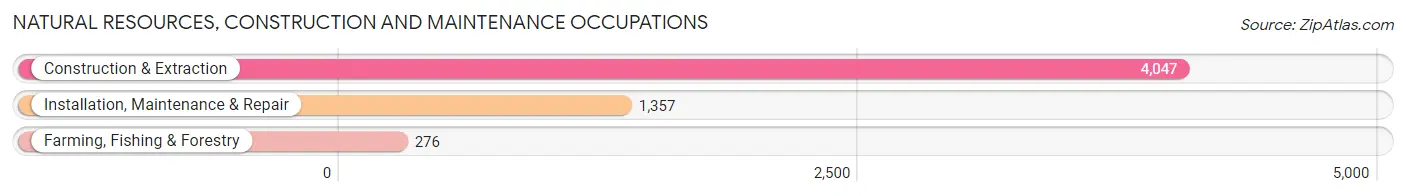
Natural Resources, Construction and Maintenance Occupations
The most common Natural Resources, Construction and Maintenance occupations in Kent are Construction & Extraction (4,047 | 6.0%), Installation, Maintenance & Repair (1,357 | 2.0%), and Farming, Fishing & Forestry (276 | 0.4%).
Natural Resources, Construction and Maintenance Occupations by Sex
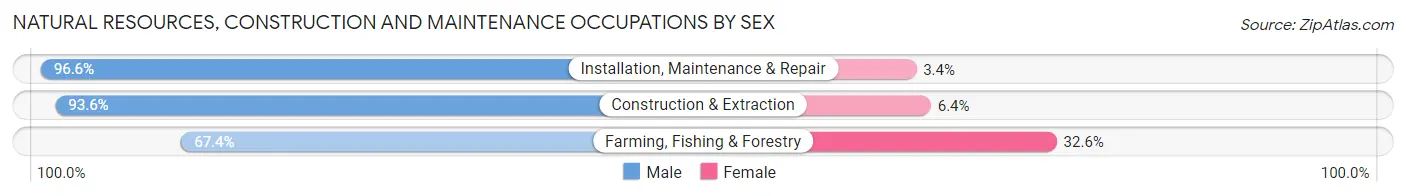
| Occupation | Male | Female |
| Farming, Fishing & Forestry | 186 (67.4%) | 90 (32.6%) |
| Construction & Extraction | 3,787 (93.6%) | 260 (6.4%) |
| Installation, Maintenance & Repair | 1,311 (96.6%) | 46 (3.4%) |
| Total (Category) | 5,284 (93.0%) | 396 (7.0%) |
| Total (Overall) | 36,953 (54.7%) | 30,562 (45.3%) |
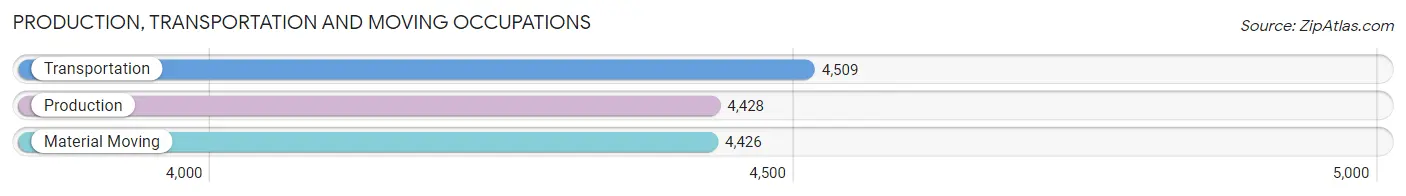
Production, Transportation and Moving Occupations
The most common Production, Transportation and Moving occupations in Kent are Transportation (4,509 | 6.7%), Production (4,428 | 6.6%), and Material Moving (4,426 | 6.6%).
Production, Transportation and Moving Occupations by Sex
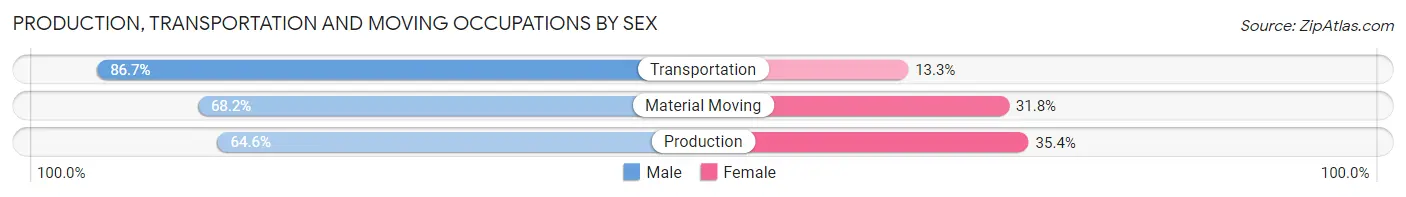
| Occupation | Male | Female |
| Production | 2,859 (64.6%) | 1,569 (35.4%) |
| Transportation | 3,908 (86.7%) | 601 (13.3%) |
| Material Moving | 3,018 (68.2%) | 1,408 (31.8%) |
| Total (Category) | 9,785 (73.2%) | 3,578 (26.8%) |
| Total (Overall) | 36,953 (54.7%) | 30,562 (45.3%) |
Employment Industries by Sex in Kent
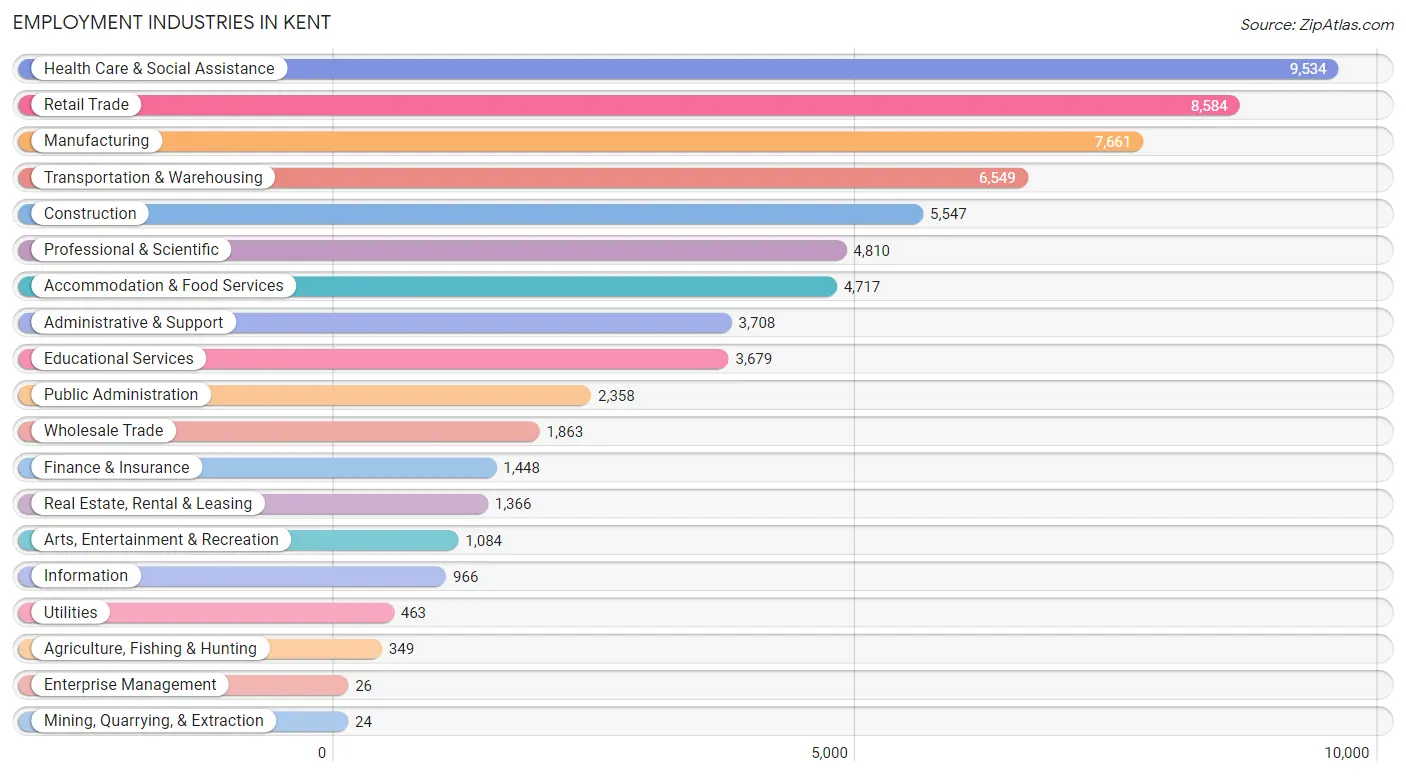
Employment Industries in Kent
The major employment industries in Kent include Health Care & Social Assistance (9,534 | 14.1%), Retail Trade (8,584 | 12.7%), Manufacturing (7,661 | 11.4%), Transportation & Warehousing (6,549 | 9.7%), and Construction (5,547 | 8.2%).
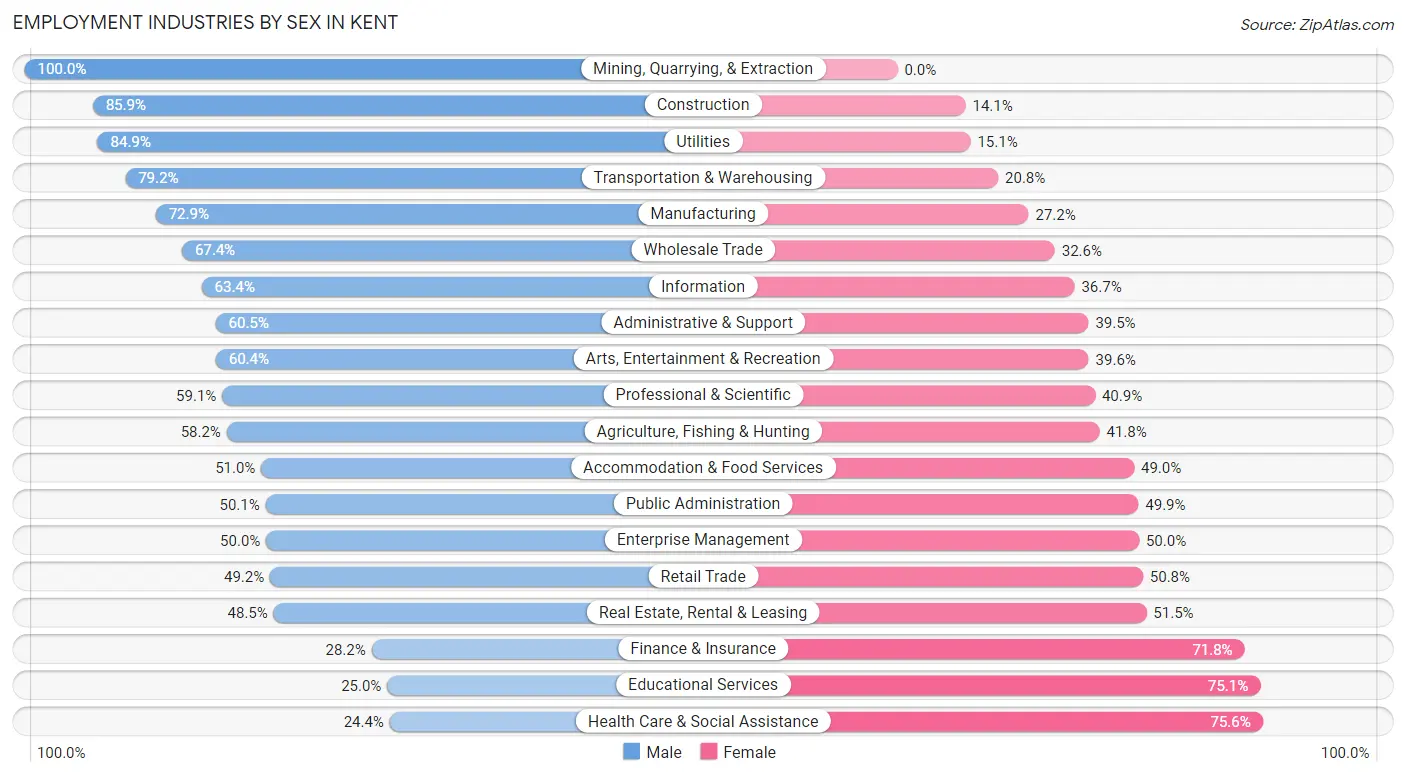
Employment Industries by Sex in Kent
The Kent industries that see more men than women are Mining, Quarrying, & Extraction (100.0%), Construction (85.9%), and Utilities (84.9%), whereas the industries that tend to have a higher number of women are Health Care & Social Assistance (75.6%), Educational Services (75.0%), and Finance & Insurance (71.8%).
| Industry | Male | Female |
| Agriculture, Fishing & Hunting | 203 (58.2%) | 146 (41.8%) |
| Mining, Quarrying, & Extraction | 24 (100.0%) | 0 (0.0%) |
| Construction | 4,765 (85.9%) | 782 (14.1%) |
| Manufacturing | 5,581 (72.9%) | 2,080 (27.2%) |
| Wholesale Trade | 1,256 (67.4%) | 607 (32.6%) |
| Retail Trade | 4,223 (49.2%) | 4,361 (50.8%) |
| Transportation & Warehousing | 5,184 (79.2%) | 1,365 (20.8%) |
| Utilities | 393 (84.9%) | 70 (15.1%) |
| Information | 612 (63.3%) | 354 (36.6%) |
| Finance & Insurance | 408 (28.2%) | 1,040 (71.8%) |
| Real Estate, Rental & Leasing | 662 (48.5%) | 704 (51.5%) |
| Professional & Scientific | 2,843 (59.1%) | 1,967 (40.9%) |
| Enterprise Management | 13 (50.0%) | 13 (50.0%) |
| Administrative & Support | 2,242 (60.5%) | 1,466 (39.5%) |
| Educational Services | 918 (24.9%) | 2,761 (75.0%) |
| Health Care & Social Assistance | 2,329 (24.4%) | 7,205 (75.6%) |
| Arts, Entertainment & Recreation | 655 (60.4%) | 429 (39.6%) |
| Accommodation & Food Services | 2,407 (51.0%) | 2,310 (49.0%) |
| Public Administration | 1,182 (50.1%) | 1,176 (49.9%) |
| Total | 36,953 (54.7%) | 30,562 (45.3%) |
Education in Kent
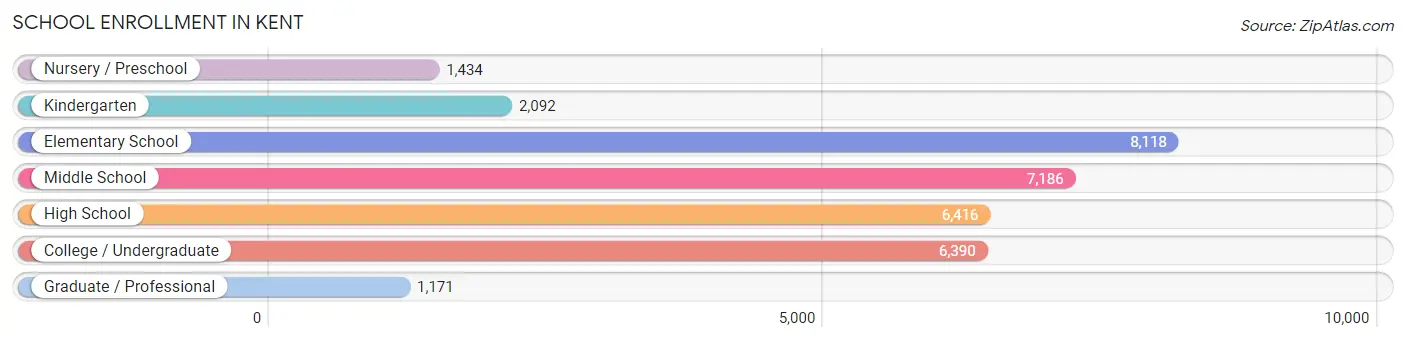
School Enrollment in Kent
The most common levels of schooling among the 32,807 students in Kent are elementary school (8,118 | 24.7%), middle school (7,186 | 21.9%), and high school (6,416 | 19.6%).
| School Level | # Students | % Students |
| Nursery / Preschool | 1,434 | 4.4% |
| Kindergarten | 2,092 | 6.4% |
| Elementary School | 8,118 | 24.7% |
| Middle School | 7,186 | 21.9% |
| High School | 6,416 | 19.6% |
| College / Undergraduate | 6,390 | 19.5% |
| Graduate / Professional | 1,171 | 3.6% |
| Total | 32,807 | 100.0% |
School Enrollment by Age by Funding Source in Kent
Out of a total of 32,807 students who are enrolled in schools in Kent, 2,067 (6.3%) attend a private institution, while the remaining 30,740 (93.7%) are enrolled in public schools. The age group of 35 years and over has the highest likelihood of being enrolled in private schools, with 388 (26.2% in the age bracket) enrolled. Conversely, the age group of 18 to 19 year olds has the lowest likelihood of being enrolled in a private school, with 2,337 (98.3% in the age bracket) attending a public institution.
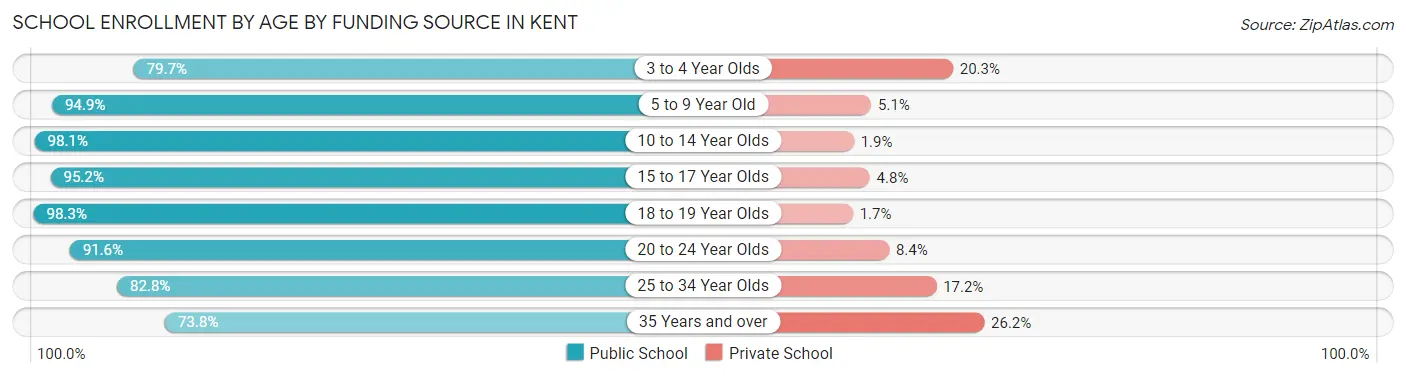
| Age Bracket | Public School | Private School |
| 3 to 4 Year Olds | 859 (79.7%) | 219 (20.3%) |
| 5 to 9 Year Old | 8,806 (94.9%) | 474 (5.1%) |
| 10 to 14 Year Olds | 9,126 (98.1%) | 174 (1.9%) |
| 15 to 17 Year Olds | 4,365 (95.2%) | 222 (4.8%) |
| 18 to 19 Year Olds | 2,337 (98.3%) | 40 (1.7%) |
| 20 to 24 Year Olds | 2,573 (91.6%) | 237 (8.4%) |
| 25 to 34 Year Olds | 1,566 (82.8%) | 326 (17.2%) |
| 35 Years and over | 1,095 (73.8%) | 388 (26.2%) |
| Total | 30,740 (93.7%) | 2,067 (6.3%) |
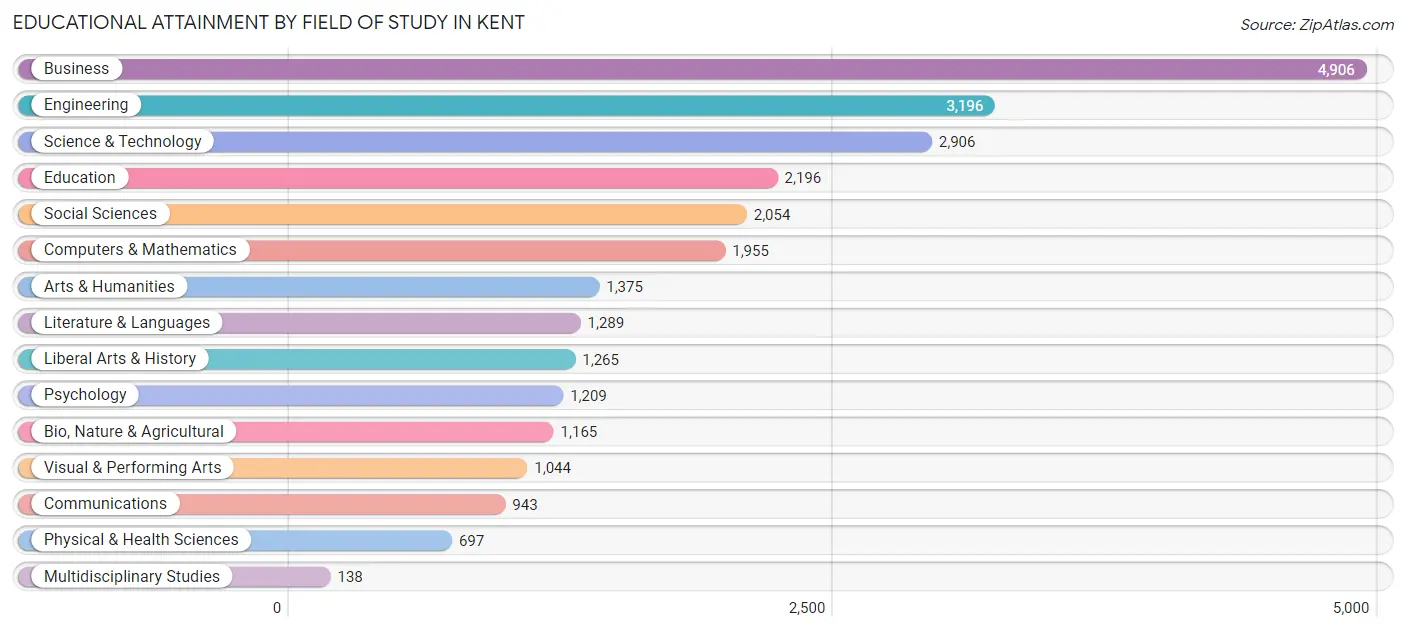
Educational Attainment by Field of Study in Kent
Business (4,906 | 18.6%), engineering (3,196 | 12.1%), science & technology (2,906 | 11.0%), education (2,196 | 8.3%), and social sciences (2,054 | 7.8%) are the most common fields of study among 26,338 individuals in Kent who have obtained a bachelor's degree or higher.
| Field of Study | # Graduates | % Graduates |
| Computers & Mathematics | 1,955 | 7.4% |
| Bio, Nature & Agricultural | 1,165 | 4.4% |
| Physical & Health Sciences | 697 | 2.6% |
| Psychology | 1,209 | 4.6% |
| Social Sciences | 2,054 | 7.8% |
| Engineering | 3,196 | 12.1% |
| Multidisciplinary Studies | 138 | 0.5% |
| Science & Technology | 2,906 | 11.0% |
| Business | 4,906 | 18.6% |
| Education | 2,196 | 8.3% |
| Literature & Languages | 1,289 | 4.9% |
| Liberal Arts & History | 1,265 | 4.8% |
| Visual & Performing Arts | 1,044 | 4.0% |
| Communications | 943 | 3.6% |
| Arts & Humanities | 1,375 | 5.2% |
| Total | 26,338 | 100.0% |
Transportation & Commute in Kent
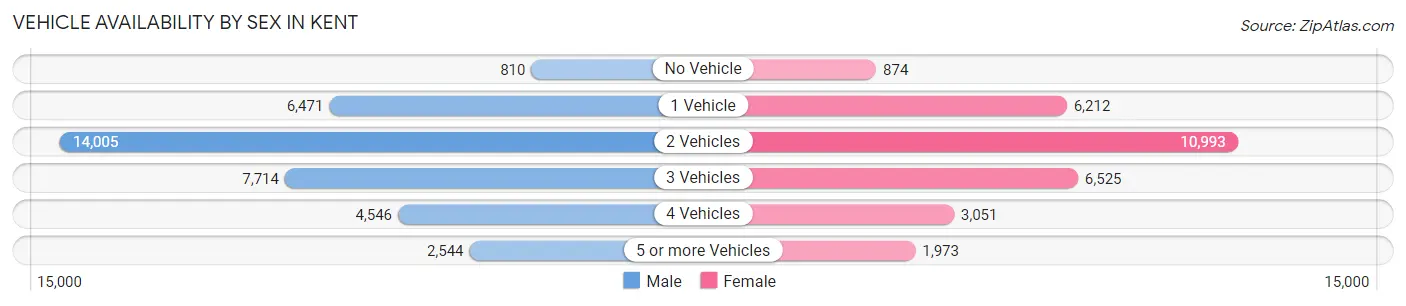
Vehicle Availability by Sex in Kent
The most prevalent vehicle ownership categories in Kent are males with 2 vehicles (14,005, accounting for 38.8%) and females with 2 vehicles (10,993, making up 47.3%).
| Vehicles Available | Male | Female |
| No Vehicle | 810 (2.2%) | 874 (2.9%) |
| 1 Vehicle | 6,471 (17.9%) | 6,212 (21.0%) |
| 2 Vehicles | 14,005 (38.8%) | 10,993 (37.1%) |
| 3 Vehicles | 7,714 (21.4%) | 6,525 (22.0%) |
| 4 Vehicles | 4,546 (12.6%) | 3,051 (10.3%) |
| 5 or more Vehicles | 2,544 (7.0%) | 1,973 (6.7%) |
| Total | 36,090 (100.0%) | 29,628 (100.0%) |
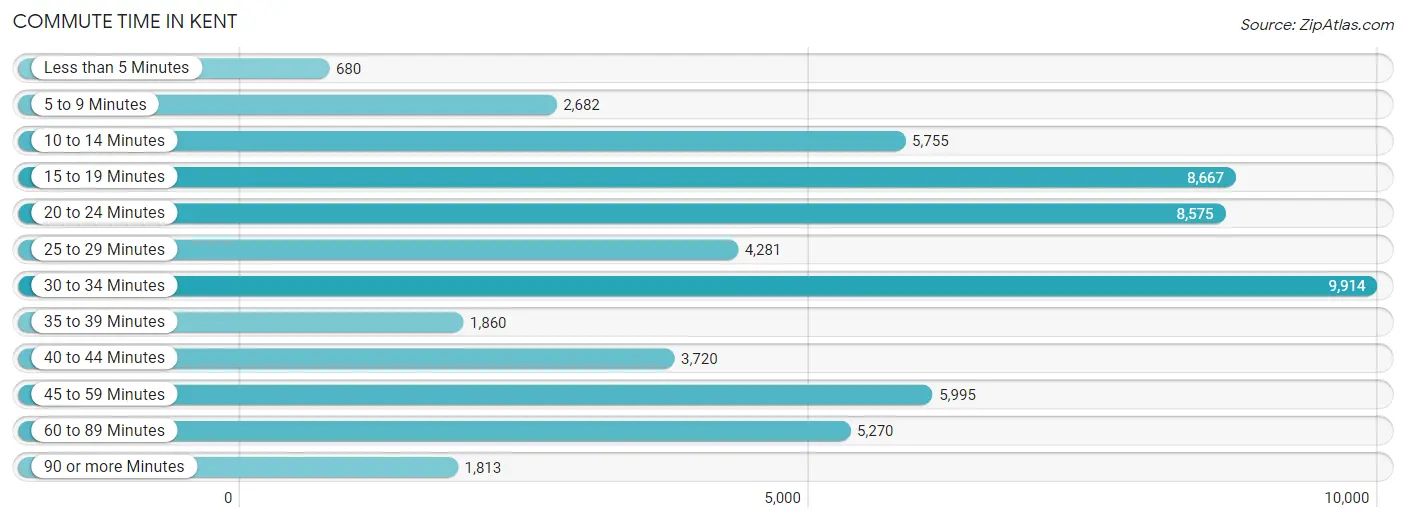
Commute Time in Kent
The most frequently occuring commute durations in Kent are 30 to 34 minutes (9,914 commuters, 16.7%), 15 to 19 minutes (8,667 commuters, 14.6%), and 20 to 24 minutes (8,575 commuters, 14.5%).
| Commute Time | # Commuters | % Commuters |
| Less than 5 Minutes | 680 | 1.1% |
| 5 to 9 Minutes | 2,682 | 4.5% |
| 10 to 14 Minutes | 5,755 | 9.7% |
| 15 to 19 Minutes | 8,667 | 14.6% |
| 20 to 24 Minutes | 8,575 | 14.5% |
| 25 to 29 Minutes | 4,281 | 7.2% |
| 30 to 34 Minutes | 9,914 | 16.7% |
| 35 to 39 Minutes | 1,860 | 3.1% |
| 40 to 44 Minutes | 3,720 | 6.3% |
| 45 to 59 Minutes | 5,995 | 10.1% |
| 60 to 89 Minutes | 5,270 | 8.9% |
| 90 or more Minutes | 1,813 | 3.1% |
Commute Time by Sex in Kent
The most common commute times in Kent are 30 to 34 minutes (6,146 commuters, 18.8%) for males and 15 to 19 minutes (3,845 commuters, 14.5%) for females.
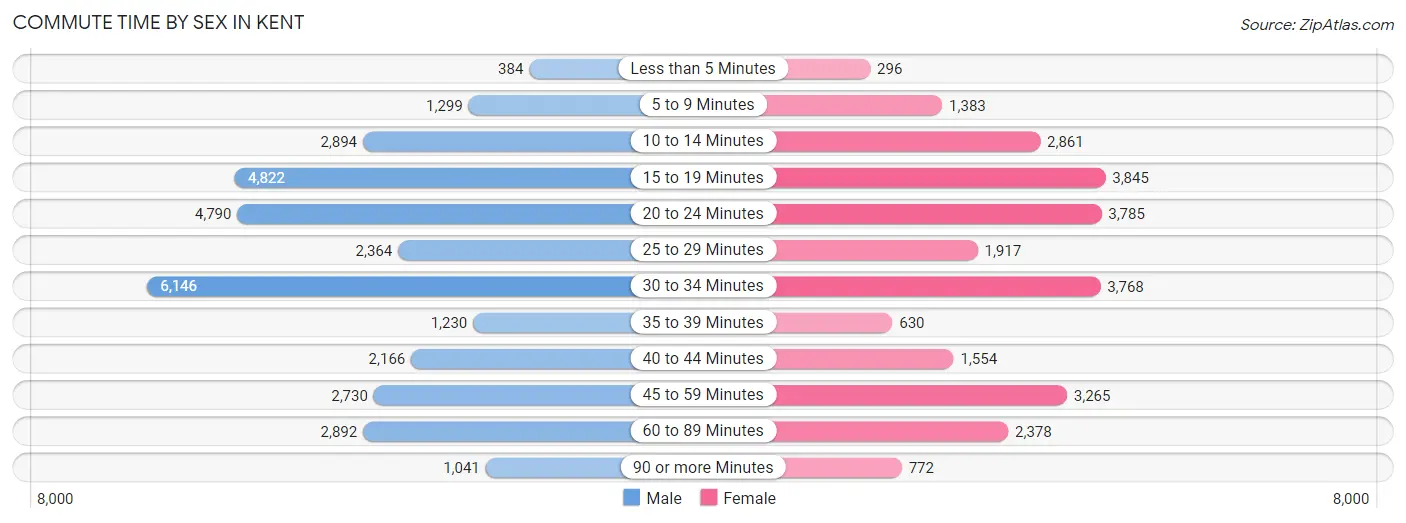
| Commute Time | Male | Female |
| Less than 5 Minutes | 384 (1.2%) | 296 (1.1%) |
| 5 to 9 Minutes | 1,299 (4.0%) | 1,383 (5.2%) |
| 10 to 14 Minutes | 2,894 (8.8%) | 2,861 (10.8%) |
| 15 to 19 Minutes | 4,822 (14.7%) | 3,845 (14.5%) |
| 20 to 24 Minutes | 4,790 (14.6%) | 3,785 (14.3%) |
| 25 to 29 Minutes | 2,364 (7.2%) | 1,917 (7.2%) |
| 30 to 34 Minutes | 6,146 (18.8%) | 3,768 (14.2%) |
| 35 to 39 Minutes | 1,230 (3.7%) | 630 (2.4%) |
| 40 to 44 Minutes | 2,166 (6.6%) | 1,554 (5.9%) |
| 45 to 59 Minutes | 2,730 (8.3%) | 3,265 (12.3%) |
| 60 to 89 Minutes | 2,892 (8.8%) | 2,378 (9.0%) |
| 90 or more Minutes | 1,041 (3.2%) | 772 (2.9%) |
Time of Departure to Work by Sex in Kent
The most frequent times of departure to work in Kent are 12:00 AM to 4:59 AM (4,056, 12.4%) for males and 7:00 AM to 7:29 AM (3,053, 11.5%) for females.
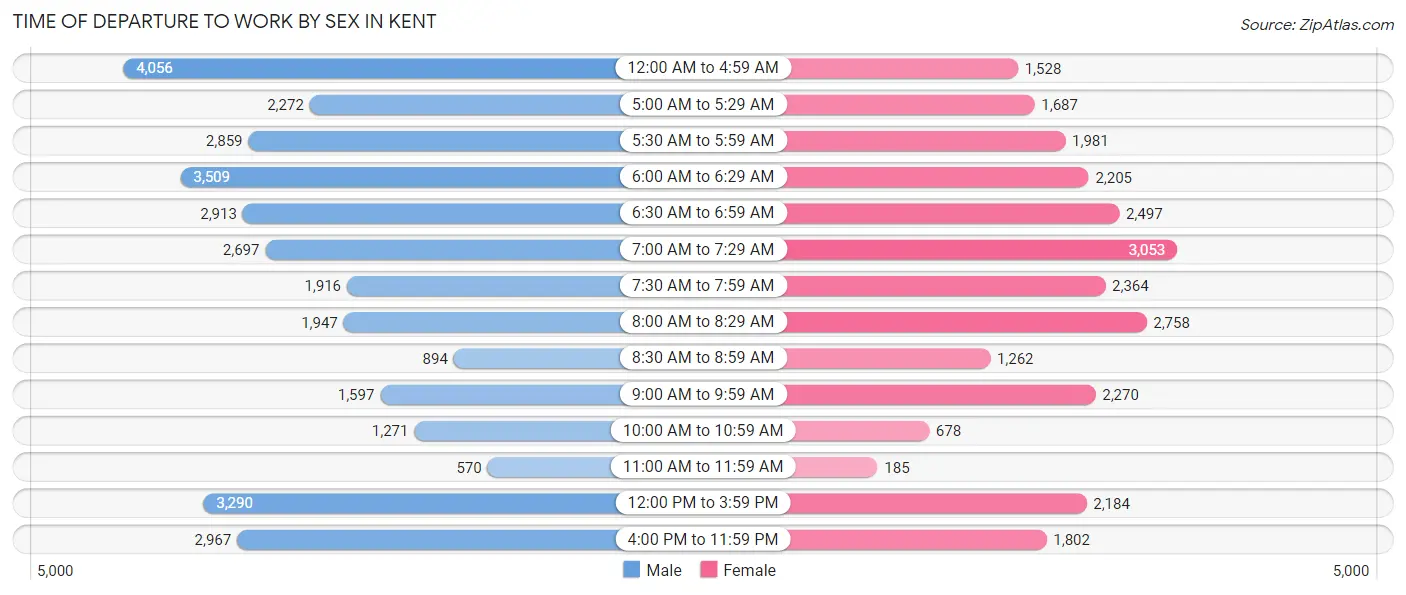
| Time of Departure | Male | Female |
| 12:00 AM to 4:59 AM | 4,056 (12.4%) | 1,528 (5.8%) |
| 5:00 AM to 5:29 AM | 2,272 (6.9%) | 1,687 (6.4%) |
| 5:30 AM to 5:59 AM | 2,859 (8.7%) | 1,981 (7.5%) |
| 6:00 AM to 6:29 AM | 3,509 (10.7%) | 2,205 (8.3%) |
| 6:30 AM to 6:59 AM | 2,913 (8.9%) | 2,497 (9.4%) |
| 7:00 AM to 7:29 AM | 2,697 (8.2%) | 3,053 (11.5%) |
| 7:30 AM to 7:59 AM | 1,916 (5.9%) | 2,364 (8.9%) |
| 8:00 AM to 8:29 AM | 1,947 (5.9%) | 2,758 (10.4%) |
| 8:30 AM to 8:59 AM | 894 (2.7%) | 1,262 (4.8%) |
| 9:00 AM to 9:59 AM | 1,597 (4.9%) | 2,270 (8.6%) |
| 10:00 AM to 10:59 AM | 1,271 (3.9%) | 678 (2.6%) |
| 11:00 AM to 11:59 AM | 570 (1.7%) | 185 (0.7%) |
| 12:00 PM to 3:59 PM | 3,290 (10.0%) | 2,184 (8.3%) |
| 4:00 PM to 11:59 PM | 2,967 (9.1%) | 1,802 (6.8%) |
| Total | 32,758 (100.0%) | 26,454 (100.0%) |
Housing Occupancy in Kent
Occupancy by Ownership in Kent
Of the total 45,699 dwellings in Kent, owner-occupied units account for 25,514 (55.8%), while renter-occupied units make up 20,185 (44.2%).
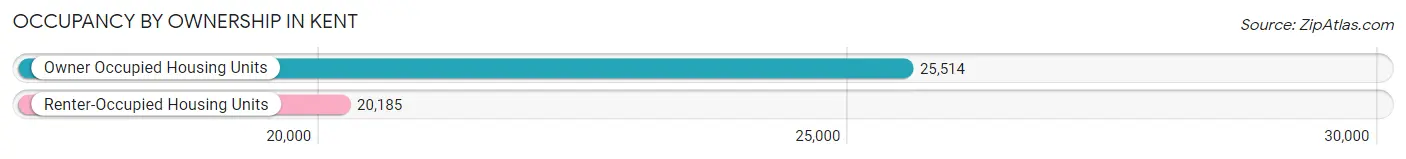
| Occupancy | # Housing Units | % Housing Units |
| Owner Occupied Housing Units | 25,514 | 55.8% |
| Renter-Occupied Housing Units | 20,185 | 44.2% |
| Total Occupied Housing Units | 45,699 | 100.0% |
Occupancy by Household Size in Kent
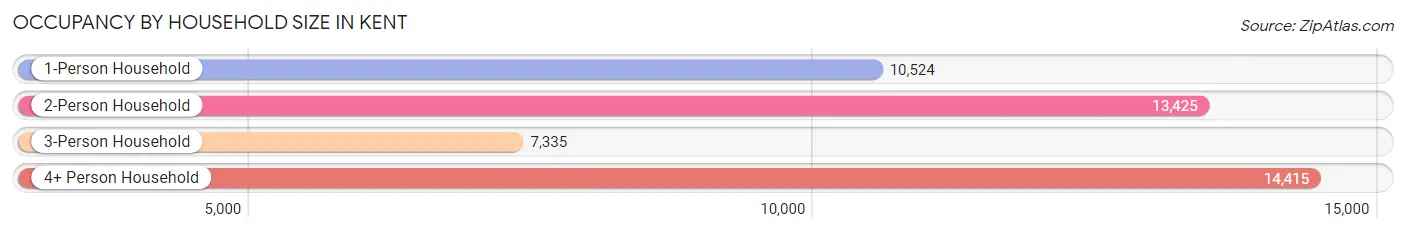
| Household Size | # Housing Units | % Housing Units |
| 1-Person Household | 10,524 | 23.0% |
| 2-Person Household | 13,425 | 29.4% |
| 3-Person Household | 7,335 | 16.1% |
| 4+ Person Household | 14,415 | 31.5% |
| Total Housing Units | 45,699 | 100.0% |
Occupancy by Ownership by Household Size in Kent
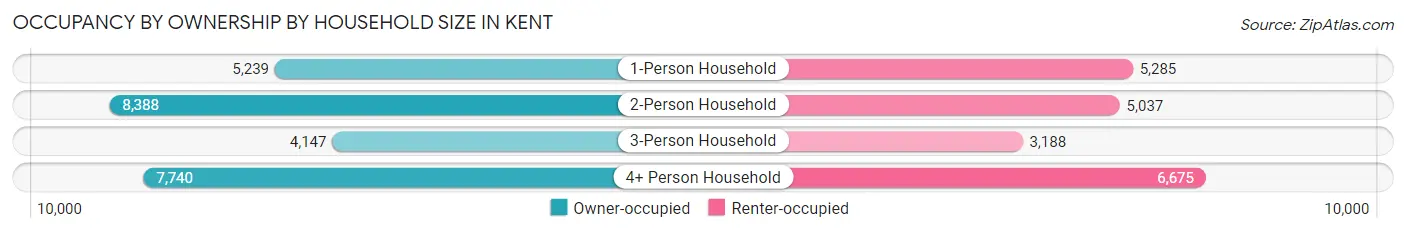
| Household Size | Owner-occupied | Renter-occupied |
| 1-Person Household | 5,239 (49.8%) | 5,285 (50.2%) |
| 2-Person Household | 8,388 (62.5%) | 5,037 (37.5%) |
| 3-Person Household | 4,147 (56.5%) | 3,188 (43.5%) |
| 4+ Person Household | 7,740 (53.7%) | 6,675 (46.3%) |
| Total Housing Units | 25,514 (55.8%) | 20,185 (44.2%) |
Occupancy by Educational Attainment in Kent
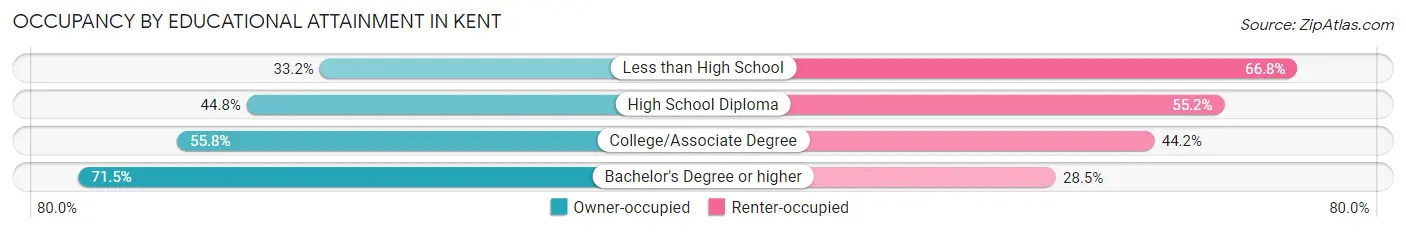
| Household Size | Owner-occupied | Renter-occupied |
| Less than High School | 1,446 (33.2%) | 2,909 (66.8%) |
| High School Diploma | 4,696 (44.8%) | 5,790 (55.2%) |
| College/Associate Degree | 9,546 (55.8%) | 7,561 (44.2%) |
| Bachelor's Degree or higher | 9,826 (71.5%) | 3,925 (28.5%) |
Occupancy by Age of Householder in Kent
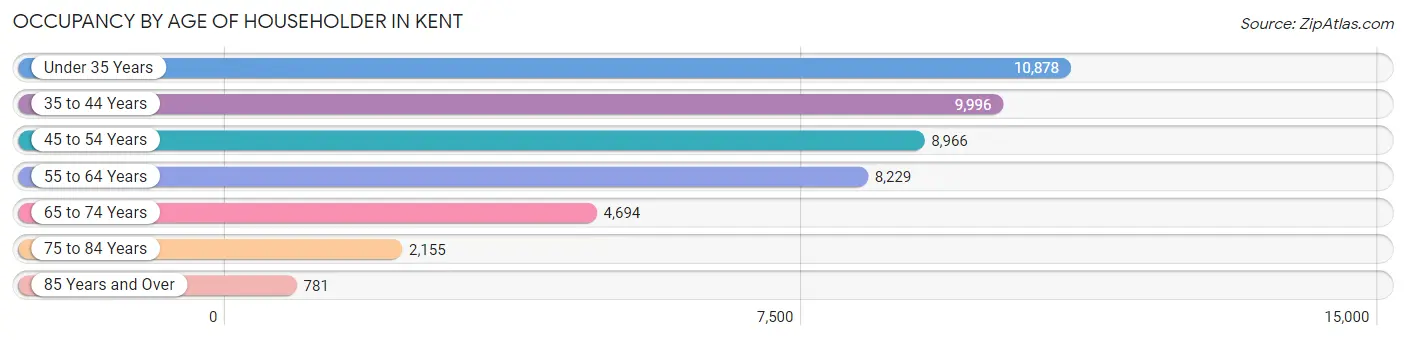
| Age Bracket | # Households | % Households |
| Under 35 Years | 10,878 | 23.8% |
| 35 to 44 Years | 9,996 | 21.9% |
| 45 to 54 Years | 8,966 | 19.6% |
| 55 to 64 Years | 8,229 | 18.0% |
| 65 to 74 Years | 4,694 | 10.3% |
| 75 to 84 Years | 2,155 | 4.7% |
| 85 Years and Over | 781 | 1.7% |
| Total | 45,699 | 100.0% |
Housing Finances in Kent
Median Income by Occupancy in Kent
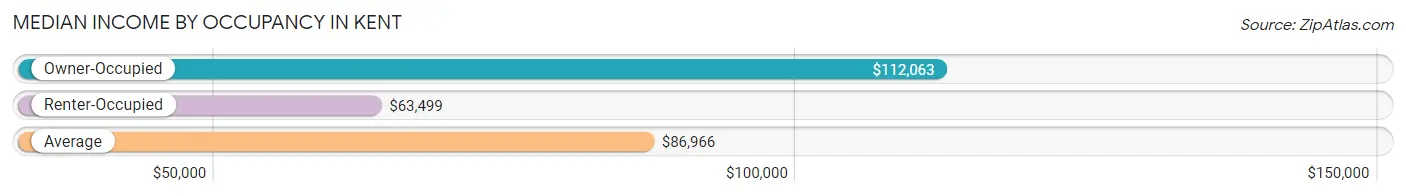
| Occupancy Type | # Households | Median Income |
| Owner-Occupied | 25,514 (55.8%) | $112,063 |
| Renter-Occupied | 20,185 (44.2%) | $63,499 |
| Average | 45,699 (100.0%) | $86,966 |
Occupancy by Householder Income Bracket in Kent
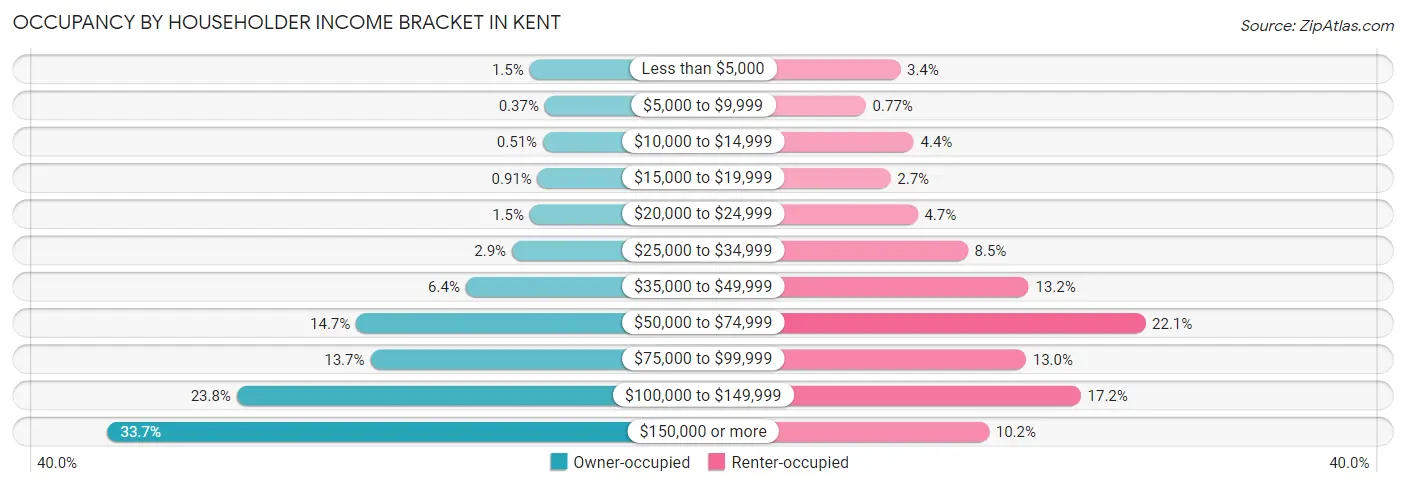
| Income Bracket | Owner-occupied | Renter-occupied |
| Less than $5,000 | 390 (1.5%) | 685 (3.4%) |
| $5,000 to $9,999 | 94 (0.4%) | 155 (0.8%) |
| $10,000 to $14,999 | 131 (0.5%) | 892 (4.4%) |
| $15,000 to $19,999 | 233 (0.9%) | 535 (2.6%) |
| $20,000 to $24,999 | 384 (1.5%) | 953 (4.7%) |
| $25,000 to $34,999 | 731 (2.9%) | 1,724 (8.5%) |
| $35,000 to $49,999 | 1,630 (6.4%) | 2,660 (13.2%) |
| $50,000 to $74,999 | 3,760 (14.7%) | 4,453 (22.1%) |
| $75,000 to $99,999 | 3,486 (13.7%) | 2,618 (13.0%) |
| $100,000 to $149,999 | 6,083 (23.8%) | 3,462 (17.2%) |
| $150,000 or more | 8,592 (33.7%) | 2,048 (10.2%) |
| Total | 25,514 (100.0%) | 20,185 (100.0%) |
Monthly Housing Cost Tiers in Kent
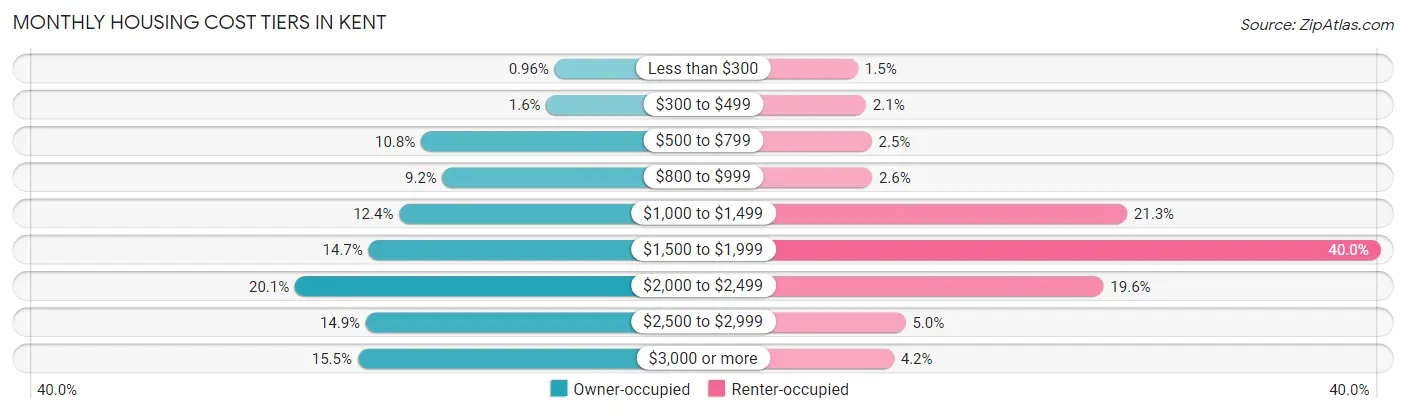
| Monthly Cost | Owner-occupied | Renter-occupied |
| Less than $300 | 244 (1.0%) | 304 (1.5%) |
| $300 to $499 | 400 (1.6%) | 424 (2.1%) |
| $500 to $799 | 2,756 (10.8%) | 508 (2.5%) |
| $800 to $999 | 2,349 (9.2%) | 515 (2.5%) |
| $1,000 to $1,499 | 3,166 (12.4%) | 4,304 (21.3%) |
| $1,500 to $1,999 | 3,742 (14.7%) | 8,075 (40.0%) |
| $2,000 to $2,499 | 5,122 (20.1%) | 3,954 (19.6%) |
| $2,500 to $2,999 | 3,791 (14.9%) | 1,011 (5.0%) |
| $3,000 or more | 3,944 (15.5%) | 837 (4.2%) |
| Total | 25,514 (100.0%) | 20,185 (100.0%) |
Physical Housing Characteristics in Kent
Housing Structures in Kent
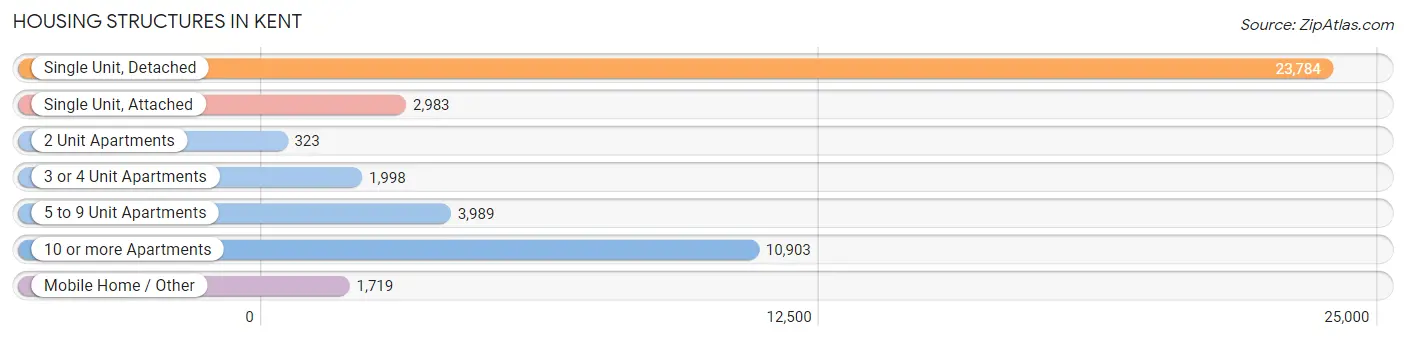
| Structure Type | # Housing Units | % Housing Units |
| Single Unit, Detached | 23,784 | 52.0% |
| Single Unit, Attached | 2,983 | 6.5% |
| 2 Unit Apartments | 323 | 0.7% |
| 3 or 4 Unit Apartments | 1,998 | 4.4% |
| 5 to 9 Unit Apartments | 3,989 | 8.7% |
| 10 or more Apartments | 10,903 | 23.9% |
| Mobile Home / Other | 1,719 | 3.8% |
| Total | 45,699 | 100.0% |
Housing Structures by Occupancy in Kent
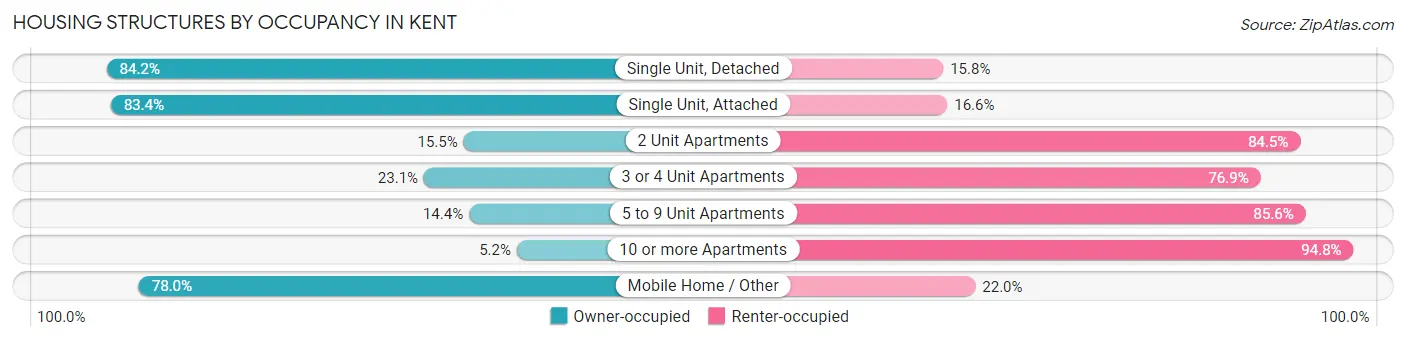
| Structure Type | Owner-occupied | Renter-occupied |
| Single Unit, Detached | 20,027 (84.2%) | 3,757 (15.8%) |
| Single Unit, Attached | 2,488 (83.4%) | 495 (16.6%) |
| 2 Unit Apartments | 50 (15.5%) | 273 (84.5%) |
| 3 or 4 Unit Apartments | 462 (23.1%) | 1,536 (76.9%) |
| 5 to 9 Unit Apartments | 576 (14.4%) | 3,413 (85.6%) |
| 10 or more Apartments | 570 (5.2%) | 10,333 (94.8%) |
| Mobile Home / Other | 1,341 (78.0%) | 378 (22.0%) |
| Total | 25,514 (55.8%) | 20,185 (44.2%) |
Housing Structures by Number of Rooms in Kent
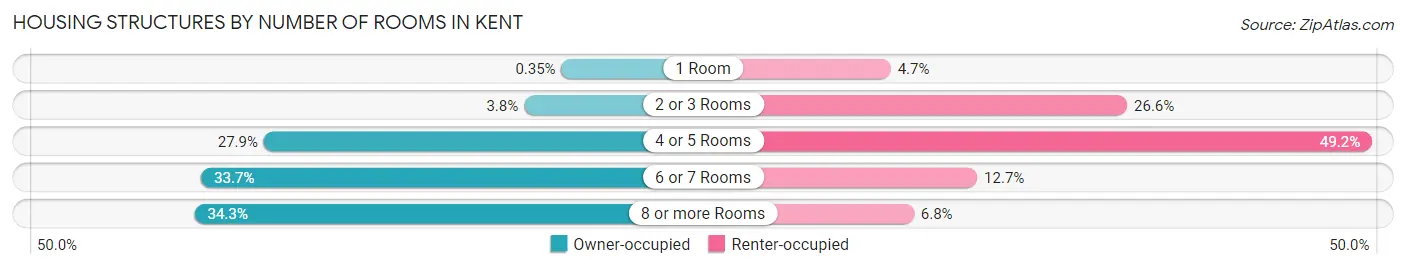
| Number of Rooms | Owner-occupied | Renter-occupied |
| 1 Room | 89 (0.4%) | 949 (4.7%) |
| 2 or 3 Rooms | 973 (3.8%) | 5,361 (26.6%) |
| 4 or 5 Rooms | 7,113 (27.9%) | 9,933 (49.2%) |
| 6 or 7 Rooms | 8,593 (33.7%) | 2,561 (12.7%) |
| 8 or more Rooms | 8,746 (34.3%) | 1,381 (6.8%) |
| Total | 25,514 (100.0%) | 20,185 (100.0%) |
Housing Structure by Heating Type in Kent
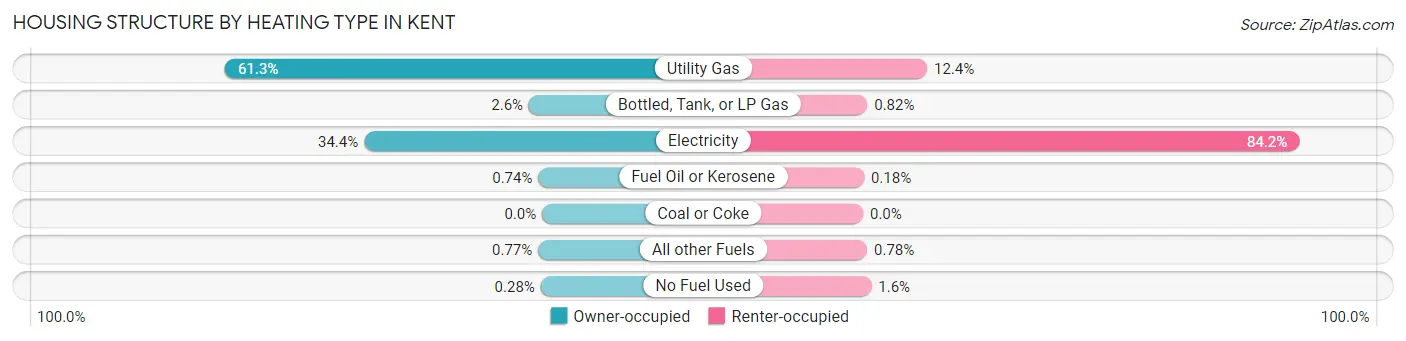
| Heating Type | Owner-occupied | Renter-occupied |
| Utility Gas | 15,631 (61.3%) | 2,497 (12.4%) |
| Bottled, Tank, or LP Gas | 650 (2.5%) | 166 (0.8%) |
| Electricity | 8,776 (34.4%) | 17,003 (84.2%) |
| Fuel Oil or Kerosene | 189 (0.7%) | 37 (0.2%) |
| Coal or Coke | 0 (0.0%) | 0 (0.0%) |
| All other Fuels | 196 (0.8%) | 158 (0.8%) |
| No Fuel Used | 72 (0.3%) | 324 (1.6%) |
| Total | 25,514 (100.0%) | 20,185 (100.0%) |
Household Vehicle Usage in Kent
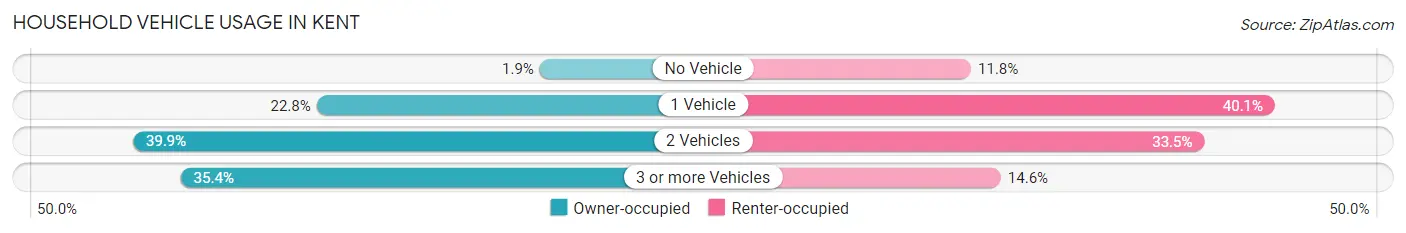
| Vehicles per Household | Owner-occupied | Renter-occupied |
| No Vehicle | 491 (1.9%) | 2,377 (11.8%) |
| 1 Vehicle | 5,805 (22.8%) | 8,100 (40.1%) |
| 2 Vehicles | 10,178 (39.9%) | 6,770 (33.5%) |
| 3 or more Vehicles | 9,040 (35.4%) | 2,938 (14.6%) |
| Total | 25,514 (100.0%) | 20,185 (100.0%) |
Real Estate & Mortgages in Kent
Real Estate and Mortgage Overview in Kent
| Characteristic | Without Mortgage | With Mortgage |
| Housing Units | 7,432 | 18,082 |
| Median Property Value | $464,500 | $483,400 |
| Median Household Income | $84,674 | $6,995 |
| Monthly Housing Costs | $847 | $3,936 |
| Real Estate Taxes | $4,908 | $321 |
Property Value by Mortgage Status in Kent
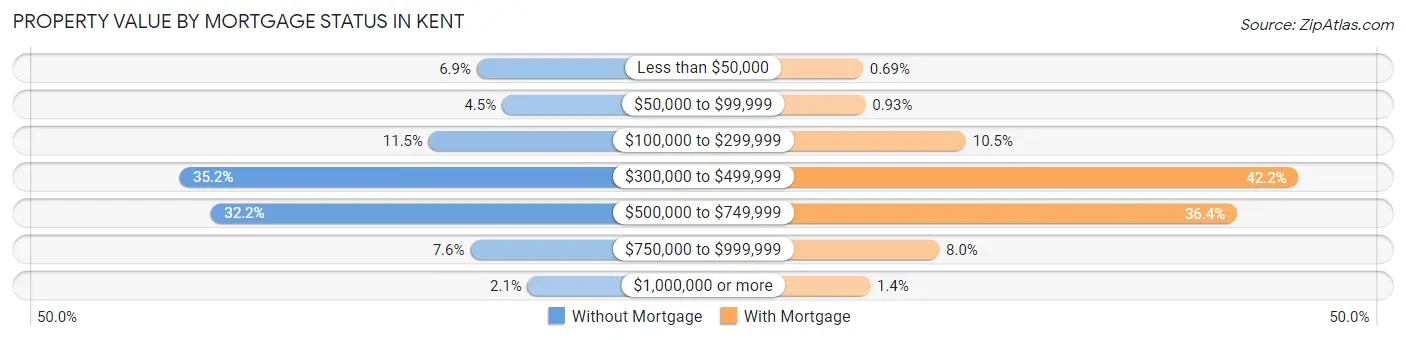
| Property Value | Without Mortgage | With Mortgage |
| Less than $50,000 | 515 (6.9%) | 124 (0.7%) |
| $50,000 to $99,999 | 337 (4.5%) | 169 (0.9%) |
| $100,000 to $299,999 | 855 (11.5%) | 1,898 (10.5%) |
| $300,000 to $499,999 | 2,615 (35.2%) | 7,629 (42.2%) |
| $500,000 to $749,999 | 2,394 (32.2%) | 6,573 (36.3%) |
| $750,000 to $999,999 | 561 (7.5%) | 1,439 (8.0%) |
| $1,000,000 or more | 155 (2.1%) | 250 (1.4%) |
| Total | 7,432 (100.0%) | 18,082 (100.0%) |
Household Income by Mortgage Status in Kent
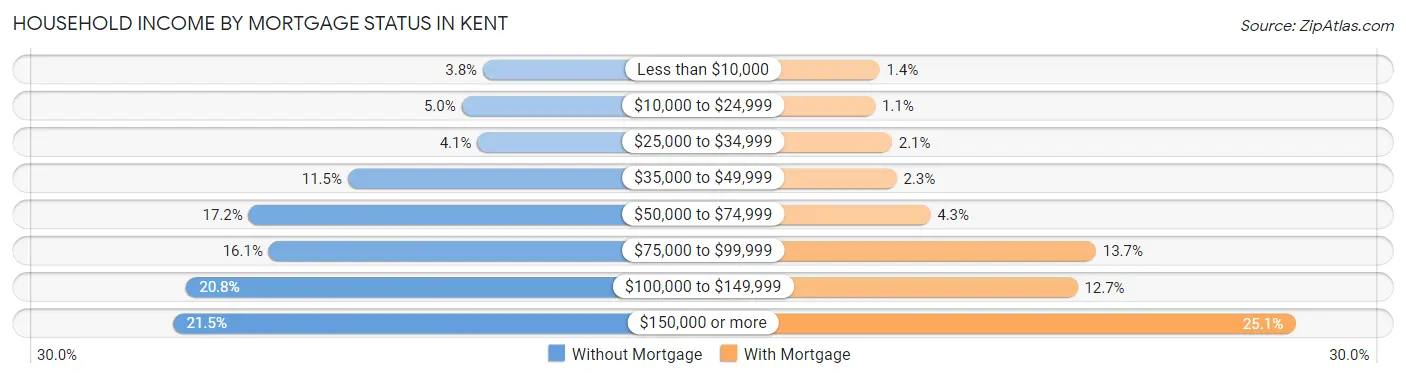
| Household Income | Without Mortgage | With Mortgage |
| Less than $10,000 | 283 (3.8%) | 247 (1.4%) |
| $10,000 to $24,999 | 374 (5.0%) | 201 (1.1%) |
| $25,000 to $34,999 | 307 (4.1%) | 374 (2.1%) |
| $35,000 to $49,999 | 857 (11.5%) | 424 (2.3%) |
| $50,000 to $74,999 | 1,278 (17.2%) | 773 (4.3%) |
| $75,000 to $99,999 | 1,193 (16.1%) | 2,482 (13.7%) |
| $100,000 to $149,999 | 1,543 (20.8%) | 2,293 (12.7%) |
| $150,000 or more | 1,597 (21.5%) | 4,540 (25.1%) |
| Total | 7,432 (100.0%) | 18,082 (100.0%) |
Property Value to Household Income Ratio in Kent
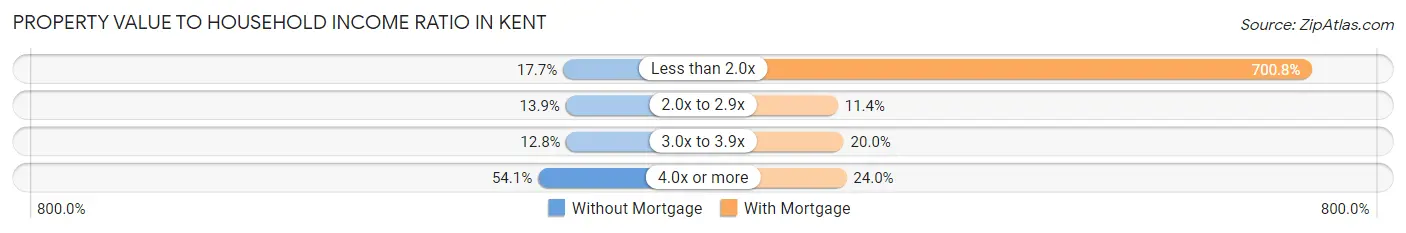
| Value-to-Income Ratio | Without Mortgage | With Mortgage |
| Less than 2.0x | 1,313 (17.7%) | 126,718 (700.8%) |
| 2.0x to 2.9x | 1,034 (13.9%) | 2,059 (11.4%) |
| 3.0x to 3.9x | 950 (12.8%) | 3,610 (20.0%) |
| 4.0x or more | 4,023 (54.1%) | 4,333 (24.0%) |
| Total | 7,432 (100.0%) | 18,082 (100.0%) |
Real Estate Taxes by Mortgage Status in Kent
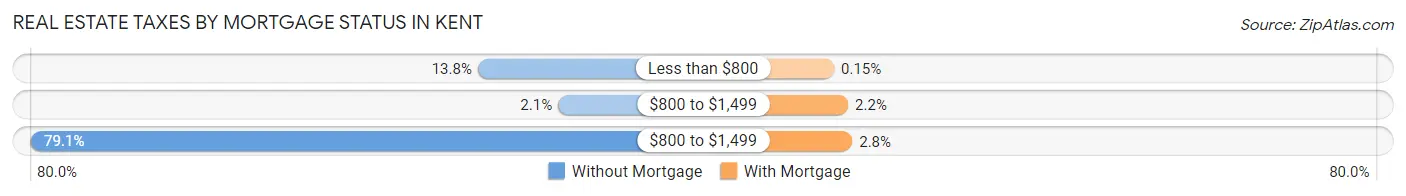
| Property Taxes | Without Mortgage | With Mortgage |
| Less than $800 | 1,025 (13.8%) | 28 (0.2%) |
| $800 to $1,499 | 153 (2.1%) | 399 (2.2%) |
| $800 to $1,499 | 5,875 (79.0%) | 509 (2.8%) |
| Total | 7,432 (100.0%) | 18,082 (100.0%) |
Health & Disability in Kent
Health Insurance Coverage by Age in Kent
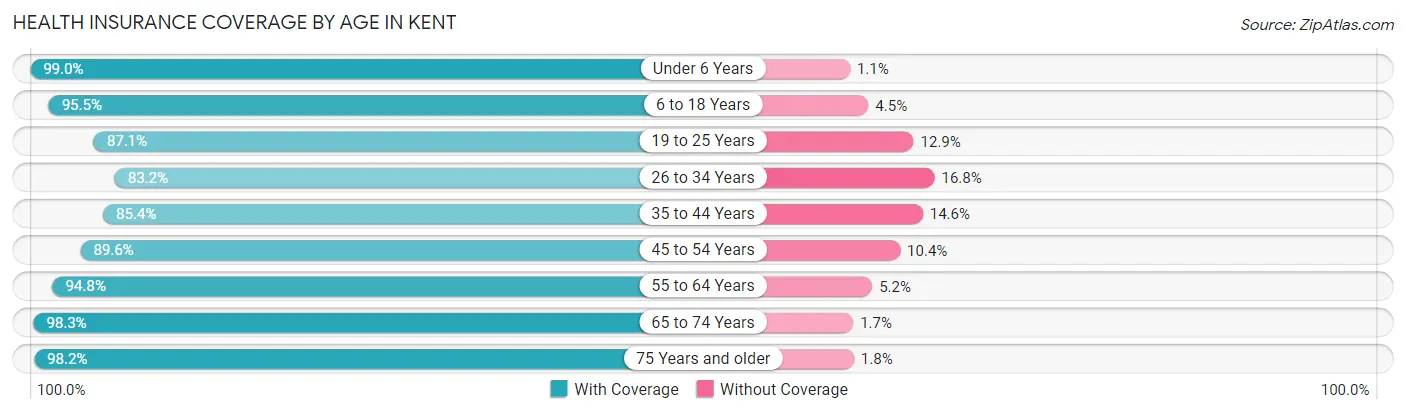
| Age Bracket | With Coverage | Without Coverage |
| Under 6 Years | 10,924 (99.0%) | 116 (1.1%) |
| 6 to 18 Years | 23,095 (95.5%) | 1,087 (4.5%) |
| 19 to 25 Years | 10,780 (87.1%) | 1,599 (12.9%) |
| 26 to 34 Years | 16,894 (83.2%) | 3,418 (16.8%) |
| 35 to 44 Years | 16,498 (85.4%) | 2,829 (14.6%) |
| 45 to 54 Years | 14,383 (89.6%) | 1,673 (10.4%) |
| 55 to 64 Years | 15,425 (94.8%) | 847 (5.2%) |
| 65 to 74 Years | 8,779 (98.3%) | 148 (1.7%) |
| 75 Years and older | 5,322 (98.2%) | 97 (1.8%) |
| Total | 122,100 (91.2%) | 11,814 (8.8%) |
Health Insurance Coverage by Citizenship Status in Kent
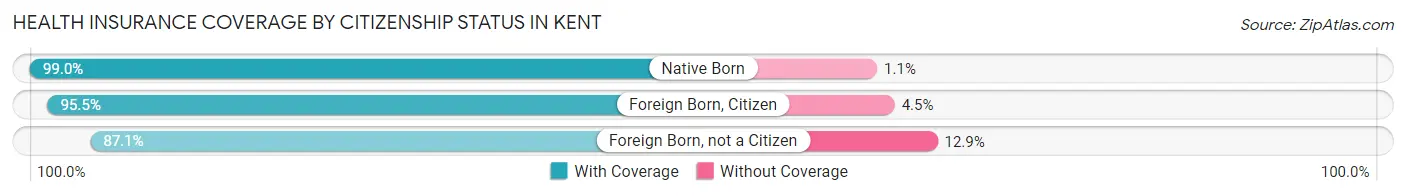
| Citizenship Status | With Coverage | Without Coverage |
| Native Born | 10,924 (99.0%) | 116 (1.1%) |
| Foreign Born, Citizen | 23,095 (95.5%) | 1,087 (4.5%) |
| Foreign Born, not a Citizen | 10,780 (87.1%) | 1,599 (12.9%) |
Health Insurance Coverage by Household Income in Kent
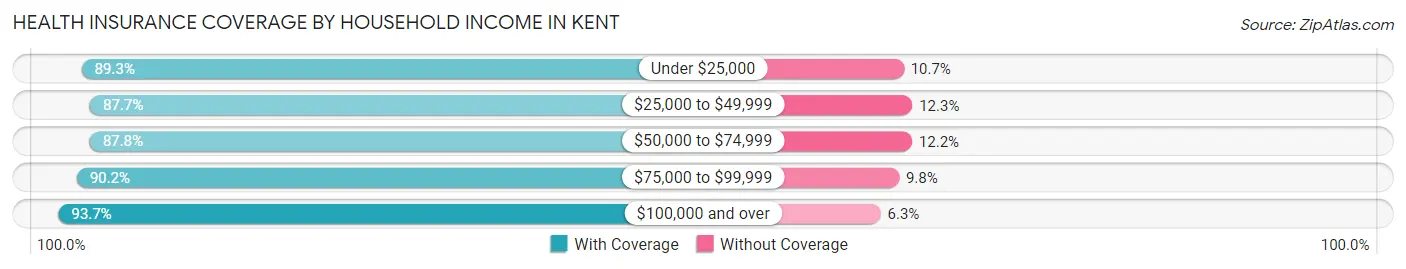
| Household Income | With Coverage | Without Coverage |
| Under $25,000 | 8,795 (89.3%) | 1,049 (10.7%) |
| $25,000 to $49,999 | 14,140 (87.7%) | 1,976 (12.3%) |
| $50,000 to $74,999 | 20,139 (87.8%) | 2,801 (12.2%) |
| $75,000 to $99,999 | 15,323 (90.2%) | 1,659 (9.8%) |
| $100,000 and over | 62,849 (93.7%) | 4,255 (6.3%) |
Public vs Private Health Insurance Coverage by Age in Kent
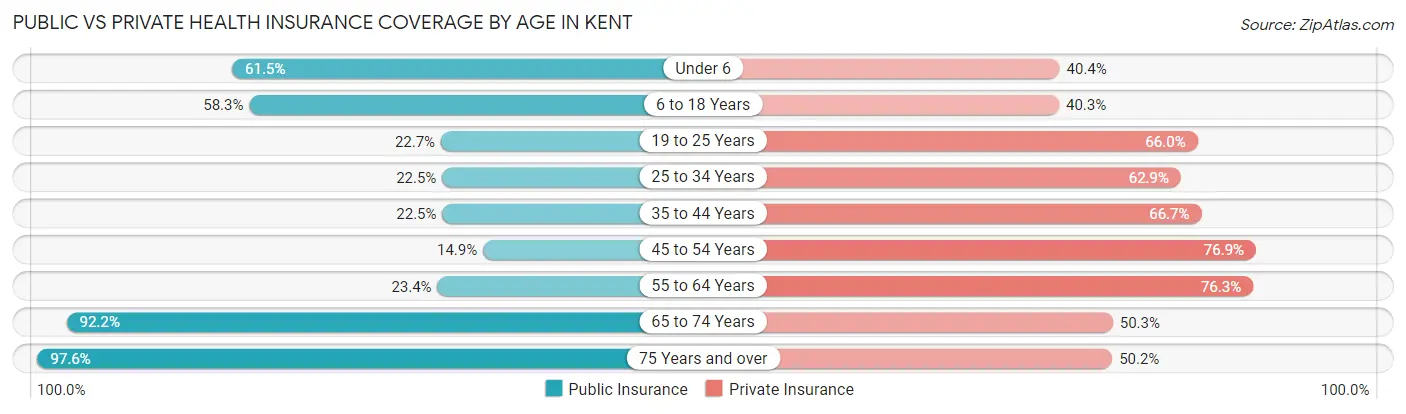
| Age Bracket | Public Insurance | Private Insurance |
| Under 6 | 6,787 (61.5%) | 4,463 (40.4%) |
| 6 to 18 Years | 14,097 (58.3%) | 9,753 (40.3%) |
| 19 to 25 Years | 2,812 (22.7%) | 8,171 (66.0%) |
| 25 to 34 Years | 4,569 (22.5%) | 12,780 (62.9%) |
| 35 to 44 Years | 4,340 (22.5%) | 12,896 (66.7%) |
| 45 to 54 Years | 2,393 (14.9%) | 12,340 (76.9%) |
| 55 to 64 Years | 3,802 (23.4%) | 12,419 (76.3%) |
| 65 to 74 Years | 8,232 (92.2%) | 4,490 (50.3%) |
| 75 Years and over | 5,290 (97.6%) | 2,720 (50.2%) |
| Total | 52,322 (39.1%) | 80,032 (59.8%) |
Disability Status by Sex by Age in Kent
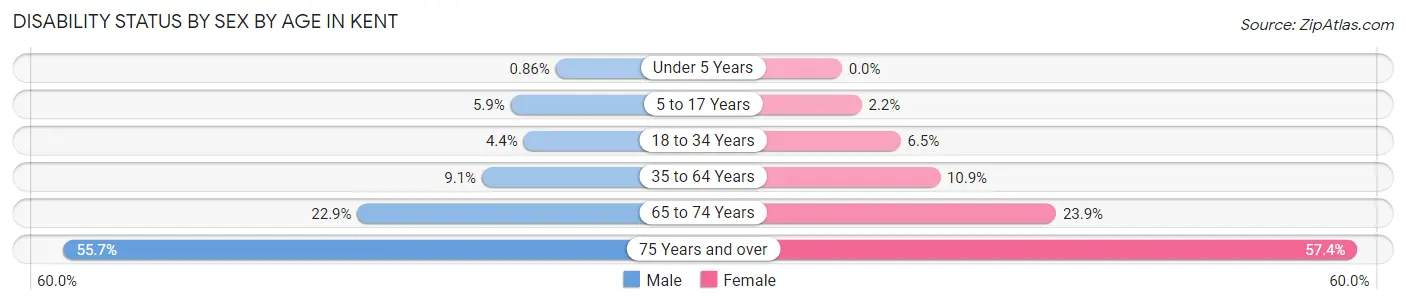
| Age Bracket | Male | Female |
| Under 5 Years | 42 (0.9%) | 0 (0.0%) |
| 5 to 17 Years | 787 (5.9%) | 246 (2.2%) |
| 18 to 34 Years | 800 (4.4%) | 1,086 (6.5%) |
| 35 to 64 Years | 2,321 (9.1%) | 2,851 (10.9%) |
| 65 to 74 Years | 883 (22.9%) | 1,211 (23.8%) |
| 75 Years and over | 1,318 (55.7%) | 1,752 (57.4%) |
Disability Class by Sex by Age in Kent
Disability Class: Hearing Difficulty
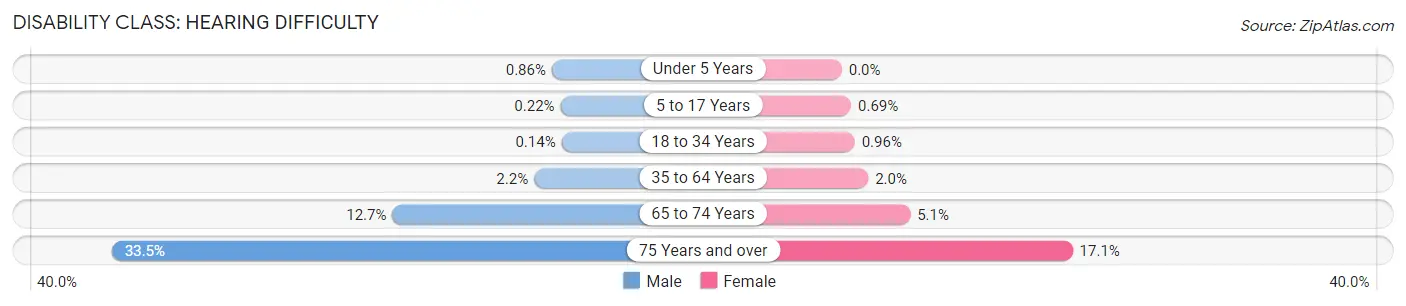
| Age Bracket | Male | Female |
| Under 5 Years | 42 (0.9%) | 0 (0.0%) |
| 5 to 17 Years | 29 (0.2%) | 77 (0.7%) |
| 18 to 34 Years | 26 (0.1%) | 160 (1.0%) |
| 35 to 64 Years | 557 (2.2%) | 510 (2.0%) |
| 65 to 74 Years | 489 (12.7%) | 258 (5.1%) |
| 75 Years and over | 794 (33.5%) | 523 (17.1%) |
Disability Class: Vision Difficulty
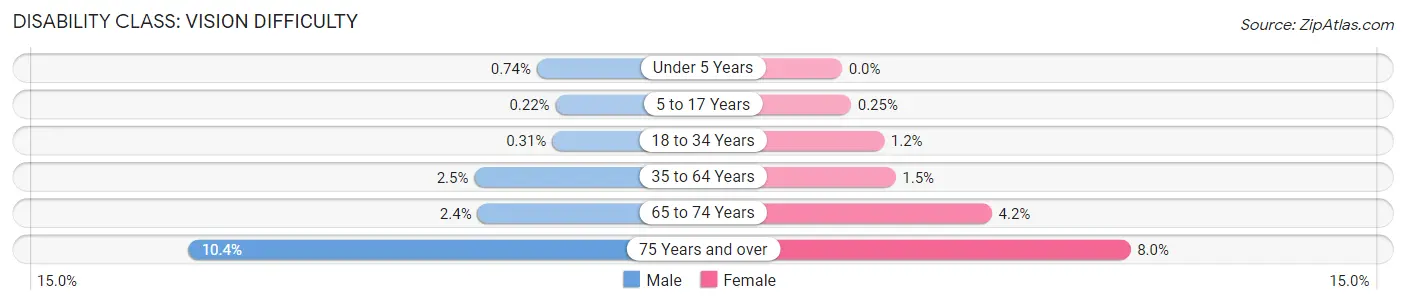
| Age Bracket | Male | Female |
| Under 5 Years | 36 (0.7%) | 0 (0.0%) |
| 5 to 17 Years | 29 (0.2%) | 28 (0.3%) |
| 18 to 34 Years | 56 (0.3%) | 194 (1.2%) |
| 35 to 64 Years | 634 (2.5%) | 388 (1.5%) |
| 65 to 74 Years | 92 (2.4%) | 212 (4.2%) |
| 75 Years and over | 247 (10.4%) | 245 (8.0%) |
Disability Class: Cognitive Difficulty
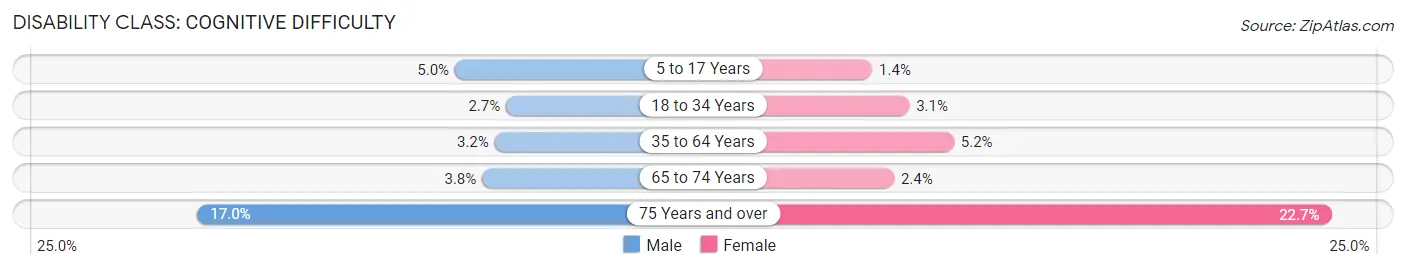
| Age Bracket | Male | Female |
| 5 to 17 Years | 673 (5.0%) | 157 (1.4%) |
| 18 to 34 Years | 481 (2.7%) | 520 (3.1%) |
| 35 to 64 Years | 817 (3.2%) | 1,357 (5.2%) |
| 65 to 74 Years | 145 (3.8%) | 123 (2.4%) |
| 75 Years and over | 402 (17.0%) | 693 (22.7%) |
Disability Class: Ambulatory Difficulty
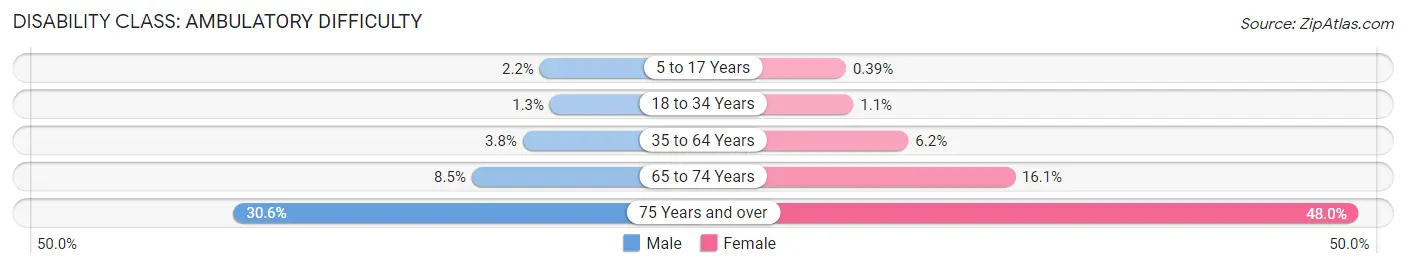
| Age Bracket | Male | Female |
| 5 to 17 Years | 295 (2.2%) | 43 (0.4%) |
| 18 to 34 Years | 226 (1.3%) | 178 (1.1%) |
| 35 to 64 Years | 965 (3.8%) | 1,612 (6.2%) |
| 65 to 74 Years | 327 (8.5%) | 816 (16.1%) |
| 75 Years and over | 725 (30.6%) | 1,463 (47.9%) |
Disability Class: Self-Care Difficulty
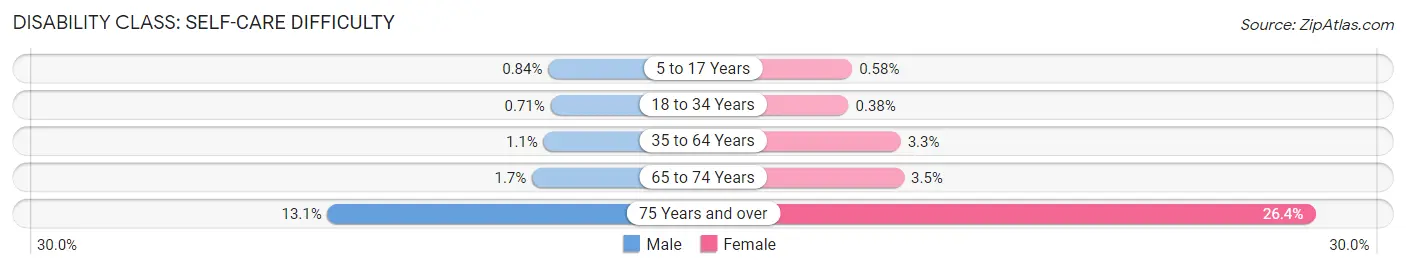
| Age Bracket | Male | Female |
| 5 to 17 Years | 113 (0.8%) | 65 (0.6%) |
| 18 to 34 Years | 129 (0.7%) | 63 (0.4%) |
| 35 to 64 Years | 281 (1.1%) | 854 (3.3%) |
| 65 to 74 Years | 67 (1.7%) | 176 (3.5%) |
| 75 Years and over | 311 (13.1%) | 804 (26.4%) |
Technology Access in Kent
Computing Device Access in Kent
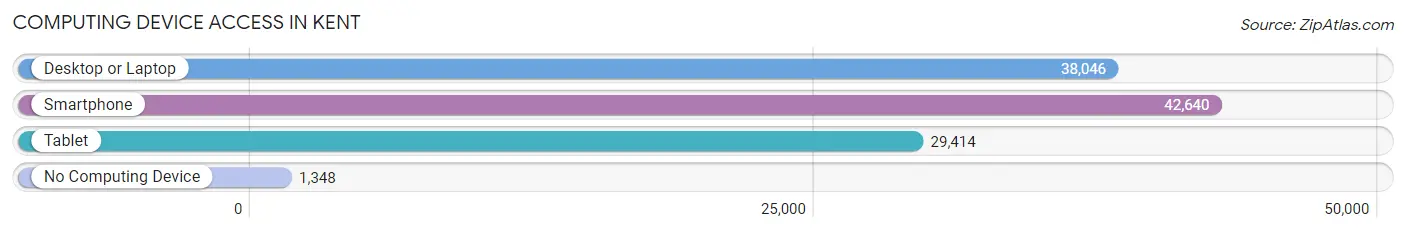
| Device Type | # Households | % Households |
| Desktop or Laptop | 38,046 | 83.3% |
| Smartphone | 42,640 | 93.3% |
| Tablet | 29,414 | 64.4% |
| No Computing Device | 1,348 | 2.9% |
| Total | 45,699 | 100.0% |
Internet Access in Kent
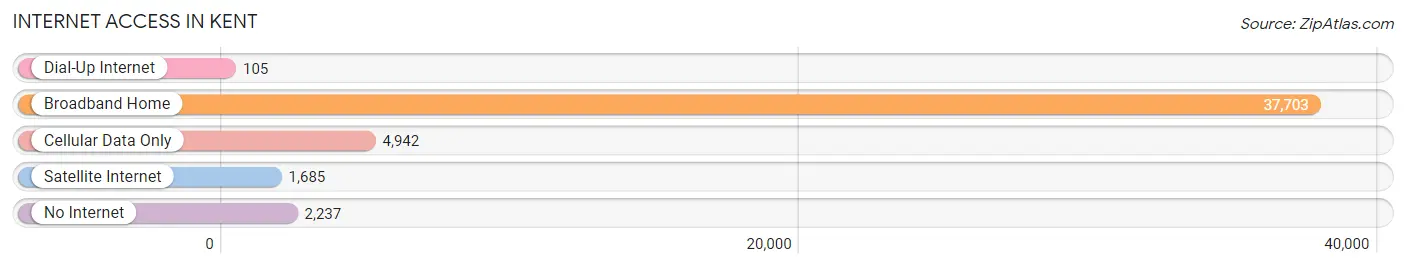
| Internet Type | # Households | % Households |
| Dial-Up Internet | 105 | 0.2% |
| Broadband Home | 37,703 | 82.5% |
| Cellular Data Only | 4,942 | 10.8% |
| Satellite Internet | 1,685 | 3.7% |
| No Internet | 2,237 | 4.9% |
| Total | 45,699 | 100.0% |
Kent Summary
Kent, Washington is a city located in King County, Washington, United States. It is the sixth largest city in the state and the third largest in the county. The population was 92,411 at the 2010 census. The city is located in the heart of the Seattle-Tacoma metropolitan area, approximately 19 miles (31 km) south of Seattle and 19 miles (31 km) northeast of Tacoma.
History
The area that is now Kent was first settled by Europeans in the late 1800s. The first settlers were mostly farmers and loggers who were attracted to the area by its rich soil and abundant timber. The area was originally known as Titusville, after the first settler, William Titus. In 1891, the area was renamed Kent after the city of Kent in England.
In the early 1900s, the area began to grow rapidly as the Seattle-Tacoma area became a major center for industry and commerce. The city was officially incorporated in 1890 and has since grown to become the sixth largest city in the state.
Geography
Kent is located in the heart of the Seattle-Tacoma metropolitan area, approximately 19 miles (31 km) south of Seattle and 19 miles (31 km) northeast of Tacoma. The city is situated on the banks of the Green River, which flows through the city and into Puget Sound. The city is bordered by the cities of Auburn to the north, Renton to the east, Covington to the south, and Federal Way to the west.
The city has a total area of 29.2 square miles (75.6 km2), of which 28.9 square miles (74.8 km2) is land and 0.3 square miles (0.8 km2) is water. The city is located at an elevation of approximately 300 feet (91 m).
Economy
The economy of Kent is largely based on the service industry, with many of the city’s largest employers being in the retail, healthcare, and education sectors. The city is also home to several major manufacturing companies, including Boeing, Amazon, and Microsoft.
The city’s largest employers include Boeing, Amazon, Microsoft, Valley Medical Center, Kent School District, and the City of Kent.
Demographics
As of the 2010 census, the population of Kent was 92,411. The racial makeup of the city was 57.2% White, 16.3% Asian, 14.2% Hispanic or Latino, 8.2% African American, 0.7% Native American, 0.2% Pacific Islander, and 2.4% from other races.
The median household income in Kent was $60,945 in 2017. The median age of the city’s population was 35.7 years. The city’s population is also highly educated, with over 40% of the population having a bachelor’s degree or higher.
Conclusion
Kent, Washington is a vibrant city located in the heart of the Seattle-Tacoma metropolitan area. The city has a rich history and a diverse population that is highly educated and economically successful. The city’s economy is largely based on the service industry, with many of the city’s largest employers being in the retail, healthcare, and education sectors. Kent is a great place to live, work, and play, and is sure to continue to grow and thrive in the years to come.
Common Questions
What is Per Capita Income in Kent?
Per Capita income in Kent is $39,714.
What is the Median Family Income in Kent?
Median Family Income in Kent is $97,310.
What is the Median Household income in Kent?
Median Household Income in Kent is $86,966.
What is Income or Wage Gap in Kent?
Income or Wage Gap in Kent is 18.0%.
Women in Kent earn 82.0 cents for every dollar earned by a man.
What is Family Income Deficit in Kent?
Family Income Deficit in Kent is $11,971.
Families that are below poverty line in Kent earn $11,971 less on average than the poverty threshold level.
What is Inequality or Gini Index in Kent?
Inequality or Gini Index in Kent is 0.42.
What is the Total Population of Kent?
Total Population of Kent is 135,169.
What is the Total Male Population of Kent?
Total Male Population of Kent is 69,099.
What is the Total Female Population of Kent?
Total Female Population of Kent is 66,070.
What is the Ratio of Males per 100 Females in Kent?
There are 104.58 Males per 100 Females in Kent.
What is the Ratio of Females per 100 Males in Kent?
There are 95.62 Females per 100 Males in Kent.
What is the Median Population Age in Kent?
Median Population Age in Kent is 34.7 Years.
What is the Average Family Size in Kent
Average Family Size in Kent is 3.5 People.
What is the Average Household Size in Kent
Average Household Size in Kent is 2.9 People.
How Large is the Labor Force in Kent?
There are 73,169 People in the Labor Forcein in Kent.
What is the Percentage of People in the Labor Force in Kent?
69.7% of People are in the Labor Force in Kent.
What is the Unemployment Rate in Kent?
Unemployment Rate in Kent is 7.6%.