University Place, WA Map & Demographics
University Place Map
University Place Overview
$46,467
PER CAPITA INCOME
$107,208
AVG FAMILY INCOME
$89,658
AVG HOUSEHOLD INCOME
22.3%
WAGE / INCOME GAP [ % ]
77.7¢/ $1
WAGE / INCOME GAP [ $ ]
$8,282
FAMILY INCOME DEFICIT
0.44
INEQUALITY / GINI INDEX
34,696
TOTAL POPULATION
16,809
MALE POPULATION
17,887
FEMALE POPULATION
93.97
MALES / 100 FEMALES
106.41
FEMALES / 100 MALES
38.6
MEDIAN AGE
3.1
AVG FAMILY SIZE
2.5
AVG HOUSEHOLD SIZE
17,408
LABOR FORCE [ PEOPLE ]
63.4%
PERCENT IN LABOR FORCE
3.7%
UNEMPLOYMENT RATE
University Place Zip Codes
University Place Area Codes
Income in University Place
Income Overview in University Place
Per Capita Income in University Place is $46,467, while median incomes of families and households are $107,208 and $89,658 respectively.
| Characteristic | Number | Measure |
| Per Capita Income | 34,696 | $46,467 |
| Median Family Income | 8,885 | $107,208 |
| Mean Family Income | 8,885 | $136,048 |
| Median Household Income | 13,682 | $89,658 |
| Mean Household Income | 13,682 | $115,118 |
| Income Deficit | 8,885 | $8,282 |
| Wage / Income Gap (%) | 34,696 | 22.29% |
| Wage / Income Gap ($) | 34,696 | 77.71¢ per $1 |
| Gini / Inequality Index | 34,696 | 0.44 |
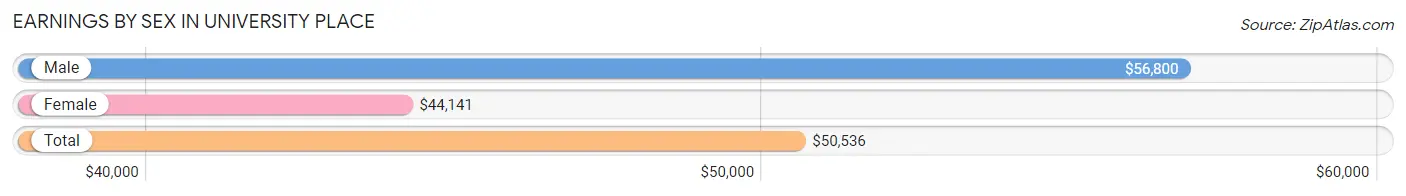
Earnings by Sex in University Place
Average Earnings in University Place are $50,536, $56,800 for men and $44,141 for women, a difference of 22.3%.
| Sex | Number | Average Earnings |
| Male | 9,453 (51.3%) | $56,800 |
| Female | 8,978 (48.7%) | $44,141 |
| Total | 18,431 (100.0%) | $50,536 |
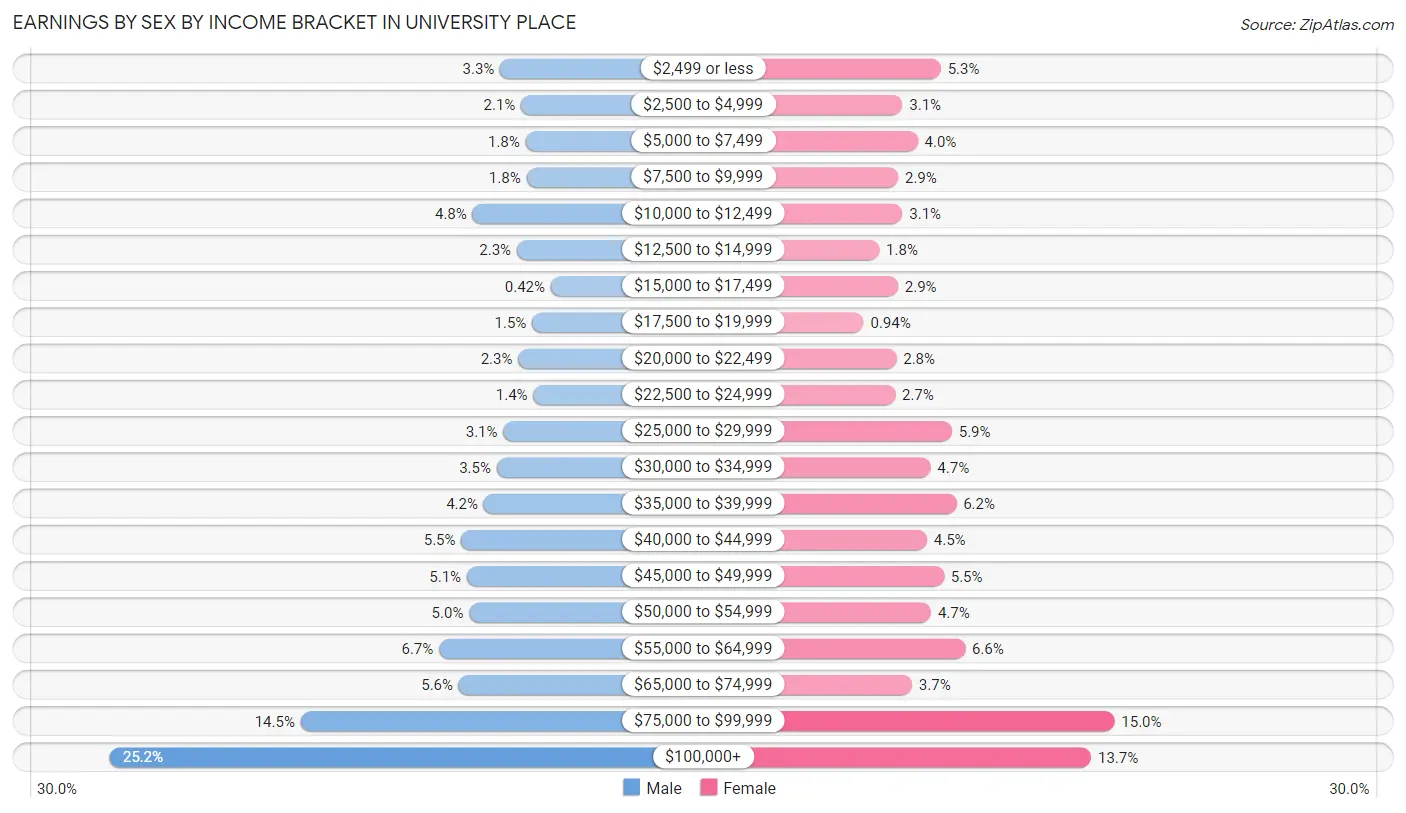
Earnings by Sex by Income Bracket in University Place
The most common earnings brackets in University Place are $100,000+ for men (2,383 | 25.2%) and $75,000 to $99,999 for women (1,350 | 15.0%).
| Income | Male | Female |
| $2,499 or less | 309 (3.3%) | 474 (5.3%) |
| $2,500 to $4,999 | 198 (2.1%) | 280 (3.1%) |
| $5,000 to $7,499 | 174 (1.8%) | 357 (4.0%) |
| $7,500 to $9,999 | 169 (1.8%) | 259 (2.9%) |
| $10,000 to $12,499 | 456 (4.8%) | 280 (3.1%) |
| $12,500 to $14,999 | 220 (2.3%) | 163 (1.8%) |
| $15,000 to $17,499 | 40 (0.4%) | 258 (2.9%) |
| $17,500 to $19,999 | 139 (1.5%) | 84 (0.9%) |
| $20,000 to $22,499 | 213 (2.2%) | 250 (2.8%) |
| $22,500 to $24,999 | 132 (1.4%) | 243 (2.7%) |
| $25,000 to $29,999 | 292 (3.1%) | 530 (5.9%) |
| $30,000 to $34,999 | 327 (3.5%) | 422 (4.7%) |
| $35,000 to $39,999 | 396 (4.2%) | 552 (6.1%) |
| $40,000 to $44,999 | 515 (5.4%) | 404 (4.5%) |
| $45,000 to $49,999 | 486 (5.1%) | 489 (5.4%) |
| $50,000 to $54,999 | 474 (5.0%) | 425 (4.7%) |
| $55,000 to $64,999 | 633 (6.7%) | 596 (6.6%) |
| $65,000 to $74,999 | 528 (5.6%) | 329 (3.7%) |
| $75,000 to $99,999 | 1,369 (14.5%) | 1,350 (15.0%) |
| $100,000+ | 2,383 (25.2%) | 1,233 (13.7%) |
| Total | 9,453 (100.0%) | 8,978 (100.0%) |
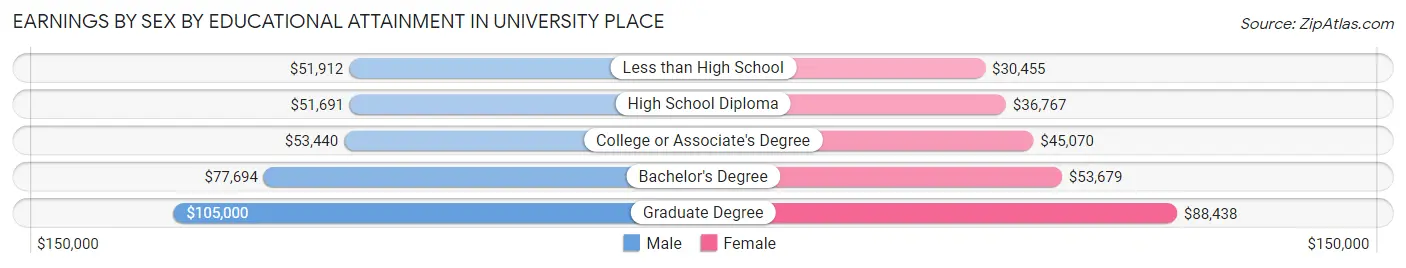
Earnings by Sex by Educational Attainment in University Place
Average earnings in University Place are $68,556 for men and $51,573 for women, a difference of 24.8%. Men with an educational attainment of graduate degree enjoy the highest average annual earnings of $105,000, while those with high school diploma education earn the least with $51,691. Women with an educational attainment of graduate degree earn the most with the average annual earnings of $88,438, while those with less than high school education have the smallest earnings of $30,455.
| Educational Attainment | Male Income | Female Income |
| Less than High School | $51,912 | $30,455 |
| High School Diploma | $51,691 | $36,767 |
| College or Associate's Degree | $53,440 | $45,070 |
| Bachelor's Degree | $77,694 | $53,679 |
| Graduate Degree | $105,000 | $88,438 |
| Total | $68,556 | $51,573 |
Family Income in University Place
Family Income Brackets in University Place
According to the University Place family income data, there are 2,426 families falling into the $100,000 to $149,999 income range, which is the most common income bracket and makes up 27.3% of all families. Conversely, the less than $10,000 income bracket is the least frequent group with only 124 families (1.4%) belonging to this category.
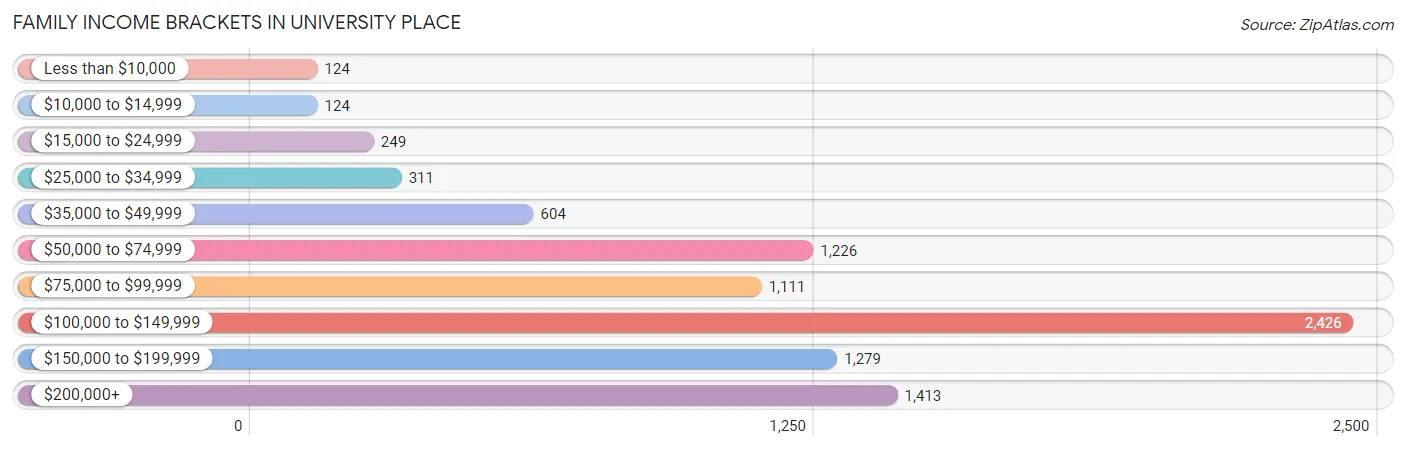
| Income Bracket | # Families | % Families |
| Less than $10,000 | 124 | 1.4% |
| $10,000 to $14,999 | 124 | 1.4% |
| $15,000 to $24,999 | 249 | 2.8% |
| $25,000 to $34,999 | 311 | 3.5% |
| $35,000 to $49,999 | 604 | 6.8% |
| $50,000 to $74,999 | 1,226 | 13.8% |
| $75,000 to $99,999 | 1,111 | 12.5% |
| $100,000 to $149,999 | 2,426 | 27.3% |
| $150,000 to $199,999 | 1,279 | 14.4% |
| $200,000+ | 1,413 | 15.9% |
Family Income by Famaliy Size in University Place
5-person families (845 | 9.5%) account for the highest median family income in University Place with $139,271 per family, while 2-person families (4,022 | 45.3%) have the highest median income of $48,056 per family member.
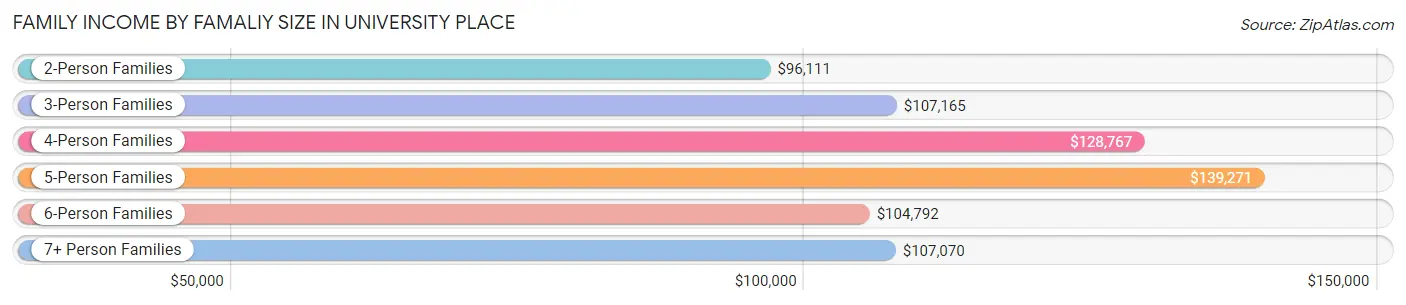
| Income Bracket | # Families | Median Income |
| 2-Person Families | 4,022 (45.3%) | $96,111 |
| 3-Person Families | 1,829 (20.6%) | $107,165 |
| 4-Person Families | 1,905 (21.4%) | $128,767 |
| 5-Person Families | 845 (9.5%) | $139,271 |
| 6-Person Families | 231 (2.6%) | $104,792 |
| 7+ Person Families | 53 (0.6%) | $107,070 |
| Total | 8,885 (100.0%) | $107,208 |
Family Income by Number of Earners in University Place
The median family income in University Place is $107,208, with families comprising 3+ earners (900) having the highest median family income of $185,982, while families with no earners (1,298) have the lowest median family income of $78,750, accounting for 10.1% and 14.6% of families, respectively.
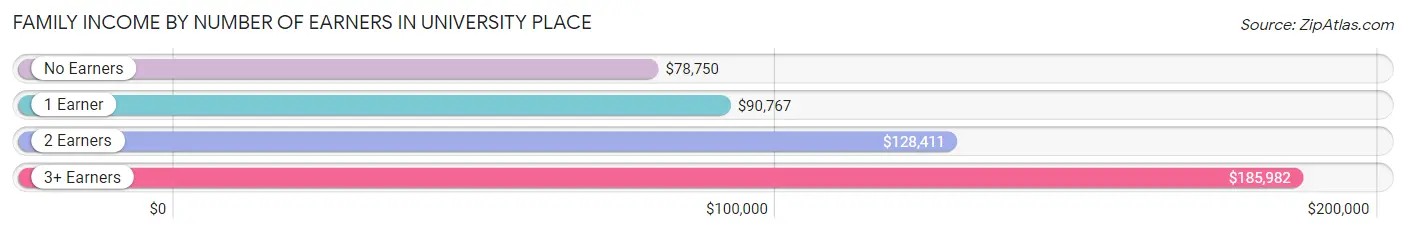
| Number of Earners | # Families | Median Income |
| No Earners | 1,298 (14.6%) | $78,750 |
| 1 Earner | 2,884 (32.5%) | $90,767 |
| 2 Earners | 3,803 (42.8%) | $128,411 |
| 3+ Earners | 900 (10.1%) | $185,982 |
| Total | 8,885 (100.0%) | $107,208 |
Household Income in University Place
Household Income Brackets in University Place
With 2,914 households falling in the category, the $100,000 to $149,999 income range is the most frequent in University Place, accounting for 21.3% of all households. In contrast, only 342 households (2.5%) fall into the $10,000 to $14,999 income bracket, making it the least populous group.
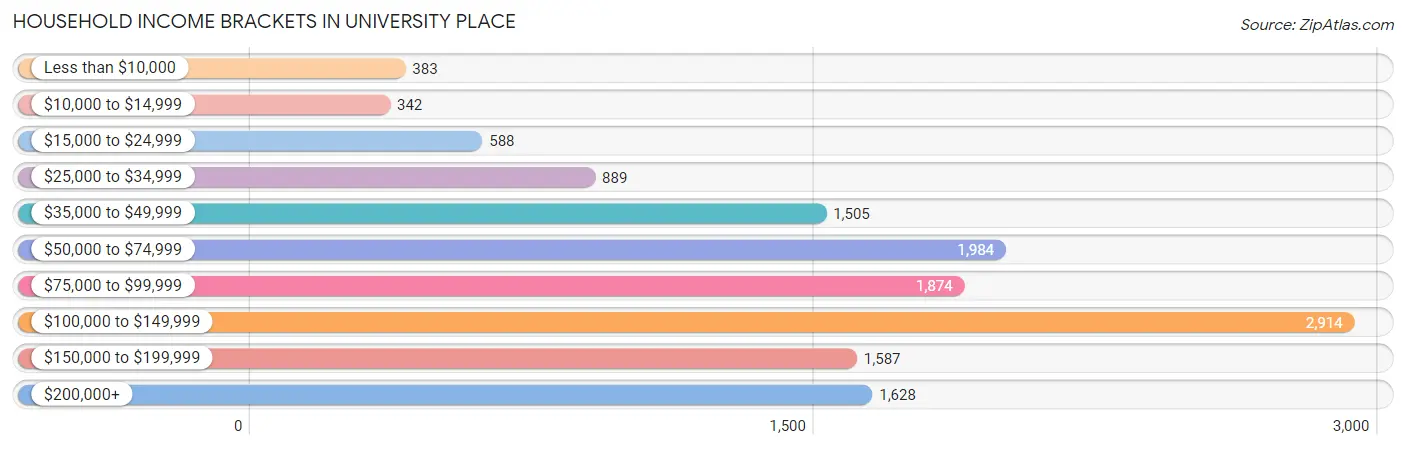
| Income Bracket | # Households | % Households |
| Less than $10,000 | 383 | 2.8% |
| $10,000 to $14,999 | 342 | 2.5% |
| $15,000 to $24,999 | 588 | 4.3% |
| $25,000 to $34,999 | 889 | 6.5% |
| $35,000 to $49,999 | 1,505 | 11.0% |
| $50,000 to $74,999 | 1,984 | 14.5% |
| $75,000 to $99,999 | 1,874 | 13.7% |
| $100,000 to $149,999 | 2,914 | 21.3% |
| $150,000 to $199,999 | 1,587 | 11.6% |
| $200,000+ | 1,628 | 11.9% |
Household Income by Householder Age in University Place
The median household income in University Place is $89,658, with the highest median household income of $116,211 found in the 45 to 64 years age bracket for the primary householder. A total of 4,744 households (34.7%) fall into this category. Meanwhile, the 15 to 24 years age bracket for the primary householder has the lowest median household income of $50,434, with 683 households (5.0%) in this group.
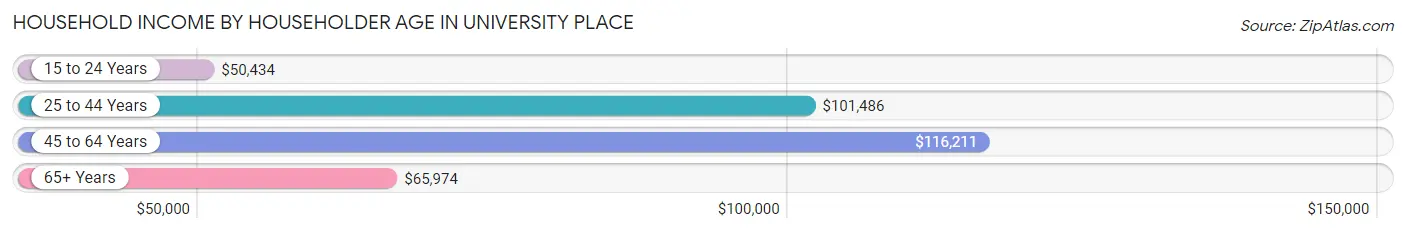
| Income Bracket | # Households | Median Income |
| 15 to 24 Years | 683 (5.0%) | $50,434 |
| 25 to 44 Years | 4,302 (31.4%) | $101,486 |
| 45 to 64 Years | 4,744 (34.7%) | $116,211 |
| 65+ Years | 3,953 (28.9%) | $65,974 |
| Total | 13,682 (100.0%) | $89,658 |
Poverty in University Place
Income Below Poverty by Sex and Age in University Place
With 7.4% poverty level for males and 8.7% for females among the residents of University Place, 18 to 24 year old males and 18 to 24 year old females are the most vulnerable to poverty, with 310 males (19.1%) and 315 females (19.3%) in their respective age groups living below the poverty level.
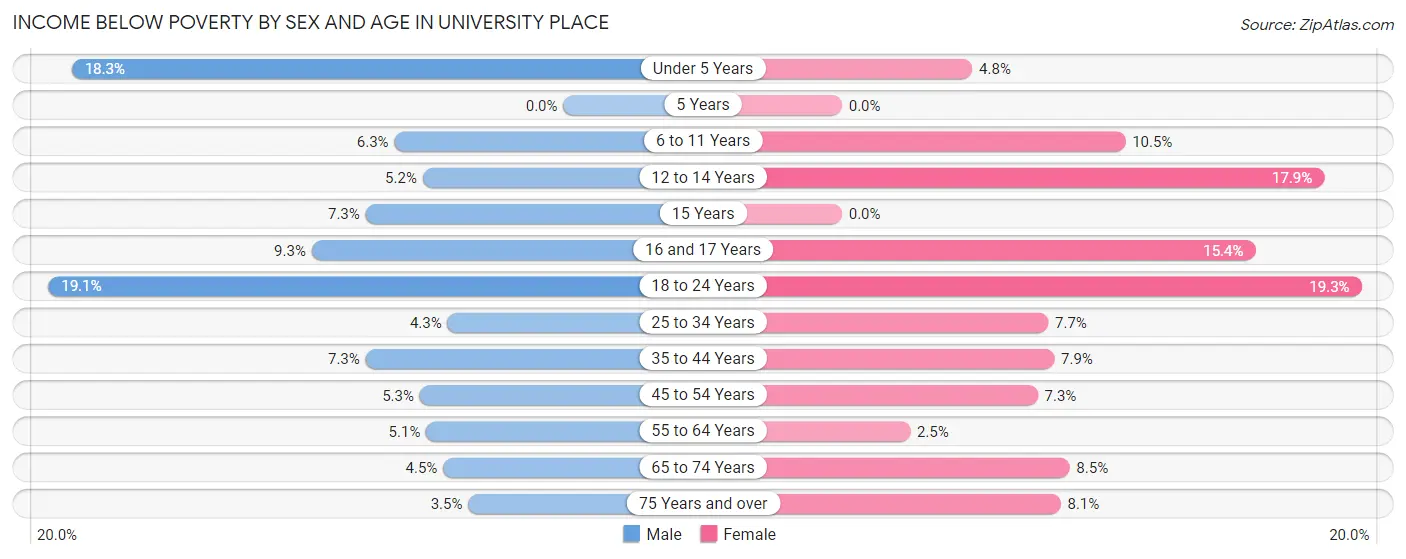
| Age Bracket | Male | Female |
| Under 5 Years | 163 (18.2%) | 45 (4.8%) |
| 5 Years | 0 (0.0%) | 0 (0.0%) |
| 6 to 11 Years | 91 (6.3%) | 176 (10.5%) |
| 12 to 14 Years | 36 (5.2%) | 104 (17.9%) |
| 15 Years | 19 (7.3%) | 0 (0.0%) |
| 16 and 17 Years | 45 (9.3%) | 68 (15.3%) |
| 18 to 24 Years | 310 (19.1%) | 315 (19.3%) |
| 25 to 34 Years | 94 (4.3%) | 150 (7.7%) |
| 35 to 44 Years | 149 (7.3%) | 190 (7.9%) |
| 45 to 54 Years | 128 (5.3%) | 138 (7.3%) |
| 55 to 64 Years | 83 (5.1%) | 55 (2.5%) |
| 65 to 74 Years | 82 (4.5%) | 159 (8.5%) |
| 75 Years and over | 35 (3.5%) | 143 (8.1%) |
| Total | 1,235 (7.4%) | 1,543 (8.7%) |
Income Above Poverty by Sex and Age in University Place
According to the poverty statistics in University Place, males aged 5 years and females aged 5 years are the age groups that are most secure financially, with 100.0% of males and 100.0% of females in these age groups living above the poverty line.
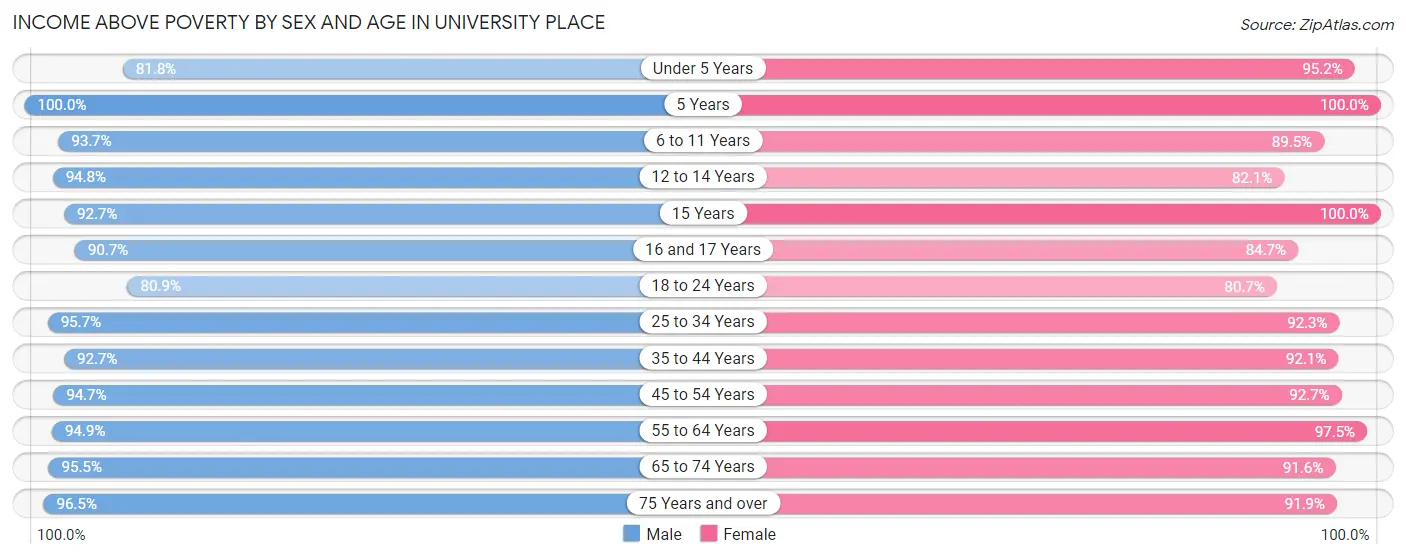
| Age Bracket | Male | Female |
| Under 5 Years | 730 (81.8%) | 884 (95.2%) |
| 5 Years | 248 (100.0%) | 79 (100.0%) |
| 6 to 11 Years | 1,361 (93.7%) | 1,497 (89.5%) |
| 12 to 14 Years | 654 (94.8%) | 477 (82.1%) |
| 15 Years | 240 (92.7%) | 371 (100.0%) |
| 16 and 17 Years | 437 (90.7%) | 375 (84.7%) |
| 18 to 24 Years | 1,311 (80.9%) | 1,318 (80.7%) |
| 25 to 34 Years | 2,094 (95.7%) | 1,809 (92.3%) |
| 35 to 44 Years | 1,881 (92.7%) | 2,222 (92.1%) |
| 45 to 54 Years | 2,272 (94.7%) | 1,761 (92.7%) |
| 55 to 64 Years | 1,547 (94.9%) | 2,117 (97.5%) |
| 65 to 74 Years | 1,756 (95.5%) | 1,723 (91.5%) |
| 75 Years and over | 957 (96.5%) | 1,617 (91.9%) |
| Total | 15,488 (92.6%) | 16,250 (91.3%) |
Income Below Poverty Among Married-Couple Families in University Place
The poverty statistics for married-couple families in University Place show that 3.7% or 257 of the total 6,979 families live below the poverty line. Families with 3 or 4 children have the highest poverty rate of 12.0%, comprising of 79 families. On the other hand, families with 5 or more children have the lowest poverty rate of 0.0%, which includes 0 families.
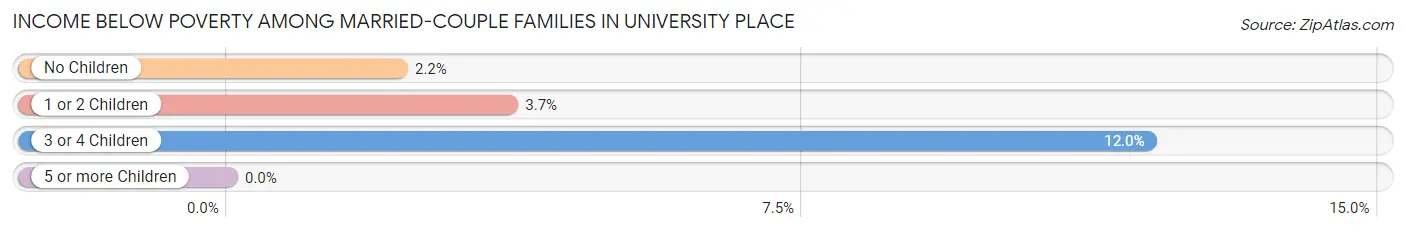
| Children | Above Poverty | Below Poverty |
| No Children | 3,604 (97.8%) | 82 (2.2%) |
| 1 or 2 Children | 2,530 (96.3%) | 96 (3.7%) |
| 3 or 4 Children | 580 (88.0%) | 79 (12.0%) |
| 5 or more Children | 8 (100.0%) | 0 (0.0%) |
| Total | 6,722 (96.3%) | 257 (3.7%) |
Income Below Poverty Among Single-Parent Households in University Place
According to the poverty data in University Place, 10.3% or 73 single-father households and 16.7% or 199 single-mother households are living below the poverty line. Among single-father households, those with no children have the highest poverty rate, with 73 households (14.5%) experiencing poverty. Likewise, among single-mother households, those with 3 or 4 children have the highest poverty rate, with 46 households (26.9%) falling below the poverty line.
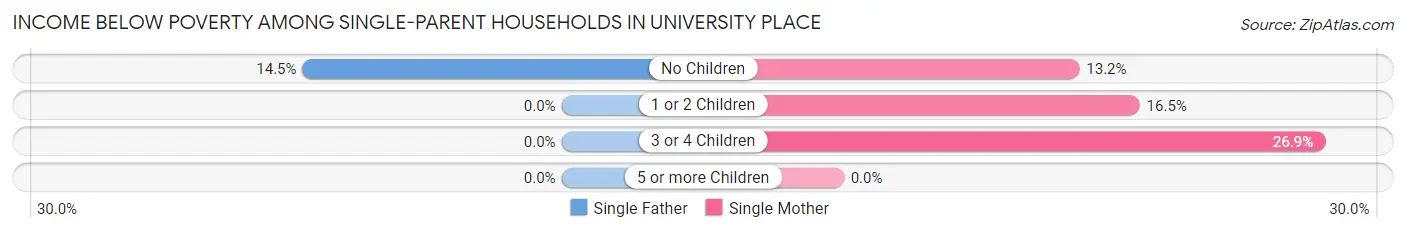
| Children | Single Father | Single Mother |
| No Children | 73 (14.5%) | 64 (13.2%) |
| 1 or 2 Children | 0 (0.0%) | 89 (16.5%) |
| 3 or 4 Children | 0 (0.0%) | 46 (26.9%) |
| 5 or more Children | 0 (0.0%) | 0 (0.0%) |
| Total | 73 (10.3%) | 199 (16.7%) |
Income Below Poverty Among Married-Couple vs Single-Parent Households in University Place
The poverty data for University Place shows that 257 of the married-couple family households (3.7%) and 272 of the single-parent households (14.3%) are living below the poverty level. Within the married-couple family households, those with 3 or 4 children have the highest poverty rate, with 79 households (12.0%) falling below the poverty line. Among the single-parent households, those with 3 or 4 children have the highest poverty rate, with 46 household (25.3%) living below poverty.
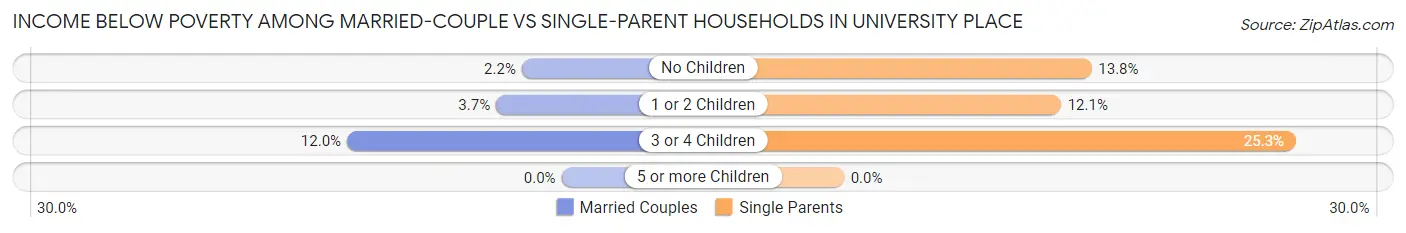
| Children | Married-Couple Families | Single-Parent Households |
| No Children | 82 (2.2%) | 137 (13.8%) |
| 1 or 2 Children | 96 (3.7%) | 89 (12.1%) |
| 3 or 4 Children | 79 (12.0%) | 46 (25.3%) |
| 5 or more Children | 0 (0.0%) | 0 (0.0%) |
| Total | 257 (3.7%) | 272 (14.3%) |
Race in University Place
The most populous races in University Place are White / Caucasian (22,442 | 64.7%), Two or more Races (3,963 | 11.4%), and Hispanic or Latino (3,906 | 11.3%).
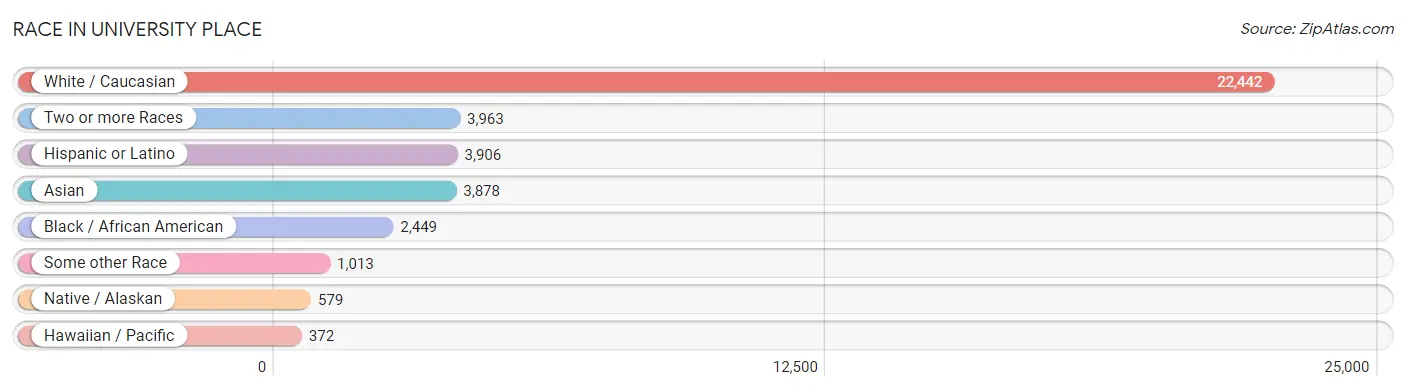
| Race | # Population | % Population |
| Asian | 3,878 | 11.2% |
| Black / African American | 2,449 | 7.1% |
| Hawaiian / Pacific | 372 | 1.1% |
| Hispanic or Latino | 3,906 | 11.3% |
| Native / Alaskan | 579 | 1.7% |
| White / Caucasian | 22,442 | 64.7% |
| Two or more Races | 3,963 | 11.4% |
| Some other Race | 1,013 | 2.9% |
| Total | 34,696 | 100.0% |
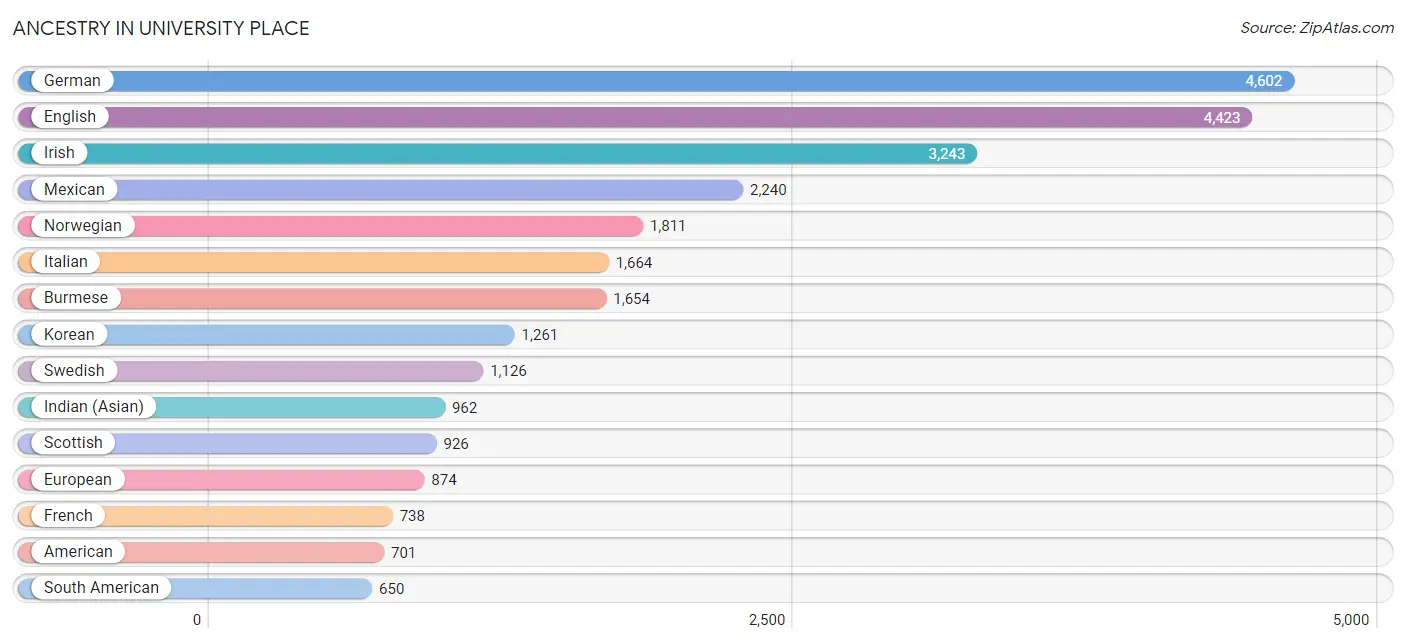
Ancestry in University Place
The most populous ancestries reported in University Place are German (4,602 | 13.3%), English (4,423 | 12.8%), Irish (3,243 | 9.3%), Mexican (2,240 | 6.5%), and Norwegian (1,811 | 5.2%), together accounting for 47.0% of all University Place residents.
| Ancestry | # Population | % Population |
| African | 57 | 0.2% |
| American | 701 | 2.0% |
| Apache | 45 | 0.1% |
| Arab | 515 | 1.5% |
| Australian | 32 | 0.1% |
| Austrian | 104 | 0.3% |
| Basque | 28 | 0.1% |
| Belgian | 79 | 0.2% |
| Bhutanese | 359 | 1.0% |
| Bolivian | 11 | 0.0% |
| British | 152 | 0.4% |
| Bulgarian | 28 | 0.1% |
| Burmese | 1,654 | 4.8% |
| Canadian | 144 | 0.4% |
| Celtic | 25 | 0.1% |
| Central American | 226 | 0.6% |
| Central American Indian | 189 | 0.5% |
| Cherokee | 83 | 0.2% |
| Chippewa | 17 | 0.1% |
| Choctaw | 30 | 0.1% |
| Colombian | 526 | 1.5% |
| Colville | 15 | 0.0% |
| Comanche | 59 | 0.2% |
| Creek | 35 | 0.1% |
| Croatian | 135 | 0.4% |
| Cuban | 157 | 0.4% |
| Czech | 42 | 0.1% |
| Czechoslovakian | 8 | 0.0% |
| Danish | 263 | 0.8% |
| Dominican | 75 | 0.2% |
| Dutch | 414 | 1.2% |
| Eastern European | 53 | 0.2% |
| Ecuadorian | 72 | 0.2% |
| Egyptian | 30 | 0.1% |
| English | 4,423 | 12.8% |
| European | 874 | 2.5% |
| Fijian | 198 | 0.6% |
| Finnish | 164 | 0.5% |
| French | 738 | 2.1% |
| French Canadian | 116 | 0.3% |
| German | 4,602 | 13.3% |
| Greek | 103 | 0.3% |
| Guamanian / Chamorro | 168 | 0.5% |
| Guatemalan | 12 | 0.0% |
| Haitian | 86 | 0.3% |
| Hopi | 11 | 0.0% |
| Hungarian | 8 | 0.0% |
| Icelander | 25 | 0.1% |
| Indian (Asian) | 962 | 2.8% |
| Inupiat | 6 | 0.0% |
| Iranian | 264 | 0.8% |
| Iraqi | 18 | 0.1% |
| Irish | 3,243 | 9.3% |
| Iroquois | 42 | 0.1% |
| Italian | 1,664 | 4.8% |
| Jamaican | 141 | 0.4% |
| Japanese | 48 | 0.1% |
| Korean | 1,261 | 3.6% |
| Laotian | 5 | 0.0% |
| Latvian | 22 | 0.1% |
| Lebanese | 26 | 0.1% |
| Lithuanian | 19 | 0.1% |
| Macedonian | 36 | 0.1% |
| Malaysian | 23 | 0.1% |
| Mexican | 2,240 | 6.5% |
| Mexican American Indian | 492 | 1.4% |
| Moroccan | 18 | 0.1% |
| Native Hawaiian | 163 | 0.5% |
| Navajo | 31 | 0.1% |
| New Zealander | 13 | 0.0% |
| Nicaraguan | 38 | 0.1% |
| Northern European | 188 | 0.5% |
| Norwegian | 1,811 | 5.2% |
| Osage | 3 | 0.0% |
| Pakistani | 40 | 0.1% |
| Panamanian | 27 | 0.1% |
| Peruvian | 24 | 0.1% |
| Polish | 604 | 1.7% |
| Portuguese | 107 | 0.3% |
| Puerto Rican | 228 | 0.7% |
| Puget Sound Salish | 11 | 0.0% |
| Romanian | 33 | 0.1% |
| Russian | 223 | 0.6% |
| Salvadoran | 149 | 0.4% |
| Samoan | 124 | 0.4% |
| Scandinavian | 539 | 1.5% |
| Scotch-Irish | 353 | 1.0% |
| Scottish | 926 | 2.7% |
| Serbian | 82 | 0.2% |
| Shoshone | 4 | 0.0% |
| Sioux | 10 | 0.0% |
| South American | 650 | 1.9% |
| Spaniard | 88 | 0.3% |
| Spanish | 131 | 0.4% |
| Sri Lankan | 585 | 1.7% |
| Subsaharan African | 168 | 0.5% |
| Swedish | 1,126 | 3.3% |
| Swiss | 128 | 0.4% |
| Syrian | 10 | 0.0% |
| Thai | 266 | 0.8% |
| Tlingit-Haida | 52 | 0.2% |
| Tongan | 37 | 0.1% |
| Trinidadian and Tobagonian | 50 | 0.1% |
| Turkish | 32 | 0.1% |
| Ugandan | 34 | 0.1% |
| Ukrainian | 181 | 0.5% |
| Venezuelan | 17 | 0.1% |
| Welsh | 223 | 0.6% | View All 108 Rows |
Immigrants in University Place
The most numerous immigrant groups reported in University Place came from Asia (2,945 | 8.5%), Eastern Asia (1,287 | 3.7%), South Eastern Asia (976 | 2.8%), Korea (916 | 2.6%), and Latin America (749 | 2.2%), together accounting for 19.8% of all University Place residents.
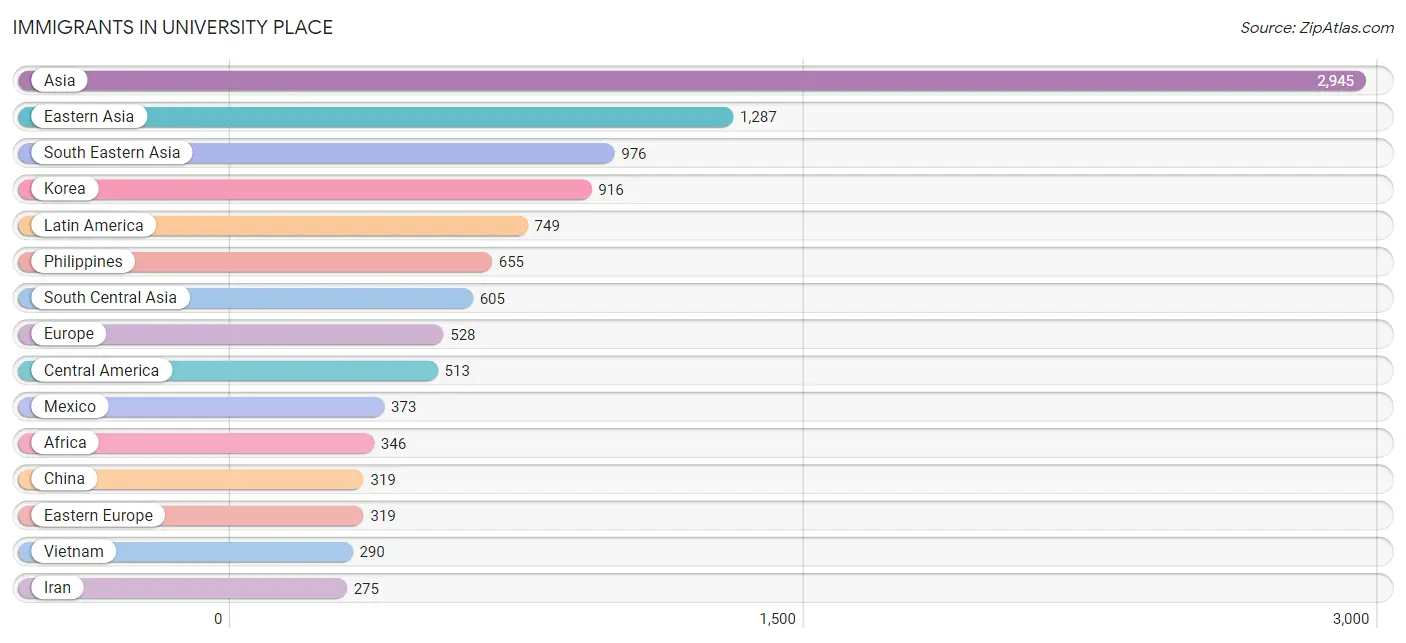
| Immigration Origin | # Population | % Population |
| Africa | 346 | 1.0% |
| Asia | 2,945 | 8.5% |
| Australia | 65 | 0.2% |
| Belarus | 25 | 0.1% |
| Cambodia | 7 | 0.0% |
| Canada | 253 | 0.7% |
| Caribbean | 57 | 0.2% |
| Central America | 513 | 1.5% |
| China | 319 | 0.9% |
| Colombia | 157 | 0.4% |
| Cuba | 18 | 0.1% |
| Denmark | 7 | 0.0% |
| Eastern Africa | 138 | 0.4% |
| Eastern Asia | 1,287 | 3.7% |
| Eastern Europe | 319 | 0.9% |
| Ecuador | 5 | 0.0% |
| El Salvador | 94 | 0.3% |
| England | 39 | 0.1% |
| Europe | 528 | 1.5% |
| Fiji | 28 | 0.1% |
| Germany | 85 | 0.2% |
| Haiti | 39 | 0.1% |
| Hong Kong | 8 | 0.0% |
| India | 142 | 0.4% |
| Indonesia | 5 | 0.0% |
| Iran | 275 | 0.8% |
| Iraq | 18 | 0.1% |
| Ireland | 38 | 0.1% |
| Japan | 52 | 0.2% |
| Kenya | 104 | 0.3% |
| Korea | 916 | 2.6% |
| Latin America | 749 | 2.2% |
| Mexico | 373 | 1.1% |
| Moldova | 47 | 0.1% |
| Nicaragua | 32 | 0.1% |
| Northern Africa | 118 | 0.3% |
| Northern Europe | 124 | 0.4% |
| Oceania | 137 | 0.4% |
| Pakistan | 188 | 0.5% |
| Panama | 14 | 0.0% |
| Philippines | 655 | 1.9% |
| Romania | 10 | 0.0% |
| Russia | 68 | 0.2% |
| South Africa | 33 | 0.1% |
| South America | 179 | 0.5% |
| South Central Asia | 605 | 1.7% |
| South Eastern Asia | 976 | 2.8% |
| Sweden | 7 | 0.0% |
| Taiwan | 28 | 0.1% |
| Thailand | 19 | 0.1% |
| Turkey | 11 | 0.0% |
| Uganda | 34 | 0.1% |
| Ukraine | 169 | 0.5% |
| Venezuela | 17 | 0.1% |
| Vietnam | 290 | 0.8% |
| Western Africa | 57 | 0.2% |
| Western Asia | 77 | 0.2% |
| Western Europe | 85 | 0.2% |
| Yemen | 48 | 0.1% | View All 59 Rows |
Sex and Age in University Place
Sex and Age in University Place
The most populous age groups in University Place are 35 to 39 Years (1,296 | 7.7%) for men and 60 to 64 Years (1,384 | 7.7%) for women.
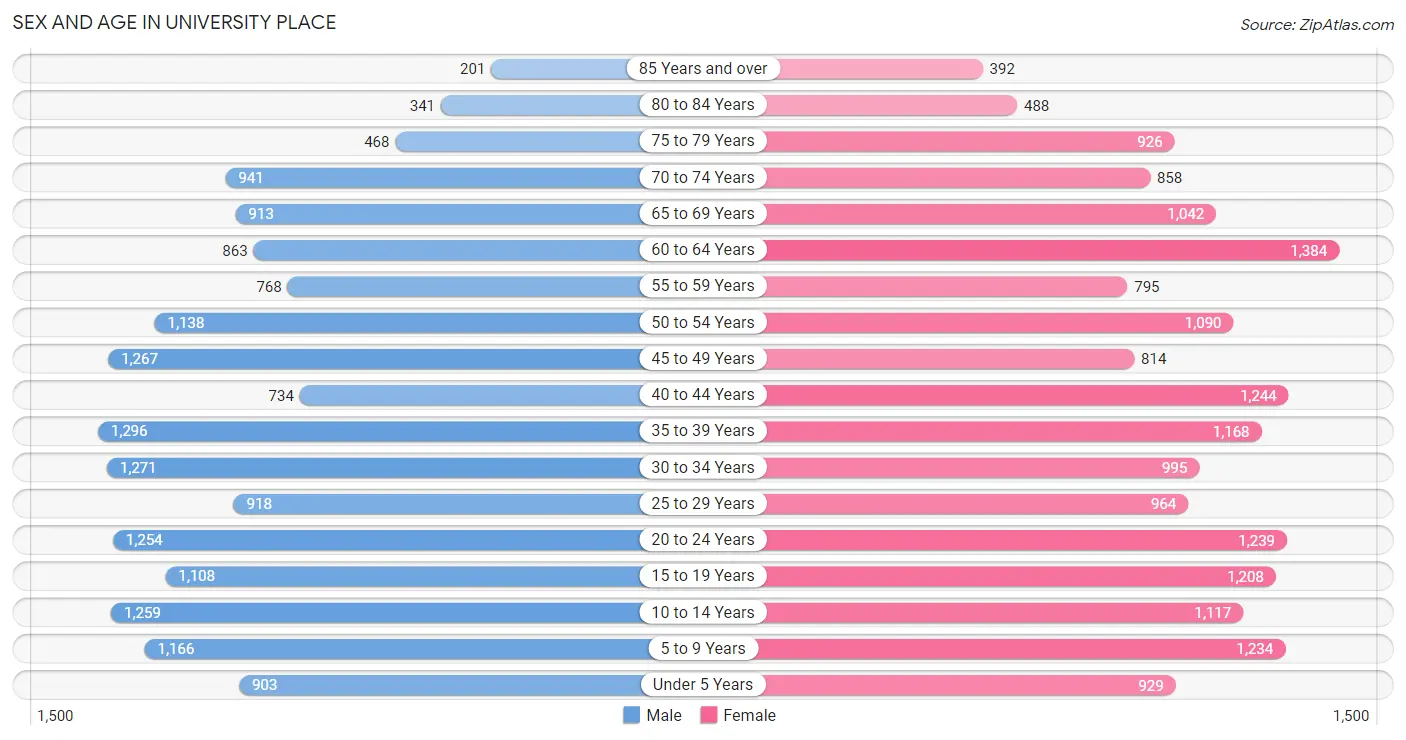
| Age Bracket | Male | Female |
| Under 5 Years | 903 (5.4%) | 929 (5.2%) |
| 5 to 9 Years | 1,166 (6.9%) | 1,234 (6.9%) |
| 10 to 14 Years | 1,259 (7.5%) | 1,117 (6.2%) |
| 15 to 19 Years | 1,108 (6.6%) | 1,208 (6.8%) |
| 20 to 24 Years | 1,254 (7.5%) | 1,239 (6.9%) |
| 25 to 29 Years | 918 (5.5%) | 964 (5.4%) |
| 30 to 34 Years | 1,271 (7.6%) | 995 (5.6%) |
| 35 to 39 Years | 1,296 (7.7%) | 1,168 (6.5%) |
| 40 to 44 Years | 734 (4.4%) | 1,244 (7.0%) |
| 45 to 49 Years | 1,267 (7.5%) | 814 (4.5%) |
| 50 to 54 Years | 1,138 (6.8%) | 1,090 (6.1%) |
| 55 to 59 Years | 768 (4.6%) | 795 (4.4%) |
| 60 to 64 Years | 863 (5.1%) | 1,384 (7.7%) |
| 65 to 69 Years | 913 (5.4%) | 1,042 (5.8%) |
| 70 to 74 Years | 941 (5.6%) | 858 (4.8%) |
| 75 to 79 Years | 468 (2.8%) | 926 (5.2%) |
| 80 to 84 Years | 341 (2.0%) | 488 (2.7%) |
| 85 Years and over | 201 (1.2%) | 392 (2.2%) |
| Total | 16,809 (100.0%) | 17,887 (100.0%) |
Families and Households in University Place
Median Family Size in University Place
The median family size in University Place is 3.14 persons per family, with married-couple families (6,979 | 78.5%) accounting for the largest median family size of 3.21 persons per family. On the other hand, single male/father families (711 | 8.0%) represent the smallest median family size with 2.47 persons per family.
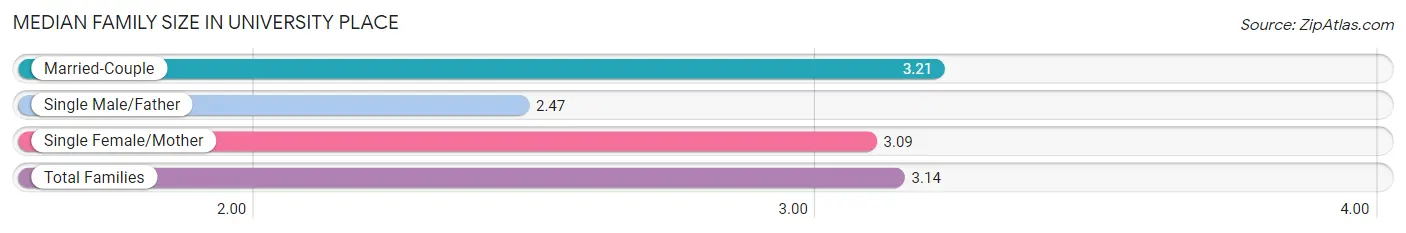
| Family Type | # Families | Family Size |
| Married-Couple | 6,979 (78.5%) | 3.21 |
| Single Male/Father | 711 (8.0%) | 2.47 |
| Single Female/Mother | 1,195 (13.5%) | 3.09 |
| Total Families | 8,885 (100.0%) | 3.14 |
Median Household Size in University Place
The median household size in University Place is 2.52 persons per household, with married-couple households (6,979 | 51.0%) accounting for the largest median household size of 3.23 persons per household. non-family households (4,797 | 35.1%) represent the smallest median household size with 1.24 persons per household.
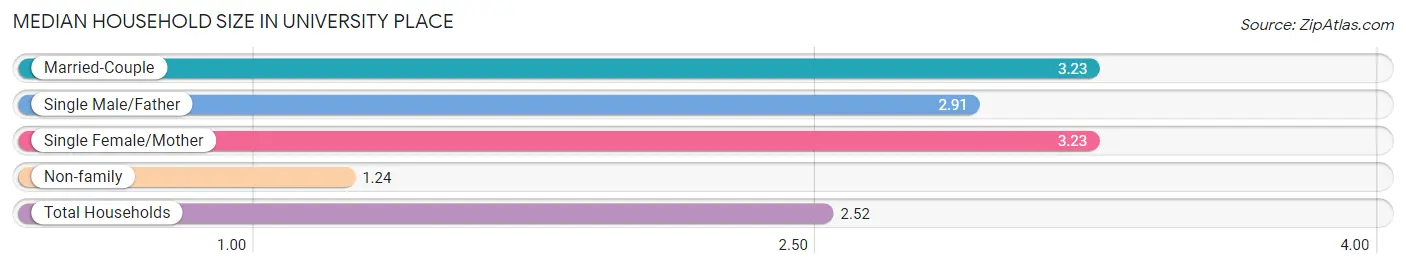
| Household Type | # Households | Household Size |
| Married-Couple | 6,979 (51.0%) | 3.23 |
| Single Male/Father | 711 (5.2%) | 2.91 |
| Single Female/Mother | 1,195 (8.7%) | 3.23 |
| Non-family | 4,797 (35.1%) | 1.24 |
| Total Households | 13,682 (100.0%) | 2.52 |
Household Size by Marriage Status in University Place
Out of a total of 13,682 households in University Place, 8,885 (64.9%) are family households, while 4,797 (35.1%) are nonfamily households. The most numerous type of family households are 2-person households, comprising 3,824, and the most common type of nonfamily households are 1-person households, comprising 3,800.
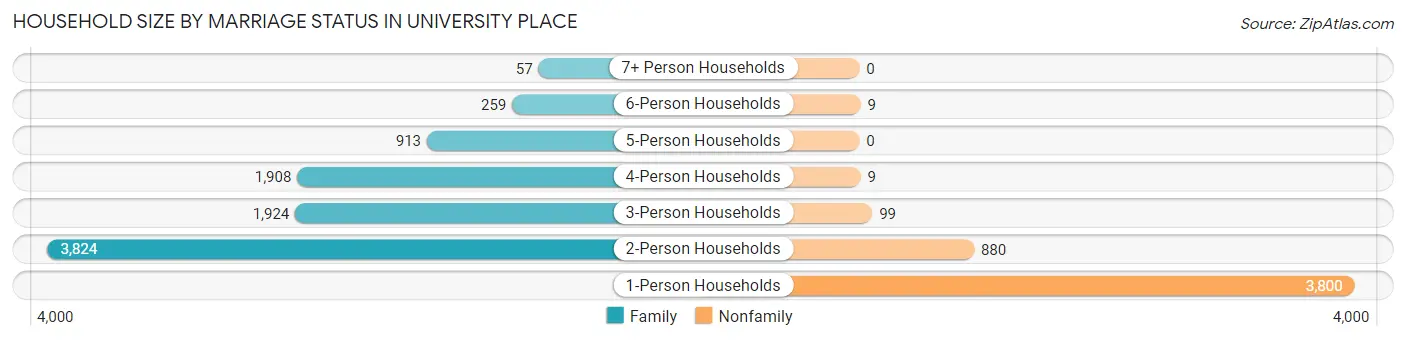
| Household Size | Family Households | Nonfamily Households |
| 1-Person Households | - | 3,800 (27.8%) |
| 2-Person Households | 3,824 (28.0%) | 880 (6.4%) |
| 3-Person Households | 1,924 (14.1%) | 99 (0.7%) |
| 4-Person Households | 1,908 (14.0%) | 9 (0.1%) |
| 5-Person Households | 913 (6.7%) | 0 (0.0%) |
| 6-Person Households | 259 (1.9%) | 9 (0.1%) |
| 7+ Person Households | 57 (0.4%) | 0 (0.0%) |
| Total | 8,885 (64.9%) | 4,797 (35.1%) |
Female Fertility in University Place
Fertility by Age in University Place
Average fertility rate in University Place is 41.0 births per 1,000 women. Women in the age bracket of 20 to 34 years have the highest fertility rate with 65.0 births per 1,000 women. Women in the age bracket of 20 to 34 years acount for 65.2% of all women with births.
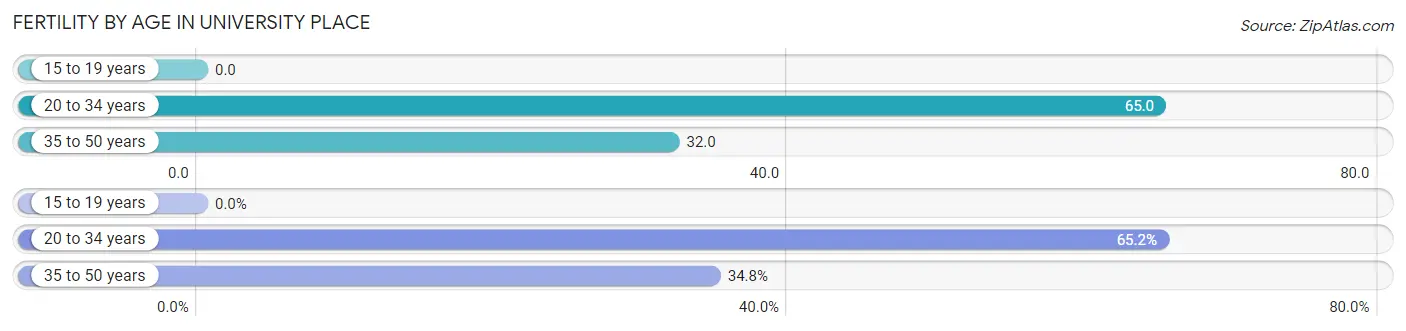
| Age Bracket | Women with Births | Births / 1,000 Women |
| 15 to 19 years | 0 (0.0%) | 0.0 |
| 20 to 34 years | 208 (65.2%) | 65.0 |
| 35 to 50 years | 111 (34.8%) | 32.0 |
| Total | 319 (100.0%) | 41.0 |
Fertility by Age by Marriage Status in University Place
94.7% of women with births (319) in University Place are married. The highest percentage of unmarried women with births falls into 35 to 50 years age bracket with 8.1% of them unmarried at the time of birth, while the lowest percentage of unmarried women with births belong to 20 to 34 years age bracket with 3.8% of them unmarried.
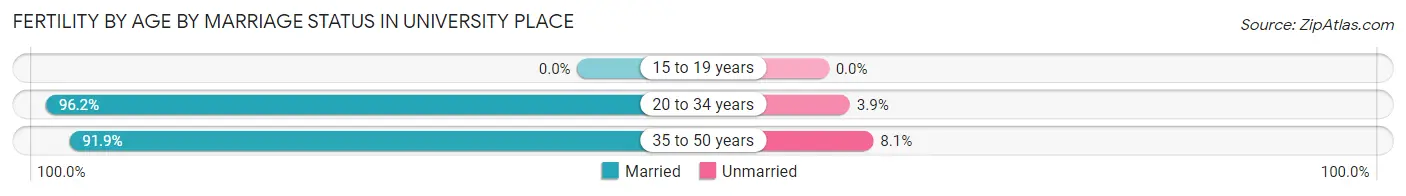
| Age Bracket | Married | Unmarried |
| 15 to 19 years | 0 (0.0%) | 0 (0.0%) |
| 20 to 34 years | 200 (96.2%) | 8 (3.8%) |
| 35 to 50 years | 102 (91.9%) | 9 (8.1%) |
| Total | 302 (94.7%) | 17 (5.3%) |
Fertility by Education in University Place
Average fertility rate in University Place is 41.0 births per 1,000 women. Women with the education attainment of graduate degree have the highest fertility rate of 72.0 births per 1,000 women, while women with the education attainment of college or associate's degree have the lowest fertility at 20.0 births per 1,000 women. Women with the education attainment of bachelor's degree represent 34.2% of all women with births.
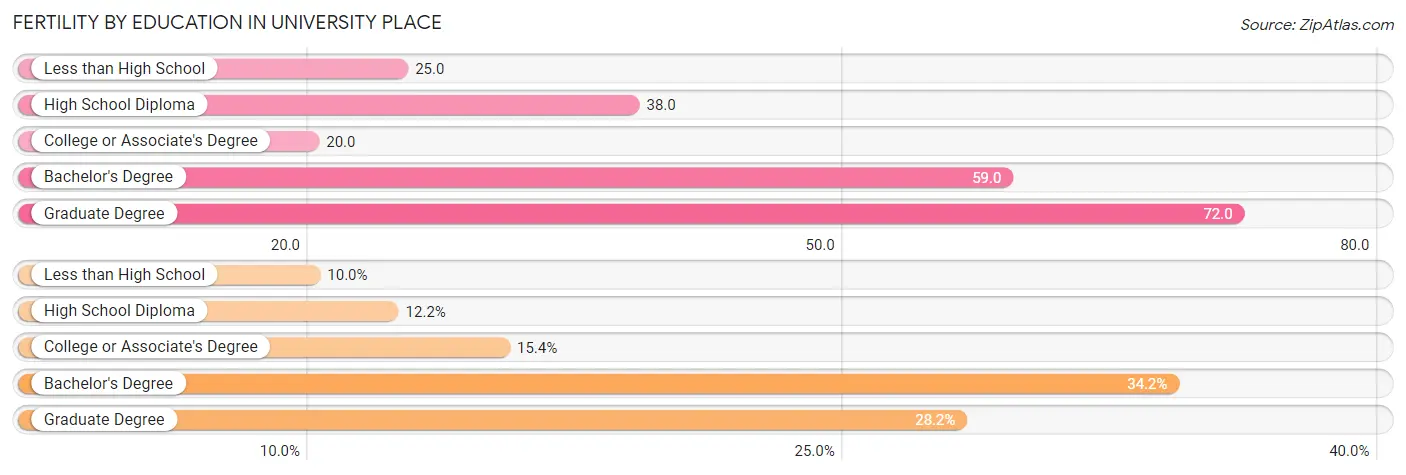
| Educational Attainment | Women with Births | Births / 1,000 Women |
| Less than High School | 32 (10.0%) | 25.0 |
| High School Diploma | 39 (12.2%) | 38.0 |
| College or Associate's Degree | 49 (15.4%) | 20.0 |
| Bachelor's Degree | 109 (34.2%) | 59.0 |
| Graduate Degree | 90 (28.2%) | 72.0 |
| Total | 319 (100.0%) | 41.0 |
Fertility by Education by Marriage Status in University Place
5.3% of women with births in University Place are unmarried. Women with the educational attainment of less than high school are most likely to be married with 100.0% of them married at childbirth, while women with the educational attainment of college or associate's degree are least likely to be married with 16.3% of them unmarried at childbirth.
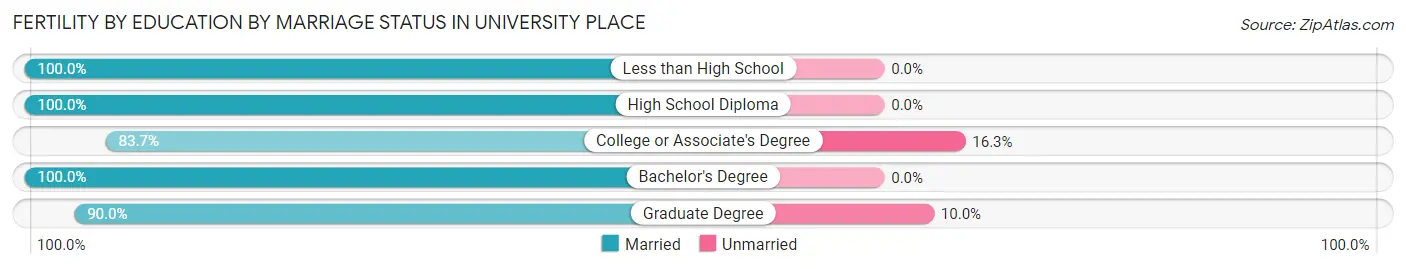
| Educational Attainment | Married | Unmarried |
| Less than High School | 32 (100.0%) | 0 (0.0%) |
| High School Diploma | 39 (100.0%) | 0 (0.0%) |
| College or Associate's Degree | 41 (83.7%) | 8 (16.3%) |
| Bachelor's Degree | 109 (100.0%) | 0 (0.0%) |
| Graduate Degree | 81 (90.0%) | 9 (10.0%) |
| Total | 302 (94.7%) | 17 (5.3%) |
Employment Characteristics in University Place
Employment by Class of Employer in University Place
Among the 16,237 employed individuals in University Place, private company employees (9,426 | 58.1%), not-for-profit organizations (1,855 | 11.4%), and local government employees (1,676 | 10.3%) make up the most common classes of employment.
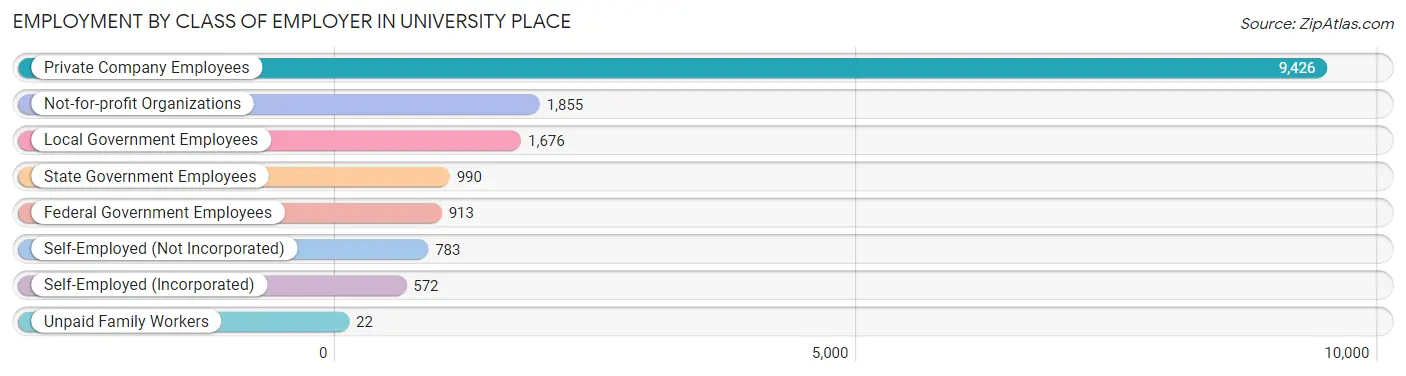
| Employer Class | # Employees | % Employees |
| Private Company Employees | 9,426 | 58.1% |
| Self-Employed (Incorporated) | 572 | 3.5% |
| Self-Employed (Not Incorporated) | 783 | 4.8% |
| Not-for-profit Organizations | 1,855 | 11.4% |
| Local Government Employees | 1,676 | 10.3% |
| State Government Employees | 990 | 6.1% |
| Federal Government Employees | 913 | 5.6% |
| Unpaid Family Workers | 22 | 0.1% |
| Total | 16,237 | 100.0% |
Employment Status by Age in University Place
According to the labor force statistics for University Place, out of the total population over 16 years of age (27,458), 63.4% or 17,408 individuals are in the labor force, with 3.7% or 644 of them unemployed. The age group with the highest labor force participation rate is 25 to 29 years, with 89.3% or 1,681 individuals in the labor force. Within the labor force, the 65 to 74 years age range has the highest percentage of unemployed individuals, with 8.8% or 71 of them being unemployed.
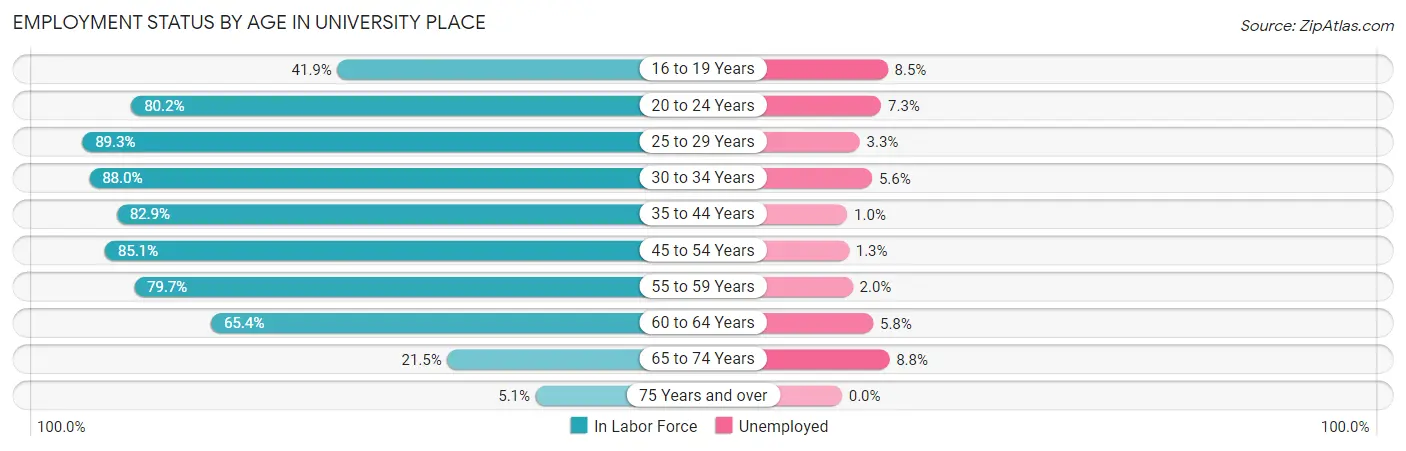
| Age Bracket | In Labor Force | Unemployed |
| 16 to 19 Years | 706 (41.9%) | 60 (8.5%) |
| 20 to 24 Years | 1,999 (80.2%) | 146 (7.3%) |
| 25 to 29 Years | 1,681 (89.3%) | 55 (3.3%) |
| 30 to 34 Years | 1,994 (88.0%) | 112 (5.6%) |
| 35 to 44 Years | 3,682 (82.9%) | 37 (1.0%) |
| 45 to 54 Years | 3,667 (85.1%) | 48 (1.3%) |
| 55 to 59 Years | 1,246 (79.7%) | 25 (2.0%) |
| 60 to 64 Years | 1,470 (65.4%) | 85 (5.8%) |
| 65 to 74 Years | 807 (21.5%) | 71 (8.8%) |
| 75 Years and over | 144 (5.1%) | 0 (0.0%) |
| Total | 17,408 (63.4%) | 644 (3.7%) |
Employment Status by Educational Attainment in University Place
According to labor force statistics for University Place, 82.2% of individuals (13,735) out of the total population between 25 and 64 years of age (16,709) are in the labor force, with 2.6% or 357 of them being unemployed. The group with the highest labor force participation rate are those with the educational attainment of bachelor's degree or higher, with 87.9% or 6,270 individuals in the labor force. Within the labor force, individuals with high school diploma education have the highest percentage of unemployment, with 9.8% or 244 of them being unemployed.
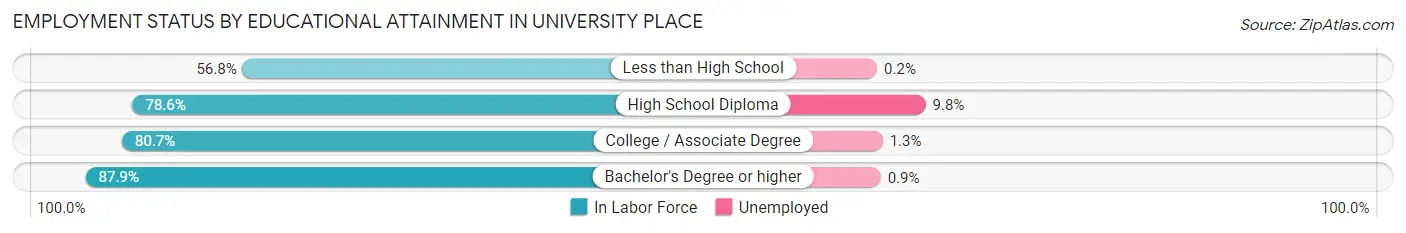
| Educational Attainment | In Labor Force | Unemployed |
| Less than High School | 449 (56.8%) | 2 (0.2%) |
| High School Diploma | 2,486 (78.6%) | 310 (9.8%) |
| College / Associate Degree | 4,538 (80.7%) | 73 (1.3%) |
| Bachelor's Degree or higher | 6,270 (87.9%) | 64 (0.9%) |
| Total | 13,735 (82.2%) | 434 (2.6%) |
Employment Occupations by Sex in University Place
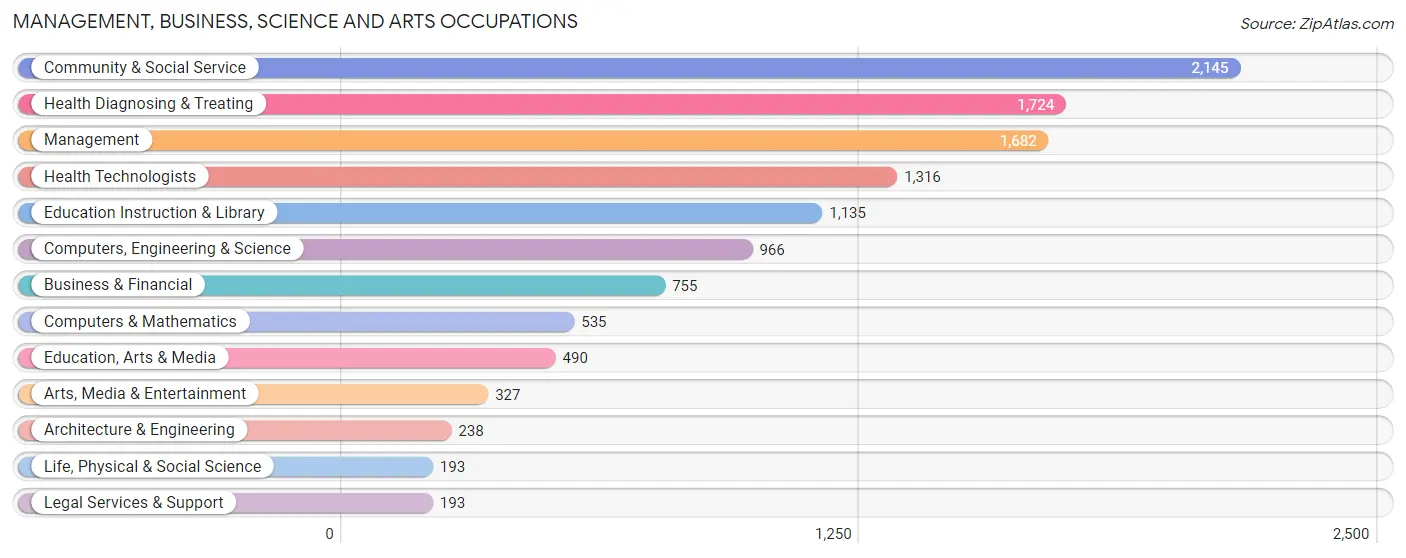
Management, Business, Science and Arts Occupations
The most common Management, Business, Science and Arts occupations in University Place are Community & Social Service (2,145 | 12.9%), Health Diagnosing & Treating (1,724 | 10.4%), Management (1,682 | 10.2%), Health Technologists (1,316 | 7.9%), and Education Instruction & Library (1,135 | 6.9%).
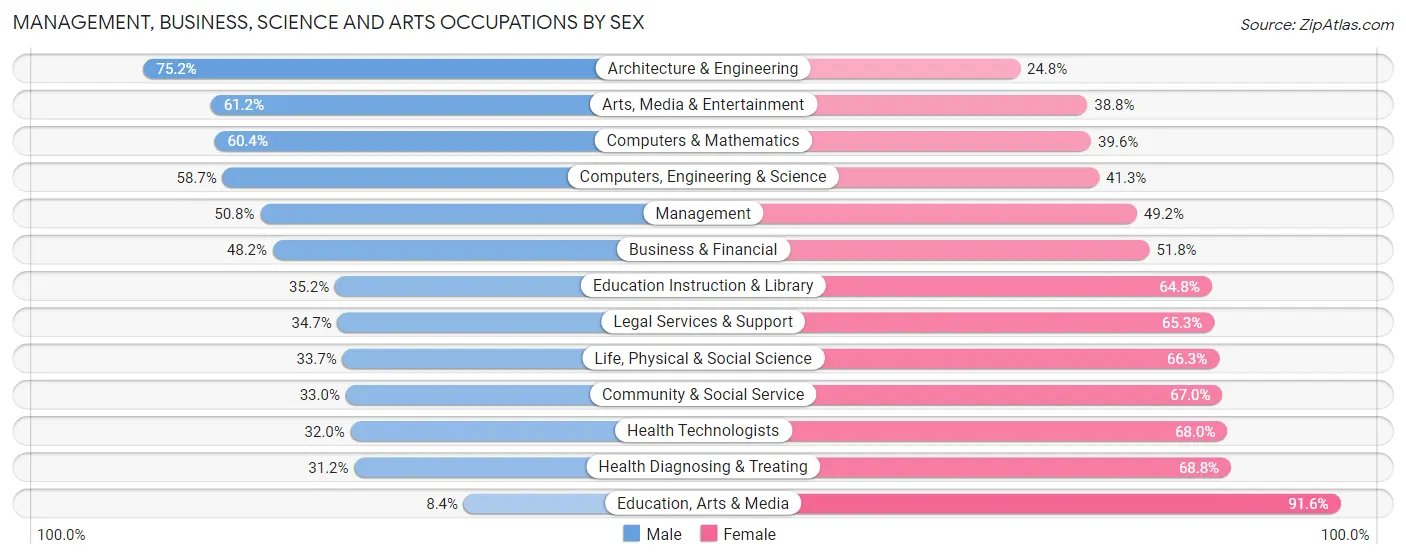
Management, Business, Science and Arts Occupations by Sex
Within the Management, Business, Science and Arts occupations in University Place, the most male-oriented occupations are Architecture & Engineering (75.2%), Arts, Media & Entertainment (61.2%), and Computers & Mathematics (60.4%), while the most female-oriented occupations are Education, Arts & Media (91.6%), Health Diagnosing & Treating (68.8%), and Health Technologists (68.0%).
| Occupation | Male | Female |
| Management | 855 (50.8%) | 827 (49.2%) |
| Business & Financial | 364 (48.2%) | 391 (51.8%) |
| Computers, Engineering & Science | 567 (58.7%) | 399 (41.3%) |
| Computers & Mathematics | 323 (60.4%) | 212 (39.6%) |
| Architecture & Engineering | 179 (75.2%) | 59 (24.8%) |
| Life, Physical & Social Science | 65 (33.7%) | 128 (66.3%) |
| Community & Social Service | 708 (33.0%) | 1,437 (67.0%) |
| Education, Arts & Media | 41 (8.4%) | 449 (91.6%) |
| Legal Services & Support | 67 (34.7%) | 126 (65.3%) |
| Education Instruction & Library | 400 (35.2%) | 735 (64.8%) |
| Arts, Media & Entertainment | 200 (61.2%) | 127 (38.8%) |
| Health Diagnosing & Treating | 538 (31.2%) | 1,186 (68.8%) |
| Health Technologists | 421 (32.0%) | 895 (68.0%) |
| Total (Category) | 3,032 (41.7%) | 4,240 (58.3%) |
| Total (Overall) | 8,456 (51.0%) | 8,119 (49.0%) |
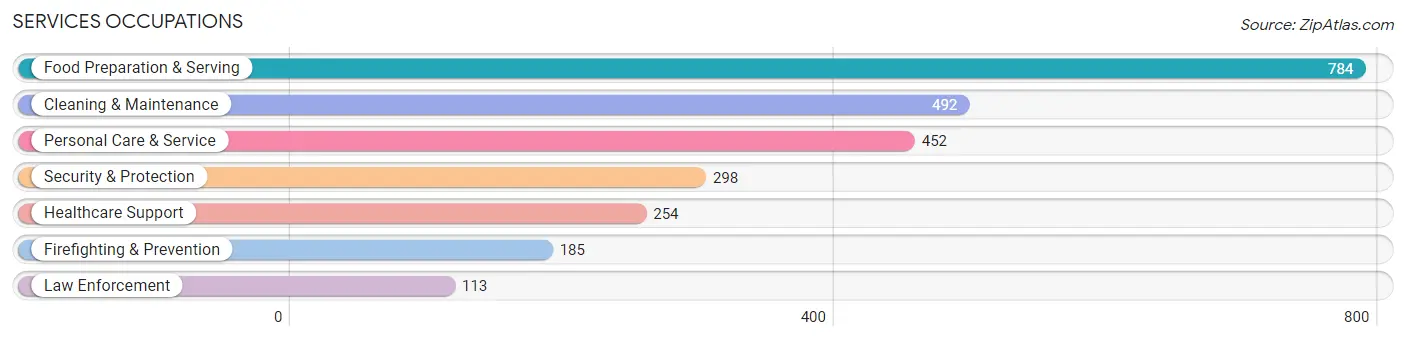
Services Occupations
The most common Services occupations in University Place are Food Preparation & Serving (784 | 4.7%), Cleaning & Maintenance (492 | 3.0%), Personal Care & Service (452 | 2.7%), Security & Protection (298 | 1.8%), and Healthcare Support (254 | 1.5%).
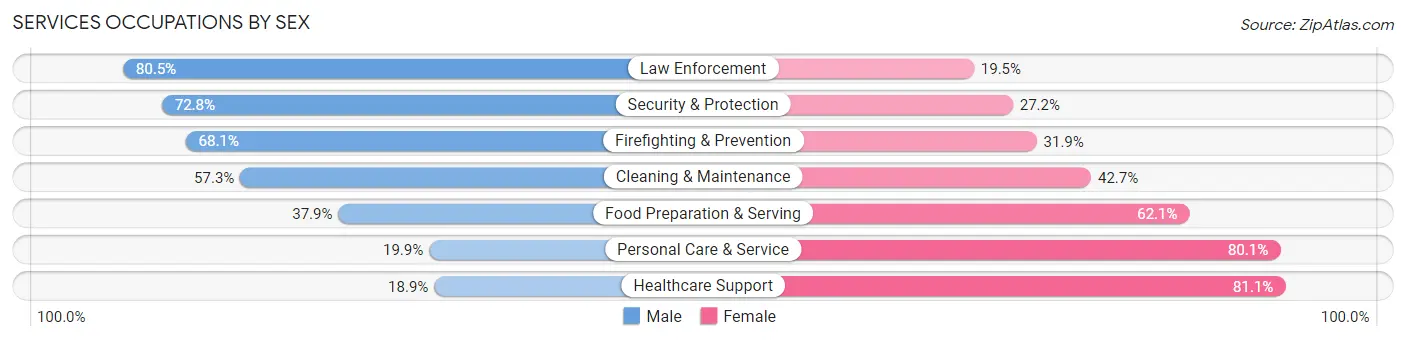
Services Occupations by Sex
Within the Services occupations in University Place, the most male-oriented occupations are Law Enforcement (80.5%), Security & Protection (72.8%), and Firefighting & Prevention (68.1%), while the most female-oriented occupations are Healthcare Support (81.1%), Personal Care & Service (80.1%), and Food Preparation & Serving (62.1%).
| Occupation | Male | Female |
| Healthcare Support | 48 (18.9%) | 206 (81.1%) |
| Security & Protection | 217 (72.8%) | 81 (27.2%) |
| Firefighting & Prevention | 126 (68.1%) | 59 (31.9%) |
| Law Enforcement | 91 (80.5%) | 22 (19.5%) |
| Food Preparation & Serving | 297 (37.9%) | 487 (62.1%) |
| Cleaning & Maintenance | 282 (57.3%) | 210 (42.7%) |
| Personal Care & Service | 90 (19.9%) | 362 (80.1%) |
| Total (Category) | 934 (41.0%) | 1,346 (59.0%) |
| Total (Overall) | 8,456 (51.0%) | 8,119 (49.0%) |
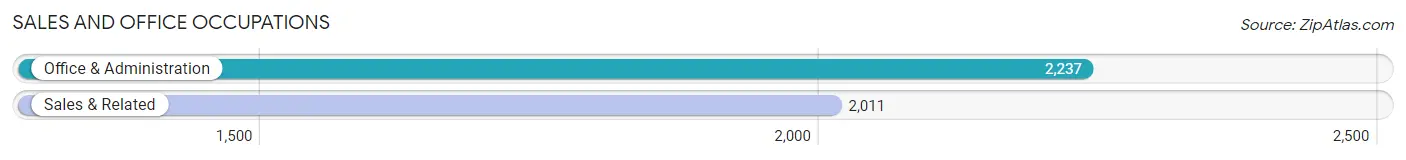
Sales and Office Occupations
The most common Sales and Office occupations in University Place are Office & Administration (2,237 | 13.5%), and Sales & Related (2,011 | 12.1%).
Sales and Office Occupations by Sex
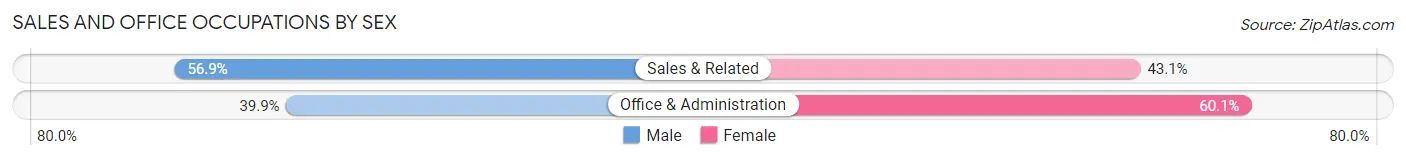
| Occupation | Male | Female |
| Sales & Related | 1,145 (56.9%) | 866 (43.1%) |
| Office & Administration | 892 (39.9%) | 1,345 (60.1%) |
| Total (Category) | 2,037 (47.9%) | 2,211 (52.0%) |
| Total (Overall) | 8,456 (51.0%) | 8,119 (49.0%) |
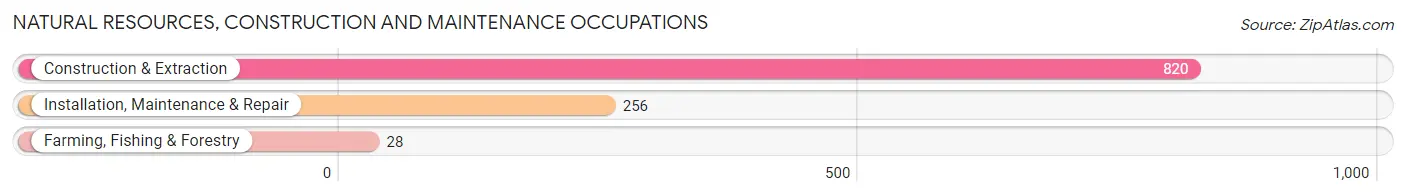
Natural Resources, Construction and Maintenance Occupations
The most common Natural Resources, Construction and Maintenance occupations in University Place are Construction & Extraction (820 | 5.0%), Installation, Maintenance & Repair (256 | 1.5%), and Farming, Fishing & Forestry (28 | 0.2%).
Natural Resources, Construction and Maintenance Occupations by Sex
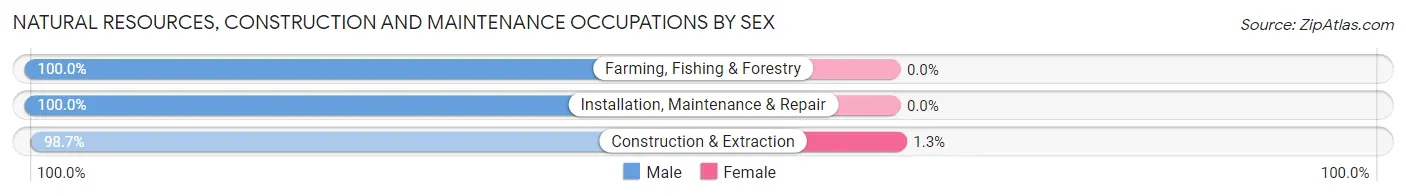
| Occupation | Male | Female |
| Farming, Fishing & Forestry | 28 (100.0%) | 0 (0.0%) |
| Construction & Extraction | 809 (98.7%) | 11 (1.3%) |
| Installation, Maintenance & Repair | 256 (100.0%) | 0 (0.0%) |
| Total (Category) | 1,093 (99.0%) | 11 (1.0%) |
| Total (Overall) | 8,456 (51.0%) | 8,119 (49.0%) |
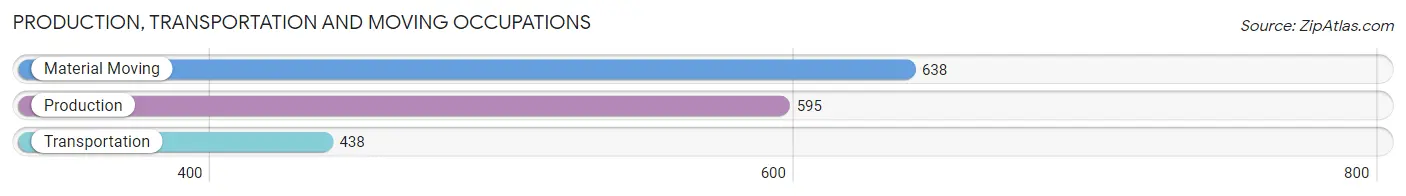
Production, Transportation and Moving Occupations
The most common Production, Transportation and Moving occupations in University Place are Material Moving (638 | 3.8%), Production (595 | 3.6%), and Transportation (438 | 2.6%).
Production, Transportation and Moving Occupations by Sex
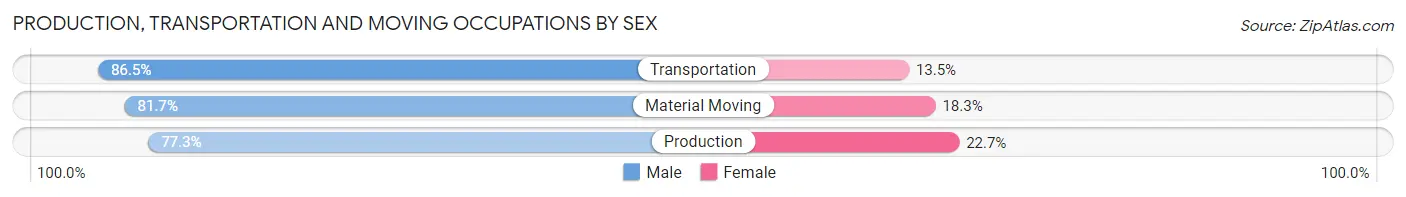
| Occupation | Male | Female |
| Production | 460 (77.3%) | 135 (22.7%) |
| Transportation | 379 (86.5%) | 59 (13.5%) |
| Material Moving | 521 (81.7%) | 117 (18.3%) |
| Total (Category) | 1,360 (81.4%) | 311 (18.6%) |
| Total (Overall) | 8,456 (51.0%) | 8,119 (49.0%) |
Employment Industries by Sex in University Place
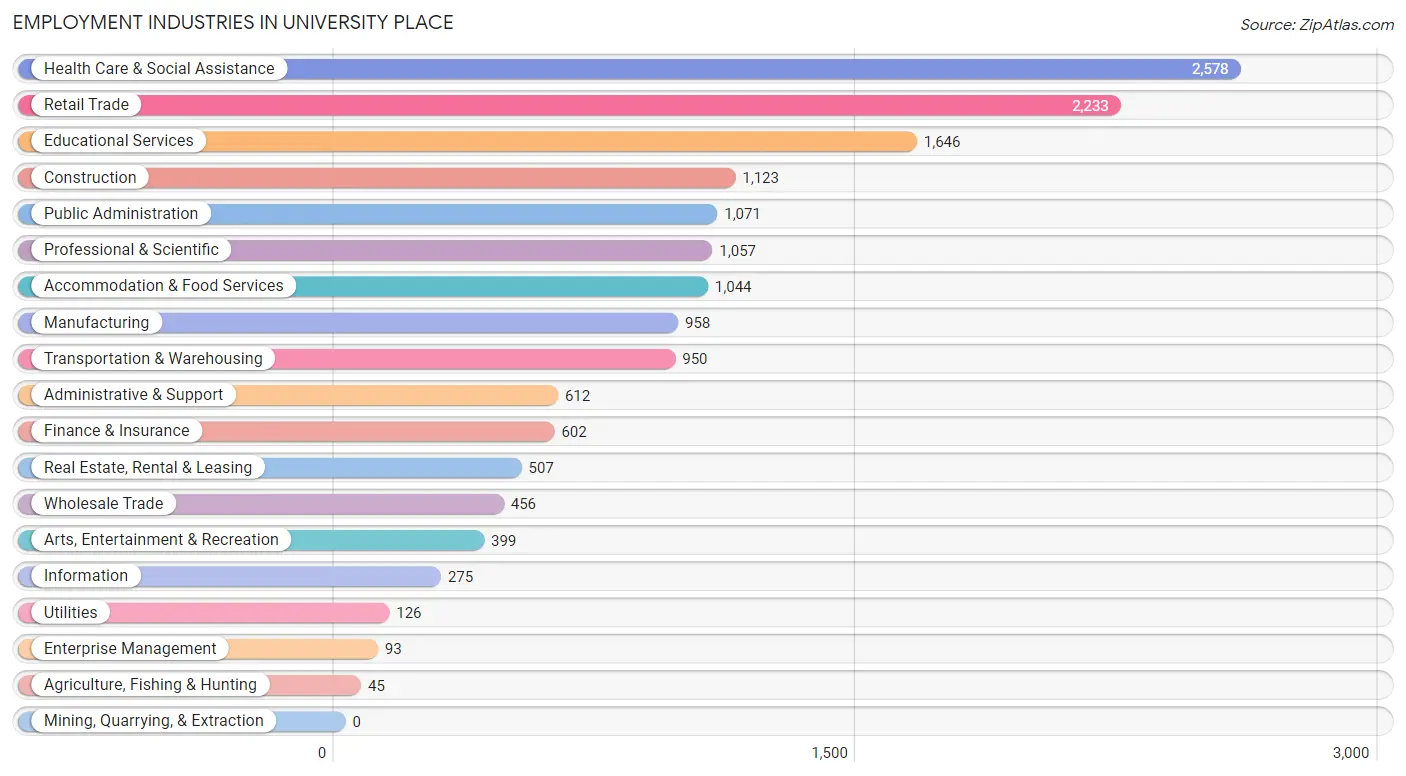
Employment Industries in University Place
The major employment industries in University Place include Health Care & Social Assistance (2,578 | 15.5%), Retail Trade (2,233 | 13.5%), Educational Services (1,646 | 9.9%), Construction (1,123 | 6.8%), and Public Administration (1,071 | 6.5%).
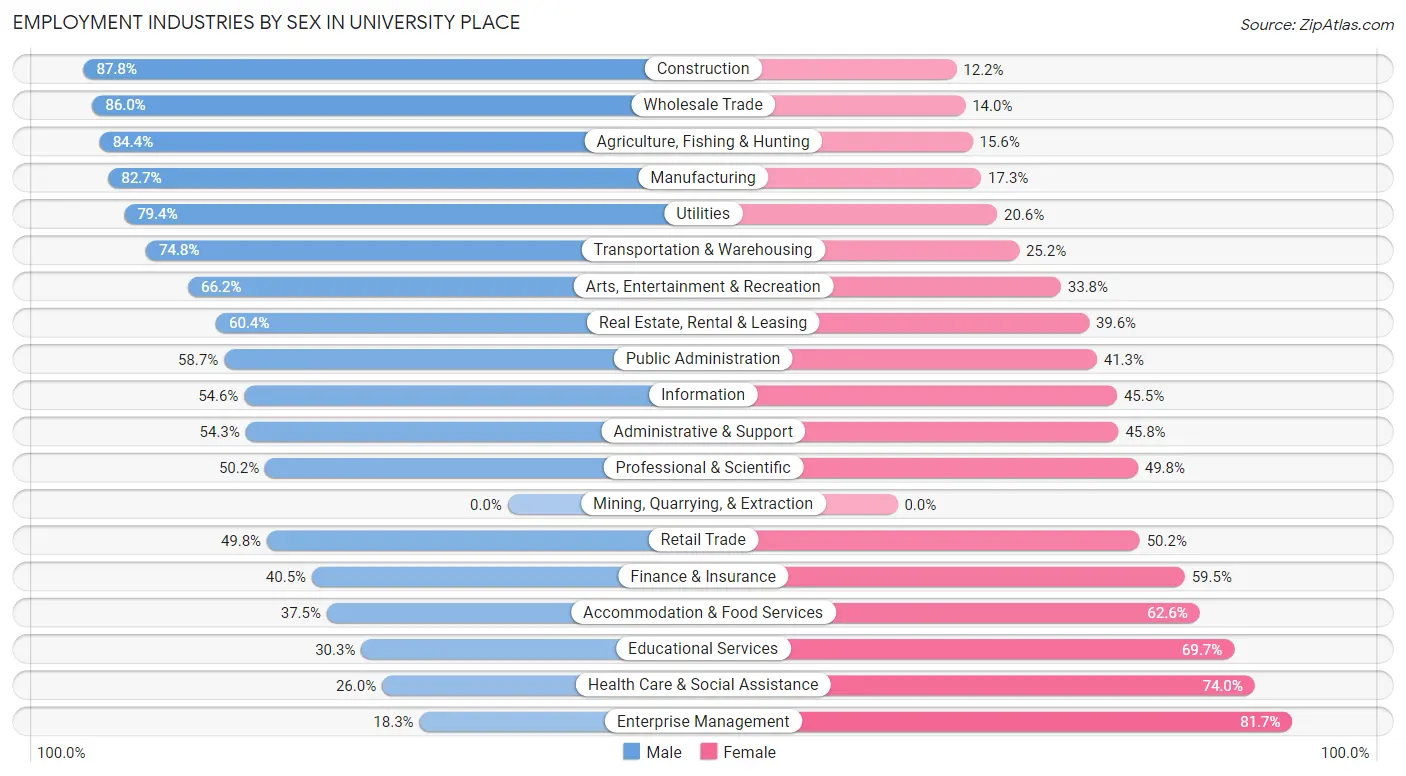
Employment Industries by Sex in University Place
The University Place industries that see more men than women are Construction (87.8%), Wholesale Trade (86.0%), and Agriculture, Fishing & Hunting (84.4%), whereas the industries that tend to have a higher number of women are Enterprise Management (81.7%), Health Care & Social Assistance (74.0%), and Educational Services (69.7%).
| Industry | Male | Female |
| Agriculture, Fishing & Hunting | 38 (84.4%) | 7 (15.6%) |
| Mining, Quarrying, & Extraction | 0 (0.0%) | 0 (0.0%) |
| Construction | 986 (87.8%) | 137 (12.2%) |
| Manufacturing | 792 (82.7%) | 166 (17.3%) |
| Wholesale Trade | 392 (86.0%) | 64 (14.0%) |
| Retail Trade | 1,113 (49.8%) | 1,120 (50.2%) |
| Transportation & Warehousing | 711 (74.8%) | 239 (25.2%) |
| Utilities | 100 (79.4%) | 26 (20.6%) |
| Information | 150 (54.5%) | 125 (45.5%) |
| Finance & Insurance | 244 (40.5%) | 358 (59.5%) |
| Real Estate, Rental & Leasing | 306 (60.4%) | 201 (39.6%) |
| Professional & Scientific | 531 (50.2%) | 526 (49.8%) |
| Enterprise Management | 17 (18.3%) | 76 (81.7%) |
| Administrative & Support | 332 (54.2%) | 280 (45.8%) |
| Educational Services | 499 (30.3%) | 1,147 (69.7%) |
| Health Care & Social Assistance | 671 (26.0%) | 1,907 (74.0%) |
| Arts, Entertainment & Recreation | 264 (66.2%) | 135 (33.8%) |
| Accommodation & Food Services | 391 (37.4%) | 653 (62.5%) |
| Public Administration | 629 (58.7%) | 442 (41.3%) |
| Total | 8,456 (51.0%) | 8,119 (49.0%) |
Education in University Place
School Enrollment in University Place
The most common levels of schooling among the 8,745 students in University Place are elementary school (2,145 | 24.5%), high school (1,970 | 22.5%), and middle school (1,794 | 20.5%).
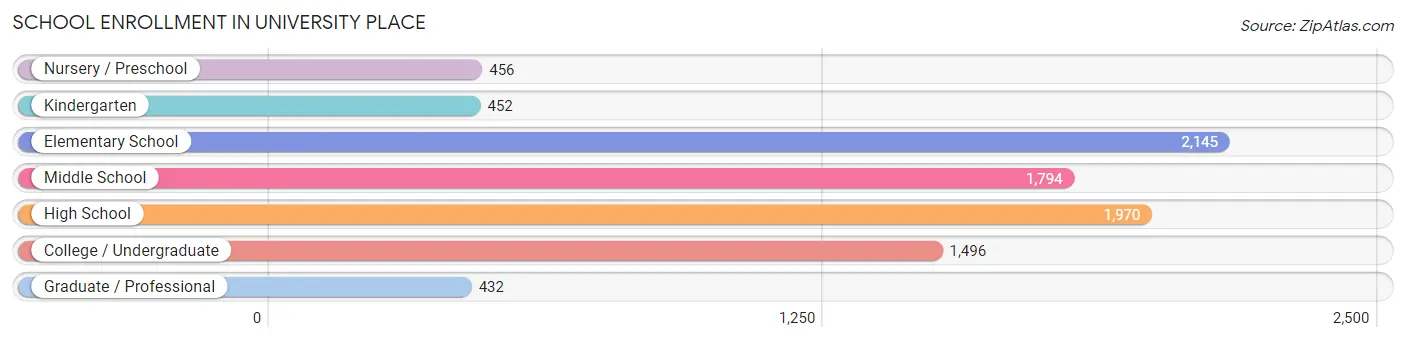
| School Level | # Students | % Students |
| Nursery / Preschool | 456 | 5.2% |
| Kindergarten | 452 | 5.2% |
| Elementary School | 2,145 | 24.5% |
| Middle School | 1,794 | 20.5% |
| High School | 1,970 | 22.5% |
| College / Undergraduate | 1,496 | 17.1% |
| Graduate / Professional | 432 | 4.9% |
| Total | 8,745 | 100.0% |
School Enrollment by Age by Funding Source in University Place
Out of a total of 8,745 students who are enrolled in schools in University Place, 1,504 (17.2%) attend a private institution, while the remaining 7,241 (82.8%) are enrolled in public schools. The age group of 3 to 4 year olds has the highest likelihood of being enrolled in private schools, with 208 (64.4% in the age bracket) enrolled. Conversely, the age group of 18 to 19 year olds has the lowest likelihood of being enrolled in a private school, with 524 (96.0% in the age bracket) attending a public institution.
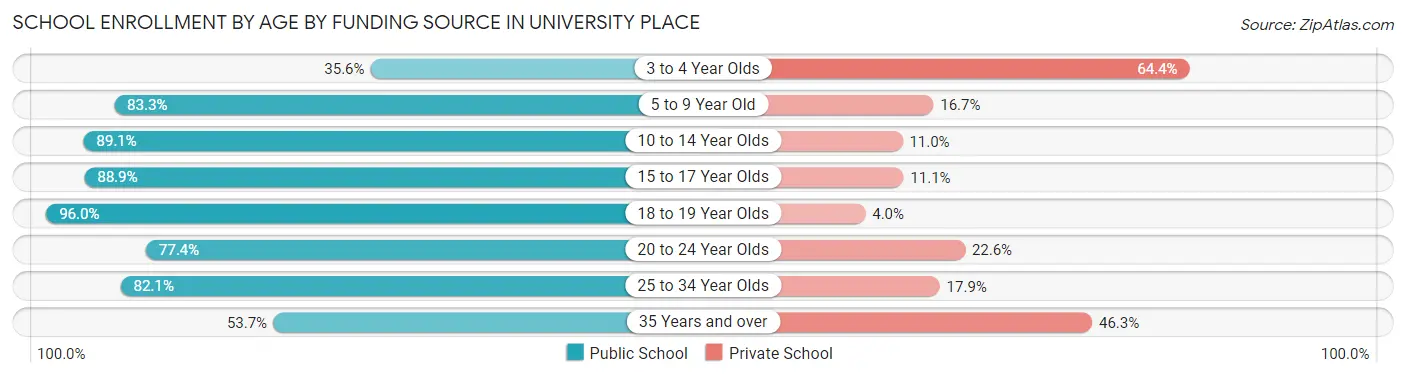
| Age Bracket | Public School | Private School |
| 3 to 4 Year Olds | 115 (35.6%) | 208 (64.4%) |
| 5 to 9 Year Old | 1,992 (83.3%) | 399 (16.7%) |
| 10 to 14 Year Olds | 2,065 (89.0%) | 254 (11.0%) |
| 15 to 17 Year Olds | 1,382 (88.9%) | 173 (11.1%) |
| 18 to 19 Year Olds | 524 (96.0%) | 22 (4.0%) |
| 20 to 24 Year Olds | 545 (77.4%) | 159 (22.6%) |
| 25 to 34 Year Olds | 372 (82.1%) | 81 (17.9%) |
| 35 Years and over | 244 (53.7%) | 210 (46.3%) |
| Total | 7,241 (82.8%) | 1,504 (17.2%) |
Educational Attainment by Field of Study in University Place
Business (1,765 | 16.6%), science & technology (1,077 | 10.1%), education (1,038 | 9.7%), social sciences (1,018 | 9.6%), and bio, nature & agricultural (818 | 7.7%) are the most common fields of study among 10,653 individuals in University Place who have obtained a bachelor's degree or higher.
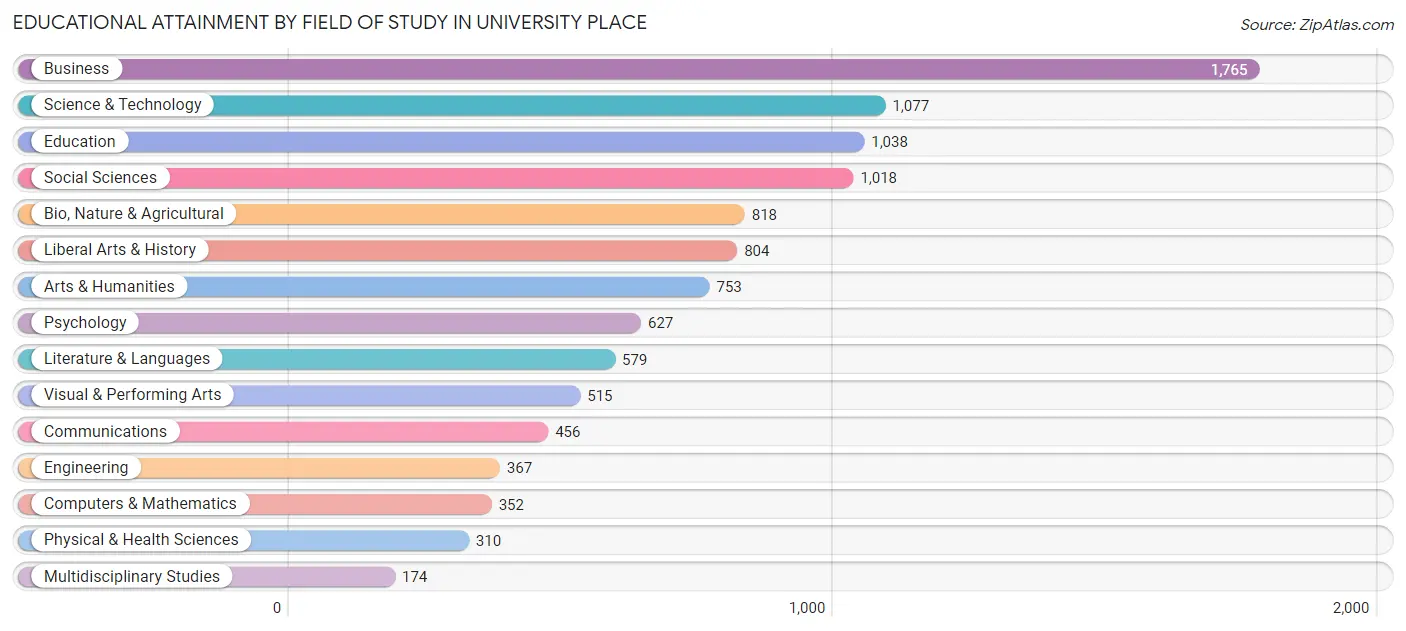
| Field of Study | # Graduates | % Graduates |
| Computers & Mathematics | 352 | 3.3% |
| Bio, Nature & Agricultural | 818 | 7.7% |
| Physical & Health Sciences | 310 | 2.9% |
| Psychology | 627 | 5.9% |
| Social Sciences | 1,018 | 9.6% |
| Engineering | 367 | 3.5% |
| Multidisciplinary Studies | 174 | 1.6% |
| Science & Technology | 1,077 | 10.1% |
| Business | 1,765 | 16.6% |
| Education | 1,038 | 9.7% |
| Literature & Languages | 579 | 5.4% |
| Liberal Arts & History | 804 | 7.5% |
| Visual & Performing Arts | 515 | 4.8% |
| Communications | 456 | 4.3% |
| Arts & Humanities | 753 | 7.1% |
| Total | 10,653 | 100.0% |
Transportation & Commute in University Place
Vehicle Availability by Sex in University Place
The most prevalent vehicle ownership categories in University Place are males with 2 vehicles (3,647, accounting for 44.1%) and females with 2 vehicles (3,151, making up 46.0%).
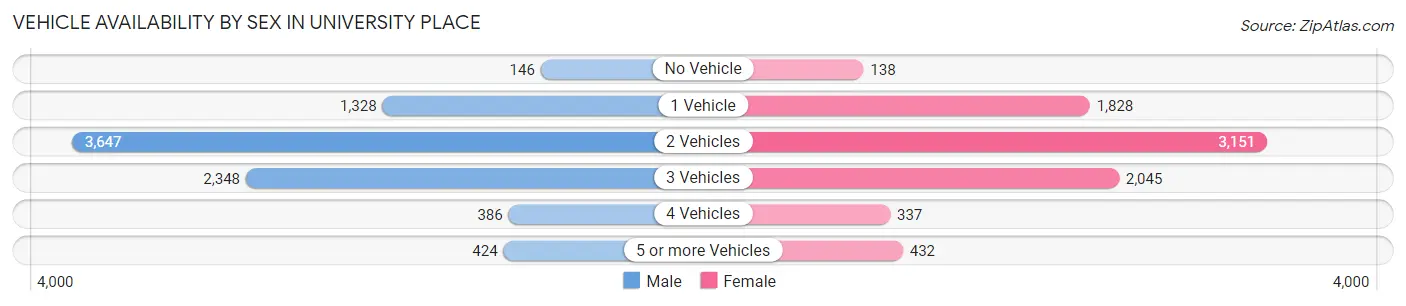
| Vehicles Available | Male | Female |
| No Vehicle | 146 (1.8%) | 138 (1.7%) |
| 1 Vehicle | 1,328 (16.0%) | 1,828 (23.1%) |
| 2 Vehicles | 3,647 (44.1%) | 3,151 (39.7%) |
| 3 Vehicles | 2,348 (28.4%) | 2,045 (25.8%) |
| 4 Vehicles | 386 (4.7%) | 337 (4.3%) |
| 5 or more Vehicles | 424 (5.1%) | 432 (5.4%) |
| Total | 8,279 (100.0%) | 7,931 (100.0%) |
Commute Time in University Place
The most frequently occuring commute durations in University Place are 15 to 19 minutes (3,037 commuters, 21.6%), 20 to 24 minutes (2,024 commuters, 14.4%), and 10 to 14 minutes (1,930 commuters, 13.7%).
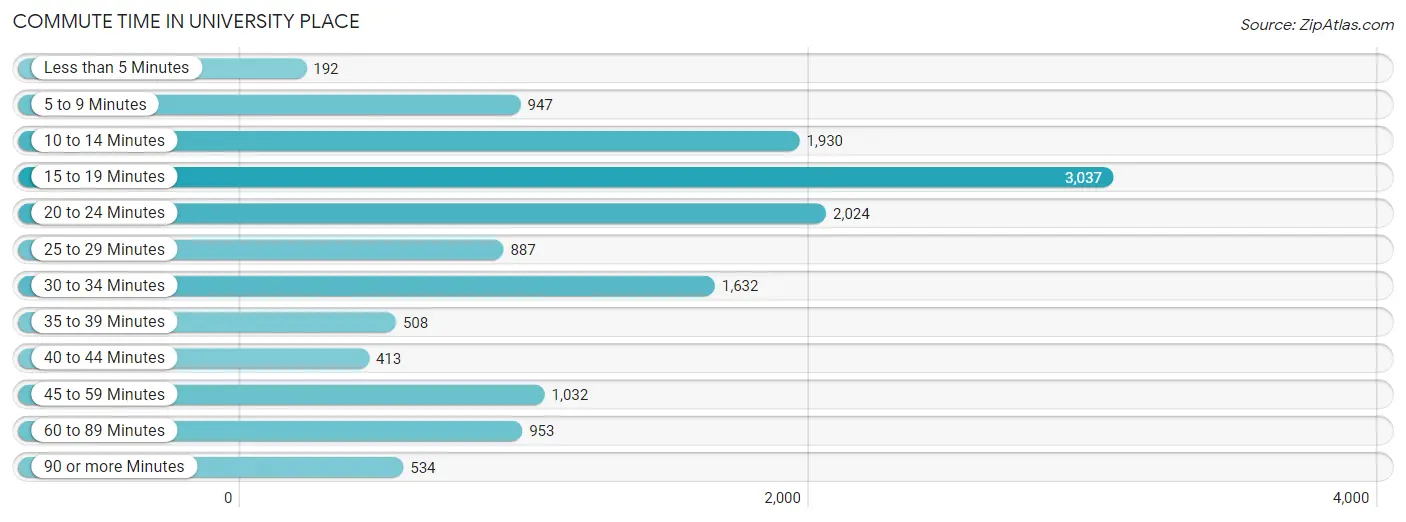
| Commute Time | # Commuters | % Commuters |
| Less than 5 Minutes | 192 | 1.4% |
| 5 to 9 Minutes | 947 | 6.7% |
| 10 to 14 Minutes | 1,930 | 13.7% |
| 15 to 19 Minutes | 3,037 | 21.6% |
| 20 to 24 Minutes | 2,024 | 14.4% |
| 25 to 29 Minutes | 887 | 6.3% |
| 30 to 34 Minutes | 1,632 | 11.6% |
| 35 to 39 Minutes | 508 | 3.6% |
| 40 to 44 Minutes | 413 | 2.9% |
| 45 to 59 Minutes | 1,032 | 7.3% |
| 60 to 89 Minutes | 953 | 6.8% |
| 90 or more Minutes | 534 | 3.8% |
Commute Time by Sex in University Place
The most common commute times in University Place are 15 to 19 minutes (1,310 commuters, 17.8%) for males and 15 to 19 minutes (1,727 commuters, 25.6%) for females.
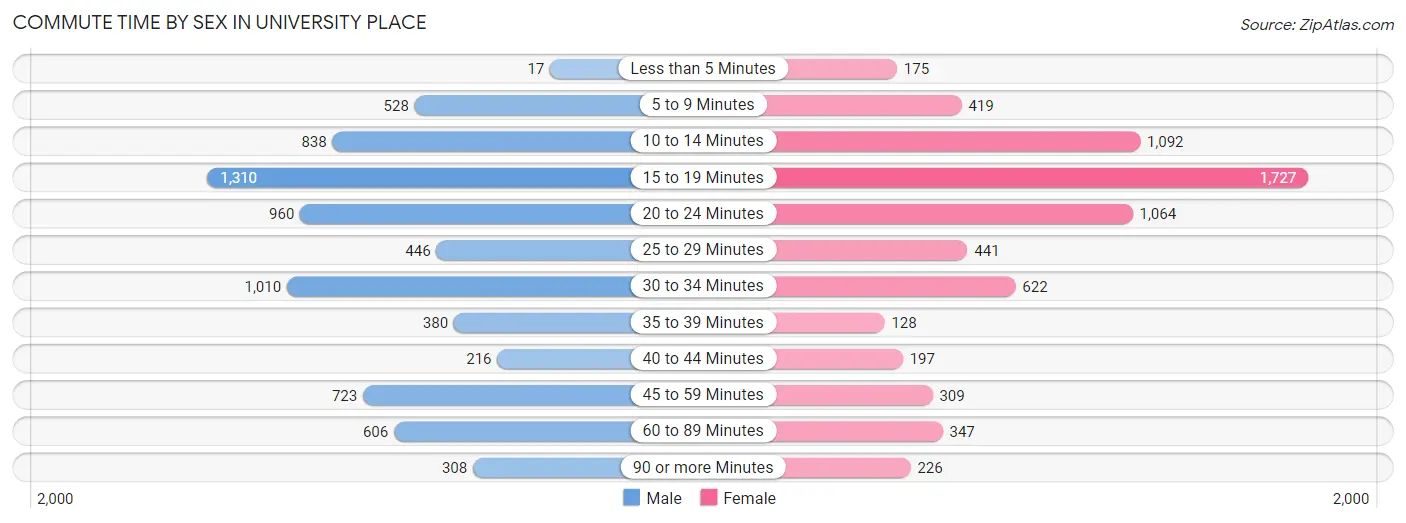
| Commute Time | Male | Female |
| Less than 5 Minutes | 17 (0.2%) | 175 (2.6%) |
| 5 to 9 Minutes | 528 (7.2%) | 419 (6.2%) |
| 10 to 14 Minutes | 838 (11.4%) | 1,092 (16.2%) |
| 15 to 19 Minutes | 1,310 (17.8%) | 1,727 (25.6%) |
| 20 to 24 Minutes | 960 (13.1%) | 1,064 (15.8%) |
| 25 to 29 Minutes | 446 (6.1%) | 441 (6.5%) |
| 30 to 34 Minutes | 1,010 (13.8%) | 622 (9.2%) |
| 35 to 39 Minutes | 380 (5.2%) | 128 (1.9%) |
| 40 to 44 Minutes | 216 (2.9%) | 197 (2.9%) |
| 45 to 59 Minutes | 723 (9.9%) | 309 (4.6%) |
| 60 to 89 Minutes | 606 (8.3%) | 347 (5.1%) |
| 90 or more Minutes | 308 (4.2%) | 226 (3.4%) |
Time of Departure to Work by Sex in University Place
The most frequent times of departure to work in University Place are 7:00 AM to 7:29 AM (905, 12.3%) for males and 7:30 AM to 7:59 AM (951, 14.1%) for females.
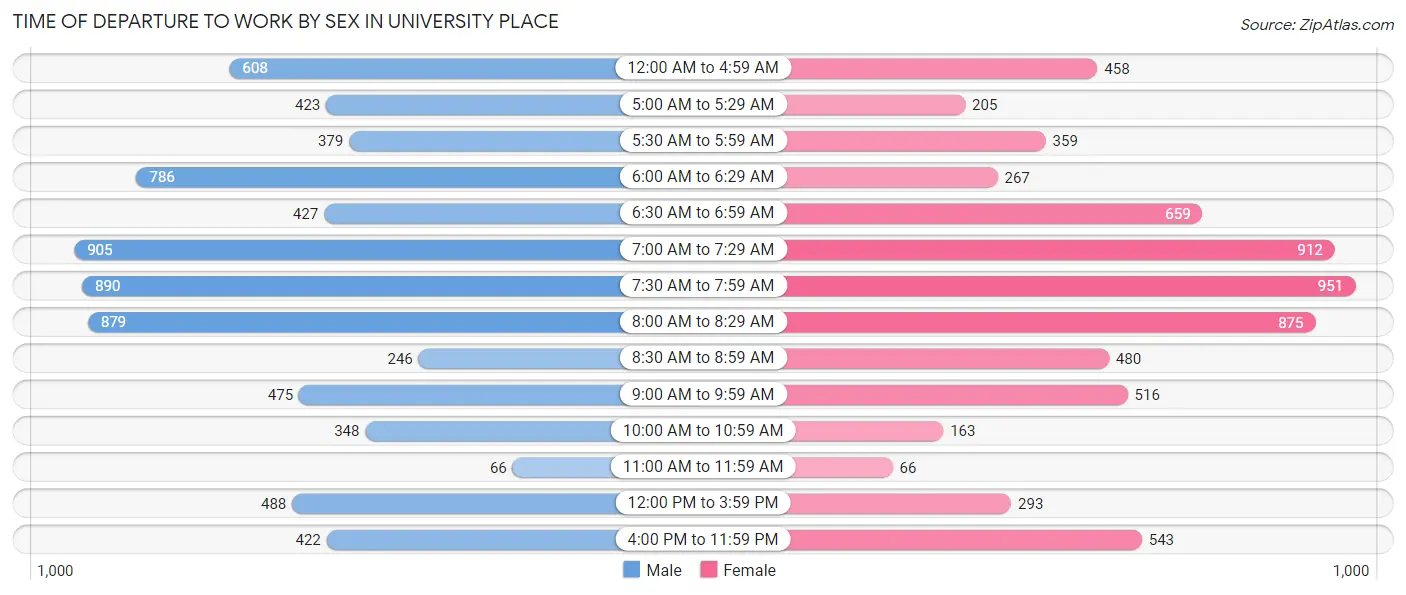
| Time of Departure | Male | Female |
| 12:00 AM to 4:59 AM | 608 (8.3%) | 458 (6.8%) |
| 5:00 AM to 5:29 AM | 423 (5.8%) | 205 (3.0%) |
| 5:30 AM to 5:59 AM | 379 (5.2%) | 359 (5.3%) |
| 6:00 AM to 6:29 AM | 786 (10.7%) | 267 (4.0%) |
| 6:30 AM to 6:59 AM | 427 (5.8%) | 659 (9.8%) |
| 7:00 AM to 7:29 AM | 905 (12.3%) | 912 (13.5%) |
| 7:30 AM to 7:59 AM | 890 (12.1%) | 951 (14.1%) |
| 8:00 AM to 8:29 AM | 879 (12.0%) | 875 (13.0%) |
| 8:30 AM to 8:59 AM | 246 (3.4%) | 480 (7.1%) |
| 9:00 AM to 9:59 AM | 475 (6.5%) | 516 (7.6%) |
| 10:00 AM to 10:59 AM | 348 (4.7%) | 163 (2.4%) |
| 11:00 AM to 11:59 AM | 66 (0.9%) | 66 (1.0%) |
| 12:00 PM to 3:59 PM | 488 (6.7%) | 293 (4.3%) |
| 4:00 PM to 11:59 PM | 422 (5.8%) | 543 (8.1%) |
| Total | 7,342 (100.0%) | 6,747 (100.0%) |
Housing Occupancy in University Place
Occupancy by Ownership in University Place
Of the total 13,682 dwellings in University Place, owner-occupied units account for 7,985 (58.4%), while renter-occupied units make up 5,697 (41.6%).
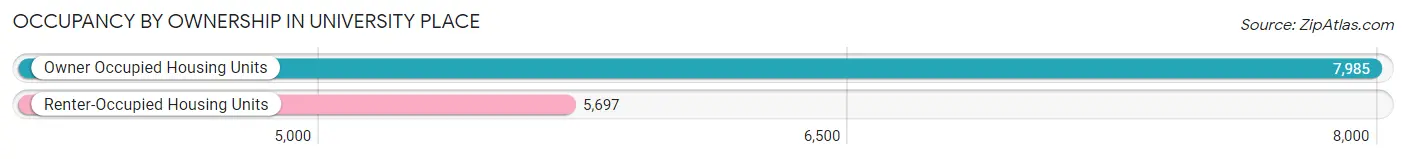
| Occupancy | # Housing Units | % Housing Units |
| Owner Occupied Housing Units | 7,985 | 58.4% |
| Renter-Occupied Housing Units | 5,697 | 41.6% |
| Total Occupied Housing Units | 13,682 | 100.0% |
Occupancy by Household Size in University Place
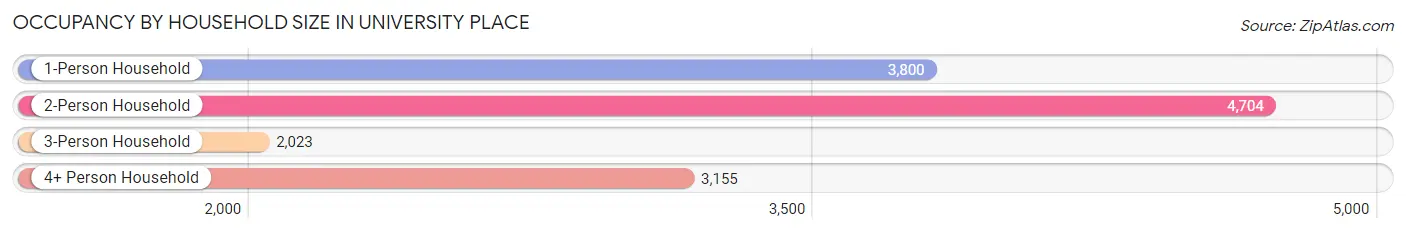
| Household Size | # Housing Units | % Housing Units |
| 1-Person Household | 3,800 | 27.8% |
| 2-Person Household | 4,704 | 34.4% |
| 3-Person Household | 2,023 | 14.8% |
| 4+ Person Household | 3,155 | 23.1% |
| Total Housing Units | 13,682 | 100.0% |
Occupancy by Ownership by Household Size in University Place
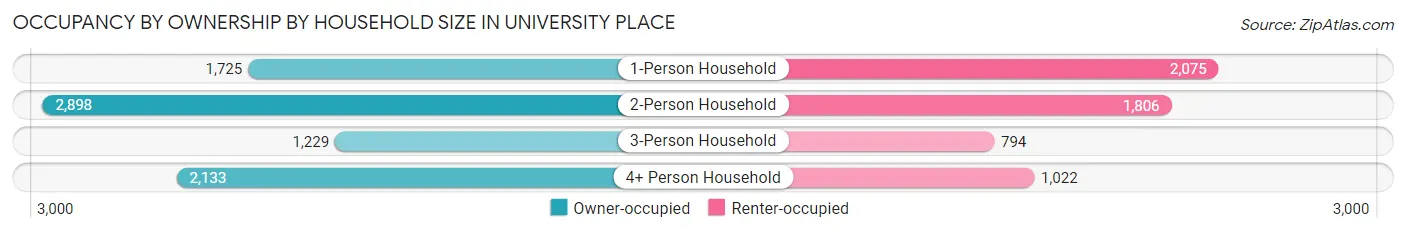
| Household Size | Owner-occupied | Renter-occupied |
| 1-Person Household | 1,725 (45.4%) | 2,075 (54.6%) |
| 2-Person Household | 2,898 (61.6%) | 1,806 (38.4%) |
| 3-Person Household | 1,229 (60.8%) | 794 (39.3%) |
| 4+ Person Household | 2,133 (67.6%) | 1,022 (32.4%) |
| Total Housing Units | 7,985 (58.4%) | 5,697 (41.6%) |
Occupancy by Educational Attainment in University Place
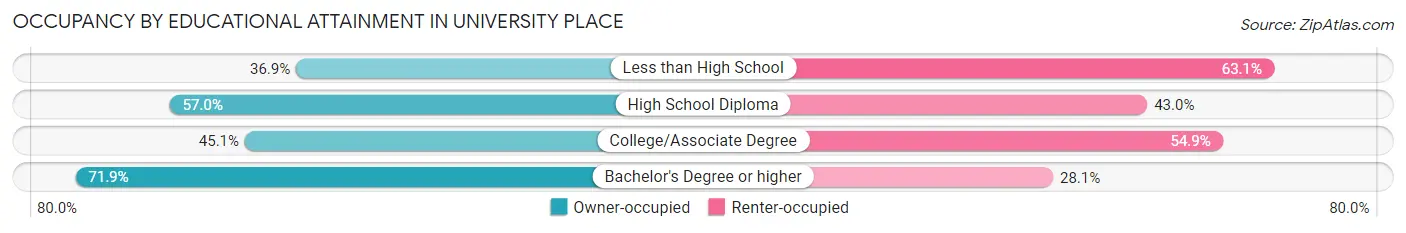
| Household Size | Owner-occupied | Renter-occupied |
| Less than High School | 188 (36.9%) | 321 (63.1%) |
| High School Diploma | 1,249 (57.0%) | 942 (43.0%) |
| College/Associate Degree | 2,268 (45.1%) | 2,765 (54.9%) |
| Bachelor's Degree or higher | 4,280 (71.9%) | 1,669 (28.1%) |
Occupancy by Age of Householder in University Place
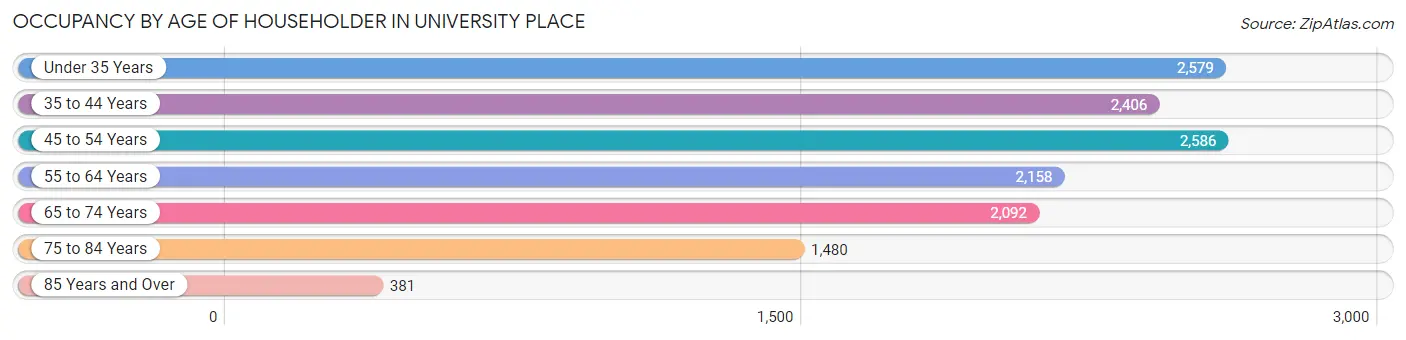
| Age Bracket | # Households | % Households |
| Under 35 Years | 2,579 | 18.9% |
| 35 to 44 Years | 2,406 | 17.6% |
| 45 to 54 Years | 2,586 | 18.9% |
| 55 to 64 Years | 2,158 | 15.8% |
| 65 to 74 Years | 2,092 | 15.3% |
| 75 to 84 Years | 1,480 | 10.8% |
| 85 Years and Over | 381 | 2.8% |
| Total | 13,682 | 100.0% |
Housing Finances in University Place
Median Income by Occupancy in University Place
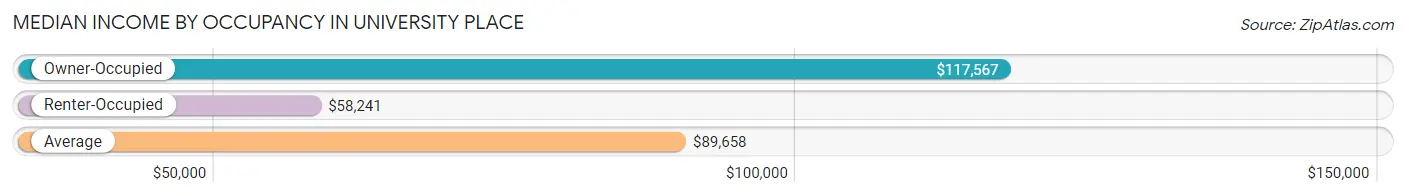
| Occupancy Type | # Households | Median Income |
| Owner-Occupied | 7,985 (58.4%) | $117,567 |
| Renter-Occupied | 5,697 (41.6%) | $58,241 |
| Average | 13,682 (100.0%) | $89,658 |
Occupancy by Householder Income Bracket in University Place
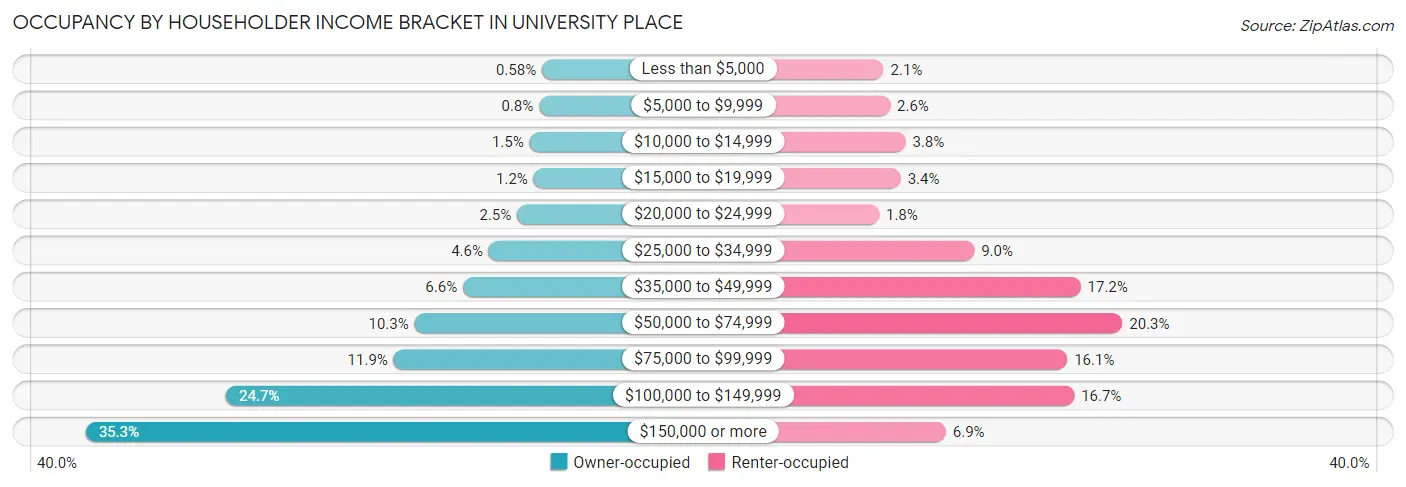
| Income Bracket | Owner-occupied | Renter-occupied |
| Less than $5,000 | 46 (0.6%) | 122 (2.1%) |
| $5,000 to $9,999 | 64 (0.8%) | 150 (2.6%) |
| $10,000 to $14,999 | 122 (1.5%) | 217 (3.8%) |
| $15,000 to $19,999 | 97 (1.2%) | 196 (3.4%) |
| $20,000 to $24,999 | 198 (2.5%) | 102 (1.8%) |
| $25,000 to $34,999 | 370 (4.6%) | 515 (9.0%) |
| $35,000 to $49,999 | 527 (6.6%) | 977 (17.2%) |
| $50,000 to $74,999 | 822 (10.3%) | 1,158 (20.3%) |
| $75,000 to $99,999 | 949 (11.9%) | 919 (16.1%) |
| $100,000 to $149,999 | 1,968 (24.6%) | 949 (16.7%) |
| $150,000 or more | 2,822 (35.3%) | 392 (6.9%) |
| Total | 7,985 (100.0%) | 5,697 (100.0%) |
Monthly Housing Cost Tiers in University Place
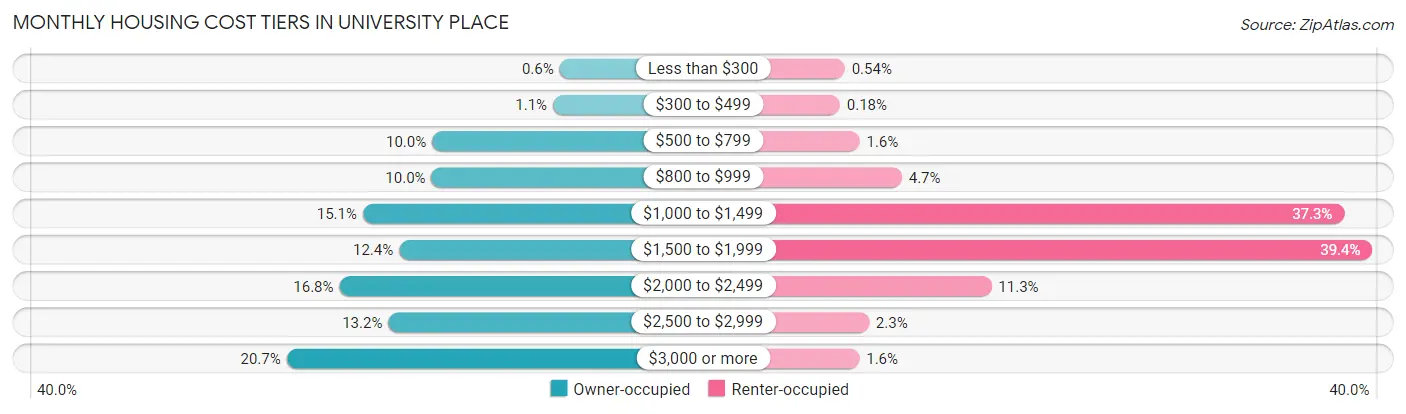
| Monthly Cost | Owner-occupied | Renter-occupied |
| Less than $300 | 48 (0.6%) | 31 (0.5%) |
| $300 to $499 | 87 (1.1%) | 10 (0.2%) |
| $500 to $799 | 798 (10.0%) | 93 (1.6%) |
| $800 to $999 | 802 (10.0%) | 270 (4.7%) |
| $1,000 to $1,499 | 1,205 (15.1%) | 2,126 (37.3%) |
| $1,500 to $1,999 | 992 (12.4%) | 2,244 (39.4%) |
| $2,000 to $2,499 | 1,343 (16.8%) | 646 (11.3%) |
| $2,500 to $2,999 | 1,056 (13.2%) | 132 (2.3%) |
| $3,000 or more | 1,654 (20.7%) | 92 (1.6%) |
| Total | 7,985 (100.0%) | 5,697 (100.0%) |
Physical Housing Characteristics in University Place
Housing Structures in University Place
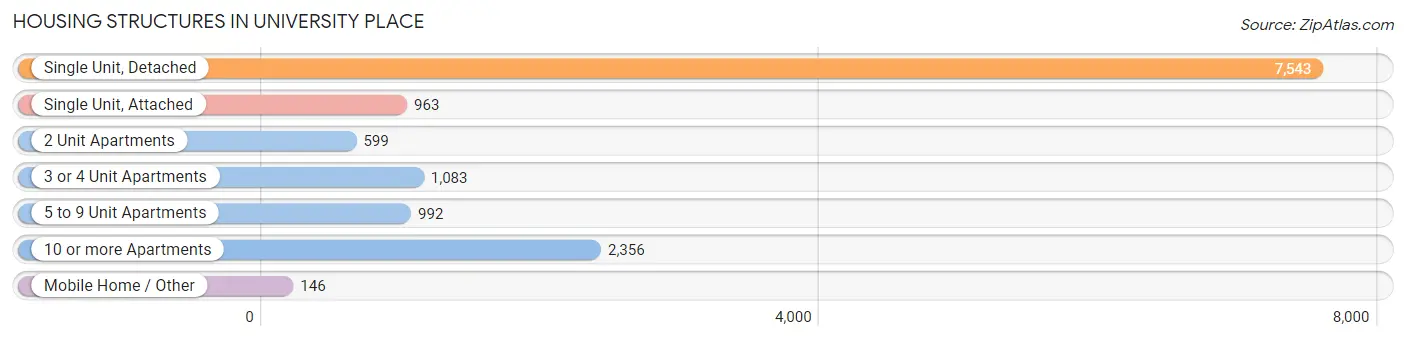
| Structure Type | # Housing Units | % Housing Units |
| Single Unit, Detached | 7,543 | 55.1% |
| Single Unit, Attached | 963 | 7.0% |
| 2 Unit Apartments | 599 | 4.4% |
| 3 or 4 Unit Apartments | 1,083 | 7.9% |
| 5 to 9 Unit Apartments | 992 | 7.2% |
| 10 or more Apartments | 2,356 | 17.2% |
| Mobile Home / Other | 146 | 1.1% |
| Total | 13,682 | 100.0% |
Housing Structures by Occupancy in University Place
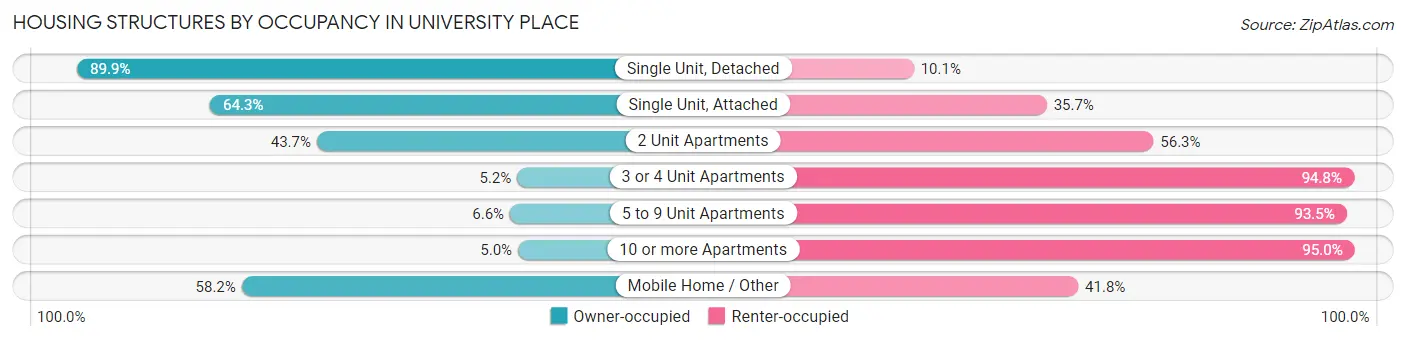
| Structure Type | Owner-occupied | Renter-occupied |
| Single Unit, Detached | 6,780 (89.9%) | 763 (10.1%) |
| Single Unit, Attached | 619 (64.3%) | 344 (35.7%) |
| 2 Unit Apartments | 262 (43.7%) | 337 (56.3%) |
| 3 or 4 Unit Apartments | 56 (5.2%) | 1,027 (94.8%) |
| 5 to 9 Unit Apartments | 65 (6.6%) | 927 (93.4%) |
| 10 or more Apartments | 118 (5.0%) | 2,238 (95.0%) |
| Mobile Home / Other | 85 (58.2%) | 61 (41.8%) |
| Total | 7,985 (58.4%) | 5,697 (41.6%) |
Housing Structures by Number of Rooms in University Place
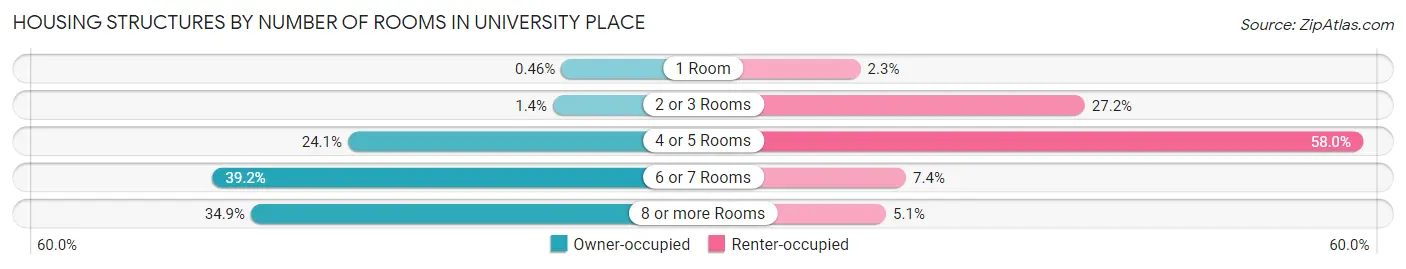
| Number of Rooms | Owner-occupied | Renter-occupied |
| 1 Room | 37 (0.5%) | 131 (2.3%) |
| 2 or 3 Rooms | 109 (1.4%) | 1,549 (27.2%) |
| 4 or 5 Rooms | 1,927 (24.1%) | 3,306 (58.0%) |
| 6 or 7 Rooms | 3,126 (39.2%) | 419 (7.3%) |
| 8 or more Rooms | 2,786 (34.9%) | 292 (5.1%) |
| Total | 7,985 (100.0%) | 5,697 (100.0%) |
Housing Structure by Heating Type in University Place
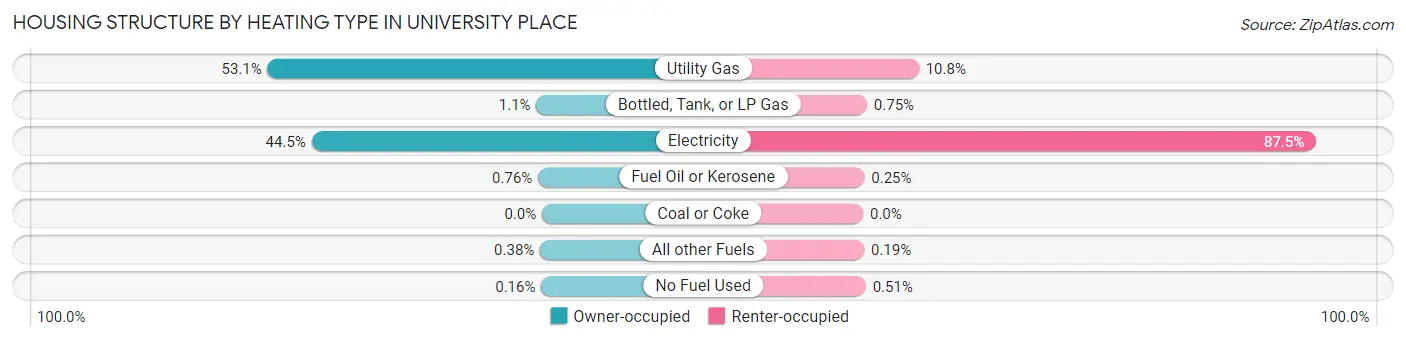
| Heating Type | Owner-occupied | Renter-occupied |
| Utility Gas | 4,237 (53.1%) | 613 (10.8%) |
| Bottled, Tank, or LP Gas | 88 (1.1%) | 43 (0.7%) |
| Electricity | 3,556 (44.5%) | 4,987 (87.5%) |
| Fuel Oil or Kerosene | 61 (0.8%) | 14 (0.3%) |
| Coal or Coke | 0 (0.0%) | 0 (0.0%) |
| All other Fuels | 30 (0.4%) | 11 (0.2%) |
| No Fuel Used | 13 (0.2%) | 29 (0.5%) |
| Total | 7,985 (100.0%) | 5,697 (100.0%) |
Household Vehicle Usage in University Place
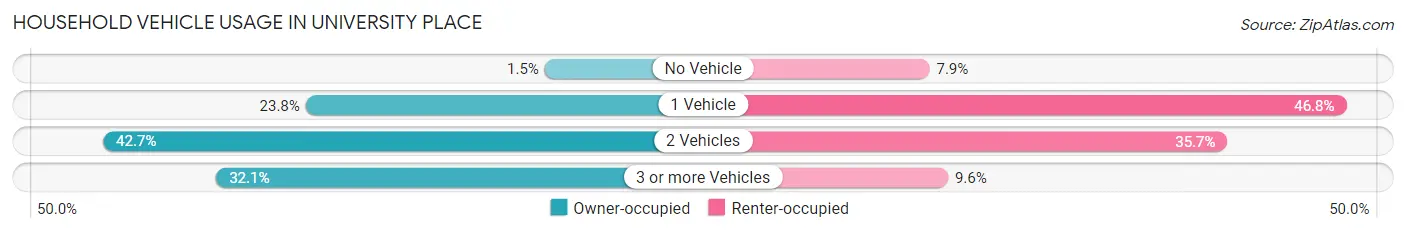
| Vehicles per Household | Owner-occupied | Renter-occupied |
| No Vehicle | 116 (1.5%) | 450 (7.9%) |
| 1 Vehicle | 1,898 (23.8%) | 2,666 (46.8%) |
| 2 Vehicles | 3,407 (42.7%) | 2,033 (35.7%) |
| 3 or more Vehicles | 2,564 (32.1%) | 548 (9.6%) |
| Total | 7,985 (100.0%) | 5,697 (100.0%) |
Real Estate & Mortgages in University Place
Real Estate and Mortgage Overview in University Place
| Characteristic | Without Mortgage | With Mortgage |
| Housing Units | 2,554 | 5,431 |
| Median Property Value | $482,700 | $527,700 |
| Median Household Income | $81,071 | $2,263 |
| Monthly Housing Costs | $898 | $1,654 |
| Real Estate Taxes | $5,837 | $49 |
Property Value by Mortgage Status in University Place
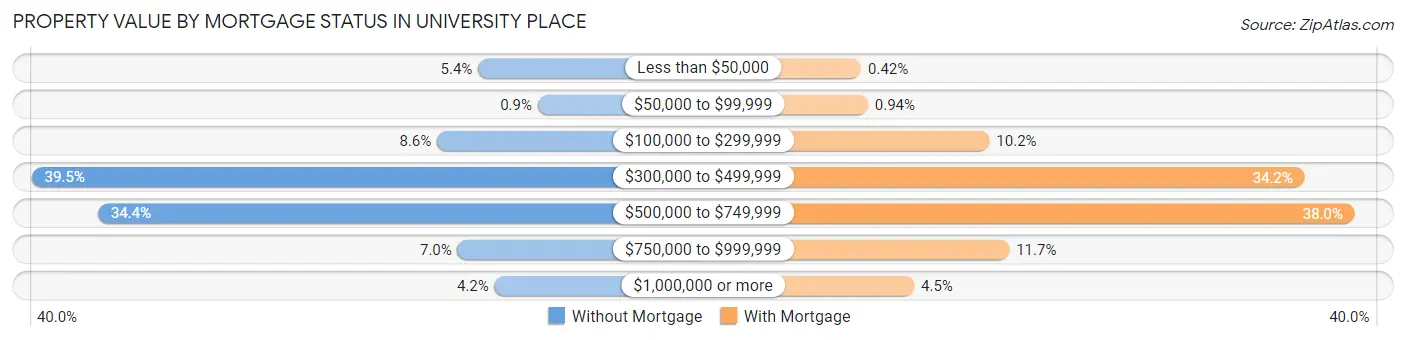
| Property Value | Without Mortgage | With Mortgage |
| Less than $50,000 | 139 (5.4%) | 23 (0.4%) |
| $50,000 to $99,999 | 23 (0.9%) | 51 (0.9%) |
| $100,000 to $299,999 | 219 (8.6%) | 554 (10.2%) |
| $300,000 to $499,999 | 1,008 (39.5%) | 1,859 (34.2%) |
| $500,000 to $749,999 | 879 (34.4%) | 2,066 (38.0%) |
| $750,000 to $999,999 | 179 (7.0%) | 636 (11.7%) |
| $1,000,000 or more | 107 (4.2%) | 242 (4.5%) |
| Total | 2,554 (100.0%) | 5,431 (100.0%) |
Household Income by Mortgage Status in University Place
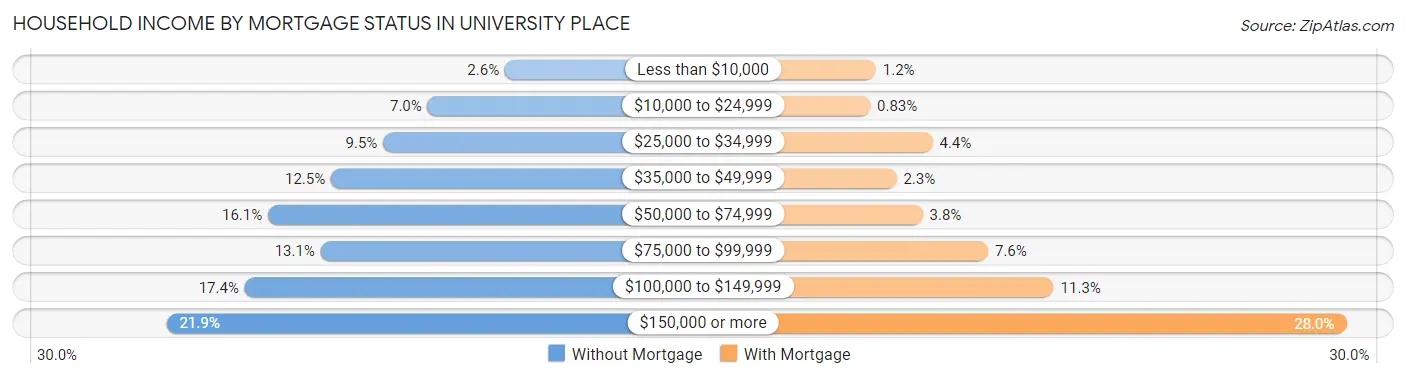
| Household Income | Without Mortgage | With Mortgage |
| Less than $10,000 | 65 (2.5%) | 63 (1.2%) |
| $10,000 to $24,999 | 178 (7.0%) | 45 (0.8%) |
| $25,000 to $34,999 | 243 (9.5%) | 239 (4.4%) |
| $35,000 to $49,999 | 319 (12.5%) | 127 (2.3%) |
| $50,000 to $74,999 | 411 (16.1%) | 208 (3.8%) |
| $75,000 to $99,999 | 334 (13.1%) | 411 (7.6%) |
| $100,000 to $149,999 | 445 (17.4%) | 615 (11.3%) |
| $150,000 or more | 559 (21.9%) | 1,523 (28.0%) |
| Total | 2,554 (100.0%) | 5,431 (100.0%) |
Property Value to Household Income Ratio in University Place
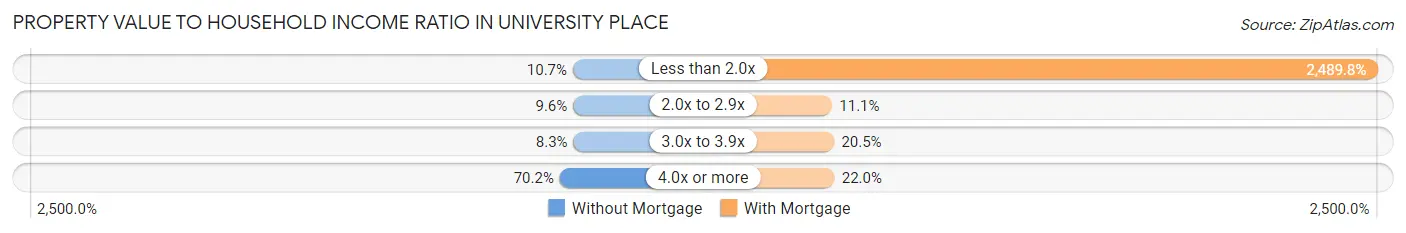
| Value-to-Income Ratio | Without Mortgage | With Mortgage |
| Less than 2.0x | 274 (10.7%) | 135,220 (2,489.8%) |
| 2.0x to 2.9x | 244 (9.6%) | 601 (11.1%) |
| 3.0x to 3.9x | 212 (8.3%) | 1,113 (20.5%) |
| 4.0x or more | 1,794 (70.2%) | 1,196 (22.0%) |
| Total | 2,554 (100.0%) | 5,431 (100.0%) |
Real Estate Taxes by Mortgage Status in University Place
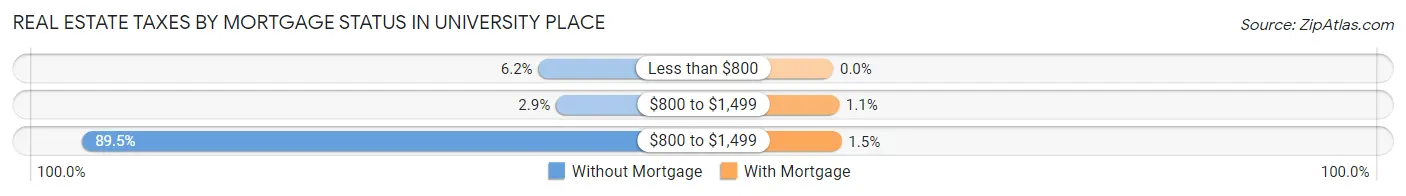
| Property Taxes | Without Mortgage | With Mortgage |
| Less than $800 | 157 (6.1%) | 0 (0.0%) |
| $800 to $1,499 | 75 (2.9%) | 58 (1.1%) |
| $800 to $1,499 | 2,285 (89.5%) | 83 (1.5%) |
| Total | 2,554 (100.0%) | 5,431 (100.0%) |
Health & Disability in University Place
Health Insurance Coverage by Age in University Place
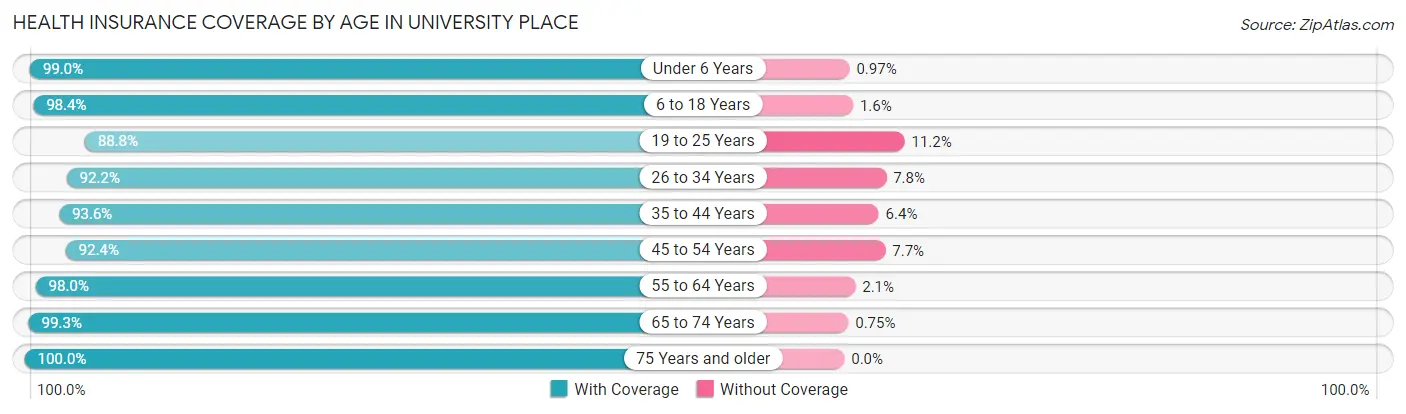
| Age Bracket | With Coverage | Without Coverage |
| Under 6 Years | 2,138 (99.0%) | 21 (1.0%) |
| 6 to 18 Years | 6,286 (98.4%) | 103 (1.6%) |
| 19 to 25 Years | 2,750 (88.8%) | 348 (11.2%) |
| 26 to 34 Years | 3,489 (92.2%) | 296 (7.8%) |
| 35 to 44 Years | 4,102 (93.6%) | 281 (6.4%) |
| 45 to 54 Years | 3,970 (92.3%) | 329 (7.6%) |
| 55 to 64 Years | 3,724 (98.0%) | 78 (2.1%) |
| 65 to 74 Years | 3,692 (99.3%) | 28 (0.7%) |
| 75 Years and older | 2,752 (100.0%) | 0 (0.0%) |
| Total | 32,903 (95.7%) | 1,484 (4.3%) |
Health Insurance Coverage by Citizenship Status in University Place
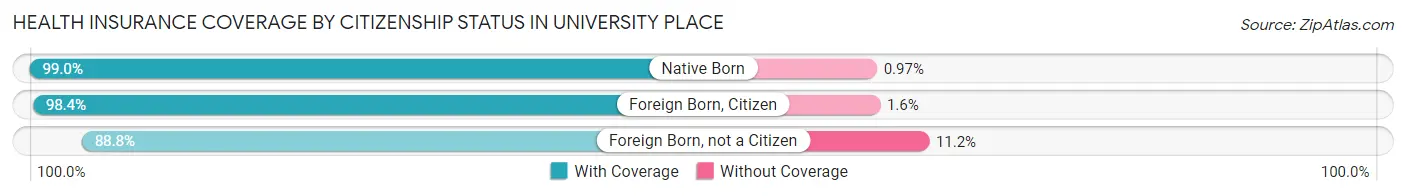
| Citizenship Status | With Coverage | Without Coverage |
| Native Born | 2,138 (99.0%) | 21 (1.0%) |
| Foreign Born, Citizen | 6,286 (98.4%) | 103 (1.6%) |
| Foreign Born, not a Citizen | 2,750 (88.8%) | 348 (11.2%) |
Health Insurance Coverage by Household Income in University Place
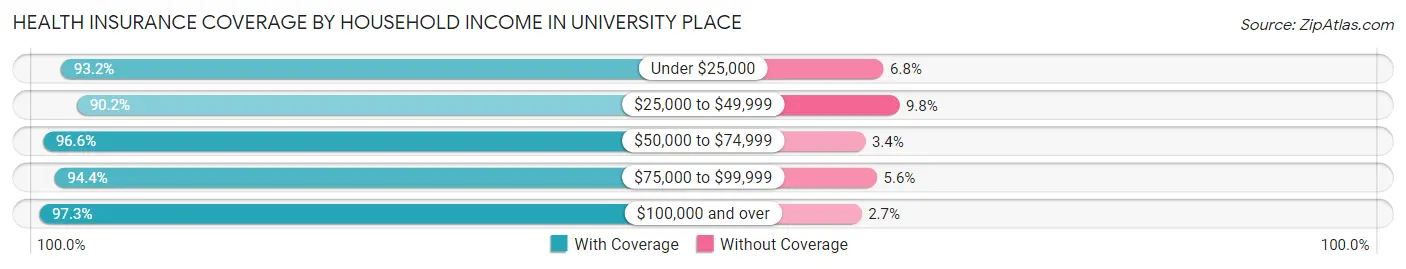
| Household Income | With Coverage | Without Coverage |
| Under $25,000 | 1,969 (93.2%) | 144 (6.8%) |
| $25,000 to $49,999 | 4,019 (90.2%) | 435 (9.8%) |
| $50,000 to $74,999 | 4,202 (96.6%) | 148 (3.4%) |
| $75,000 to $99,999 | 4,137 (94.4%) | 245 (5.6%) |
| $100,000 and over | 18,435 (97.3%) | 511 (2.7%) |
Public vs Private Health Insurance Coverage by Age in University Place
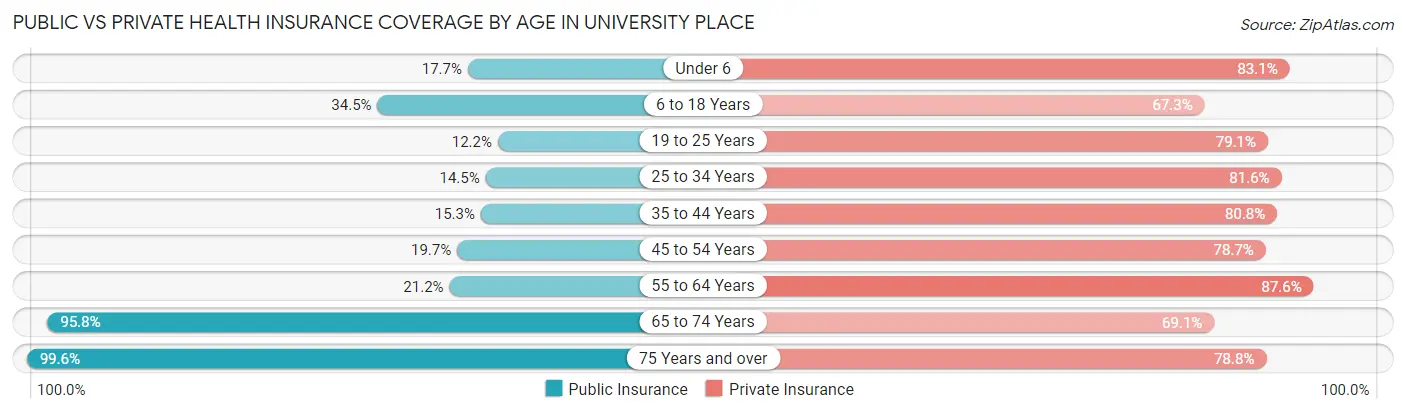
| Age Bracket | Public Insurance | Private Insurance |
| Under 6 | 383 (17.7%) | 1,794 (83.1%) |
| 6 to 18 Years | 2,205 (34.5%) | 4,301 (67.3%) |
| 19 to 25 Years | 377 (12.2%) | 2,450 (79.1%) |
| 25 to 34 Years | 547 (14.4%) | 3,088 (81.6%) |
| 35 to 44 Years | 672 (15.3%) | 3,541 (80.8%) |
| 45 to 54 Years | 848 (19.7%) | 3,382 (78.7%) |
| 55 to 64 Years | 804 (21.1%) | 3,329 (87.6%) |
| 65 to 74 Years | 3,563 (95.8%) | 2,571 (69.1%) |
| 75 Years and over | 2,741 (99.6%) | 2,168 (78.8%) |
| Total | 12,140 (35.3%) | 26,624 (77.4%) |
Disability Status by Sex by Age in University Place
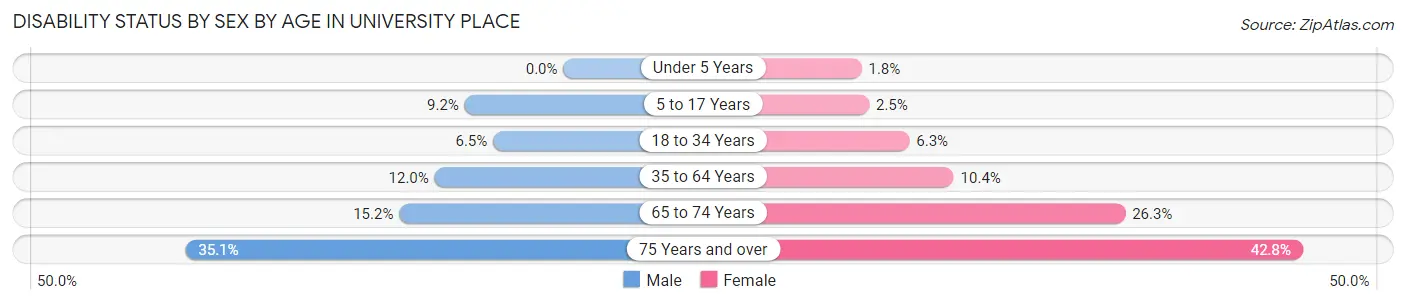
| Age Bracket | Male | Female |
| Under 5 Years | 0 (0.0%) | 17 (1.8%) |
| 5 to 17 Years | 290 (9.2%) | 80 (2.5%) |
| 18 to 34 Years | 242 (6.5%) | 223 (6.3%) |
| 35 to 64 Years | 718 (11.9%) | 672 (10.4%) |
| 65 to 74 Years | 280 (15.2%) | 495 (26.3%) |
| 75 Years and over | 348 (35.1%) | 753 (42.8%) |
Disability Class by Sex by Age in University Place
Disability Class: Hearing Difficulty
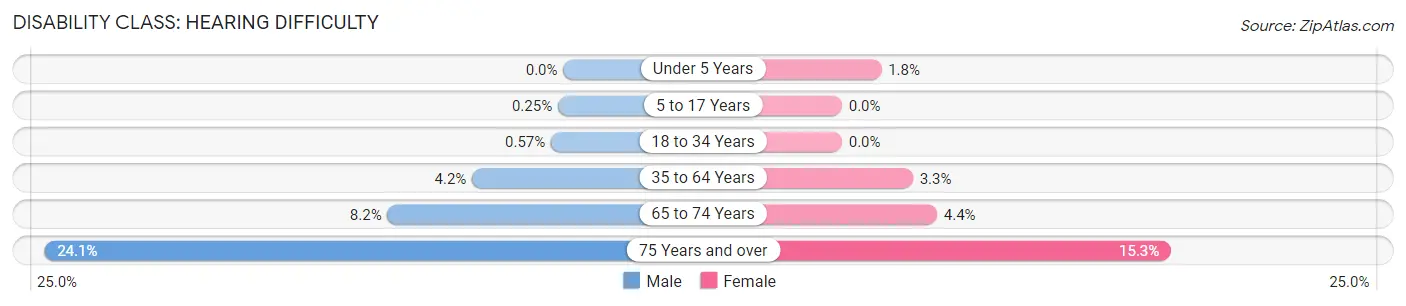
| Age Bracket | Male | Female |
| Under 5 Years | 0 (0.0%) | 17 (1.8%) |
| 5 to 17 Years | 8 (0.3%) | 0 (0.0%) |
| 18 to 34 Years | 21 (0.6%) | 0 (0.0%) |
| 35 to 64 Years | 254 (4.2%) | 213 (3.3%) |
| 65 to 74 Years | 150 (8.2%) | 83 (4.4%) |
| 75 Years and over | 239 (24.1%) | 269 (15.3%) |
Disability Class: Vision Difficulty
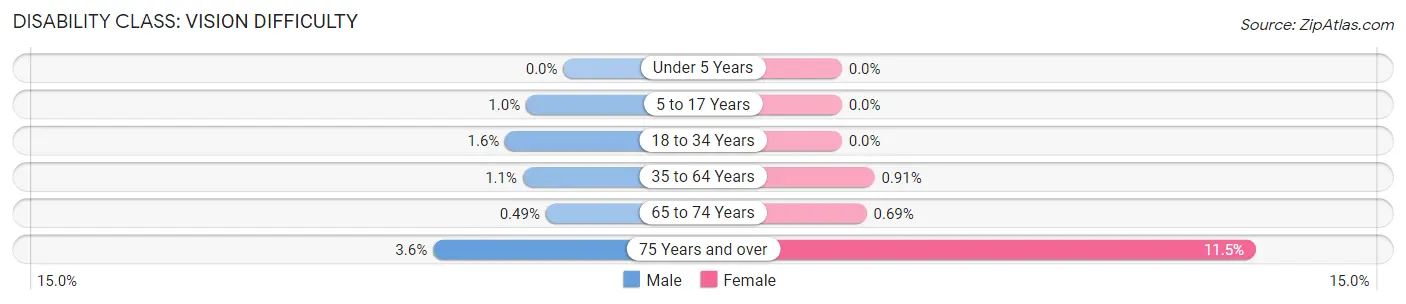
| Age Bracket | Male | Female |
| Under 5 Years | 0 (0.0%) | 0 (0.0%) |
| 5 to 17 Years | 33 (1.0%) | 0 (0.0%) |
| 18 to 34 Years | 60 (1.6%) | 0 (0.0%) |
| 35 to 64 Years | 68 (1.1%) | 59 (0.9%) |
| 65 to 74 Years | 9 (0.5%) | 13 (0.7%) |
| 75 Years and over | 36 (3.6%) | 203 (11.5%) |
Disability Class: Cognitive Difficulty
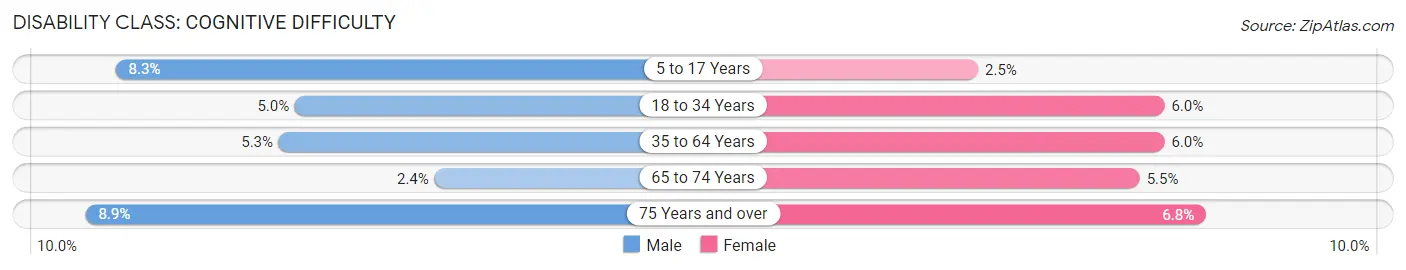
| Age Bracket | Male | Female |
| 5 to 17 Years | 263 (8.3%) | 80 (2.5%) |
| 18 to 34 Years | 185 (5.0%) | 213 (6.0%) |
| 35 to 64 Years | 317 (5.3%) | 388 (6.0%) |
| 65 to 74 Years | 44 (2.4%) | 104 (5.5%) |
| 75 Years and over | 88 (8.9%) | 119 (6.8%) |
Disability Class: Ambulatory Difficulty
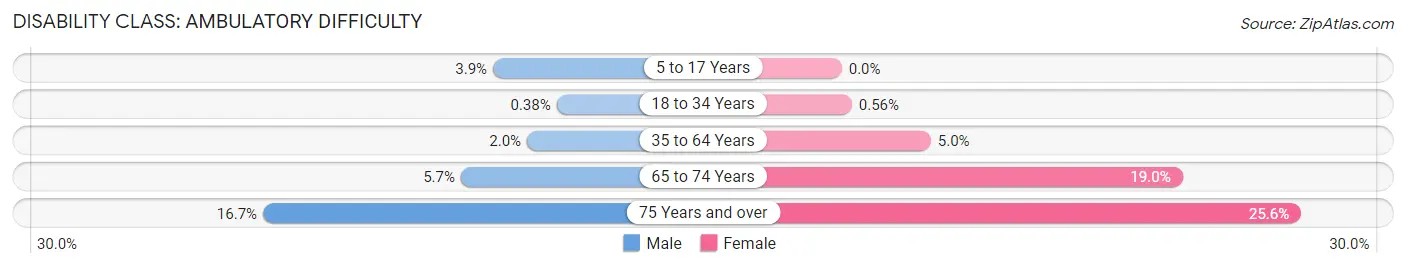
| Age Bracket | Male | Female |
| 5 to 17 Years | 124 (3.9%) | 0 (0.0%) |
| 18 to 34 Years | 14 (0.4%) | 20 (0.6%) |
| 35 to 64 Years | 122 (2.0%) | 321 (5.0%) |
| 65 to 74 Years | 105 (5.7%) | 357 (19.0%) |
| 75 Years and over | 166 (16.7%) | 450 (25.6%) |
Disability Class: Self-Care Difficulty
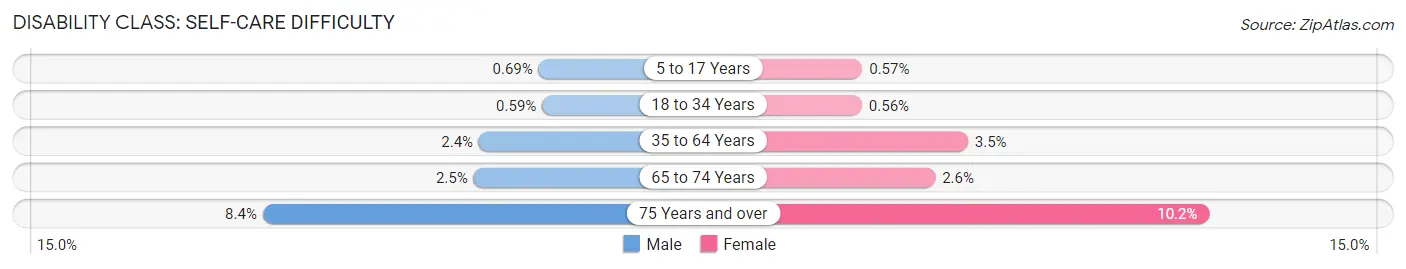
| Age Bracket | Male | Female |
| 5 to 17 Years | 22 (0.7%) | 18 (0.6%) |
| 18 to 34 Years | 22 (0.6%) | 20 (0.6%) |
| 35 to 64 Years | 141 (2.4%) | 227 (3.5%) |
| 65 to 74 Years | 46 (2.5%) | 49 (2.6%) |
| 75 Years and over | 83 (8.4%) | 180 (10.2%) |
Technology Access in University Place
Computing Device Access in University Place
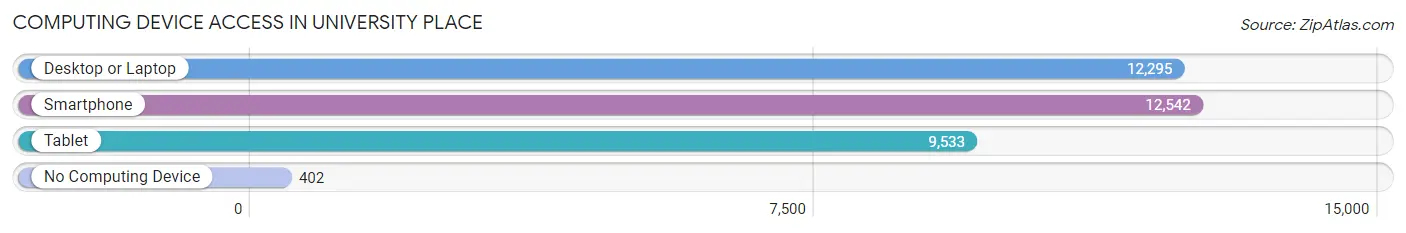
| Device Type | # Households | % Households |
| Desktop or Laptop | 12,295 | 89.9% |
| Smartphone | 12,542 | 91.7% |
| Tablet | 9,533 | 69.7% |
| No Computing Device | 402 | 2.9% |
| Total | 13,682 | 100.0% |
Internet Access in University Place
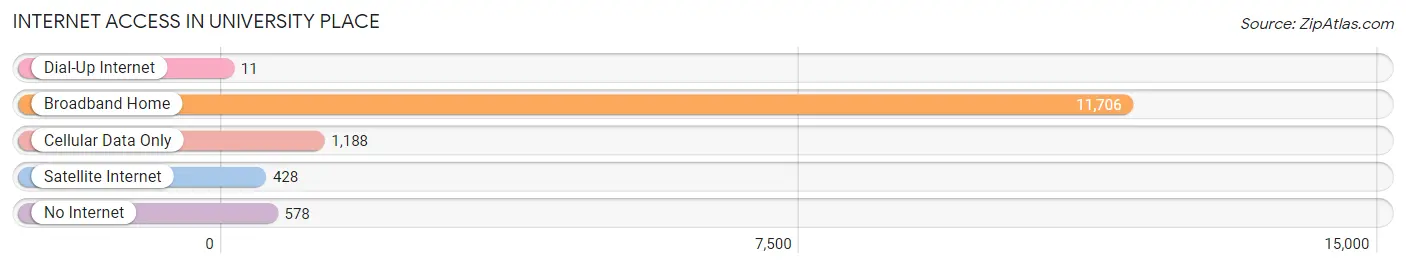
| Internet Type | # Households | % Households |
| Dial-Up Internet | 11 | 0.1% |
| Broadband Home | 11,706 | 85.6% |
| Cellular Data Only | 1,188 | 8.7% |
| Satellite Internet | 428 | 3.1% |
| No Internet | 578 | 4.2% |
| Total | 13,682 | 100.0% |
University Place Summary
History
University Place is a city located in Pierce County, Washington, United States. It is a suburb of Tacoma and is part of the Seattle metropolitan area. The city was incorporated on August 31, 1995, and had a population of 31,144 as of the 2010 census.
The area that is now University Place was originally inhabited by the Puyallup Tribe of Native Americans. The first European settlers arrived in the area in the 1850s, and the area was platted in 1883. The area was originally known as "University Place" due to its proximity to the University of Puget Sound, which was founded in 1888. The university was later moved to Tacoma in 1890, and the area was renamed "Chambers Bay" after the Chambers family, who had a large farm in the area.
In the early 1900s, the area began to develop as a residential suburb of Tacoma. The Chambers Bay Golf Course was built in the area in 1927, and the Chambers Bay Bridge was built in 1929. The bridge connected the area to Tacoma, and the area began to grow rapidly.
In the 1950s, the area was annexed by the City of Tacoma, and the name was changed back to University Place. The city was officially incorporated in 1995, and has since grown to become one of the largest cities in Pierce County.
Geography
University Place is located in western Washington, in Pierce County. It is situated on the Puget Sound, and is bordered by Tacoma to the north, Lakewood to the east, and Steilacoom to the south. The city covers an area of 8.3 square miles, and has a population of 31,144 as of the 2010 census.
The city is located on a plateau, with an elevation of approximately 500 feet. The city is surrounded by several bodies of water, including Chambers Bay, Puget Sound, and the Puyallup River. The city is also home to several parks, including Chambers Creek Regional Park, which is located on the shores of Chambers Bay.
Economy
University Place is a suburban city, and its economy is largely based on retail and services. The city is home to several large retail stores, including Target, Walmart, and Home Depot. The city is also home to several restaurants, including Red Robin, Olive Garden, and Applebee's.
The city is also home to several large employers, including MultiCare Health System, Tacoma Public Schools, and the University of Puget Sound. The city is also home to several medical centers, including St. Joseph Medical Center and Tacoma General Hospital.
Demographics
As of the 2010 census, University Place had a population of 31,144. The racial makeup of the city was 79.2% White, 8.3% Asian, 6.2% African American, 0.7% Native American, and 4.6% from other races. Hispanic or Latino of any race were 8.7% of the population.
The median household income in University Place was $63,945, and the median family income was $76,945. The per capita income was $30,945. About 8.2% of families and 10.7% of the population were below the poverty line, including 14.2% of those under age 18 and 6.2% of those age 65 or over.
Common Questions
What is Per Capita Income in University Place?
Per Capita income in University Place is $46,467.
What is the Median Family Income in University Place?
Median Family Income in University Place is $107,208.
What is the Median Household income in University Place?
Median Household Income in University Place is $89,658.
What is Income or Wage Gap in University Place?
Income or Wage Gap in University Place is 22.3%.
Women in University Place earn 77.7 cents for every dollar earned by a man.
What is Family Income Deficit in University Place?
Family Income Deficit in University Place is $8,282.
Families that are below poverty line in University Place earn $8,282 less on average than the poverty threshold level.
What is Inequality or Gini Index in University Place?
Inequality or Gini Index in University Place is 0.44.
What is the Total Population of University Place?
Total Population of University Place is 34,696.
What is the Total Male Population of University Place?
Total Male Population of University Place is 16,809.
What is the Total Female Population of University Place?
Total Female Population of University Place is 17,887.
What is the Ratio of Males per 100 Females in University Place?
There are 93.97 Males per 100 Females in University Place.
What is the Ratio of Females per 100 Males in University Place?
There are 106.41 Females per 100 Males in University Place.
What is the Median Population Age in University Place?
Median Population Age in University Place is 38.6 Years.
What is the Average Family Size in University Place
Average Family Size in University Place is 3.1 People.
What is the Average Household Size in University Place
Average Household Size in University Place is 2.5 People.
How Large is the Labor Force in University Place?
There are 17,408 People in the Labor Forcein in University Place.
What is the Percentage of People in the Labor Force in University Place?
63.4% of People are in the Labor Force in University Place.
What is the Unemployment Rate in University Place?
Unemployment Rate in University Place is 3.7%.