Lakeland North, WA Map & Demographics
Lakeland North Map
Lakeland North Overview
$43,577
PER CAPITA INCOME
$109,402
AVG FAMILY INCOME
$101,969
AVG HOUSEHOLD INCOME
36.1%
WAGE / INCOME GAP [ % ]
63.9¢/ $1
WAGE / INCOME GAP [ $ ]
$5,801
FAMILY INCOME DEFICIT
0.42
INEQUALITY / GINI INDEX
14,960
TOTAL POPULATION
7,051
MALE POPULATION
7,909
FEMALE POPULATION
89.15
MALES / 100 FEMALES
112.17
FEMALES / 100 MALES
41.5
MEDIAN AGE
3.5
AVG FAMILY SIZE
3.0
AVG HOUSEHOLD SIZE
7,754
LABOR FORCE [ PEOPLE ]
64.1%
PERCENT IN LABOR FORCE
5.1%
UNEMPLOYMENT RATE
Income in Lakeland North
Income Overview in Lakeland North
Per Capita Income in Lakeland North is $43,577, while median incomes of families and households are $109,402 and $101,969 respectively.
| Characteristic | Number | Measure |
| Per Capita Income | 14,960 | $43,577 |
| Median Family Income | 3,649 | $109,402 |
| Mean Family Income | 3,649 | $144,694 |
| Median Household Income | 4,921 | $101,969 |
| Mean Household Income | 4,921 | $129,765 |
| Income Deficit | 3,649 | $5,801 |
| Wage / Income Gap (%) | 14,960 | 36.13% |
| Wage / Income Gap ($) | 14,960 | 63.87¢ per $1 |
| Gini / Inequality Index | 14,960 | 0.42 |
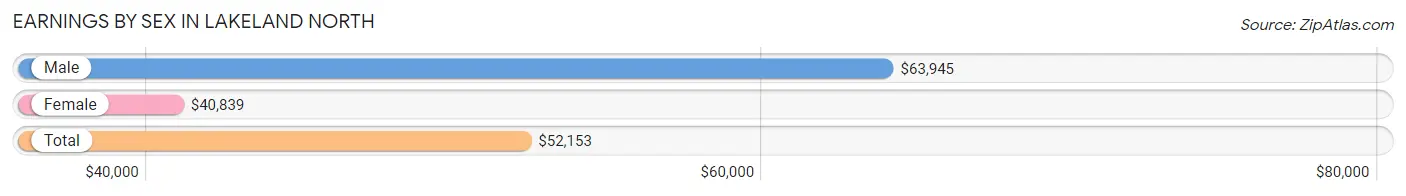
Earnings by Sex in Lakeland North
Average Earnings in Lakeland North are $52,153, $63,945 for men and $40,839 for women, a difference of 36.1%.
| Sex | Number | Average Earnings |
| Male | 3,852 (48.5%) | $63,945 |
| Female | 4,094 (51.5%) | $40,839 |
| Total | 7,946 (100.0%) | $52,153 |
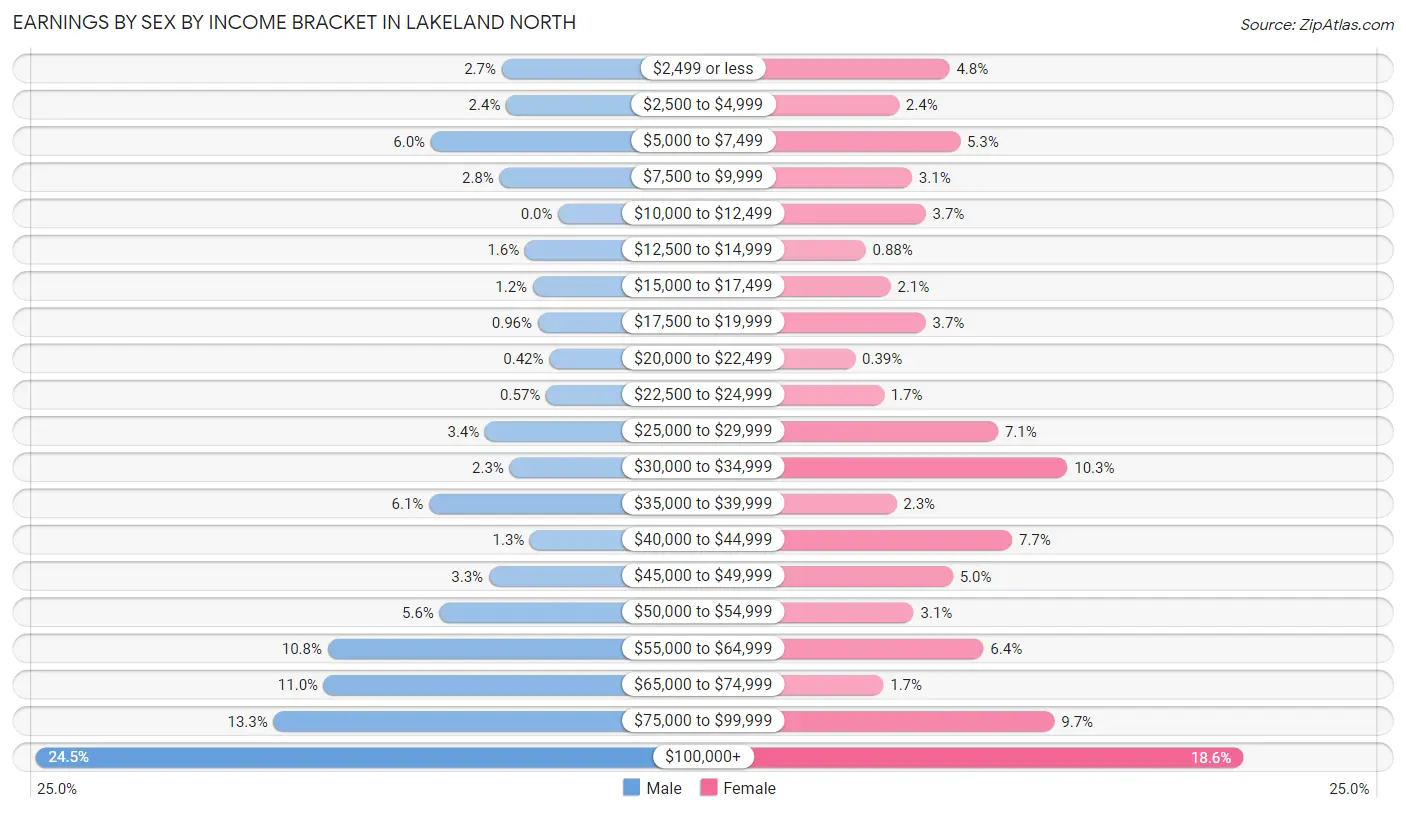
Earnings by Sex by Income Bracket in Lakeland North
The most common earnings brackets in Lakeland North are $100,000+ for men (943 | 24.5%) and $100,000+ for women (760 | 18.6%).
| Income | Male | Female |
| $2,499 or less | 102 (2.6%) | 197 (4.8%) |
| $2,500 to $4,999 | 94 (2.4%) | 100 (2.4%) |
| $5,000 to $7,499 | 230 (6.0%) | 217 (5.3%) |
| $7,500 to $9,999 | 106 (2.8%) | 125 (3.0%) |
| $10,000 to $12,499 | 0 (0.0%) | 151 (3.7%) |
| $12,500 to $14,999 | 60 (1.6%) | 36 (0.9%) |
| $15,000 to $17,499 | 46 (1.2%) | 84 (2.1%) |
| $17,500 to $19,999 | 37 (1.0%) | 151 (3.7%) |
| $20,000 to $22,499 | 16 (0.4%) | 16 (0.4%) |
| $22,500 to $24,999 | 22 (0.6%) | 71 (1.7%) |
| $25,000 to $29,999 | 132 (3.4%) | 290 (7.1%) |
| $30,000 to $34,999 | 88 (2.3%) | 423 (10.3%) |
| $35,000 to $39,999 | 233 (6.0%) | 95 (2.3%) |
| $40,000 to $44,999 | 51 (1.3%) | 317 (7.7%) |
| $45,000 to $49,999 | 125 (3.3%) | 203 (5.0%) |
| $50,000 to $54,999 | 214 (5.6%) | 128 (3.1%) |
| $55,000 to $64,999 | 416 (10.8%) | 262 (6.4%) |
| $65,000 to $74,999 | 423 (11.0%) | 70 (1.7%) |
| $75,000 to $99,999 | 514 (13.3%) | 398 (9.7%) |
| $100,000+ | 943 (24.5%) | 760 (18.6%) |
| Total | 3,852 (100.0%) | 4,094 (100.0%) |
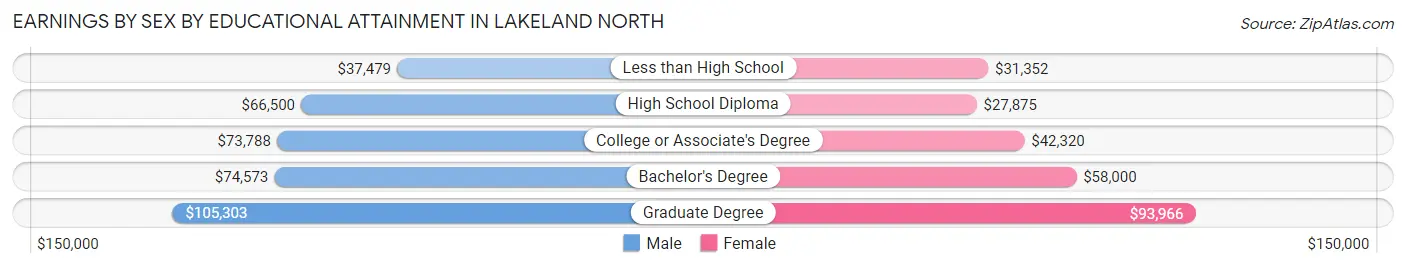
Earnings by Sex by Educational Attainment in Lakeland North
Average earnings in Lakeland North are $69,552 for men and $45,809 for women, a difference of 34.1%. Men with an educational attainment of graduate degree enjoy the highest average annual earnings of $105,303, while those with less than high school education earn the least with $37,479. Women with an educational attainment of graduate degree earn the most with the average annual earnings of $93,966, while those with high school diploma education have the smallest earnings of $27,875.
| Educational Attainment | Male Income | Female Income |
| Less than High School | $37,479 | $31,352 |
| High School Diploma | $66,500 | $27,875 |
| College or Associate's Degree | $73,788 | $42,320 |
| Bachelor's Degree | $74,573 | $58,000 |
| Graduate Degree | $105,303 | $93,966 |
| Total | $69,552 | $45,809 |
Family Income in Lakeland North
Family Income Brackets in Lakeland North
According to the Lakeland North family income data, there are 901 families falling into the $75,000 to $99,999 income range, which is the most common income bracket and makes up 24.7% of all families. Conversely, the less than $10,000 income bracket is the least frequent group with only 11 families (0.3%) belonging to this category.
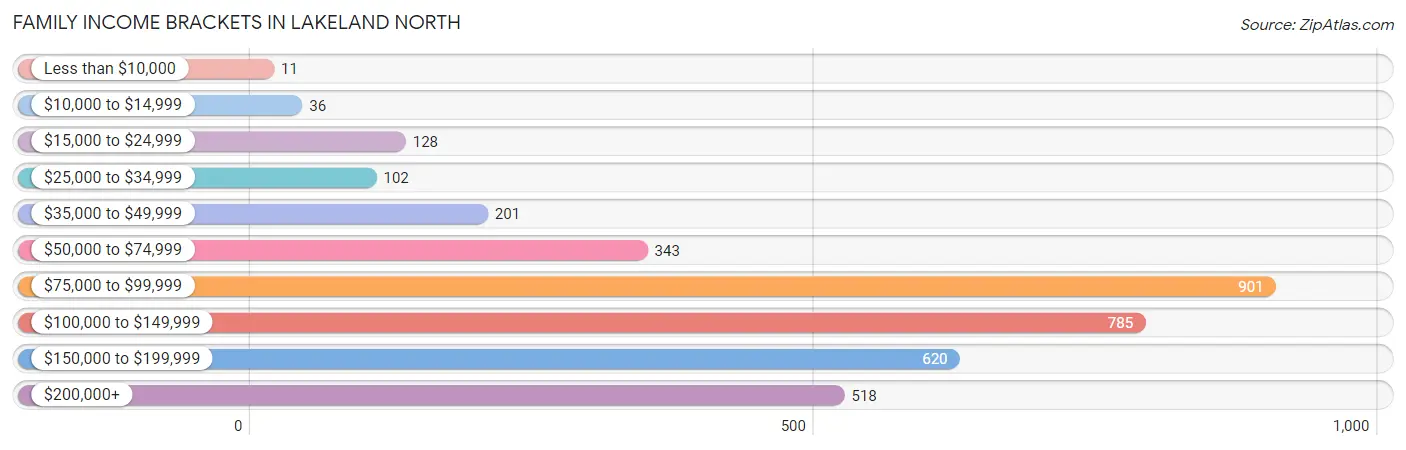
| Income Bracket | # Families | % Families |
| Less than $10,000 | 11 | 0.3% |
| $10,000 to $14,999 | 36 | 1.0% |
| $15,000 to $24,999 | 128 | 3.5% |
| $25,000 to $34,999 | 102 | 2.8% |
| $35,000 to $49,999 | 201 | 5.5% |
| $50,000 to $74,999 | 343 | 9.4% |
| $75,000 to $99,999 | 901 | 24.7% |
| $100,000 to $149,999 | 785 | 21.5% |
| $150,000 to $199,999 | 620 | 17.0% |
| $200,000+ | 518 | 14.2% |
Family Income by Famaliy Size in Lakeland North
4-person families (569 | 15.6%) account for the highest median family income in Lakeland North with $140,066 per family, while 2-person families (1,563 | 42.8%) have the highest median income of $50,271 per family member.
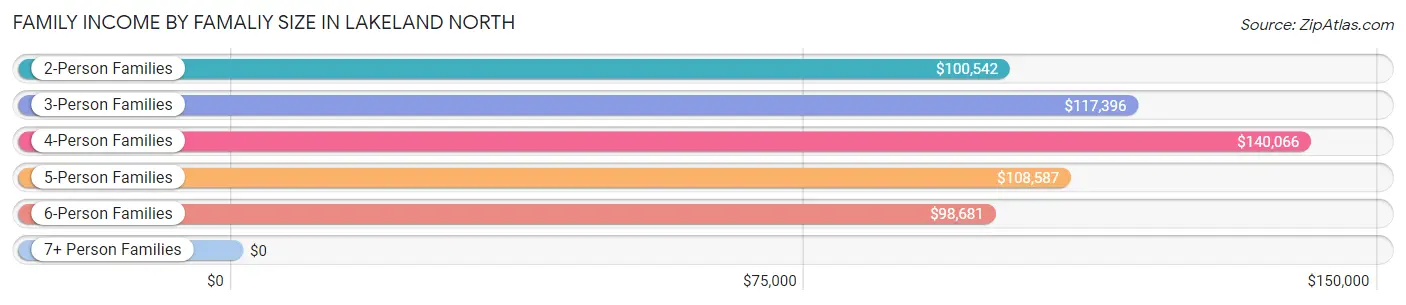
| Income Bracket | # Families | Median Income |
| 2-Person Families | 1,563 (42.8%) | $100,542 |
| 3-Person Families | 731 (20.0%) | $117,396 |
| 4-Person Families | 569 (15.6%) | $140,066 |
| 5-Person Families | 294 (8.1%) | $108,587 |
| 6-Person Families | 250 (6.9%) | $98,681 |
| 7+ Person Families | 242 (6.6%) | $0 |
| Total | 3,649 (100.0%) | $109,402 |
Family Income by Number of Earners in Lakeland North
The median family income in Lakeland North is $109,402, with families comprising 3+ earners (626) having the highest median family income of $178,636, while families with no earners (347) have the lowest median family income of $76,721, accounting for 17.2% and 9.5% of families, respectively.
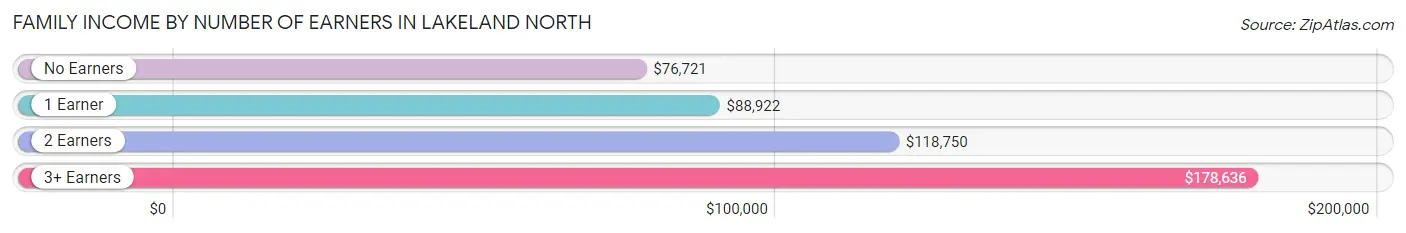
| Number of Earners | # Families | Median Income |
| No Earners | 347 (9.5%) | $76,721 |
| 1 Earner | 1,063 (29.1%) | $88,922 |
| 2 Earners | 1,613 (44.2%) | $118,750 |
| 3+ Earners | 626 (17.2%) | $178,636 |
| Total | 3,649 (100.0%) | $109,402 |
Household Income in Lakeland North
Household Income Brackets in Lakeland North
With 1,171 households falling in the category, the $100,000 to $149,999 income range is the most frequent in Lakeland North, accounting for 23.8% of all households. In contrast, only 64 households (1.3%) fall into the $10,000 to $14,999 income bracket, making it the least populous group.
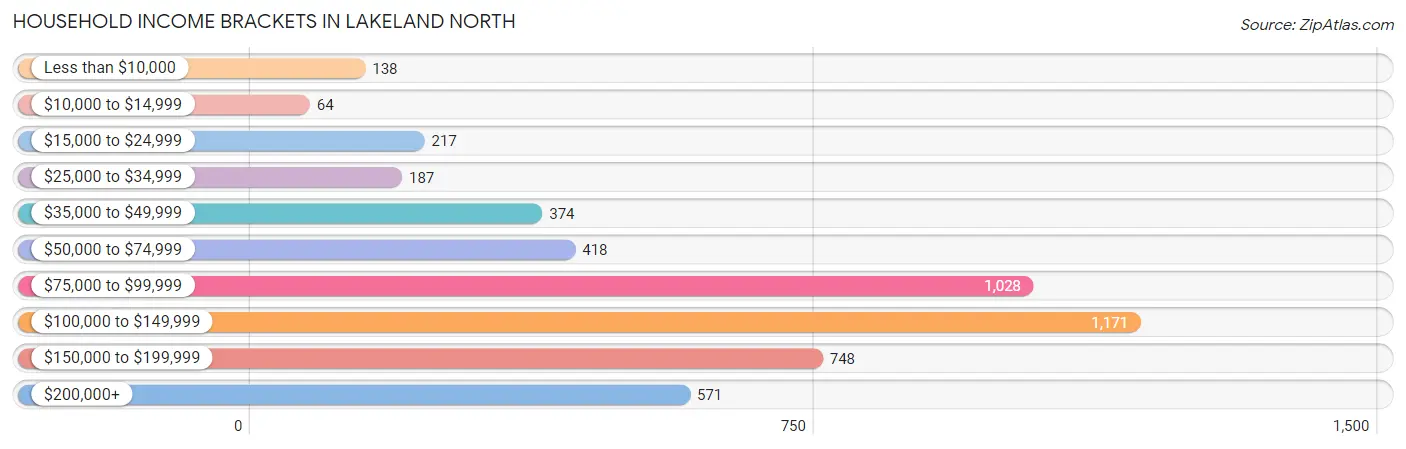
| Income Bracket | # Households | % Households |
| Less than $10,000 | 138 | 2.8% |
| $10,000 to $14,999 | 64 | 1.3% |
| $15,000 to $24,999 | 217 | 4.4% |
| $25,000 to $34,999 | 187 | 3.8% |
| $35,000 to $49,999 | 374 | 7.6% |
| $50,000 to $74,999 | 418 | 8.5% |
| $75,000 to $99,999 | 1,028 | 20.9% |
| $100,000 to $149,999 | 1,171 | 23.8% |
| $150,000 to $199,999 | 748 | 15.2% |
| $200,000+ | 571 | 11.6% |
Household Income by Householder Age in Lakeland North
The median household income in Lakeland North is $101,969, with the highest median household income of $112,886 found in the 25 to 44 years age bracket for the primary householder. A total of 1,472 households (29.9%) fall into this category. Meanwhile, the 15 to 24 years age bracket for the primary householder has the lowest median household income of $0, with 27 households (0.5%) in this group.
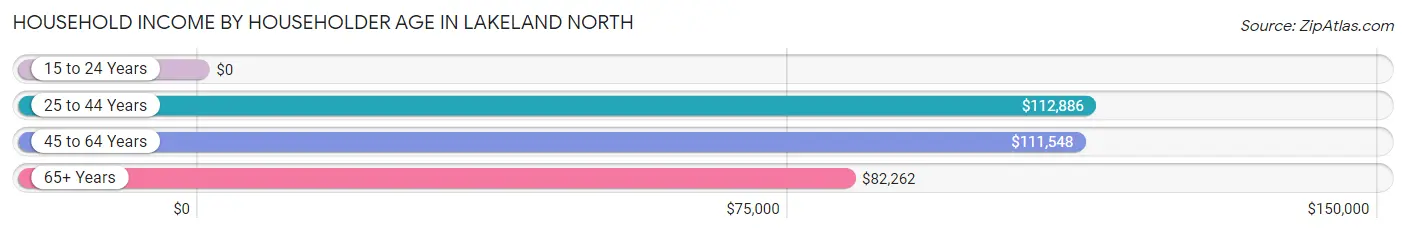
| Income Bracket | # Households | Median Income |
| 15 to 24 Years | 27 (0.5%) | $0 |
| 25 to 44 Years | 1,472 (29.9%) | $112,886 |
| 45 to 64 Years | 2,436 (49.5%) | $111,548 |
| 65+ Years | 986 (20.0%) | $82,262 |
| Total | 4,921 (100.0%) | $101,969 |
Poverty in Lakeland North
Income Below Poverty by Sex and Age in Lakeland North
With 9.2% poverty level for males and 9.0% for females among the residents of Lakeland North, 5 year old males and 5 year old females are the most vulnerable to poverty, with 13 males (24.5%) and 14 females (70.0%) in their respective age groups living below the poverty level.
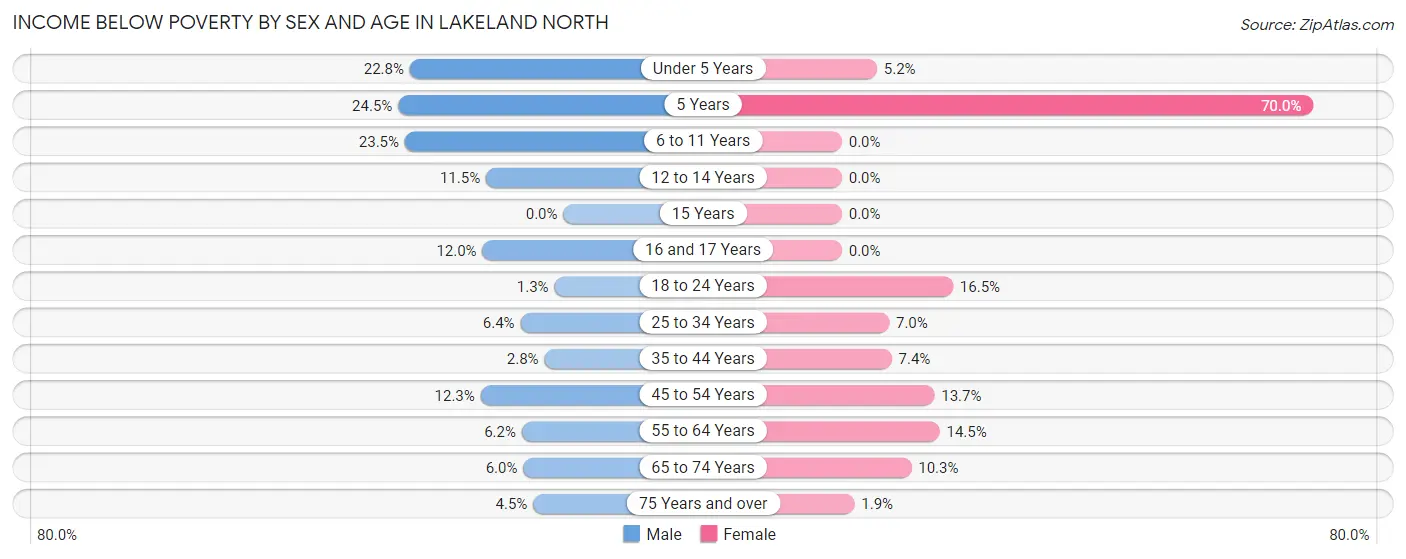
| Age Bracket | Male | Female |
| Under 5 Years | 75 (22.8%) | 15 (5.2%) |
| 5 Years | 13 (24.5%) | 14 (70.0%) |
| 6 to 11 Years | 116 (23.5%) | 0 (0.0%) |
| 12 to 14 Years | 68 (11.5%) | 0 (0.0%) |
| 15 Years | 0 (0.0%) | 0 (0.0%) |
| 16 and 17 Years | 49 (12.0%) | 0 (0.0%) |
| 18 to 24 Years | 5 (1.3%) | 129 (16.5%) |
| 25 to 34 Years | 50 (6.4%) | 62 (7.0%) |
| 35 to 44 Years | 23 (2.8%) | 68 (7.4%) |
| 45 to 54 Years | 138 (12.3%) | 166 (13.7%) |
| 55 to 64 Years | 60 (6.2%) | 170 (14.5%) |
| 65 to 74 Years | 39 (5.9%) | 78 (10.3%) |
| 75 Years and over | 15 (4.5%) | 11 (1.9%) |
| Total | 651 (9.2%) | 713 (9.0%) |
Income Above Poverty by Sex and Age in Lakeland North
According to the poverty statistics in Lakeland North, males aged 15 years and females aged 6 to 11 years are the age groups that are most secure financially, with 100.0% of males and 100.0% of females in these age groups living above the poverty line.
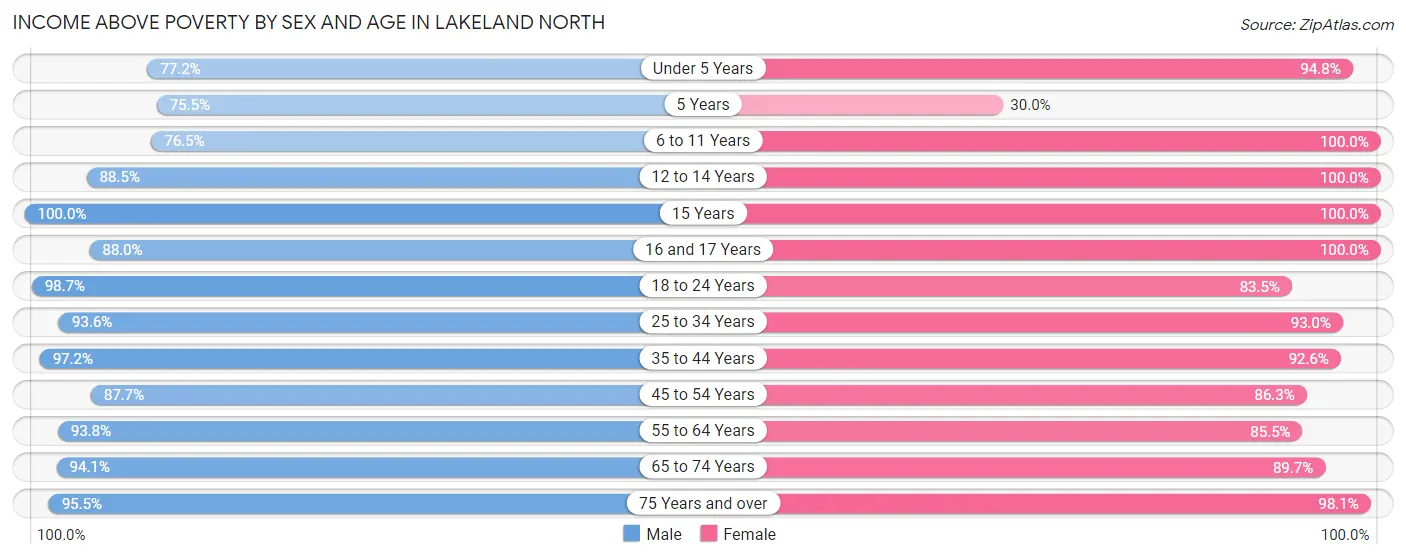
| Age Bracket | Male | Female |
| Under 5 Years | 254 (77.2%) | 273 (94.8%) |
| 5 Years | 40 (75.5%) | 6 (30.0%) |
| 6 to 11 Years | 377 (76.5%) | 693 (100.0%) |
| 12 to 14 Years | 524 (88.5%) | 171 (100.0%) |
| 15 Years | 97 (100.0%) | 88 (100.0%) |
| 16 and 17 Years | 359 (88.0%) | 309 (100.0%) |
| 18 to 24 Years | 373 (98.7%) | 653 (83.5%) |
| 25 to 34 Years | 735 (93.6%) | 822 (93.0%) |
| 35 to 44 Years | 796 (97.2%) | 851 (92.6%) |
| 45 to 54 Years | 985 (87.7%) | 1,042 (86.3%) |
| 55 to 64 Years | 913 (93.8%) | 1,002 (85.5%) |
| 65 to 74 Years | 617 (94.1%) | 678 (89.7%) |
| 75 Years and over | 320 (95.5%) | 578 (98.1%) |
| Total | 6,390 (90.7%) | 7,166 (90.9%) |
Income Below Poverty Among Married-Couple Families in Lakeland North
The poverty statistics for married-couple families in Lakeland North show that 3.6% or 105 of the total 2,933 families live below the poverty line. Families with 5 or more children have the highest poverty rate of 33.3%, comprising of 14 families. On the other hand, families with 1 or 2 children have the lowest poverty rate of 1.9%, which includes 15 families.
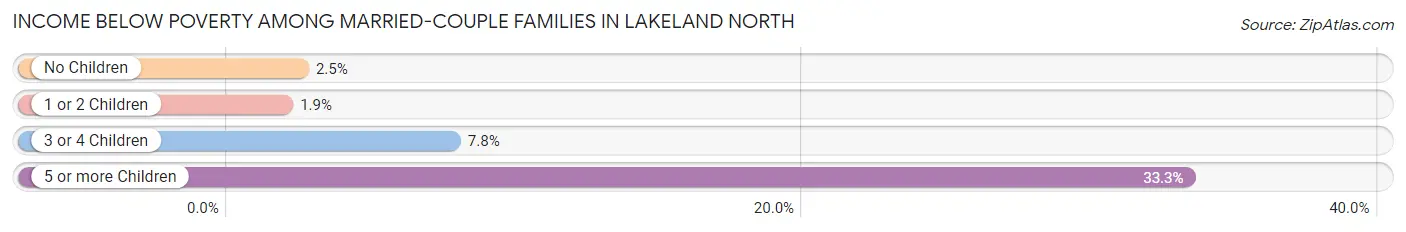
| Children | Above Poverty | Below Poverty |
| No Children | 1,618 (97.5%) | 41 (2.5%) |
| 1 or 2 Children | 766 (98.1%) | 15 (1.9%) |
| 3 or 4 Children | 416 (92.2%) | 35 (7.8%) |
| 5 or more Children | 28 (66.7%) | 14 (33.3%) |
| Total | 2,828 (96.4%) | 105 (3.6%) |
Income Below Poverty Among Single-Parent Households in Lakeland North
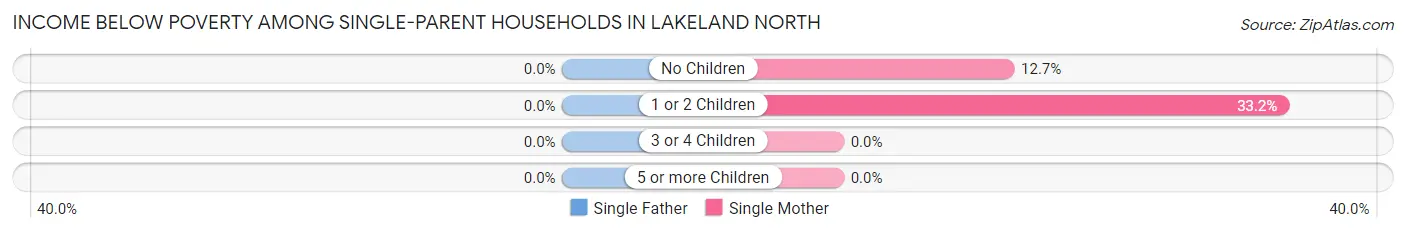
| Children | Single Father | Single Mother |
| No Children | 0 (0.0%) | 32 (12.7%) |
| 1 or 2 Children | 0 (0.0%) | 77 (33.2%) |
| 3 or 4 Children | 0 (0.0%) | 0 (0.0%) |
| 5 or more Children | 0 (0.0%) | 0 (0.0%) |
| Total | 0 (0.0%) | 109 (20.8%) |
Income Below Poverty Among Married-Couple vs Single-Parent Households in Lakeland North
The poverty data for Lakeland North shows that 105 of the married-couple family households (3.6%) and 109 of the single-parent households (15.2%) are living below the poverty level. Within the married-couple family households, those with 5 or more children have the highest poverty rate, with 14 households (33.3%) falling below the poverty line. Among the single-parent households, those with 1 or 2 children have the highest poverty rate, with 77 household (27.8%) living below poverty.
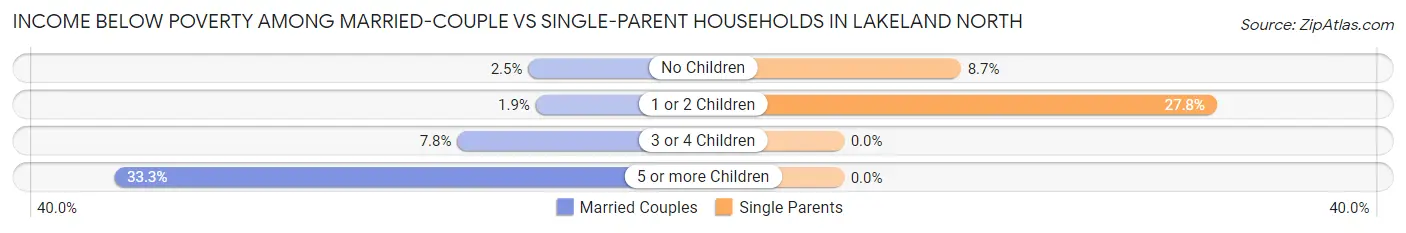
| Children | Married-Couple Families | Single-Parent Households |
| No Children | 41 (2.5%) | 32 (8.7%) |
| 1 or 2 Children | 15 (1.9%) | 77 (27.8%) |
| 3 or 4 Children | 35 (7.8%) | 0 (0.0%) |
| 5 or more Children | 14 (33.3%) | 0 (0.0%) |
| Total | 105 (3.6%) | 109 (15.2%) |
Race in Lakeland North
The most populous races in Lakeland North are White / Caucasian (7,901 | 52.8%), Asian (2,642 | 17.7%), and Hispanic or Latino (2,161 | 14.4%).
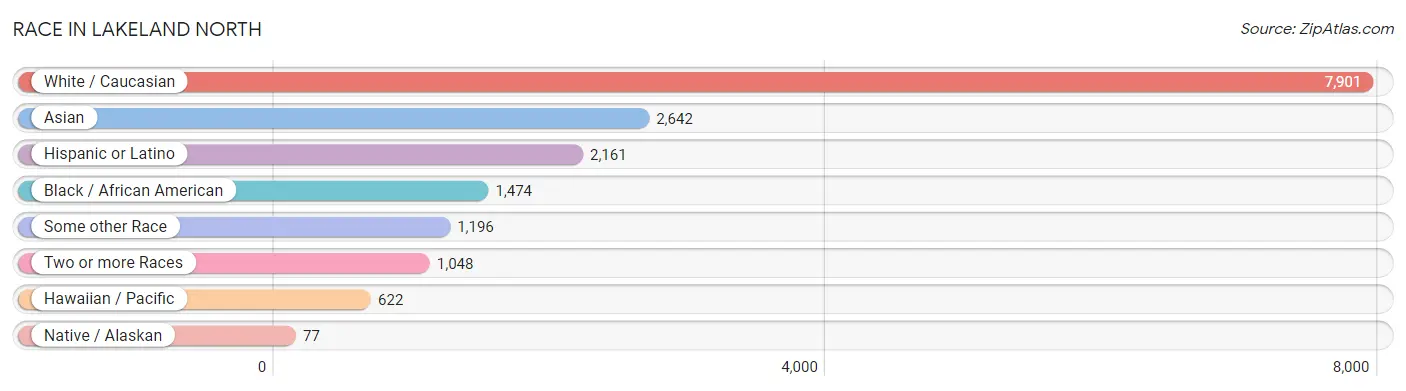
| Race | # Population | % Population |
| Asian | 2,642 | 17.7% |
| Black / African American | 1,474 | 9.9% |
| Hawaiian / Pacific | 622 | 4.2% |
| Hispanic or Latino | 2,161 | 14.4% |
| Native / Alaskan | 77 | 0.5% |
| White / Caucasian | 7,901 | 52.8% |
| Two or more Races | 1,048 | 7.0% |
| Some other Race | 1,196 | 8.0% |
| Total | 14,960 | 100.0% |
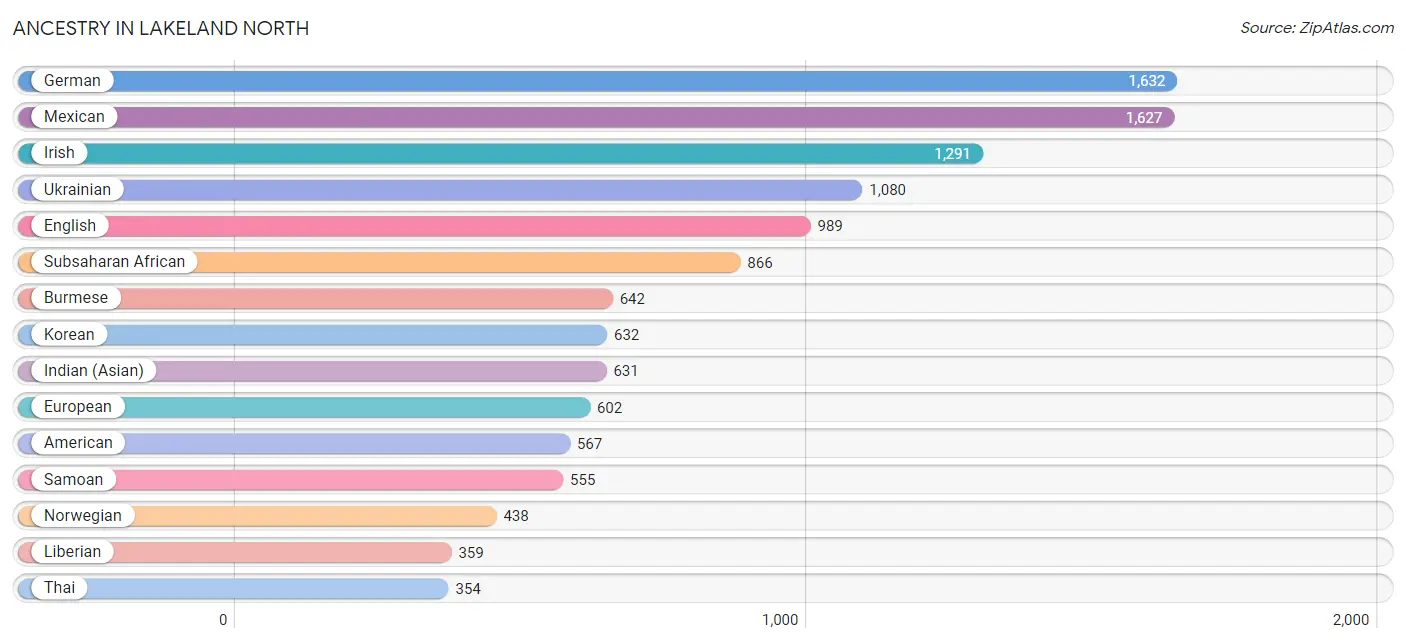
Ancestry in Lakeland North
The most populous ancestries reported in Lakeland North are German (1,632 | 10.9%), Mexican (1,627 | 10.9%), Irish (1,291 | 8.6%), Ukrainian (1,080 | 7.2%), and English (989 | 6.6%), together accounting for 44.2% of all Lakeland North residents.
| Ancestry | # Population | % Population |
| African | 36 | 0.2% |
| Alaska Native | 37 | 0.3% |
| American | 567 | 3.8% |
| Apache | 2 | 0.0% |
| Arab | 32 | 0.2% |
| Armenian | 32 | 0.2% |
| Austrian | 12 | 0.1% |
| Belgian | 23 | 0.2% |
| Bhutanese | 95 | 0.6% |
| British | 56 | 0.4% |
| Bulgarian | 49 | 0.3% |
| Burmese | 642 | 4.3% |
| Canadian | 8 | 0.1% |
| Central American | 228 | 1.5% |
| Central American Indian | 6 | 0.0% |
| Cherokee | 123 | 0.8% |
| Croatian | 23 | 0.2% |
| Czech | 62 | 0.4% |
| Danish | 98 | 0.7% |
| Delaware | 14 | 0.1% |
| Dutch | 83 | 0.5% |
| Eastern European | 50 | 0.3% |
| English | 989 | 6.6% |
| Ethiopian | 85 | 0.6% |
| European | 602 | 4.0% |
| Finnish | 105 | 0.7% |
| French | 95 | 0.6% |
| French Canadian | 195 | 1.3% |
| German | 1,632 | 10.9% |
| Greek | 115 | 0.8% |
| Guatemalan | 197 | 1.3% |
| Hungarian | 9 | 0.1% |
| Icelander | 12 | 0.1% |
| Indian (Asian) | 631 | 4.2% |
| Irish | 1,291 | 8.6% |
| Italian | 281 | 1.9% |
| Japanese | 112 | 0.7% |
| Kenyan | 162 | 1.1% |
| Korean | 632 | 4.2% |
| Liberian | 359 | 2.4% |
| Mexican | 1,627 | 10.9% |
| Mexican American Indian | 6 | 0.0% |
| Moroccan | 28 | 0.2% |
| Native Hawaiian | 93 | 0.6% |
| Nepalese | 38 | 0.3% |
| Nigerian | 40 | 0.3% |
| Northern European | 10 | 0.1% |
| Norwegian | 438 | 2.9% |
| Polish | 312 | 2.1% |
| Portuguese | 22 | 0.2% |
| Puerto Rican | 49 | 0.3% |
| Puget Sound Salish | 23 | 0.2% |
| Romanian | 60 | 0.4% |
| Russian | 293 | 2.0% |
| Salvadoran | 31 | 0.2% |
| Samoan | 555 | 3.7% |
| Scandinavian | 40 | 0.3% |
| Scotch-Irish | 245 | 1.6% |
| Scottish | 154 | 1.0% |
| Sioux | 26 | 0.2% |
| Slovak | 22 | 0.2% |
| Somali | 184 | 1.2% |
| Spanish | 245 | 1.6% |
| Sri Lankan | 332 | 2.2% |
| Subsaharan African | 866 | 5.8% |
| Swedish | 133 | 0.9% |
| Swiss | 44 | 0.3% |
| Thai | 354 | 2.4% |
| Tongan | 1 | 0.0% |
| Tsimshian | 58 | 0.4% |
| Ukrainian | 1,080 | 7.2% |
| Welsh | 345 | 2.3% | View All 72 Rows |
Immigrants in Lakeland North
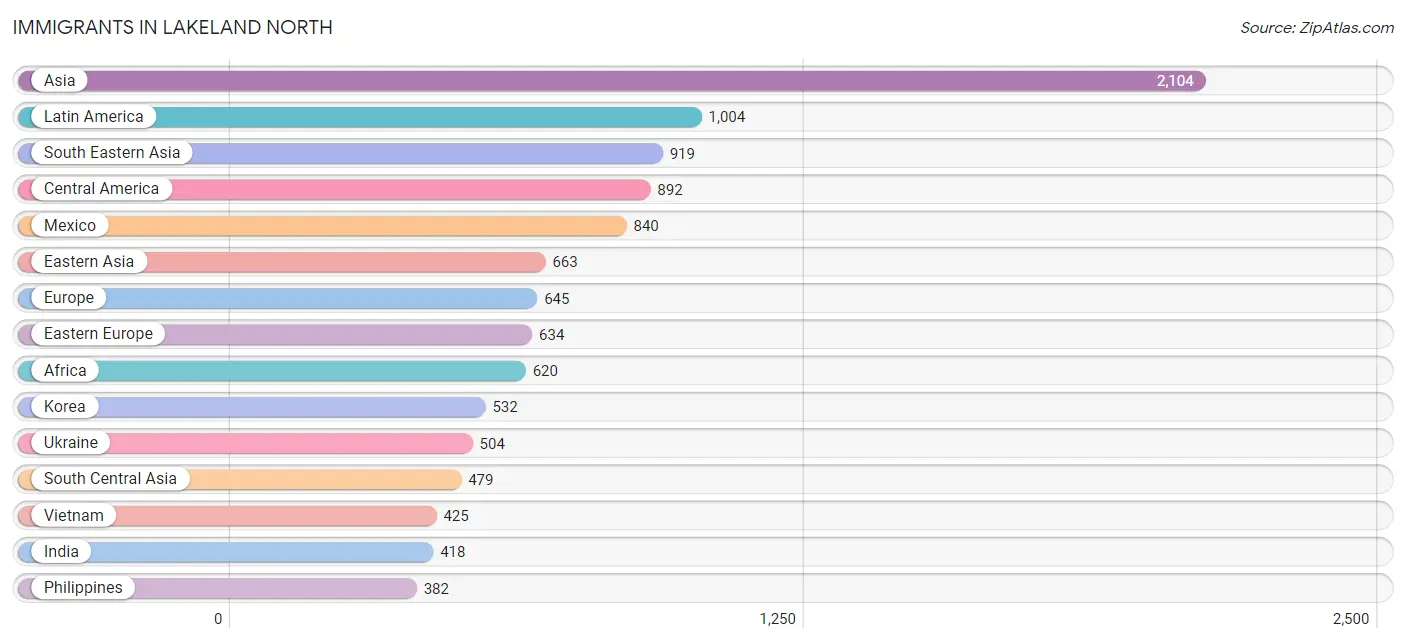
The most numerous immigrant groups reported in Lakeland North came from Asia (2,104 | 14.1%), Latin America (1,004 | 6.7%), South Eastern Asia (919 | 6.1%), Central America (892 | 6.0%), and Mexico (840 | 5.6%), together accounting for 38.5% of all Lakeland North residents.
| Immigration Origin | # Population | % Population |
| Africa | 620 | 4.1% |
| Asia | 2,104 | 14.1% |
| Brazil | 112 | 0.7% |
| Bulgaria | 19 | 0.1% |
| Cambodia | 112 | 0.7% |
| Canada | 39 | 0.3% |
| Central America | 892 | 6.0% |
| China | 117 | 0.8% |
| Eastern Africa | 357 | 2.4% |
| Eastern Asia | 663 | 4.4% |
| Eastern Europe | 634 | 4.2% |
| El Salvador | 6 | 0.0% |
| Ethiopia | 51 | 0.3% |
| Europe | 645 | 4.3% |
| Ghana | 169 | 1.1% |
| Guatemala | 46 | 0.3% |
| Hong Kong | 17 | 0.1% |
| India | 418 | 2.8% |
| Italy | 11 | 0.1% |
| Japan | 14 | 0.1% |
| Kazakhstan | 20 | 0.1% |
| Kenya | 195 | 1.3% |
| Korea | 532 | 3.6% |
| Latin America | 1,004 | 6.7% |
| Latvia | 8 | 0.1% |
| Liberia | 94 | 0.6% |
| Mexico | 840 | 5.6% |
| Moldova | 49 | 0.3% |
| Oceania | 91 | 0.6% |
| Pakistan | 41 | 0.3% |
| Philippines | 382 | 2.5% |
| Poland | 46 | 0.3% |
| Romania | 8 | 0.1% |
| Somalia | 111 | 0.7% |
| South America | 112 | 0.7% |
| South Central Asia | 479 | 3.2% |
| South Eastern Asia | 919 | 6.1% |
| Southern Europe | 11 | 0.1% |
| Ukraine | 504 | 3.4% |
| Vietnam | 425 | 2.8% |
| Western Africa | 263 | 1.8% |
| Western Asia | 32 | 0.2% | View All 42 Rows |
Sex and Age in Lakeland North
Sex and Age in Lakeland North
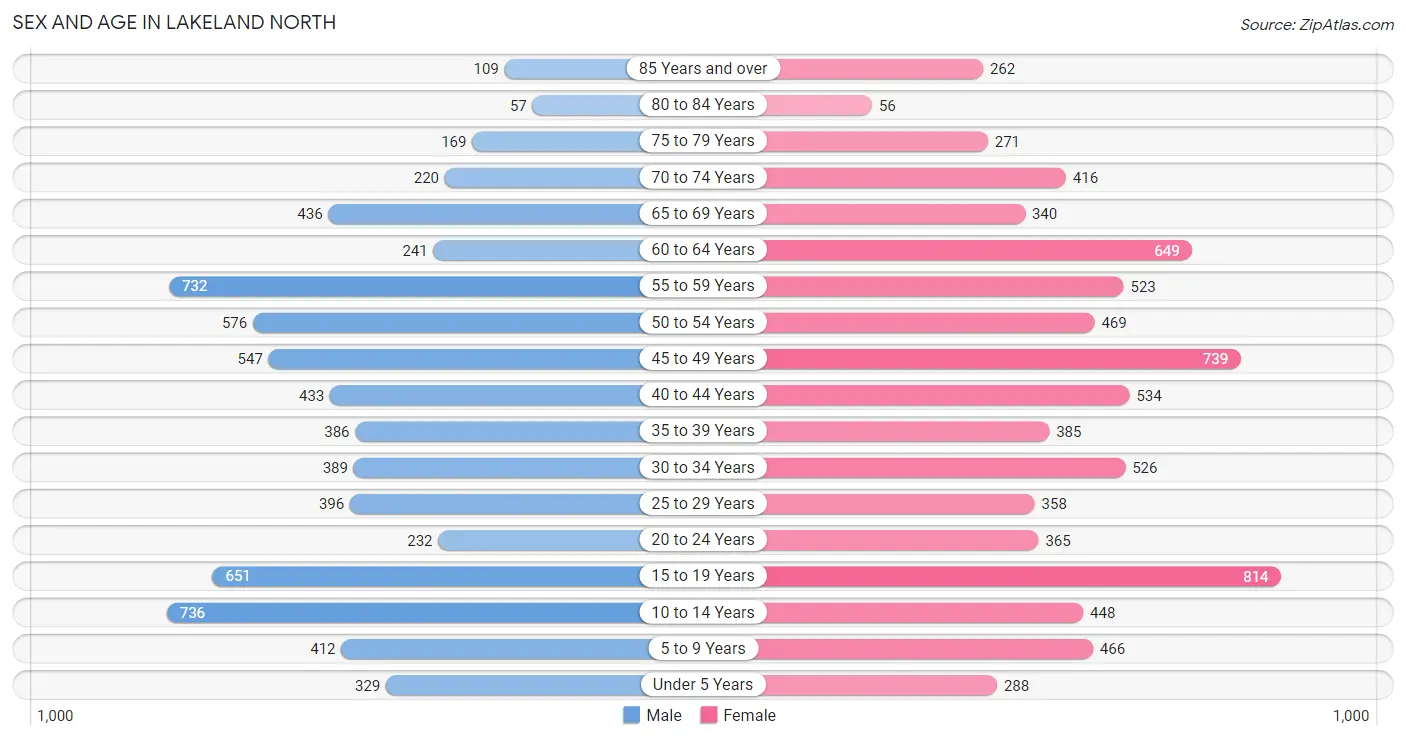
The most populous age groups in Lakeland North are 10 to 14 Years (736 | 10.4%) for men and 15 to 19 Years (814 | 10.3%) for women.
| Age Bracket | Male | Female |
| Under 5 Years | 329 (4.7%) | 288 (3.6%) |
| 5 to 9 Years | 412 (5.8%) | 466 (5.9%) |
| 10 to 14 Years | 736 (10.4%) | 448 (5.7%) |
| 15 to 19 Years | 651 (9.2%) | 814 (10.3%) |
| 20 to 24 Years | 232 (3.3%) | 365 (4.6%) |
| 25 to 29 Years | 396 (5.6%) | 358 (4.5%) |
| 30 to 34 Years | 389 (5.5%) | 526 (6.7%) |
| 35 to 39 Years | 386 (5.5%) | 385 (4.9%) |
| 40 to 44 Years | 433 (6.1%) | 534 (6.8%) |
| 45 to 49 Years | 547 (7.8%) | 739 (9.3%) |
| 50 to 54 Years | 576 (8.2%) | 469 (5.9%) |
| 55 to 59 Years | 732 (10.4%) | 523 (6.6%) |
| 60 to 64 Years | 241 (3.4%) | 649 (8.2%) |
| 65 to 69 Years | 436 (6.2%) | 340 (4.3%) |
| 70 to 74 Years | 220 (3.1%) | 416 (5.3%) |
| 75 to 79 Years | 169 (2.4%) | 271 (3.4%) |
| 80 to 84 Years | 57 (0.8%) | 56 (0.7%) |
| 85 Years and over | 109 (1.5%) | 262 (3.3%) |
| Total | 7,051 (100.0%) | 7,909 (100.0%) |
Families and Households in Lakeland North
Median Family Size in Lakeland North
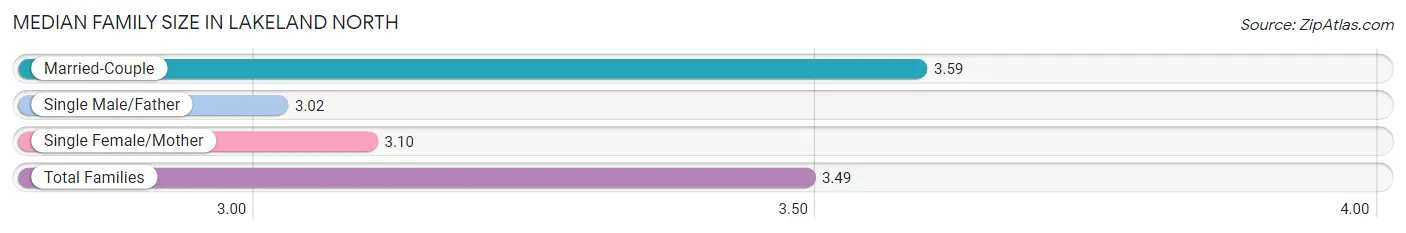
The median family size in Lakeland North is 3.49 persons per family, with married-couple families (2,933 | 80.4%) accounting for the largest median family size of 3.59 persons per family. On the other hand, single male/father families (191 | 5.2%) represent the smallest median family size with 3.02 persons per family.
| Family Type | # Families | Family Size |
| Married-Couple | 2,933 (80.4%) | 3.59 |
| Single Male/Father | 191 (5.2%) | 3.02 |
| Single Female/Mother | 525 (14.4%) | 3.10 |
| Total Families | 3,649 (100.0%) | 3.49 |
Median Household Size in Lakeland North
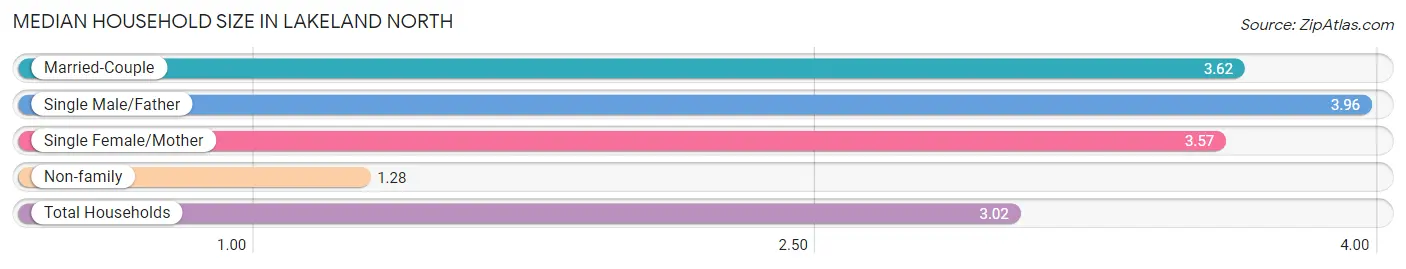
The median household size in Lakeland North is 3.02 persons per household, with single male/father households (191 | 3.9%) accounting for the largest median household size of 3.96 persons per household. non-family households (1,272 | 25.9%) represent the smallest median household size with 1.28 persons per household.
| Household Type | # Households | Household Size |
| Married-Couple | 2,933 (59.6%) | 3.62 |
| Single Male/Father | 191 (3.9%) | 3.96 |
| Single Female/Mother | 525 (10.7%) | 3.57 |
| Non-family | 1,272 (25.9%) | 1.28 |
| Total Households | 4,921 (100.0%) | 3.02 |
Household Size by Marriage Status in Lakeland North
Out of a total of 4,921 households in Lakeland North, 3,649 (74.2%) are family households, while 1,272 (25.9%) are nonfamily households. The most numerous type of family households are 2-person households, comprising 1,443, and the most common type of nonfamily households are 1-person households, comprising 1,067.
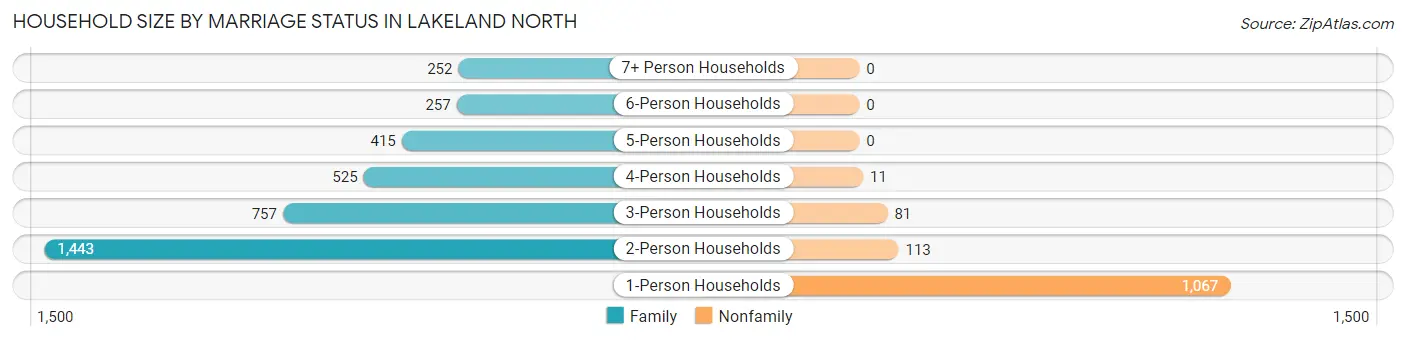
| Household Size | Family Households | Nonfamily Households |
| 1-Person Households | - | 1,067 (21.7%) |
| 2-Person Households | 1,443 (29.3%) | 113 (2.3%) |
| 3-Person Households | 757 (15.4%) | 81 (1.7%) |
| 4-Person Households | 525 (10.7%) | 11 (0.2%) |
| 5-Person Households | 415 (8.4%) | 0 (0.0%) |
| 6-Person Households | 257 (5.2%) | 0 (0.0%) |
| 7+ Person Households | 252 (5.1%) | 0 (0.0%) |
| Total | 3,649 (74.2%) | 1,272 (25.9%) |
Female Fertility in Lakeland North
Fertility by Age in Lakeland North
Average fertility rate in Lakeland North is 34.0 births per 1,000 women. Women in the age bracket of 20 to 34 years have the highest fertility rate with 87.0 births per 1,000 women. Women in the age bracket of 20 to 34 years acount for 84.5% of all women with births.
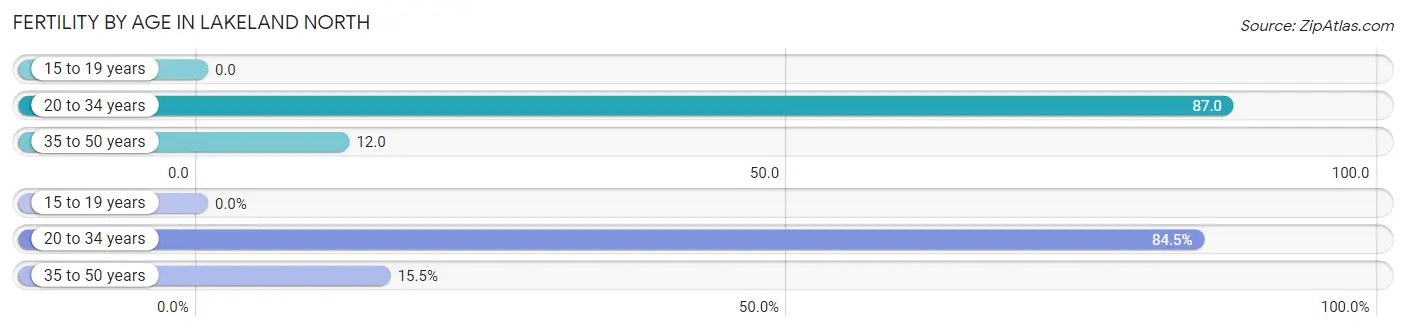
| Age Bracket | Women with Births | Births / 1,000 Women |
| 15 to 19 years | 0 (0.0%) | 0.0 |
| 20 to 34 years | 109 (84.5%) | 87.0 |
| 35 to 50 years | 20 (15.5%) | 12.0 |
| Total | 129 (100.0%) | 34.0 |
Fertility by Age by Marriage Status in Lakeland North
92.2% of women with births (129) in Lakeland North are married. The highest percentage of unmarried women with births falls into 20 to 34 years age bracket with 9.2% of them unmarried at the time of birth, while the lowest percentage of unmarried women with births belong to 35 to 50 years age bracket with 0.0% of them unmarried.
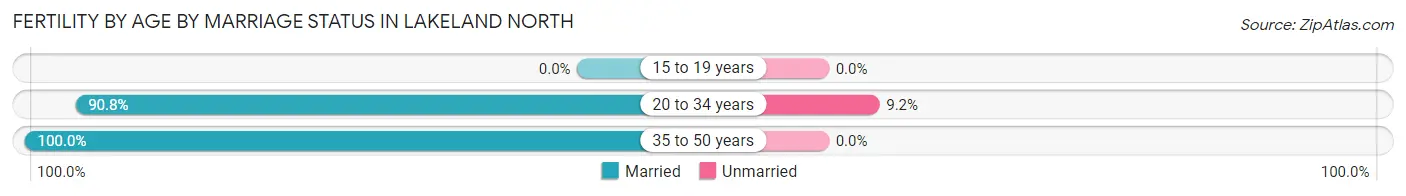
| Age Bracket | Married | Unmarried |
| 15 to 19 years | 0 (0.0%) | 0 (0.0%) |
| 20 to 34 years | 99 (90.8%) | 10 (9.2%) |
| 35 to 50 years | 20 (100.0%) | 0 (0.0%) |
| Total | 119 (92.2%) | 10 (7.7%) |
Fertility by Education in Lakeland North
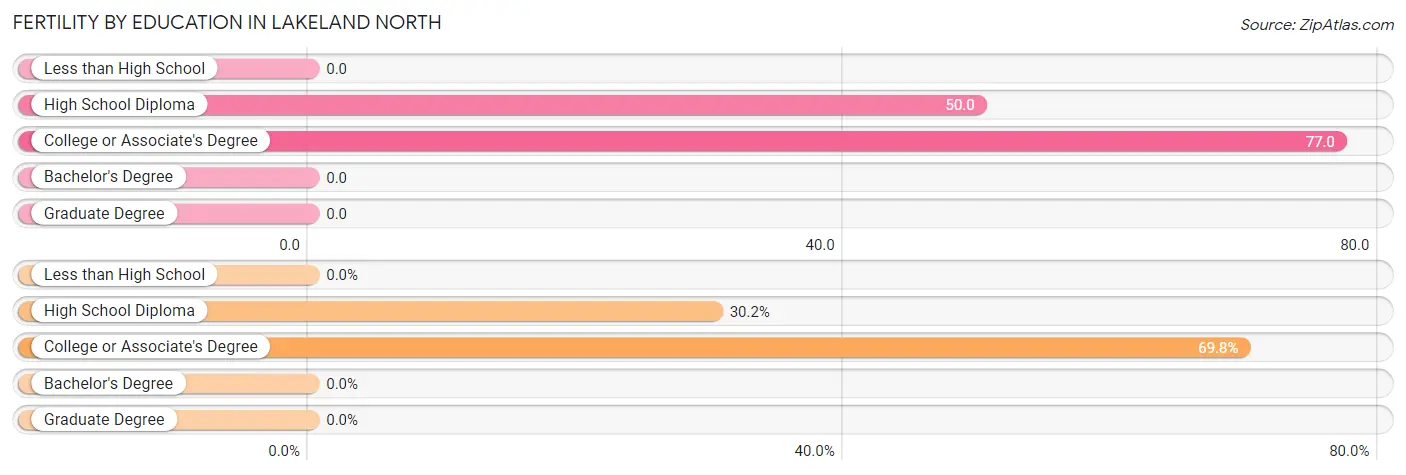
| Educational Attainment | Women with Births | Births / 1,000 Women |
| Less than High School | 0 (0.0%) | 0.0 |
| High School Diploma | 39 (30.2%) | 50.0 |
| College or Associate's Degree | 90 (69.8%) | 77.0 |
| Bachelor's Degree | 0 (0.0%) | 0.0 |
| Graduate Degree | 0 (0.0%) | 0.0 |
| Total | 129 (100.0%) | 34.0 |
Fertility by Education by Marriage Status in Lakeland North
7.7% of women with births in Lakeland North are unmarried. Women with the educational attainment of high school diploma are most likely to be married with 100.0% of them married at childbirth, while women with the educational attainment of college or associate's degree are least likely to be married with 11.1% of them unmarried at childbirth.
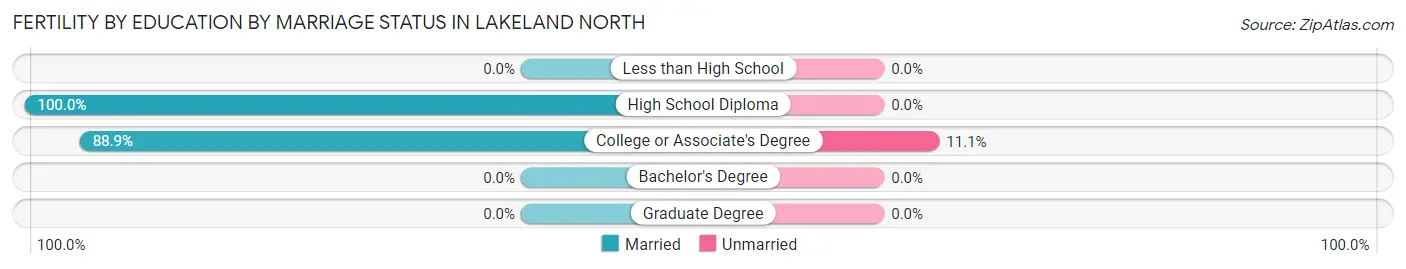
| Educational Attainment | Married | Unmarried |
| Less than High School | 0 (0.0%) | 0 (0.0%) |
| High School Diploma | 39 (100.0%) | 0 (0.0%) |
| College or Associate's Degree | 80 (88.9%) | 10 (11.1%) |
| Bachelor's Degree | 0 (0.0%) | 0 (0.0%) |
| Graduate Degree | 0 (0.0%) | 0 (0.0%) |
| Total | 119 (92.2%) | 10 (7.7%) |
Employment Characteristics in Lakeland North
Employment by Class of Employer in Lakeland North
Among the 6,981 employed individuals in Lakeland North, private company employees (4,484 | 64.2%), local government employees (615 | 8.8%), and self-employed (not incorporated) (534 | 7.6%) make up the most common classes of employment.
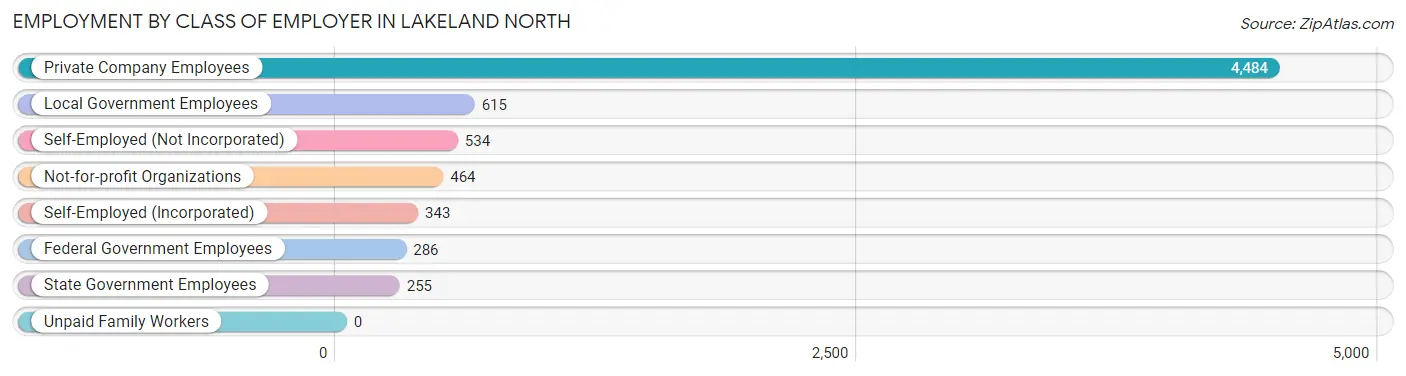
| Employer Class | # Employees | % Employees |
| Private Company Employees | 4,484 | 64.2% |
| Self-Employed (Incorporated) | 343 | 4.9% |
| Self-Employed (Not Incorporated) | 534 | 7.6% |
| Not-for-profit Organizations | 464 | 6.7% |
| Local Government Employees | 615 | 8.8% |
| State Government Employees | 255 | 3.6% |
| Federal Government Employees | 286 | 4.1% |
| Unpaid Family Workers | 0 | 0.0% |
| Total | 6,981 | 100.0% |
Employment Status by Age in Lakeland North
According to the labor force statistics for Lakeland North, out of the total population over 16 years of age (12,096), 64.1% or 7,754 individuals are in the labor force, with 5.1% or 395 of them unemployed. The age group with the highest labor force participation rate is 30 to 34 years, with 88.4% or 809 individuals in the labor force. Within the labor force, the 16 to 19 years age range has the highest percentage of unemployed individuals, with 31.1% or 204 of them being unemployed.
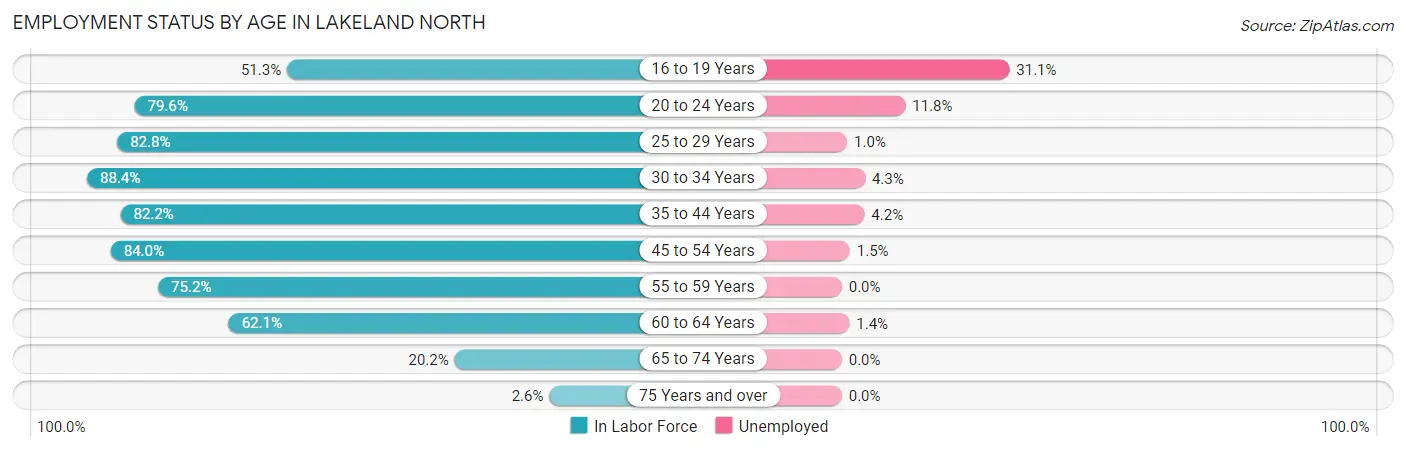
| Age Bracket | In Labor Force | Unemployed |
| 16 to 19 Years | 657 (51.3%) | 204 (31.1%) |
| 20 to 24 Years | 475 (79.6%) | 56 (11.8%) |
| 25 to 29 Years | 624 (82.8%) | 6 (1.0%) |
| 30 to 34 Years | 809 (88.4%) | 35 (4.3%) |
| 35 to 44 Years | 1,429 (82.2%) | 60 (4.2%) |
| 45 to 54 Years | 1,958 (84.0%) | 29 (1.5%) |
| 55 to 59 Years | 944 (75.2%) | 0 (0.0%) |
| 60 to 64 Years | 553 (62.1%) | 8 (1.4%) |
| 65 to 74 Years | 285 (20.2%) | 0 (0.0%) |
| 75 Years and over | 24 (2.6%) | 0 (0.0%) |
| Total | 7,754 (64.1%) | 395 (5.1%) |
Employment Status by Educational Attainment in Lakeland North
According to labor force statistics for Lakeland North, 80.1% of individuals (6,314) out of the total population between 25 and 64 years of age (7,883) are in the labor force, with 2.2% or 139 of them being unemployed. The group with the highest labor force participation rate are those with the educational attainment of bachelor's degree or higher, with 91.5% or 2,256 individuals in the labor force. Within the labor force, individuals with bachelor's degree or higher education have the highest percentage of unemployment, with 4.6% or 104 of them being unemployed.
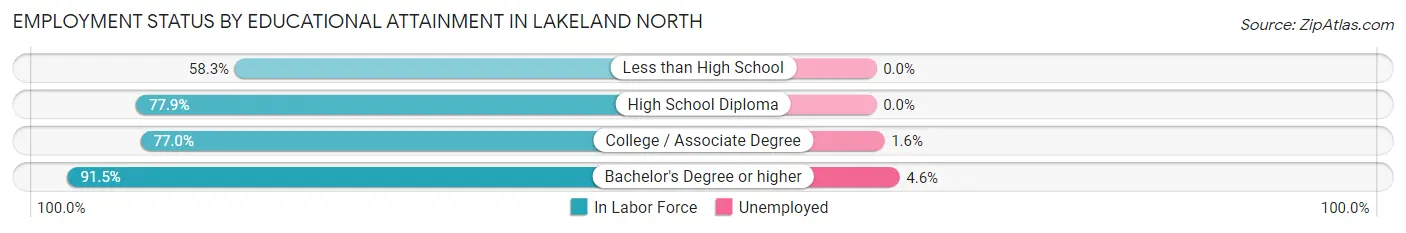
| Educational Attainment | In Labor Force | Unemployed |
| Less than High School | 399 (58.3%) | 0 (0.0%) |
| High School Diploma | 1,402 (77.9%) | 0 (0.0%) |
| College / Associate Degree | 2,258 (77.0%) | 47 (1.6%) |
| Bachelor's Degree or higher | 2,256 (91.5%) | 113 (4.6%) |
| Total | 6,314 (80.1%) | 173 (2.2%) |
Employment Occupations by Sex in Lakeland North
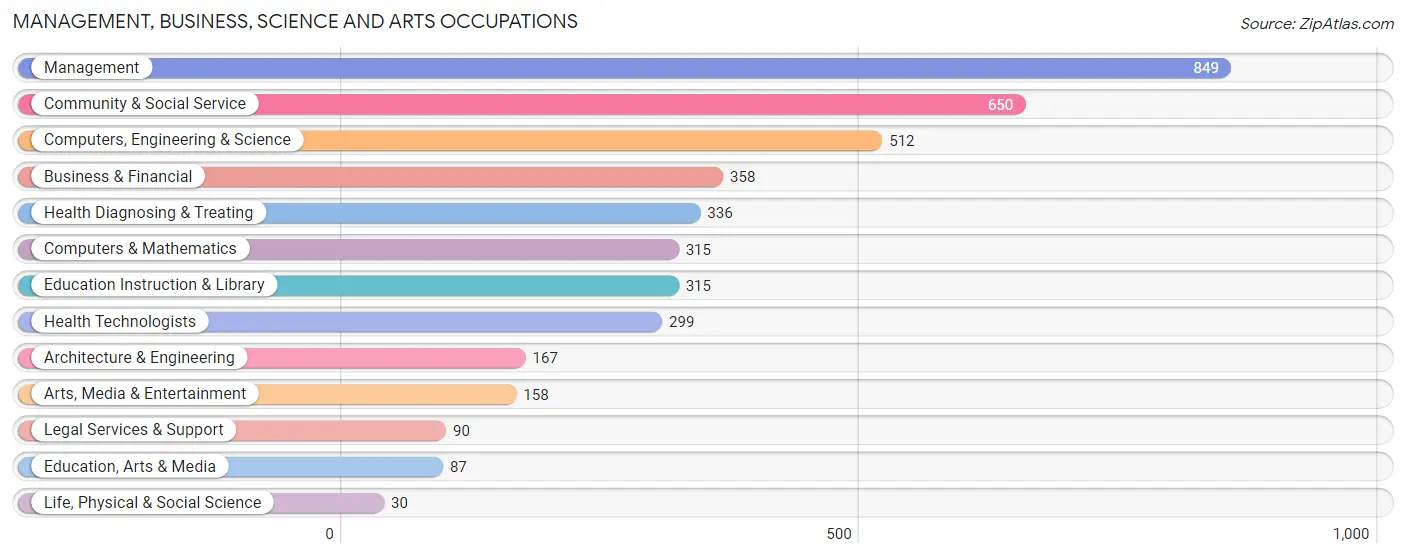
Management, Business, Science and Arts Occupations
The most common Management, Business, Science and Arts occupations in Lakeland North are Management (849 | 11.5%), Community & Social Service (650 | 8.8%), Computers, Engineering & Science (512 | 7.0%), Business & Financial (358 | 4.9%), and Health Diagnosing & Treating (336 | 4.6%).
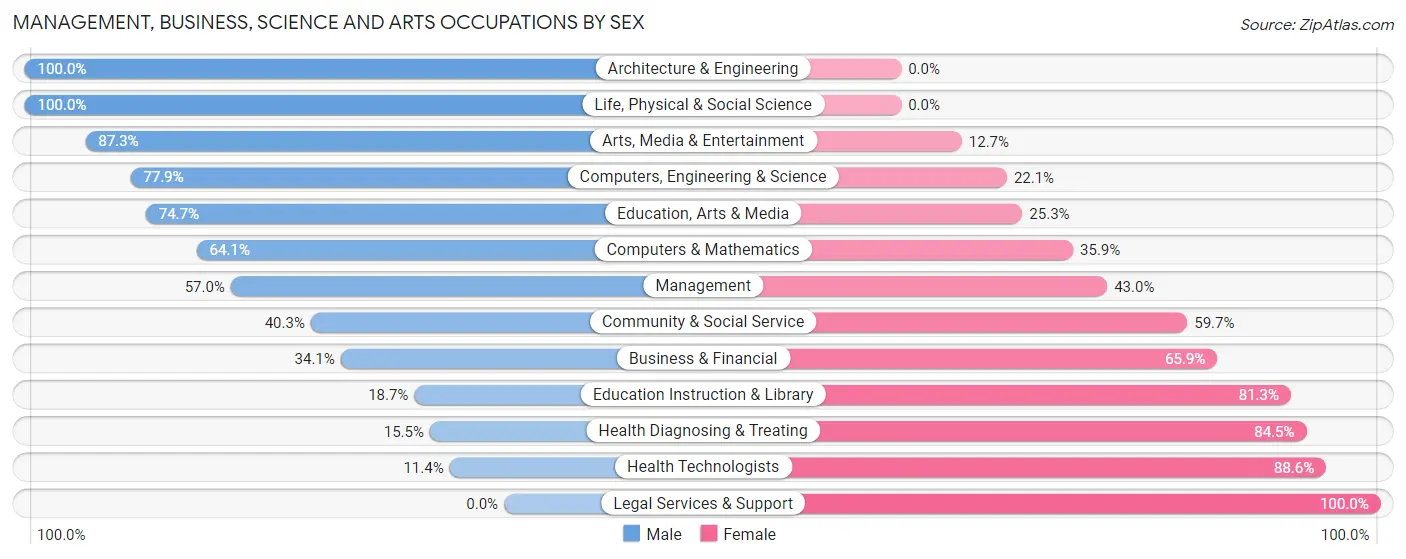
Management, Business, Science and Arts Occupations by Sex
Within the Management, Business, Science and Arts occupations in Lakeland North, the most male-oriented occupations are Architecture & Engineering (100.0%), Life, Physical & Social Science (100.0%), and Arts, Media & Entertainment (87.3%), while the most female-oriented occupations are Legal Services & Support (100.0%), Health Technologists (88.6%), and Health Diagnosing & Treating (84.5%).
| Occupation | Male | Female |
| Management | 484 (57.0%) | 365 (43.0%) |
| Business & Financial | 122 (34.1%) | 236 (65.9%) |
| Computers, Engineering & Science | 399 (77.9%) | 113 (22.1%) |
| Computers & Mathematics | 202 (64.1%) | 113 (35.9%) |
| Architecture & Engineering | 167 (100.0%) | 0 (0.0%) |
| Life, Physical & Social Science | 30 (100.0%) | 0 (0.0%) |
| Community & Social Service | 262 (40.3%) | 388 (59.7%) |
| Education, Arts & Media | 65 (74.7%) | 22 (25.3%) |
| Legal Services & Support | 0 (0.0%) | 90 (100.0%) |
| Education Instruction & Library | 59 (18.7%) | 256 (81.3%) |
| Arts, Media & Entertainment | 138 (87.3%) | 20 (12.7%) |
| Health Diagnosing & Treating | 52 (15.5%) | 284 (84.5%) |
| Health Technologists | 34 (11.4%) | 265 (88.6%) |
| Total (Category) | 1,319 (48.8%) | 1,386 (51.2%) |
| Total (Overall) | 3,591 (48.8%) | 3,766 (51.2%) |
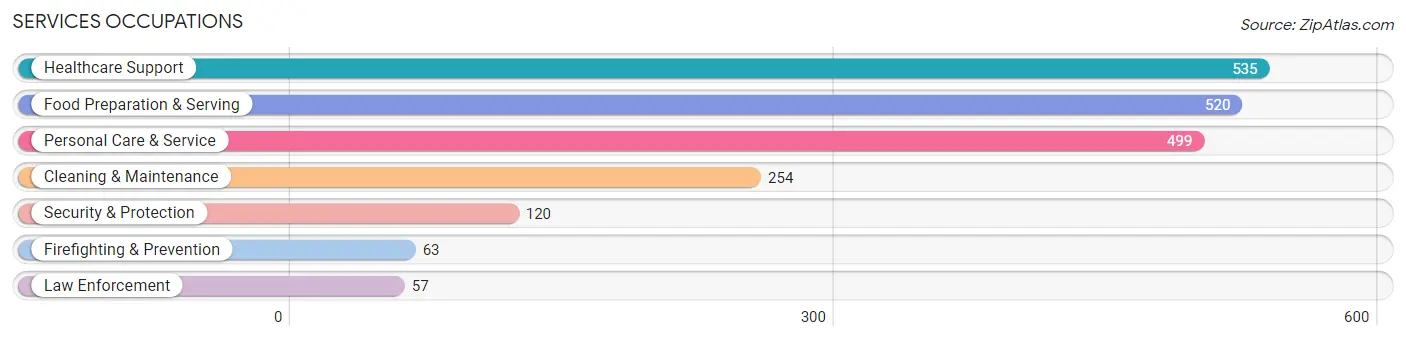
Services Occupations
The most common Services occupations in Lakeland North are Healthcare Support (535 | 7.3%), Food Preparation & Serving (520 | 7.1%), Personal Care & Service (499 | 6.8%), Cleaning & Maintenance (254 | 3.5%), and Security & Protection (120 | 1.6%).
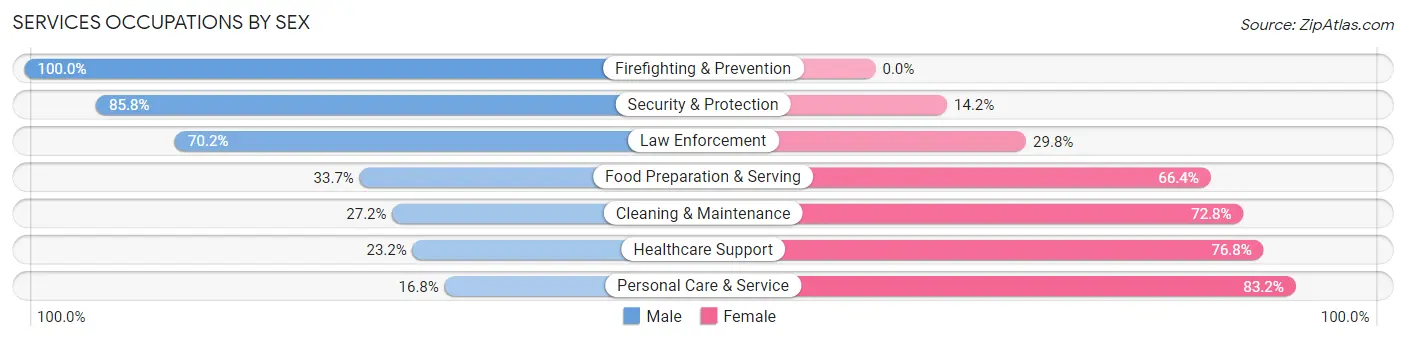
Services Occupations by Sex
Within the Services occupations in Lakeland North, the most male-oriented occupations are Firefighting & Prevention (100.0%), Security & Protection (85.8%), and Law Enforcement (70.2%), while the most female-oriented occupations are Personal Care & Service (83.2%), Healthcare Support (76.8%), and Cleaning & Maintenance (72.8%).
| Occupation | Male | Female |
| Healthcare Support | 124 (23.2%) | 411 (76.8%) |
| Security & Protection | 103 (85.8%) | 17 (14.2%) |
| Firefighting & Prevention | 63 (100.0%) | 0 (0.0%) |
| Law Enforcement | 40 (70.2%) | 17 (29.8%) |
| Food Preparation & Serving | 175 (33.7%) | 345 (66.3%) |
| Cleaning & Maintenance | 69 (27.2%) | 185 (72.8%) |
| Personal Care & Service | 84 (16.8%) | 415 (83.2%) |
| Total (Category) | 555 (28.8%) | 1,373 (71.2%) |
| Total (Overall) | 3,591 (48.8%) | 3,766 (51.2%) |
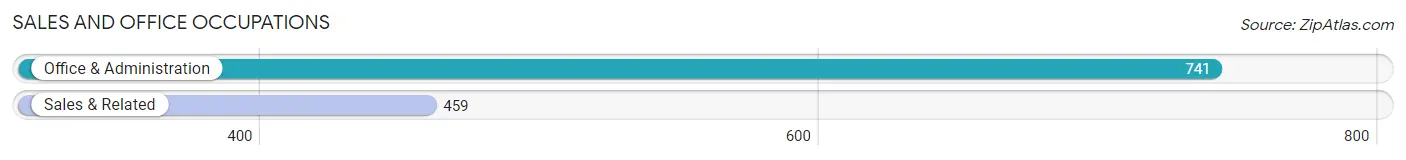
Sales and Office Occupations
The most common Sales and Office occupations in Lakeland North are Office & Administration (741 | 10.1%), and Sales & Related (459 | 6.2%).
Sales and Office Occupations by Sex
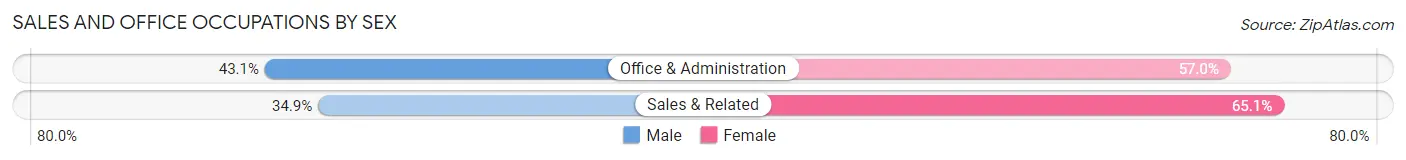
| Occupation | Male | Female |
| Sales & Related | 160 (34.9%) | 299 (65.1%) |
| Office & Administration | 319 (43.0%) | 422 (57.0%) |
| Total (Category) | 479 (39.9%) | 721 (60.1%) |
| Total (Overall) | 3,591 (48.8%) | 3,766 (51.2%) |
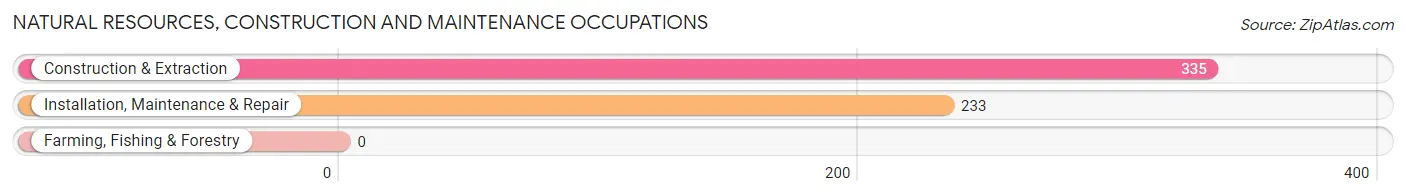
Natural Resources, Construction and Maintenance Occupations
The most common Natural Resources, Construction and Maintenance occupations in Lakeland North are Construction & Extraction (335 | 4.5%), and Installation, Maintenance & Repair (233 | 3.2%).
Natural Resources, Construction and Maintenance Occupations by Sex
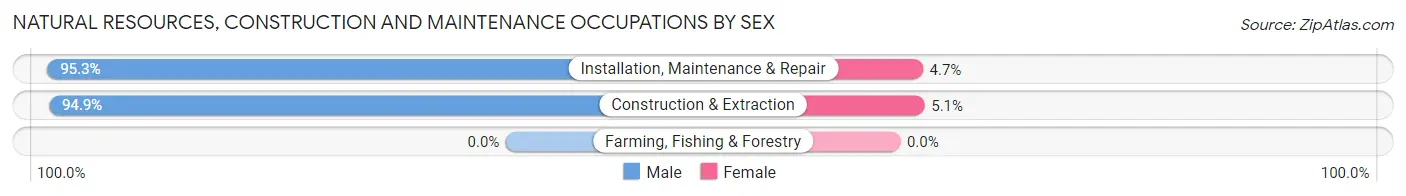
| Occupation | Male | Female |
| Farming, Fishing & Forestry | 0 (0.0%) | 0 (0.0%) |
| Construction & Extraction | 318 (94.9%) | 17 (5.1%) |
| Installation, Maintenance & Repair | 222 (95.3%) | 11 (4.7%) |
| Total (Category) | 540 (95.1%) | 28 (4.9%) |
| Total (Overall) | 3,591 (48.8%) | 3,766 (51.2%) |
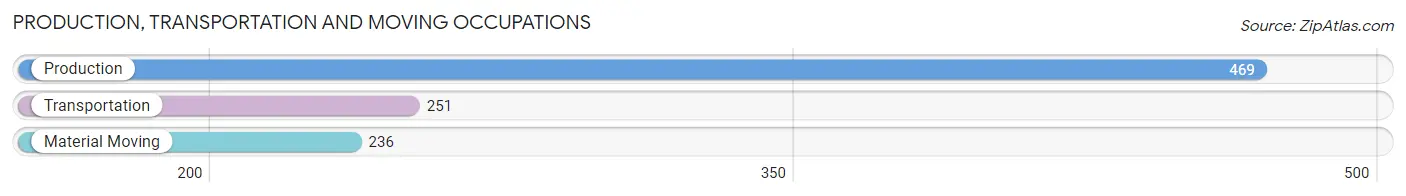
Production, Transportation and Moving Occupations
The most common Production, Transportation and Moving occupations in Lakeland North are Production (469 | 6.4%), Transportation (251 | 3.4%), and Material Moving (236 | 3.2%).
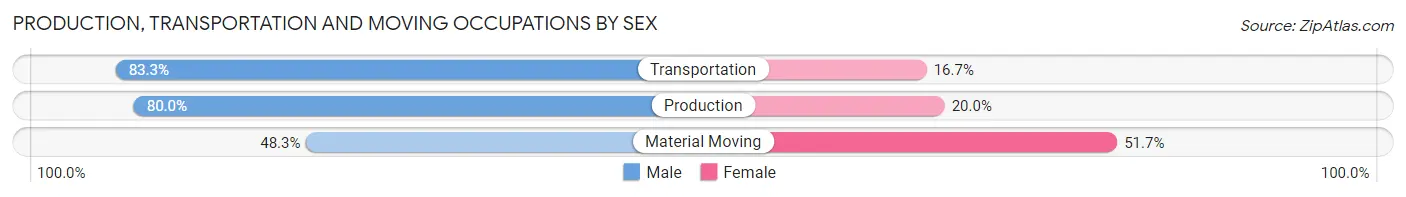
Production, Transportation and Moving Occupations by Sex
| Occupation | Male | Female |
| Production | 375 (80.0%) | 94 (20.0%) |
| Transportation | 209 (83.3%) | 42 (16.7%) |
| Material Moving | 114 (48.3%) | 122 (51.7%) |
| Total (Category) | 698 (73.0%) | 258 (27.0%) |
| Total (Overall) | 3,591 (48.8%) | 3,766 (51.2%) |
Employment Industries by Sex in Lakeland North
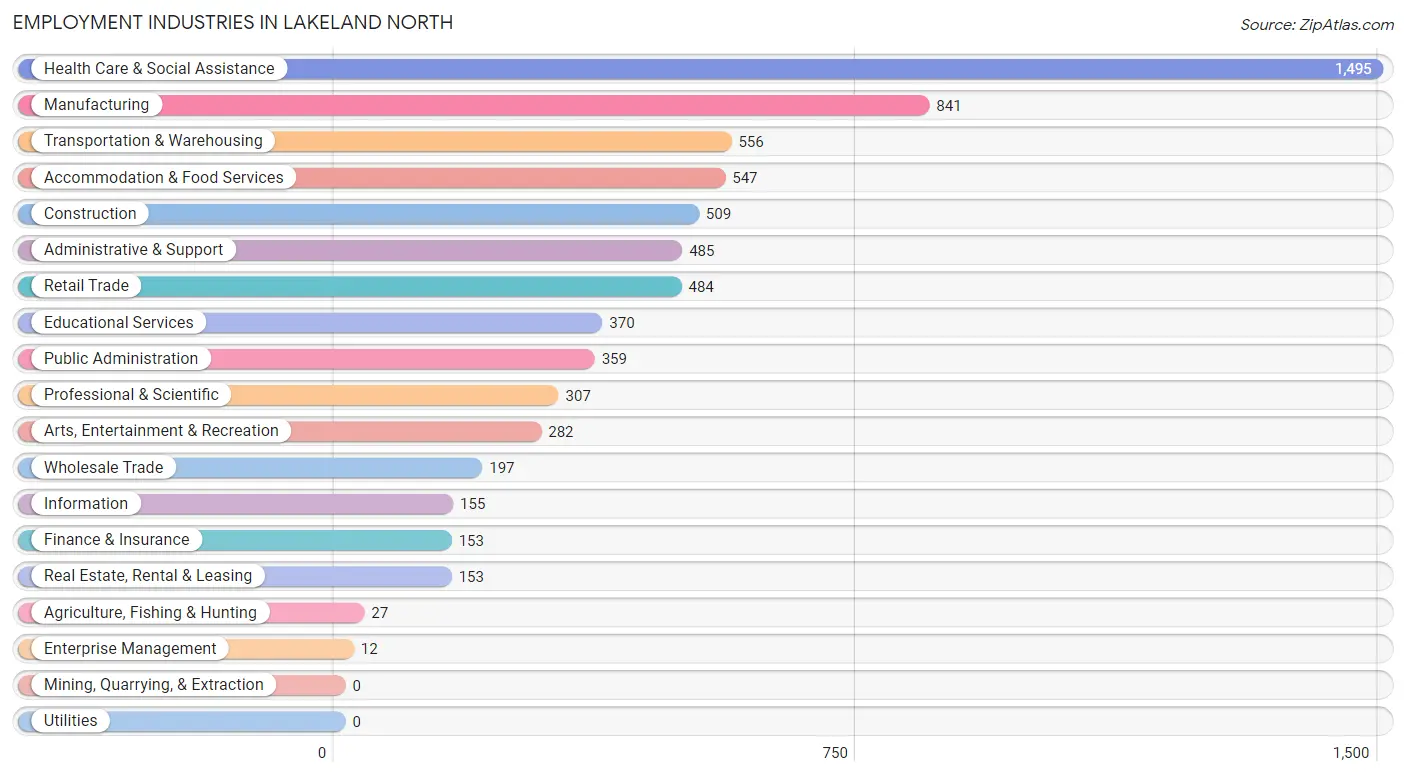
Employment Industries in Lakeland North
The major employment industries in Lakeland North include Health Care & Social Assistance (1,495 | 20.3%), Manufacturing (841 | 11.4%), Transportation & Warehousing (556 | 7.6%), Accommodation & Food Services (547 | 7.4%), and Construction (509 | 6.9%).
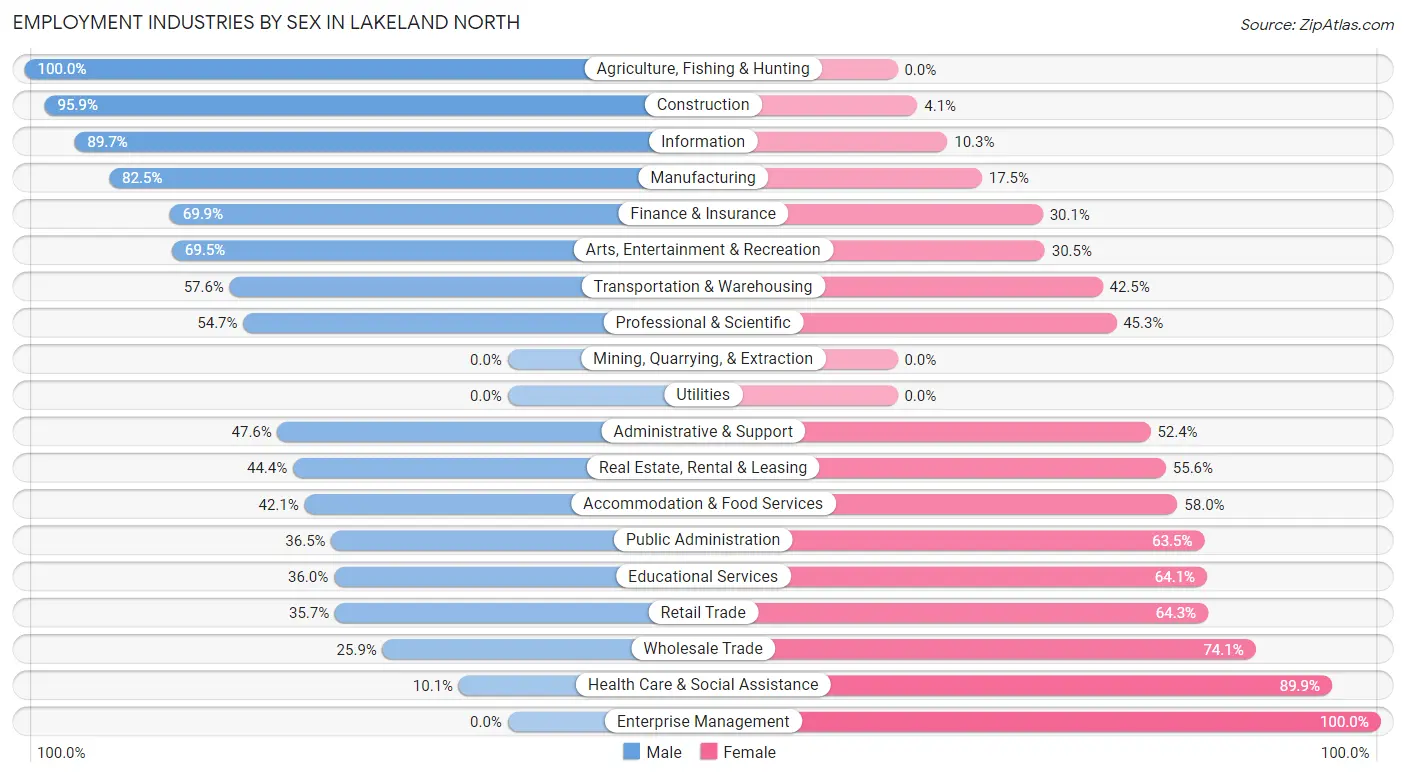
Employment Industries by Sex in Lakeland North
The Lakeland North industries that see more men than women are Agriculture, Fishing & Hunting (100.0%), Construction (95.9%), and Information (89.7%), whereas the industries that tend to have a higher number of women are Enterprise Management (100.0%), Health Care & Social Assistance (89.9%), and Wholesale Trade (74.1%).
| Industry | Male | Female |
| Agriculture, Fishing & Hunting | 27 (100.0%) | 0 (0.0%) |
| Mining, Quarrying, & Extraction | 0 (0.0%) | 0 (0.0%) |
| Construction | 488 (95.9%) | 21 (4.1%) |
| Manufacturing | 694 (82.5%) | 147 (17.5%) |
| Wholesale Trade | 51 (25.9%) | 146 (74.1%) |
| Retail Trade | 173 (35.7%) | 311 (64.3%) |
| Transportation & Warehousing | 320 (57.6%) | 236 (42.4%) |
| Utilities | 0 (0.0%) | 0 (0.0%) |
| Information | 139 (89.7%) | 16 (10.3%) |
| Finance & Insurance | 107 (69.9%) | 46 (30.1%) |
| Real Estate, Rental & Leasing | 68 (44.4%) | 85 (55.6%) |
| Professional & Scientific | 168 (54.7%) | 139 (45.3%) |
| Enterprise Management | 0 (0.0%) | 12 (100.0%) |
| Administrative & Support | 231 (47.6%) | 254 (52.4%) |
| Educational Services | 133 (35.9%) | 237 (64.0%) |
| Health Care & Social Assistance | 151 (10.1%) | 1,344 (89.9%) |
| Arts, Entertainment & Recreation | 196 (69.5%) | 86 (30.5%) |
| Accommodation & Food Services | 230 (42.0%) | 317 (58.0%) |
| Public Administration | 131 (36.5%) | 228 (63.5%) |
| Total | 3,591 (48.8%) | 3,766 (51.2%) |
Education in Lakeland North
School Enrollment in Lakeland North
The most common levels of schooling among the 3,871 students in Lakeland North are high school (1,133 | 29.3%), middle school (1,055 | 27.3%), and college / undergraduate (791 | 20.4%).
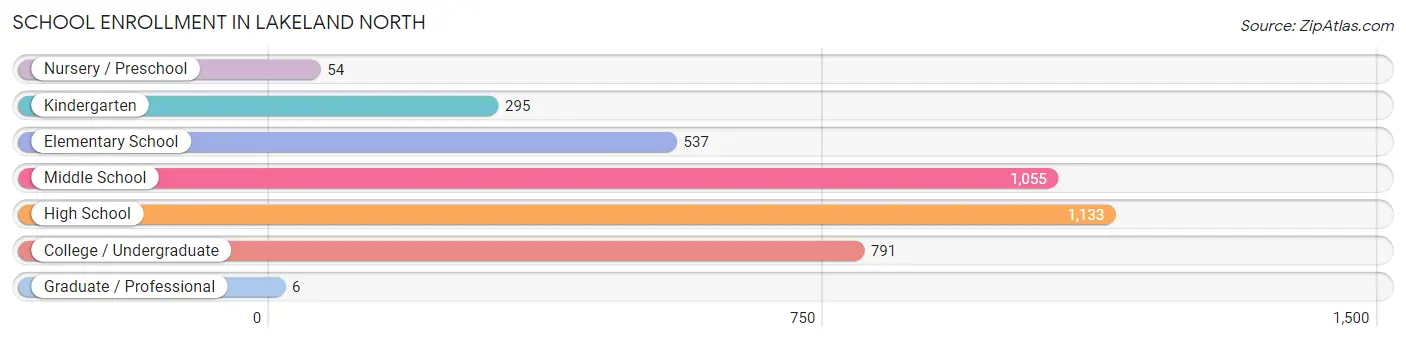
| School Level | # Students | % Students |
| Nursery / Preschool | 54 | 1.4% |
| Kindergarten | 295 | 7.6% |
| Elementary School | 537 | 13.9% |
| Middle School | 1,055 | 27.3% |
| High School | 1,133 | 29.3% |
| College / Undergraduate | 791 | 20.4% |
| Graduate / Professional | 6 | 0.2% |
| Total | 3,871 | 100.0% |
School Enrollment by Age by Funding Source in Lakeland North
Out of a total of 3,871 students who are enrolled in schools in Lakeland North, 205 (5.3%) attend a private institution, while the remaining 3,666 (94.7%) are enrolled in public schools. The age group of 3 to 4 year olds has the highest likelihood of being enrolled in private schools, with 23 (56.1% in the age bracket) enrolled. Conversely, the age group of 10 to 14 year olds has the lowest likelihood of being enrolled in a private school, with 1,184 (100.0% in the age bracket) attending a public institution.
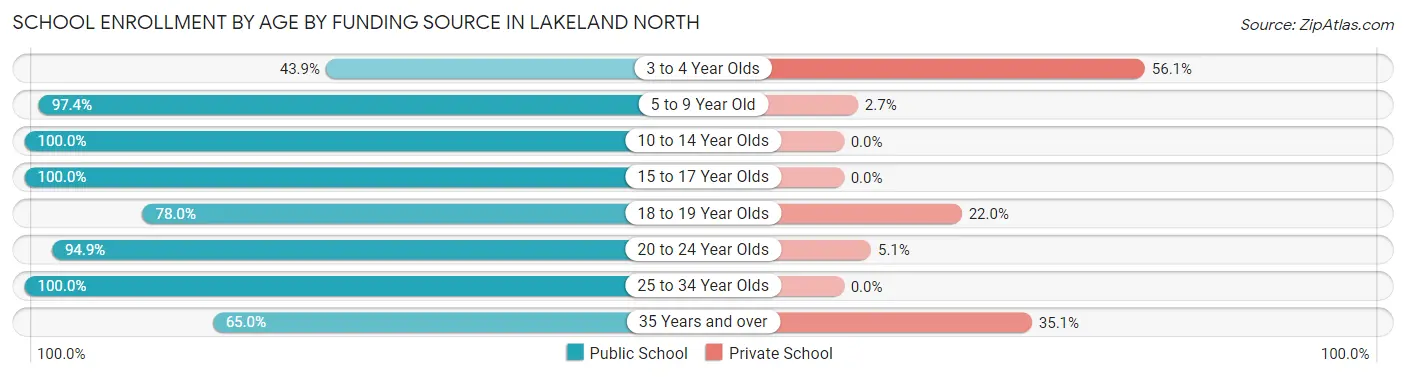
| Age Bracket | Public School | Private School |
| 3 to 4 Year Olds | 18 (43.9%) | 23 (56.1%) |
| 5 to 9 Year Old | 844 (97.4%) | 23 (2.6%) |
| 10 to 14 Year Olds | 1,184 (100.0%) | 0 (0.0%) |
| 15 to 17 Year Olds | 902 (100.0%) | 0 (0.0%) |
| 18 to 19 Year Olds | 298 (78.0%) | 84 (22.0%) |
| 20 to 24 Year Olds | 149 (94.9%) | 8 (5.1%) |
| 25 to 34 Year Olds | 144 (100.0%) | 0 (0.0%) |
| 35 Years and over | 126 (64.9%) | 68 (35.0%) |
| Total | 3,666 (94.7%) | 205 (5.3%) |
Educational Attainment by Field of Study in Lakeland North
Business (660 | 20.3%), bio, nature & agricultural (392 | 12.0%), social sciences (297 | 9.1%), science & technology (253 | 7.8%), and liberal arts & history (222 | 6.8%) are the most common fields of study among 3,260 individuals in Lakeland North who have obtained a bachelor's degree or higher.
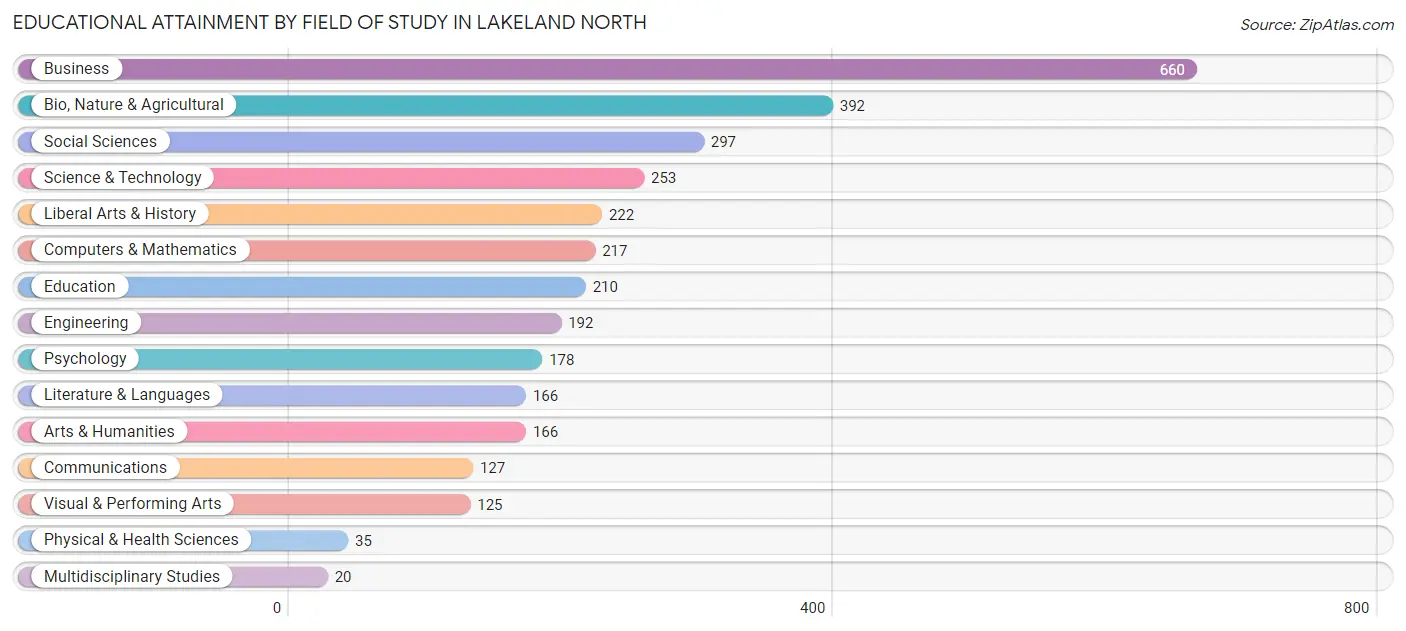
| Field of Study | # Graduates | % Graduates |
| Computers & Mathematics | 217 | 6.7% |
| Bio, Nature & Agricultural | 392 | 12.0% |
| Physical & Health Sciences | 35 | 1.1% |
| Psychology | 178 | 5.5% |
| Social Sciences | 297 | 9.1% |
| Engineering | 192 | 5.9% |
| Multidisciplinary Studies | 20 | 0.6% |
| Science & Technology | 253 | 7.8% |
| Business | 660 | 20.3% |
| Education | 210 | 6.4% |
| Literature & Languages | 166 | 5.1% |
| Liberal Arts & History | 222 | 6.8% |
| Visual & Performing Arts | 125 | 3.8% |
| Communications | 127 | 3.9% |
| Arts & Humanities | 166 | 5.1% |
| Total | 3,260 | 100.0% |
Transportation & Commute in Lakeland North
Vehicle Availability by Sex in Lakeland North
The most prevalent vehicle ownership categories in Lakeland North are males with 2 vehicles (1,320, accounting for 38.4%) and females with 2 vehicles (1,099, making up 37.3%).
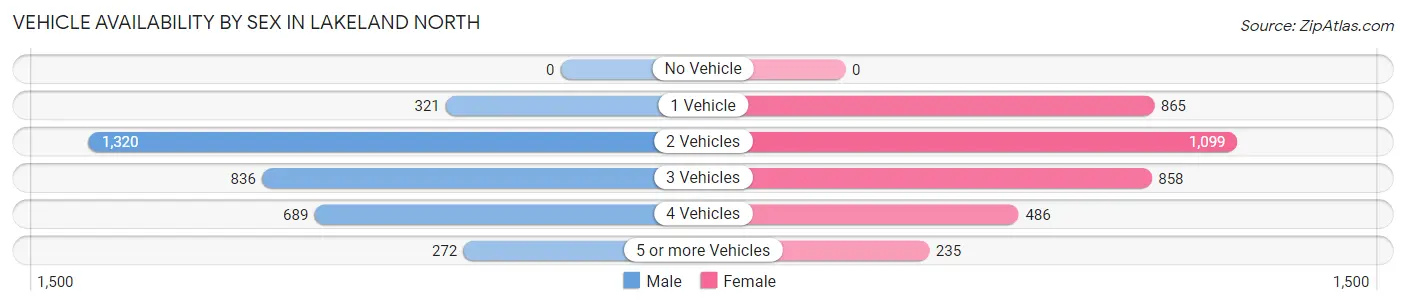
| Vehicles Available | Male | Female |
| No Vehicle | 0 (0.0%) | 0 (0.0%) |
| 1 Vehicle | 321 (9.3%) | 865 (24.4%) |
| 2 Vehicles | 1,320 (38.4%) | 1,099 (31.0%) |
| 3 Vehicles | 836 (24.3%) | 858 (24.2%) |
| 4 Vehicles | 689 (20.0%) | 486 (13.7%) |
| 5 or more Vehicles | 272 (7.9%) | 235 (6.6%) |
| Total | 3,438 (100.0%) | 3,543 (100.0%) |
Commute Time in Lakeland North
The most frequently occuring commute durations in Lakeland North are 10 to 14 minutes (1,008 commuters, 16.4%), 20 to 24 minutes (1,002 commuters, 16.3%), and 30 to 34 minutes (822 commuters, 13.4%).
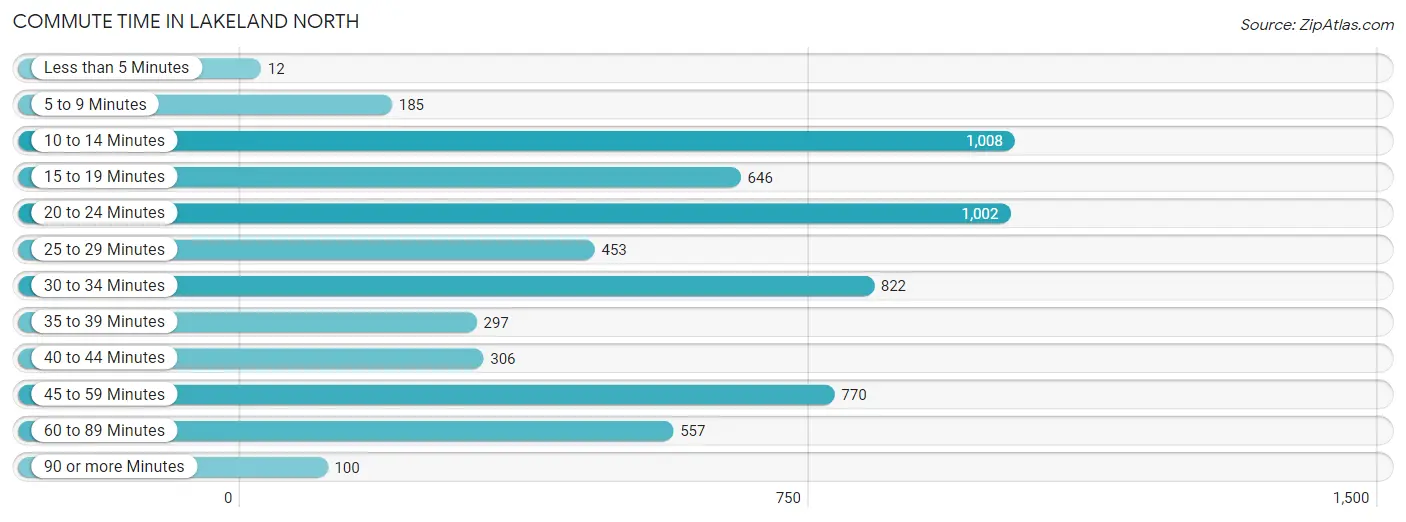
| Commute Time | # Commuters | % Commuters |
| Less than 5 Minutes | 12 | 0.2% |
| 5 to 9 Minutes | 185 | 3.0% |
| 10 to 14 Minutes | 1,008 | 16.4% |
| 15 to 19 Minutes | 646 | 10.5% |
| 20 to 24 Minutes | 1,002 | 16.3% |
| 25 to 29 Minutes | 453 | 7.4% |
| 30 to 34 Minutes | 822 | 13.4% |
| 35 to 39 Minutes | 297 | 4.8% |
| 40 to 44 Minutes | 306 | 5.0% |
| 45 to 59 Minutes | 770 | 12.5% |
| 60 to 89 Minutes | 557 | 9.0% |
| 90 or more Minutes | 100 | 1.6% |
Commute Time by Sex in Lakeland North
The most common commute times in Lakeland North are 20 to 24 minutes (611 commuters, 19.9%) for males and 10 to 14 minutes (622 commuters, 20.1%) for females.
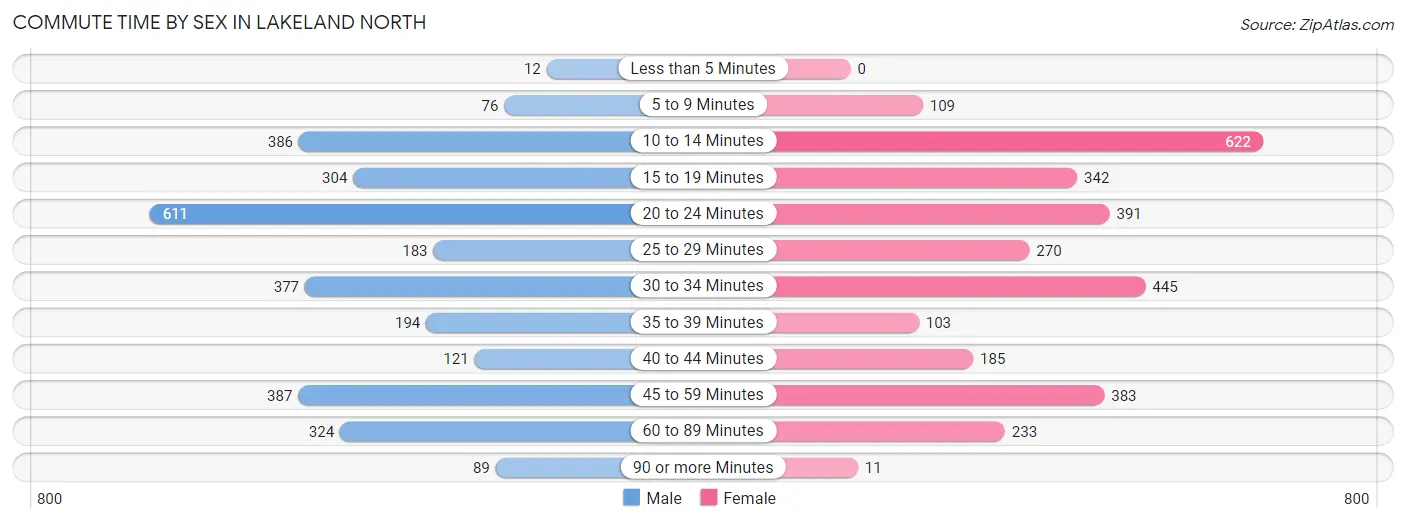
| Commute Time | Male | Female |
| Less than 5 Minutes | 12 (0.4%) | 0 (0.0%) |
| 5 to 9 Minutes | 76 (2.5%) | 109 (3.5%) |
| 10 to 14 Minutes | 386 (12.6%) | 622 (20.1%) |
| 15 to 19 Minutes | 304 (9.9%) | 342 (11.1%) |
| 20 to 24 Minutes | 611 (19.9%) | 391 (12.6%) |
| 25 to 29 Minutes | 183 (6.0%) | 270 (8.7%) |
| 30 to 34 Minutes | 377 (12.3%) | 445 (14.4%) |
| 35 to 39 Minutes | 194 (6.3%) | 103 (3.3%) |
| 40 to 44 Minutes | 121 (4.0%) | 185 (6.0%) |
| 45 to 59 Minutes | 387 (12.6%) | 383 (12.4%) |
| 60 to 89 Minutes | 324 (10.6%) | 233 (7.5%) |
| 90 or more Minutes | 89 (2.9%) | 11 (0.4%) |
Time of Departure to Work by Sex in Lakeland North
The most frequent times of departure to work in Lakeland North are 5:00 AM to 5:29 AM (473, 15.4%) for males and 7:00 AM to 7:29 AM (775, 25.1%) for females.
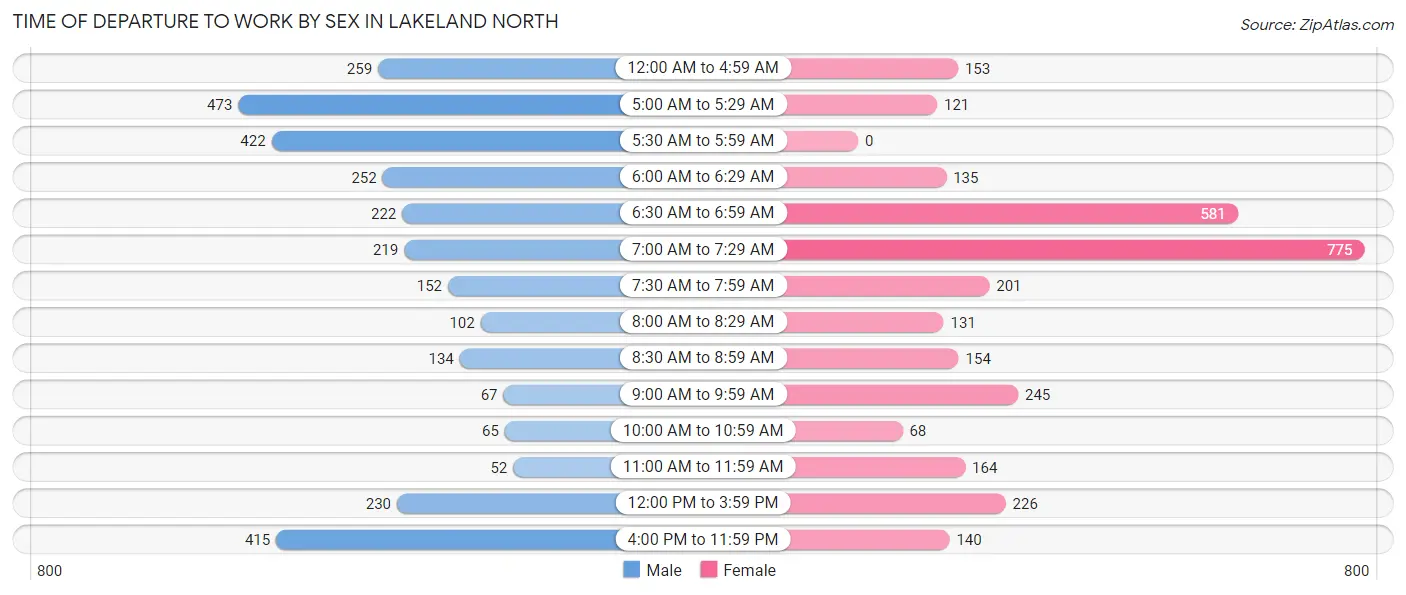
| Time of Departure | Male | Female |
| 12:00 AM to 4:59 AM | 259 (8.5%) | 153 (5.0%) |
| 5:00 AM to 5:29 AM | 473 (15.4%) | 121 (3.9%) |
| 5:30 AM to 5:59 AM | 422 (13.8%) | 0 (0.0%) |
| 6:00 AM to 6:29 AM | 252 (8.2%) | 135 (4.4%) |
| 6:30 AM to 6:59 AM | 222 (7.2%) | 581 (18.8%) |
| 7:00 AM to 7:29 AM | 219 (7.1%) | 775 (25.1%) |
| 7:30 AM to 7:59 AM | 152 (5.0%) | 201 (6.5%) |
| 8:00 AM to 8:29 AM | 102 (3.3%) | 131 (4.2%) |
| 8:30 AM to 8:59 AM | 134 (4.4%) | 154 (5.0%) |
| 9:00 AM to 9:59 AM | 67 (2.2%) | 245 (7.9%) |
| 10:00 AM to 10:59 AM | 65 (2.1%) | 68 (2.2%) |
| 11:00 AM to 11:59 AM | 52 (1.7%) | 164 (5.3%) |
| 12:00 PM to 3:59 PM | 230 (7.5%) | 226 (7.3%) |
| 4:00 PM to 11:59 PM | 415 (13.5%) | 140 (4.5%) |
| Total | 3,064 (100.0%) | 3,094 (100.0%) |
Housing Occupancy in Lakeland North
Occupancy by Ownership in Lakeland North
Of the total 4,921 dwellings in Lakeland North, owner-occupied units account for 3,698 (75.1%), while renter-occupied units make up 1,223 (24.8%).
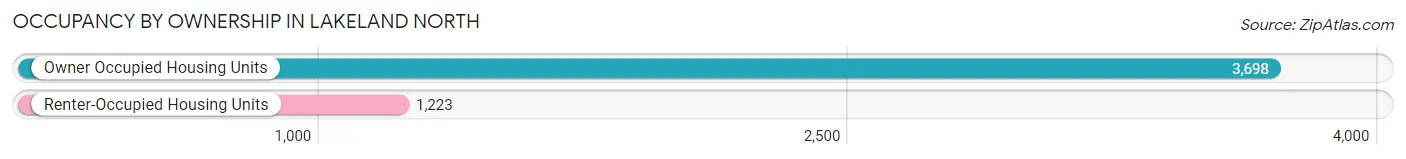
| Occupancy | # Housing Units | % Housing Units |
| Owner Occupied Housing Units | 3,698 | 75.1% |
| Renter-Occupied Housing Units | 1,223 | 24.8% |
| Total Occupied Housing Units | 4,921 | 100.0% |
Occupancy by Household Size in Lakeland North
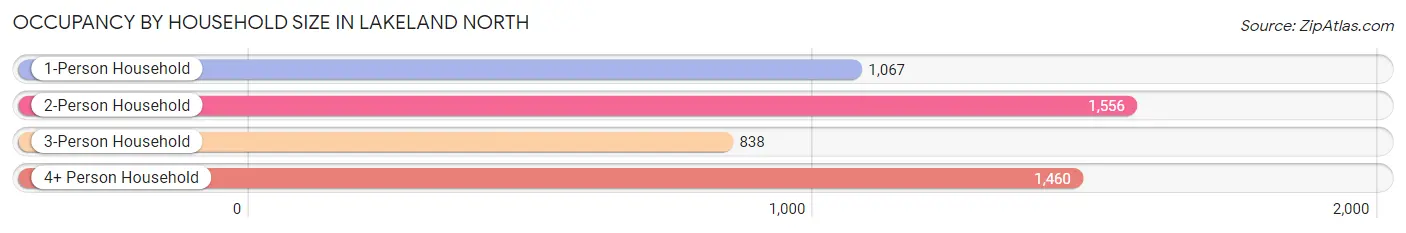
| Household Size | # Housing Units | % Housing Units |
| 1-Person Household | 1,067 | 21.7% |
| 2-Person Household | 1,556 | 31.6% |
| 3-Person Household | 838 | 17.0% |
| 4+ Person Household | 1,460 | 29.7% |
| Total Housing Units | 4,921 | 100.0% |
Occupancy by Ownership by Household Size in Lakeland North
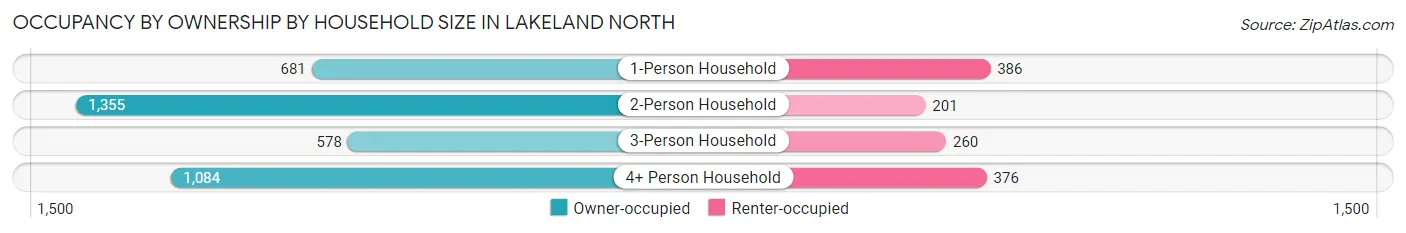
| Household Size | Owner-occupied | Renter-occupied |
| 1-Person Household | 681 (63.8%) | 386 (36.2%) |
| 2-Person Household | 1,355 (87.1%) | 201 (12.9%) |
| 3-Person Household | 578 (69.0%) | 260 (31.0%) |
| 4+ Person Household | 1,084 (74.3%) | 376 (25.8%) |
| Total Housing Units | 3,698 (75.1%) | 1,223 (24.8%) |
Occupancy by Educational Attainment in Lakeland North
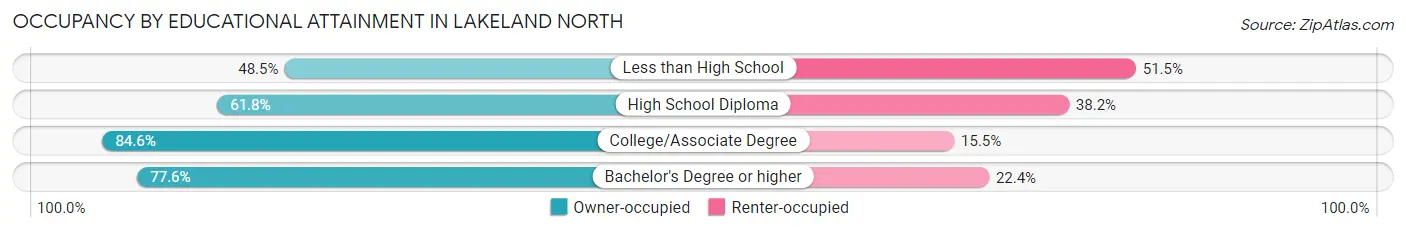
| Household Size | Owner-occupied | Renter-occupied |
| Less than High School | 131 (48.5%) | 139 (51.5%) |
| High School Diploma | 676 (61.8%) | 418 (38.2%) |
| College/Associate Degree | 1,582 (84.6%) | 289 (15.4%) |
| Bachelor's Degree or higher | 1,309 (77.6%) | 377 (22.4%) |
Occupancy by Age of Householder in Lakeland North
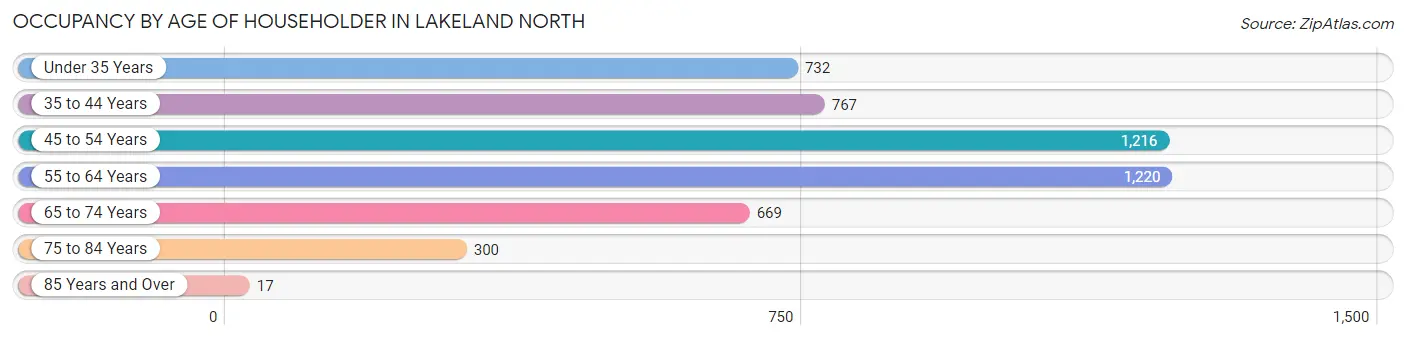
| Age Bracket | # Households | % Households |
| Under 35 Years | 732 | 14.9% |
| 35 to 44 Years | 767 | 15.6% |
| 45 to 54 Years | 1,216 | 24.7% |
| 55 to 64 Years | 1,220 | 24.8% |
| 65 to 74 Years | 669 | 13.6% |
| 75 to 84 Years | 300 | 6.1% |
| 85 Years and Over | 17 | 0.4% |
| Total | 4,921 | 100.0% |
Housing Finances in Lakeland North
Median Income by Occupancy in Lakeland North
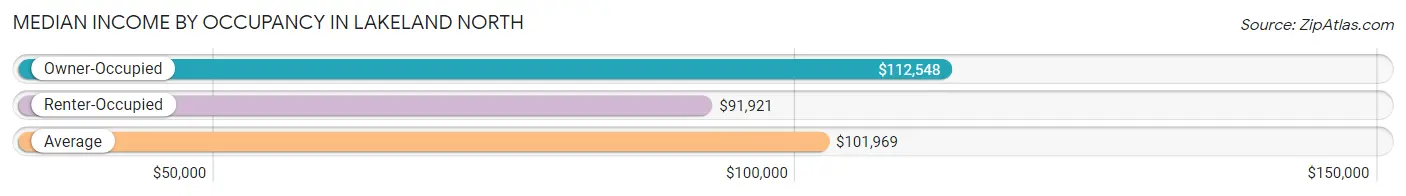
| Occupancy Type | # Households | Median Income |
| Owner-Occupied | 3,698 (75.1%) | $112,548 |
| Renter-Occupied | 1,223 (24.8%) | $91,921 |
| Average | 4,921 (100.0%) | $101,969 |
Occupancy by Householder Income Bracket in Lakeland North
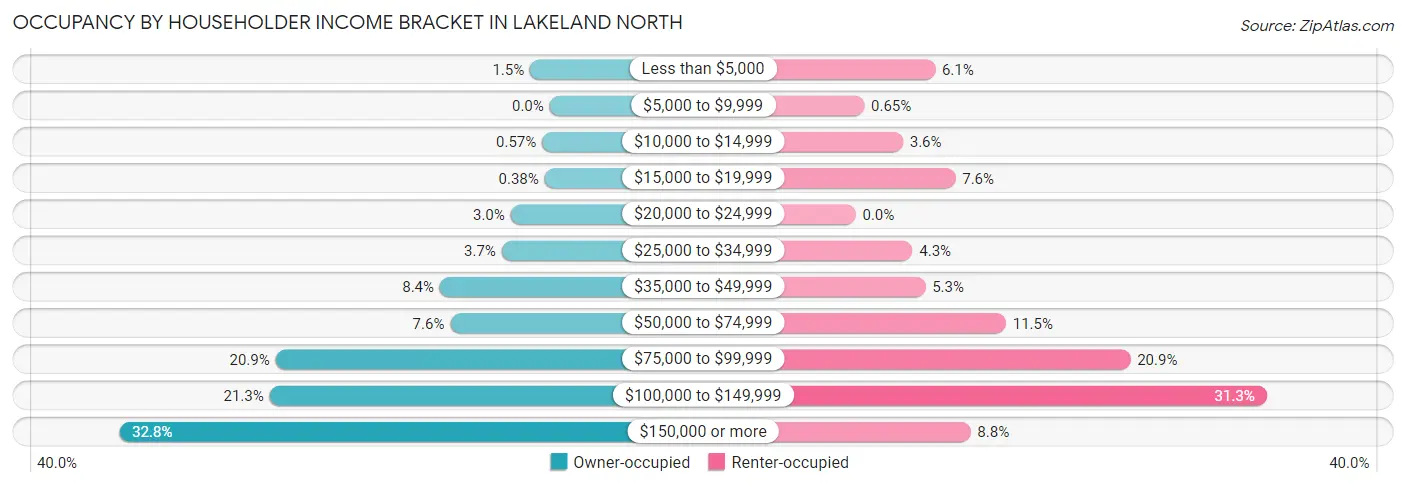
| Income Bracket | Owner-occupied | Renter-occupied |
| Less than $5,000 | 55 (1.5%) | 74 (6.0%) |
| $5,000 to $9,999 | 0 (0.0%) | 8 (0.6%) |
| $10,000 to $14,999 | 21 (0.6%) | 44 (3.6%) |
| $15,000 to $19,999 | 14 (0.4%) | 93 (7.6%) |
| $20,000 to $24,999 | 110 (3.0%) | 0 (0.0%) |
| $25,000 to $34,999 | 135 (3.6%) | 53 (4.3%) |
| $35,000 to $49,999 | 309 (8.4%) | 65 (5.3%) |
| $50,000 to $74,999 | 280 (7.6%) | 140 (11.5%) |
| $75,000 to $99,999 | 772 (20.9%) | 256 (20.9%) |
| $100,000 to $149,999 | 789 (21.3%) | 383 (31.3%) |
| $150,000 or more | 1,213 (32.8%) | 107 (8.7%) |
| Total | 3,698 (100.0%) | 1,223 (100.0%) |
Monthly Housing Cost Tiers in Lakeland North
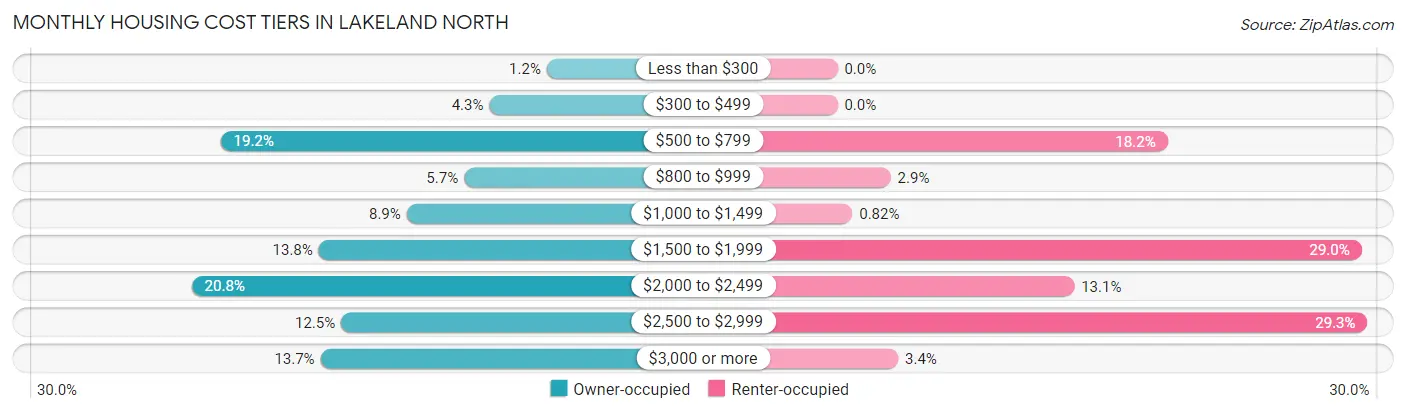
| Monthly Cost | Owner-occupied | Renter-occupied |
| Less than $300 | 43 (1.2%) | 0 (0.0%) |
| $300 to $499 | 160 (4.3%) | 0 (0.0%) |
| $500 to $799 | 709 (19.2%) | 223 (18.2%) |
| $800 to $999 | 212 (5.7%) | 36 (2.9%) |
| $1,000 to $1,499 | 329 (8.9%) | 10 (0.8%) |
| $1,500 to $1,999 | 509 (13.8%) | 354 (28.9%) |
| $2,000 to $2,499 | 768 (20.8%) | 160 (13.1%) |
| $2,500 to $2,999 | 463 (12.5%) | 358 (29.3%) |
| $3,000 or more | 505 (13.7%) | 41 (3.4%) |
| Total | 3,698 (100.0%) | 1,223 (100.0%) |
Physical Housing Characteristics in Lakeland North
Housing Structures in Lakeland North
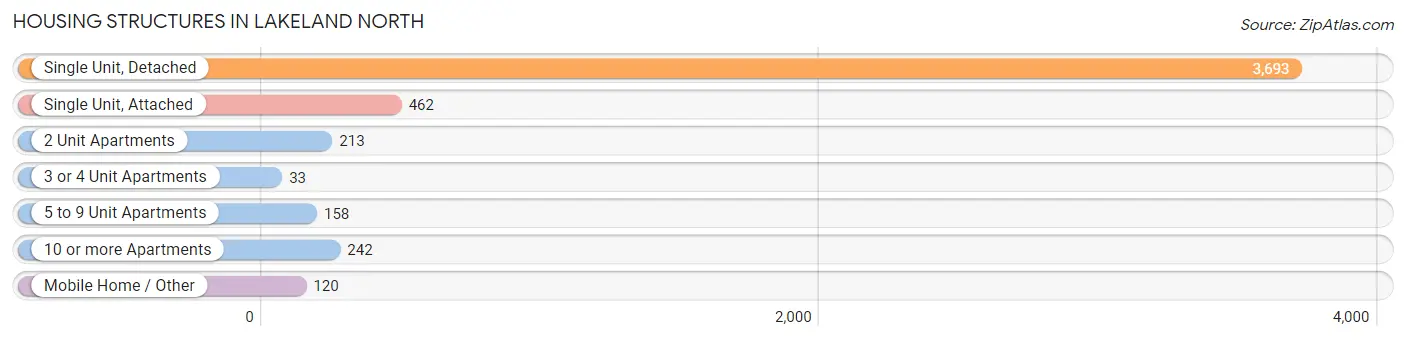
| Structure Type | # Housing Units | % Housing Units |
| Single Unit, Detached | 3,693 | 75.0% |
| Single Unit, Attached | 462 | 9.4% |
| 2 Unit Apartments | 213 | 4.3% |
| 3 or 4 Unit Apartments | 33 | 0.7% |
| 5 to 9 Unit Apartments | 158 | 3.2% |
| 10 or more Apartments | 242 | 4.9% |
| Mobile Home / Other | 120 | 2.4% |
| Total | 4,921 | 100.0% |
Housing Structures by Occupancy in Lakeland North
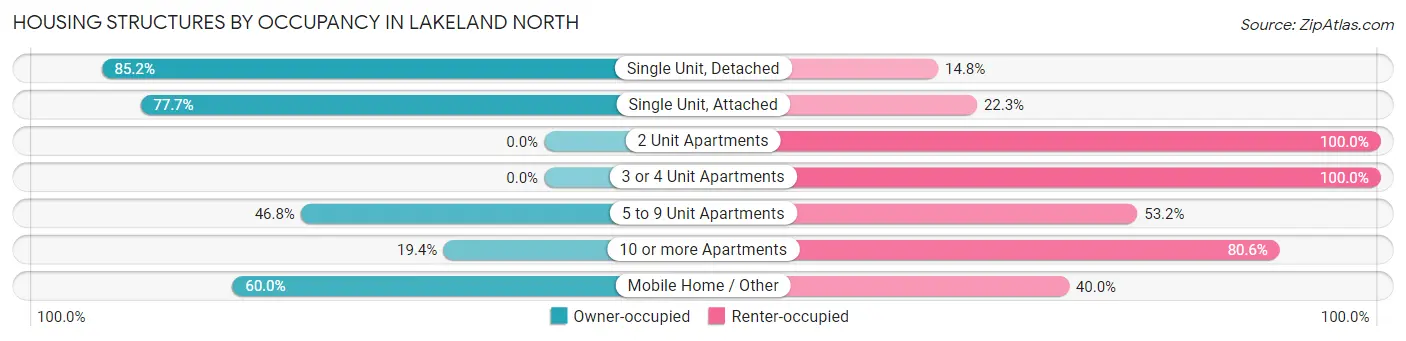
| Structure Type | Owner-occupied | Renter-occupied |
| Single Unit, Detached | 3,146 (85.2%) | 547 (14.8%) |
| Single Unit, Attached | 359 (77.7%) | 103 (22.3%) |
| 2 Unit Apartments | 0 (0.0%) | 213 (100.0%) |
| 3 or 4 Unit Apartments | 0 (0.0%) | 33 (100.0%) |
| 5 to 9 Unit Apartments | 74 (46.8%) | 84 (53.2%) |
| 10 or more Apartments | 47 (19.4%) | 195 (80.6%) |
| Mobile Home / Other | 72 (60.0%) | 48 (40.0%) |
| Total | 3,698 (75.1%) | 1,223 (24.8%) |
Housing Structures by Number of Rooms in Lakeland North
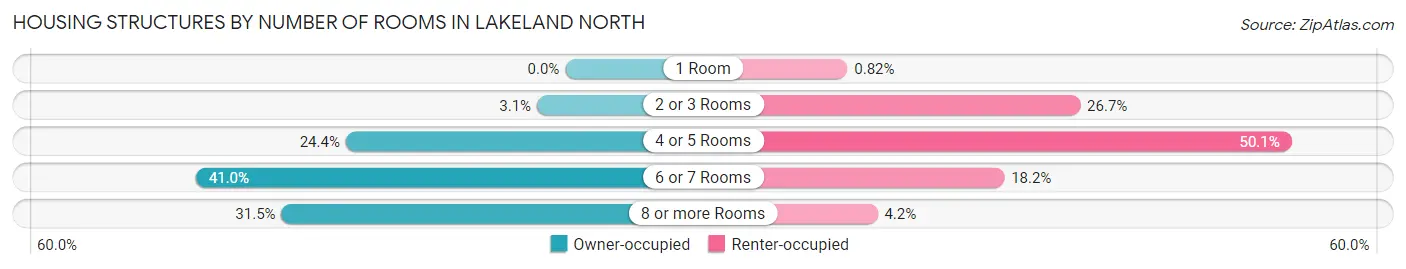
| Number of Rooms | Owner-occupied | Renter-occupied |
| 1 Room | 0 (0.0%) | 10 (0.8%) |
| 2 or 3 Rooms | 116 (3.1%) | 326 (26.7%) |
| 4 or 5 Rooms | 901 (24.4%) | 613 (50.1%) |
| 6 or 7 Rooms | 1,516 (41.0%) | 223 (18.2%) |
| 8 or more Rooms | 1,165 (31.5%) | 51 (4.2%) |
| Total | 3,698 (100.0%) | 1,223 (100.0%) |
Housing Structure by Heating Type in Lakeland North
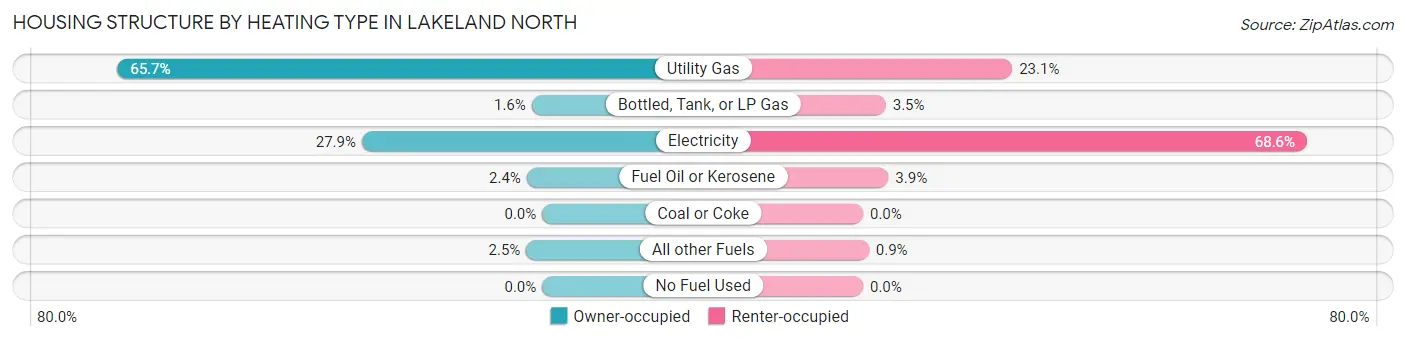
| Heating Type | Owner-occupied | Renter-occupied |
| Utility Gas | 2,428 (65.7%) | 282 (23.1%) |
| Bottled, Tank, or LP Gas | 60 (1.6%) | 43 (3.5%) |
| Electricity | 1,031 (27.9%) | 839 (68.6%) |
| Fuel Oil or Kerosene | 88 (2.4%) | 48 (3.9%) |
| Coal or Coke | 0 (0.0%) | 0 (0.0%) |
| All other Fuels | 91 (2.5%) | 11 (0.9%) |
| No Fuel Used | 0 (0.0%) | 0 (0.0%) |
| Total | 3,698 (100.0%) | 1,223 (100.0%) |
Household Vehicle Usage in Lakeland North
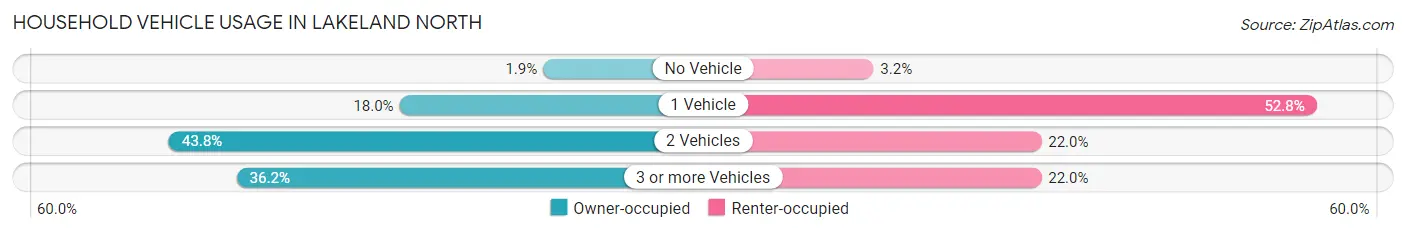
| Vehicles per Household | Owner-occupied | Renter-occupied |
| No Vehicle | 71 (1.9%) | 39 (3.2%) |
| 1 Vehicle | 666 (18.0%) | 646 (52.8%) |
| 2 Vehicles | 1,621 (43.8%) | 269 (22.0%) |
| 3 or more Vehicles | 1,340 (36.2%) | 269 (22.0%) |
| Total | 3,698 (100.0%) | 1,223 (100.0%) |
Real Estate & Mortgages in Lakeland North
Real Estate and Mortgage Overview in Lakeland North
| Characteristic | Without Mortgage | With Mortgage |
| Housing Units | 1,225 | 2,473 |
| Median Property Value | $418,000 | $498,100 |
| Median Household Income | $78,274 | $965 |
| Monthly Housing Costs | $698 | $505 |
| Real Estate Taxes | $4,702 | $57 |
Property Value by Mortgage Status in Lakeland North
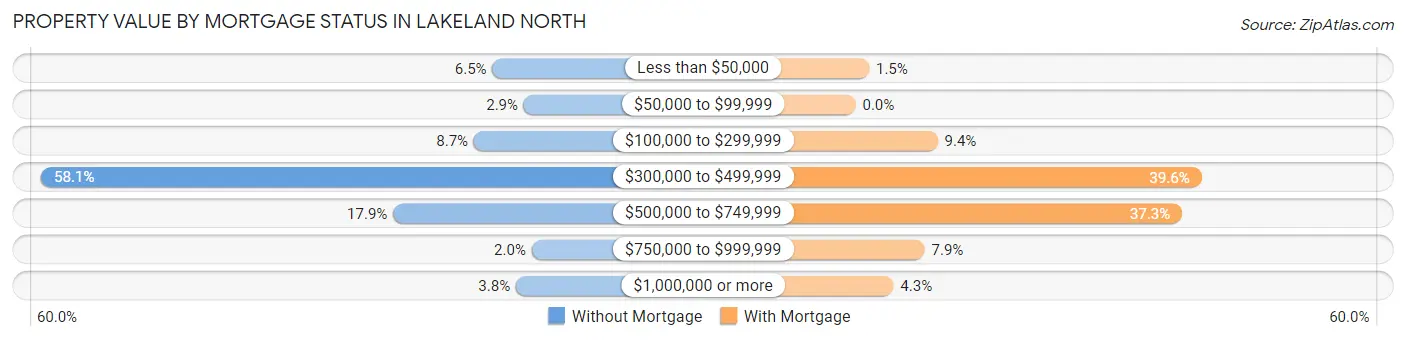
| Property Value | Without Mortgage | With Mortgage |
| Less than $50,000 | 80 (6.5%) | 38 (1.5%) |
| $50,000 to $99,999 | 36 (2.9%) | 0 (0.0%) |
| $100,000 to $299,999 | 106 (8.6%) | 232 (9.4%) |
| $300,000 to $499,999 | 712 (58.1%) | 978 (39.6%) |
| $500,000 to $749,999 | 219 (17.9%) | 923 (37.3%) |
| $750,000 to $999,999 | 25 (2.0%) | 195 (7.9%) |
| $1,000,000 or more | 47 (3.8%) | 107 (4.3%) |
| Total | 1,225 (100.0%) | 2,473 (100.0%) |
Household Income by Mortgage Status in Lakeland North
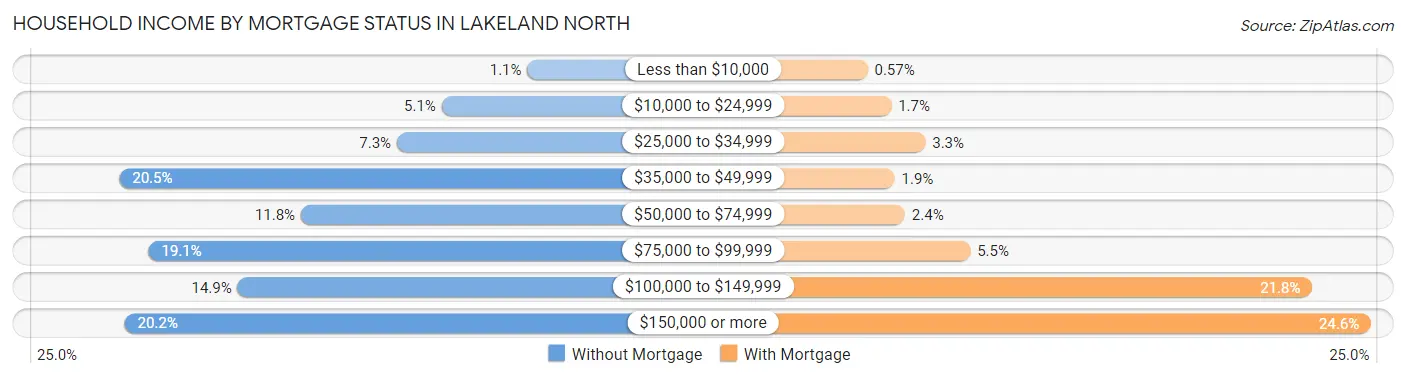
| Household Income | Without Mortgage | With Mortgage |
| Less than $10,000 | 13 (1.1%) | 14 (0.6%) |
| $10,000 to $24,999 | 63 (5.1%) | 42 (1.7%) |
| $25,000 to $34,999 | 89 (7.3%) | 82 (3.3%) |
| $35,000 to $49,999 | 251 (20.5%) | 46 (1.9%) |
| $50,000 to $74,999 | 145 (11.8%) | 58 (2.4%) |
| $75,000 to $99,999 | 234 (19.1%) | 135 (5.5%) |
| $100,000 to $149,999 | 182 (14.9%) | 538 (21.7%) |
| $150,000 or more | 248 (20.2%) | 607 (24.5%) |
| Total | 1,225 (100.0%) | 2,473 (100.0%) |
Property Value to Household Income Ratio in Lakeland North
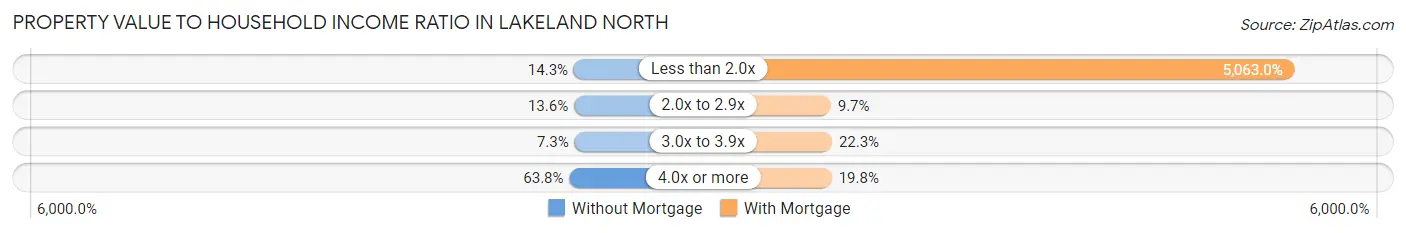
| Value-to-Income Ratio | Without Mortgage | With Mortgage |
| Less than 2.0x | 175 (14.3%) | 125,208 (5,063.0%) |
| 2.0x to 2.9x | 167 (13.6%) | 239 (9.7%) |
| 3.0x to 3.9x | 89 (7.3%) | 552 (22.3%) |
| 4.0x or more | 781 (63.8%) | 489 (19.8%) |
| Total | 1,225 (100.0%) | 2,473 (100.0%) |
Real Estate Taxes by Mortgage Status in Lakeland North
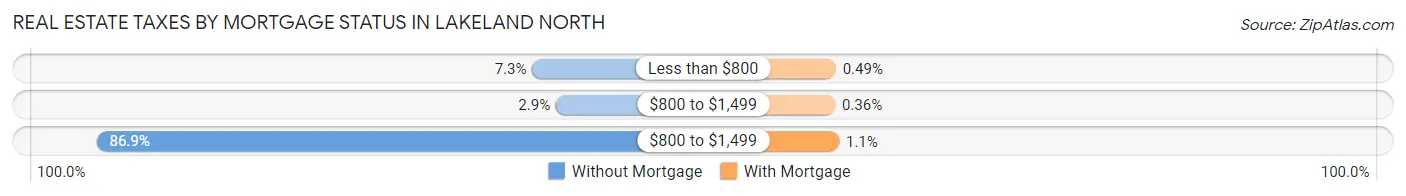
| Property Taxes | Without Mortgage | With Mortgage |
| Less than $800 | 89 (7.3%) | 12 (0.5%) |
| $800 to $1,499 | 36 (2.9%) | 9 (0.4%) |
| $800 to $1,499 | 1,064 (86.9%) | 27 (1.1%) |
| Total | 1,225 (100.0%) | 2,473 (100.0%) |
Health & Disability in Lakeland North
Health Insurance Coverage by Age in Lakeland North
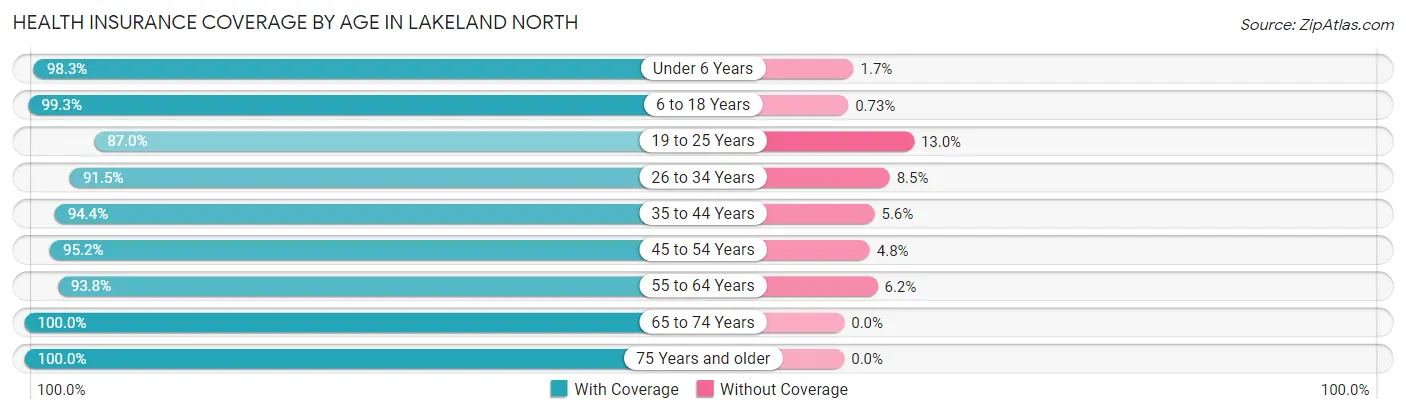
| Age Bracket | With Coverage | Without Coverage |
| Under 6 Years | 678 (98.3%) | 12 (1.7%) |
| 6 to 18 Years | 3,253 (99.3%) | 24 (0.7%) |
| 19 to 25 Years | 770 (87.0%) | 115 (13.0%) |
| 26 to 34 Years | 1,426 (91.5%) | 132 (8.5%) |
| 35 to 44 Years | 1,640 (94.4%) | 98 (5.6%) |
| 45 to 54 Years | 2,220 (95.2%) | 111 (4.8%) |
| 55 to 64 Years | 2,012 (93.8%) | 133 (6.2%) |
| 65 to 74 Years | 1,412 (100.0%) | 0 (0.0%) |
| 75 Years and older | 924 (100.0%) | 0 (0.0%) |
| Total | 14,335 (95.8%) | 625 (4.2%) |
Health Insurance Coverage by Citizenship Status in Lakeland North
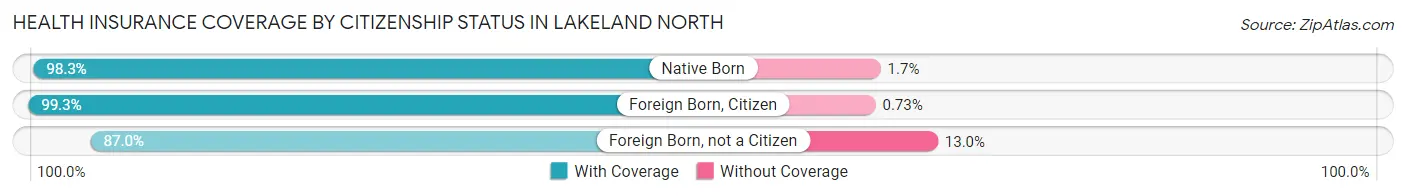
| Citizenship Status | With Coverage | Without Coverage |
| Native Born | 678 (98.3%) | 12 (1.7%) |
| Foreign Born, Citizen | 3,253 (99.3%) | 24 (0.7%) |
| Foreign Born, not a Citizen | 770 (87.0%) | 115 (13.0%) |
Health Insurance Coverage by Household Income in Lakeland North
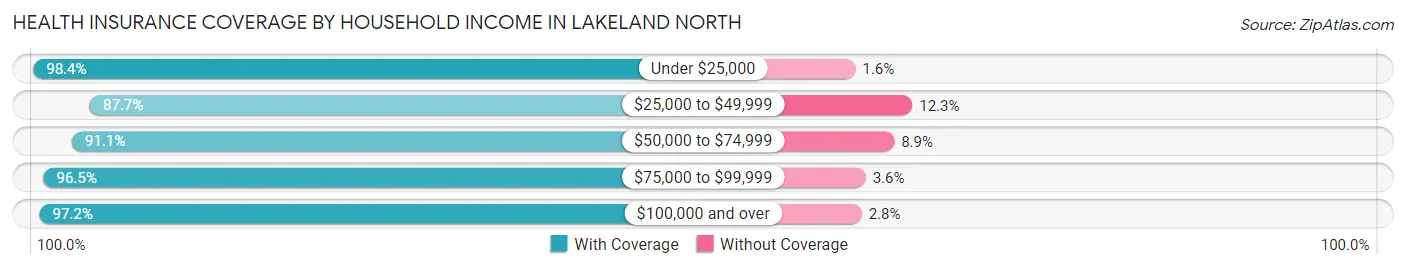
| Household Income | With Coverage | Without Coverage |
| Under $25,000 | 719 (98.4%) | 12 (1.6%) |
| $25,000 to $49,999 | 1,079 (87.7%) | 151 (12.3%) |
| $50,000 to $74,999 | 1,097 (91.1%) | 107 (8.9%) |
| $75,000 to $99,999 | 3,452 (96.5%) | 127 (3.5%) |
| $100,000 and over | 7,905 (97.2%) | 228 (2.8%) |
Public vs Private Health Insurance Coverage by Age in Lakeland North
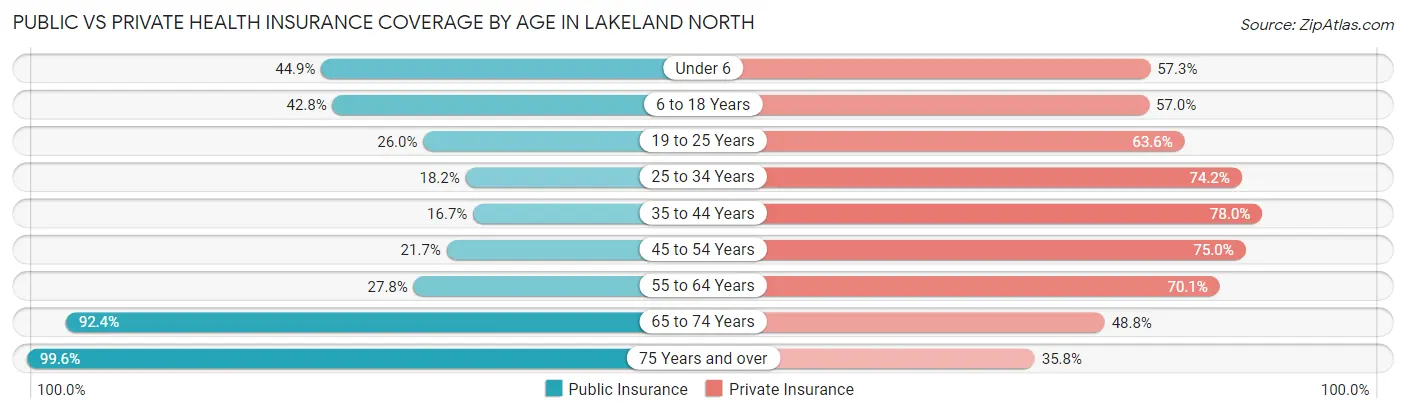
| Age Bracket | Public Insurance | Private Insurance |
| Under 6 | 310 (44.9%) | 395 (57.3%) |
| 6 to 18 Years | 1,404 (42.8%) | 1,869 (57.0%) |
| 19 to 25 Years | 230 (26.0%) | 563 (63.6%) |
| 25 to 34 Years | 283 (18.2%) | 1,156 (74.2%) |
| 35 to 44 Years | 291 (16.7%) | 1,356 (78.0%) |
| 45 to 54 Years | 505 (21.7%) | 1,747 (75.0%) |
| 55 to 64 Years | 596 (27.8%) | 1,504 (70.1%) |
| 65 to 74 Years | 1,304 (92.3%) | 689 (48.8%) |
| 75 Years and over | 920 (99.6%) | 331 (35.8%) |
| Total | 5,843 (39.1%) | 9,610 (64.2%) |
Disability Status by Sex by Age in Lakeland North
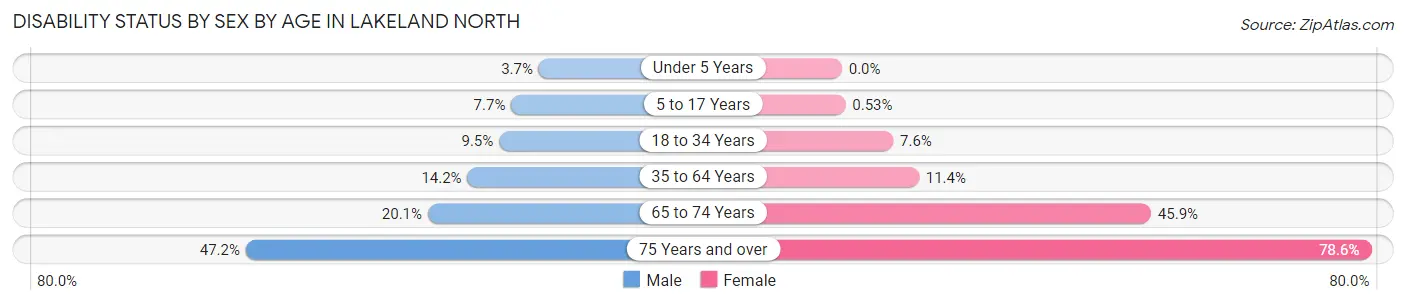
| Age Bracket | Male | Female |
| Under 5 Years | 12 (3.6%) | 0 (0.0%) |
| 5 to 17 Years | 128 (7.7%) | 7 (0.5%) |
| 18 to 34 Years | 111 (9.5%) | 127 (7.6%) |
| 35 to 64 Years | 415 (14.2%) | 377 (11.4%) |
| 65 to 74 Years | 132 (20.1%) | 347 (45.9%) |
| 75 Years and over | 158 (47.2%) | 463 (78.6%) |
Disability Class by Sex by Age in Lakeland North
Disability Class: Hearing Difficulty
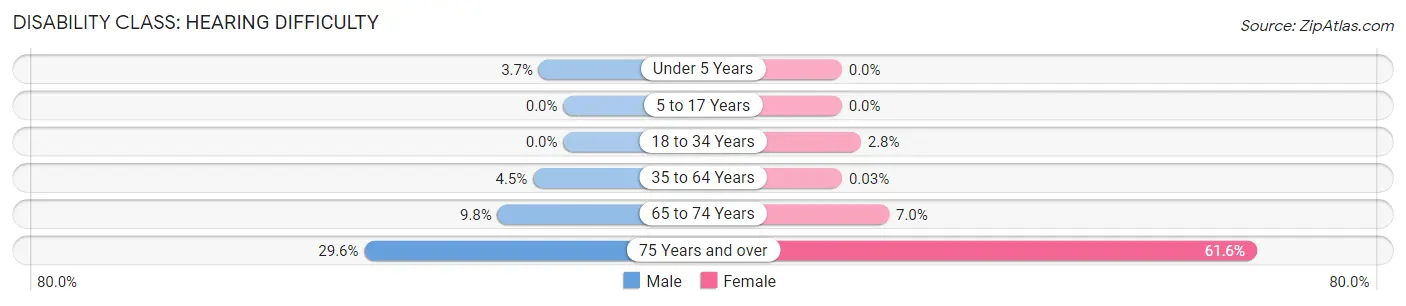
| Age Bracket | Male | Female |
| Under 5 Years | 12 (3.6%) | 0 (0.0%) |
| 5 to 17 Years | 0 (0.0%) | 0 (0.0%) |
| 18 to 34 Years | 0 (0.0%) | 47 (2.8%) |
| 35 to 64 Years | 131 (4.5%) | 1 (0.0%) |
| 65 to 74 Years | 64 (9.8%) | 53 (7.0%) |
| 75 Years and over | 99 (29.5%) | 363 (61.6%) |
Disability Class: Vision Difficulty
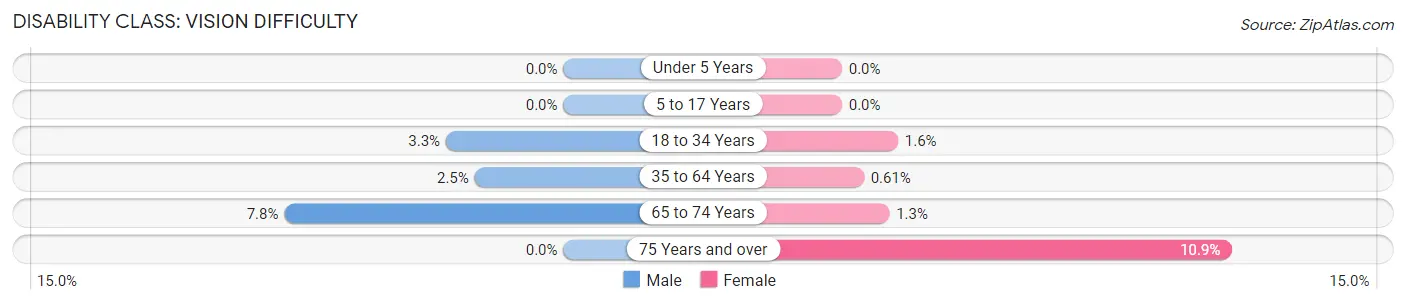
| Age Bracket | Male | Female |
| Under 5 Years | 0 (0.0%) | 0 (0.0%) |
| 5 to 17 Years | 0 (0.0%) | 0 (0.0%) |
| 18 to 34 Years | 38 (3.3%) | 26 (1.6%) |
| 35 to 64 Years | 72 (2.5%) | 20 (0.6%) |
| 65 to 74 Years | 51 (7.8%) | 10 (1.3%) |
| 75 Years and over | 0 (0.0%) | 64 (10.9%) |
Disability Class: Cognitive Difficulty
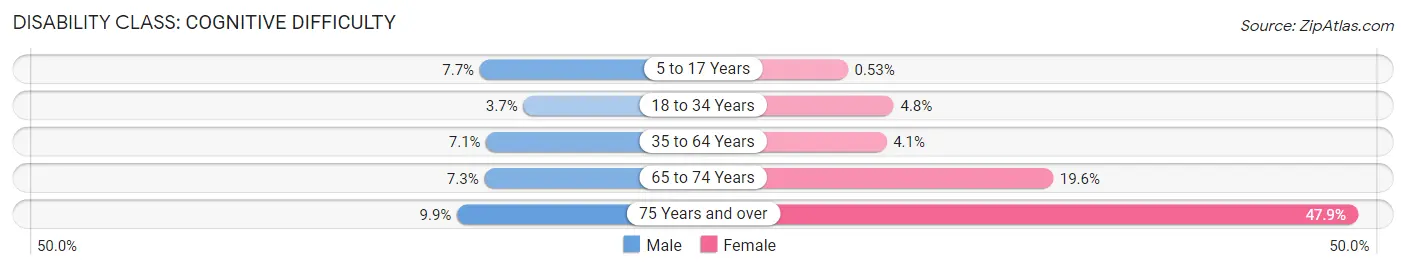
| Age Bracket | Male | Female |
| 5 to 17 Years | 128 (7.7%) | 7 (0.5%) |
| 18 to 34 Years | 43 (3.7%) | 80 (4.8%) |
| 35 to 64 Years | 208 (7.1%) | 136 (4.1%) |
| 65 to 74 Years | 48 (7.3%) | 148 (19.6%) |
| 75 Years and over | 33 (9.9%) | 282 (47.9%) |
Disability Class: Ambulatory Difficulty
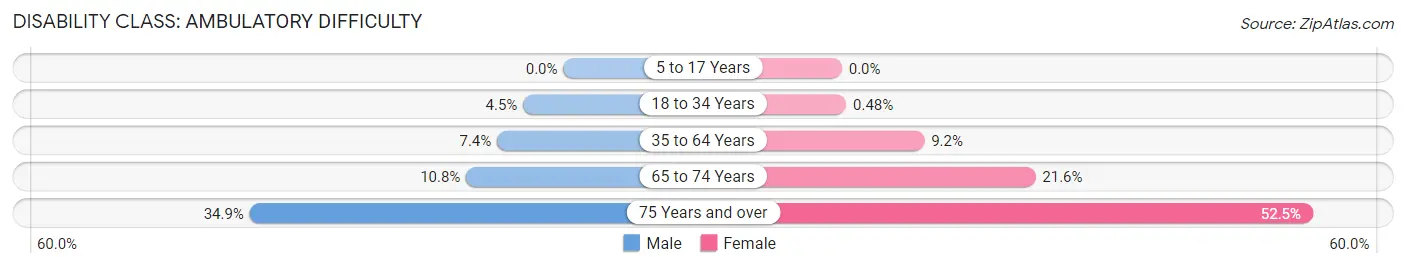
| Age Bracket | Male | Female |
| 5 to 17 Years | 0 (0.0%) | 0 (0.0%) |
| 18 to 34 Years | 52 (4.5%) | 8 (0.5%) |
| 35 to 64 Years | 215 (7.4%) | 303 (9.2%) |
| 65 to 74 Years | 71 (10.8%) | 163 (21.6%) |
| 75 Years and over | 117 (34.9%) | 309 (52.5%) |
Disability Class: Self-Care Difficulty
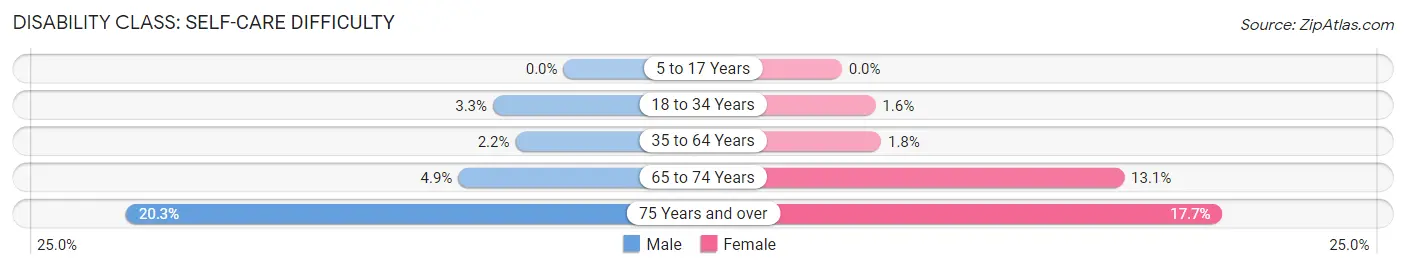
| Age Bracket | Male | Female |
| 5 to 17 Years | 0 (0.0%) | 0 (0.0%) |
| 18 to 34 Years | 38 (3.3%) | 26 (1.6%) |
| 35 to 64 Years | 65 (2.2%) | 60 (1.8%) |
| 65 to 74 Years | 32 (4.9%) | 99 (13.1%) |
| 75 Years and over | 68 (20.3%) | 104 (17.7%) |
Technology Access in Lakeland North
Computing Device Access in Lakeland North
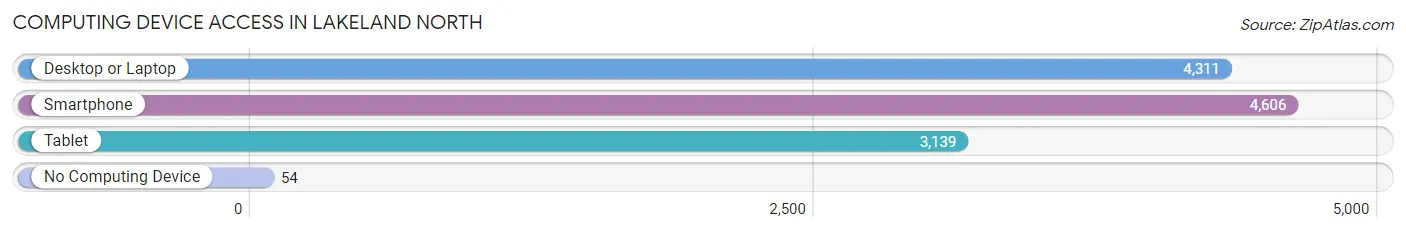
| Device Type | # Households | % Households |
| Desktop or Laptop | 4,311 | 87.6% |
| Smartphone | 4,606 | 93.6% |
| Tablet | 3,139 | 63.8% |
| No Computing Device | 54 | 1.1% |
| Total | 4,921 | 100.0% |
Internet Access in Lakeland North
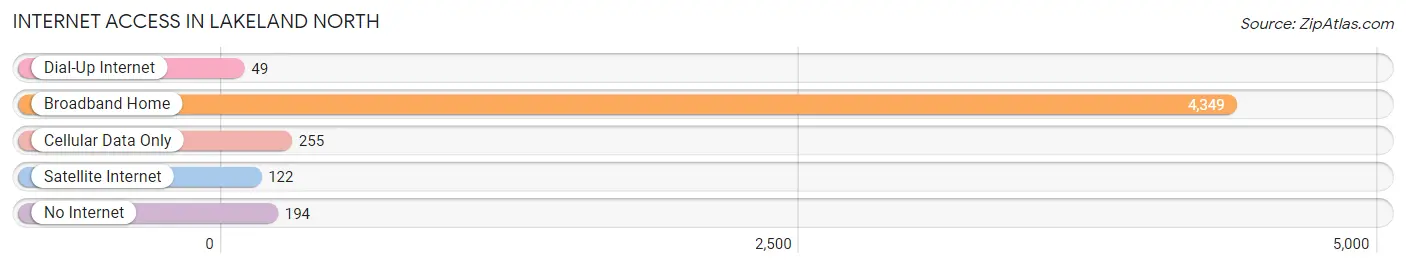
| Internet Type | # Households | % Households |
| Dial-Up Internet | 49 | 1.0% |
| Broadband Home | 4,349 | 88.4% |
| Cellular Data Only | 255 | 5.2% |
| Satellite Internet | 122 | 2.5% |
| No Internet | 194 | 3.9% |
| Total | 4,921 | 100.0% |
Lakeland North Summary
Lakeland North is a small unincorporated community located in Pierce County, Washington, United States. It is situated in the foothills of the Cascade Mountains, approximately 25 miles northeast of Tacoma and 40 miles south of Seattle. The community is bordered by the cities of Bonney Lake, Sumner, and Orting.
History
The area that is now Lakeland North was first settled in the late 1800s by homesteaders. The first post office was established in 1891 and the community was officially named Lakeland North in 1895. The area was primarily used for logging and farming until the 1950s when the population began to grow.
In the 1960s, the area began to experience rapid growth as people moved to the area for its rural lifestyle and proximity to larger cities. The population continued to grow throughout the 1970s and 1980s, and by the 1990s, the area had become a popular bedroom community for commuters to Seattle and Tacoma.
Geography
Lakeland North is located in the foothills of the Cascade Mountains, approximately 25 miles northeast of Tacoma and 40 miles south of Seattle. The community is bordered by the cities of Bonney Lake, Sumner, and Orting. The area is characterized by rolling hills, forests, and wetlands. The climate is mild and temperate, with warm summers and cool winters.
Economy
The economy of Lakeland North is primarily driven by the service industry. The area is home to a variety of businesses, including restaurants, retail stores, and professional services. The area also has a thriving agricultural sector, with many local farms producing fruits, vegetables, and dairy products.
Demographics
As of the 2010 census, the population of Lakeland North was 8,845. The racial makeup of the community was 87.3% White, 5.2% Hispanic or Latino, 2.7% Asian, 1.7% African American, and 0.7% Native American. The median household income was $63,945, and the median age was 37.
Conclusion
Lakeland North is a small unincorporated community located in Pierce County, Washington. It is situated in the foothills of the Cascade Mountains, approximately 25 miles northeast of Tacoma and 40 miles south of Seattle. The area was first settled in the late 1800s and has since become a popular bedroom community for commuters to Seattle and Tacoma. The economy of Lakeland North is primarily driven by the service industry, and the population is diverse, with a median household income of $63,945 and a median age of 37.
Common Questions
What is Per Capita Income in Lakeland North?
Per Capita income in Lakeland North is $43,577.
What is the Median Family Income in Lakeland North?
Median Family Income in Lakeland North is $109,402.
What is the Median Household income in Lakeland North?
Median Household Income in Lakeland North is $101,969.
What is Income or Wage Gap in Lakeland North?
Income or Wage Gap in Lakeland North is 36.1%.
Women in Lakeland North earn 63.9 cents for every dollar earned by a man.
What is Family Income Deficit in Lakeland North?
Family Income Deficit in Lakeland North is $5,801.
Families that are below poverty line in Lakeland North earn $5,801 less on average than the poverty threshold level.
What is Inequality or Gini Index in Lakeland North?
Inequality or Gini Index in Lakeland North is 0.42.
What is the Total Population of Lakeland North?
Total Population of Lakeland North is 14,960.
What is the Total Male Population of Lakeland North?
Total Male Population of Lakeland North is 7,051.
What is the Total Female Population of Lakeland North?
Total Female Population of Lakeland North is 7,909.
What is the Ratio of Males per 100 Females in Lakeland North?
There are 89.15 Males per 100 Females in Lakeland North.
What is the Ratio of Females per 100 Males in Lakeland North?
There are 112.17 Females per 100 Males in Lakeland North.
What is the Median Population Age in Lakeland North?
Median Population Age in Lakeland North is 41.5 Years.
What is the Average Family Size in Lakeland North
Average Family Size in Lakeland North is 3.5 People.
What is the Average Household Size in Lakeland North
Average Household Size in Lakeland North is 3.0 People.
How Large is the Labor Force in Lakeland North?
There are 7,754 People in the Labor Forcein in Lakeland North.
What is the Percentage of People in the Labor Force in Lakeland North?
64.1% of People are in the Labor Force in Lakeland North.
What is the Unemployment Rate in Lakeland North?
Unemployment Rate in Lakeland North is 5.1%.