Ferndale, WA Map & Demographics
Ferndale Map
Ferndale Overview
$33,508
PER CAPITA INCOME
$91,352
AVG FAMILY INCOME
$82,466
AVG HOUSEHOLD INCOME
35.0%
WAGE / INCOME GAP [ % ]
65.0¢/ $1
WAGE / INCOME GAP [ $ ]
$4,392
FAMILY INCOME DEFICIT
0.39
INEQUALITY / GINI INDEX
15,130
TOTAL POPULATION
7,165
MALE POPULATION
7,965
FEMALE POPULATION
89.96
MALES / 100 FEMALES
111.17
FEMALES / 100 MALES
32.9
MEDIAN AGE
3.4
AVG FAMILY SIZE
2.9
AVG HOUSEHOLD SIZE
7,319
LABOR FORCE [ PEOPLE ]
65.1%
PERCENT IN LABOR FORCE
3.3%
UNEMPLOYMENT RATE
Ferndale Zip Codes
Ferndale Area Codes
Income in Ferndale
Income Overview in Ferndale
Per Capita Income in Ferndale is $33,508, while median incomes of families and households are $91,352 and $82,466 respectively.
| Characteristic | Number | Measure |
| Per Capita Income | 15,130 | $33,508 |
| Median Family Income | 3,823 | $91,352 |
| Mean Family Income | 3,823 | $105,438 |
| Median Household Income | 5,179 | $82,466 |
| Mean Household Income | 5,179 | $94,776 |
| Income Deficit | 3,823 | $4,392 |
| Wage / Income Gap (%) | 15,130 | 35.05% |
| Wage / Income Gap ($) | 15,130 | 64.95¢ per $1 |
| Gini / Inequality Index | 15,130 | 0.39 |
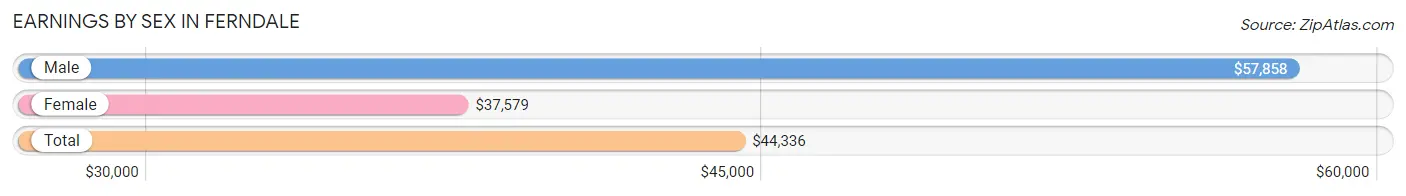
Earnings by Sex in Ferndale
Average Earnings in Ferndale are $44,336, $57,858 for men and $37,579 for women, a difference of 35.0%.
| Sex | Number | Average Earnings |
| Male | 4,015 (53.3%) | $57,858 |
| Female | 3,516 (46.7%) | $37,579 |
| Total | 7,531 (100.0%) | $44,336 |
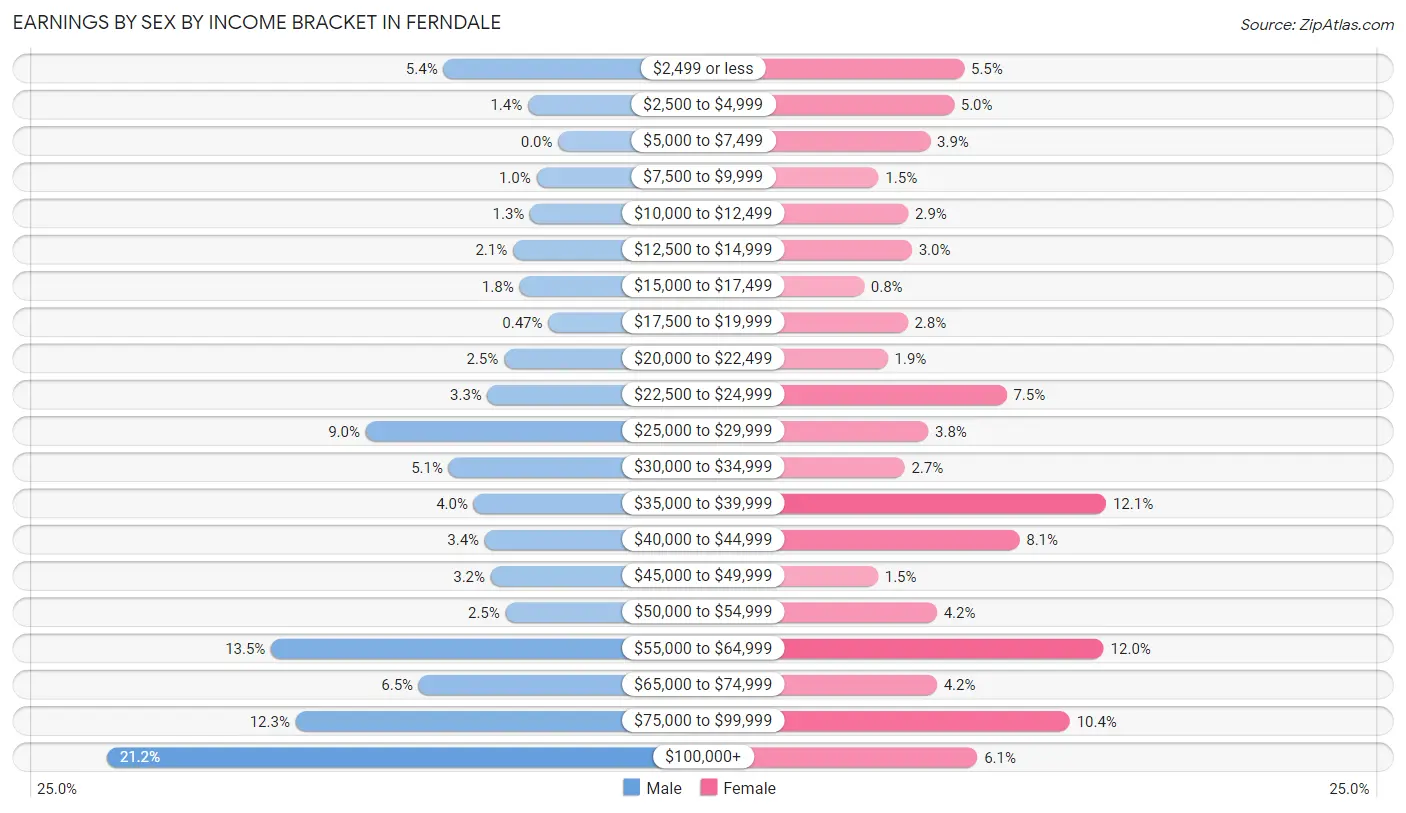
Earnings by Sex by Income Bracket in Ferndale
The most common earnings brackets in Ferndale are $100,000+ for men (849 | 21.1%) and $35,000 to $39,999 for women (427 | 12.1%).
| Income | Male | Female |
| $2,499 or less | 216 (5.4%) | 193 (5.5%) |
| $2,500 to $4,999 | 57 (1.4%) | 176 (5.0%) |
| $5,000 to $7,499 | 0 (0.0%) | 137 (3.9%) |
| $7,500 to $9,999 | 41 (1.0%) | 52 (1.5%) |
| $10,000 to $12,499 | 53 (1.3%) | 101 (2.9%) |
| $12,500 to $14,999 | 85 (2.1%) | 107 (3.0%) |
| $15,000 to $17,499 | 73 (1.8%) | 28 (0.8%) |
| $17,500 to $19,999 | 19 (0.5%) | 100 (2.8%) |
| $20,000 to $22,499 | 102 (2.5%) | 67 (1.9%) |
| $22,500 to $24,999 | 133 (3.3%) | 263 (7.5%) |
| $25,000 to $29,999 | 362 (9.0%) | 134 (3.8%) |
| $30,000 to $34,999 | 206 (5.1%) | 95 (2.7%) |
| $35,000 to $39,999 | 159 (4.0%) | 427 (12.1%) |
| $40,000 to $44,999 | 138 (3.4%) | 284 (8.1%) |
| $45,000 to $49,999 | 127 (3.2%) | 51 (1.5%) |
| $50,000 to $54,999 | 99 (2.5%) | 148 (4.2%) |
| $55,000 to $64,999 | 540 (13.5%) | 423 (12.0%) |
| $65,000 to $74,999 | 262 (6.5%) | 148 (4.2%) |
| $75,000 to $99,999 | 494 (12.3%) | 367 (10.4%) |
| $100,000+ | 849 (21.1%) | 215 (6.1%) |
| Total | 4,015 (100.0%) | 3,516 (100.0%) |
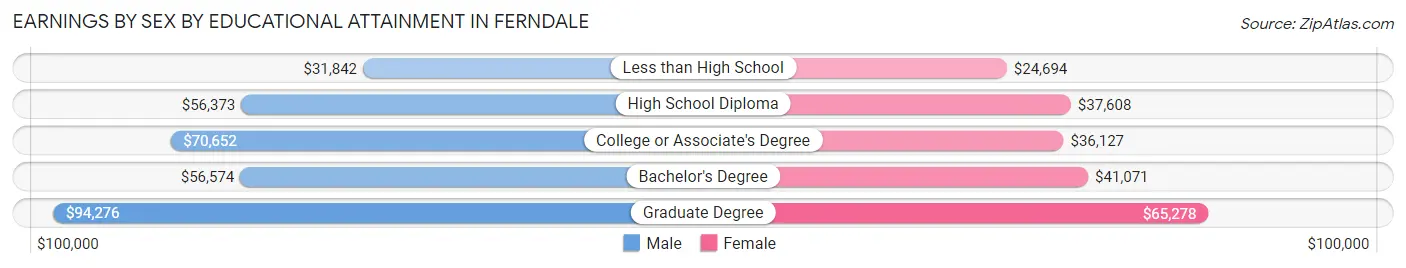
Earnings by Sex by Educational Attainment in Ferndale
Average earnings in Ferndale are $61,856 for men and $40,899 for women, a difference of 33.9%. Men with an educational attainment of graduate degree enjoy the highest average annual earnings of $94,276, while those with less than high school education earn the least with $31,842. Women with an educational attainment of graduate degree earn the most with the average annual earnings of $65,278, while those with less than high school education have the smallest earnings of $24,694.
| Educational Attainment | Male Income | Female Income |
| Less than High School | $31,842 | $24,694 |
| High School Diploma | $56,373 | $37,608 |
| College or Associate's Degree | $70,652 | $36,127 |
| Bachelor's Degree | $56,574 | $41,071 |
| Graduate Degree | $94,276 | $65,278 |
| Total | $61,856 | $40,899 |
Family Income in Ferndale
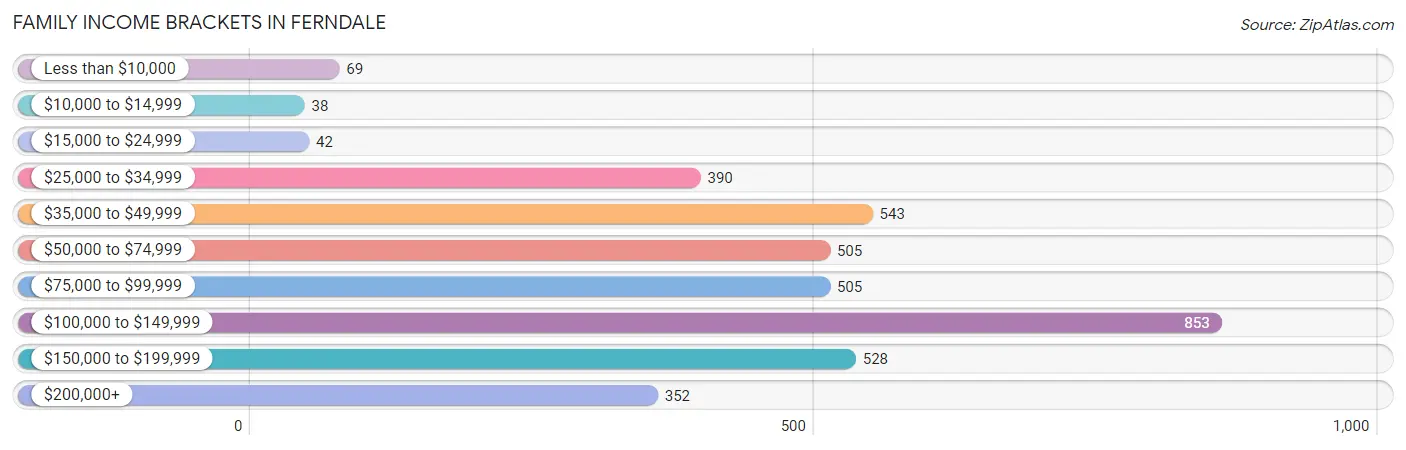
Family Income Brackets in Ferndale
According to the Ferndale family income data, there are 853 families falling into the $100,000 to $149,999 income range, which is the most common income bracket and makes up 22.3% of all families. Conversely, the $10,000 to $14,999 income bracket is the least frequent group with only 38 families (1.0%) belonging to this category.
| Income Bracket | # Families | % Families |
| Less than $10,000 | 69 | 1.8% |
| $10,000 to $14,999 | 38 | 1.0% |
| $15,000 to $24,999 | 42 | 1.1% |
| $25,000 to $34,999 | 390 | 10.2% |
| $35,000 to $49,999 | 543 | 14.2% |
| $50,000 to $74,999 | 505 | 13.2% |
| $75,000 to $99,999 | 505 | 13.2% |
| $100,000 to $149,999 | 853 | 22.3% |
| $150,000 to $199,999 | 528 | 13.8% |
| $200,000+ | 352 | 9.2% |
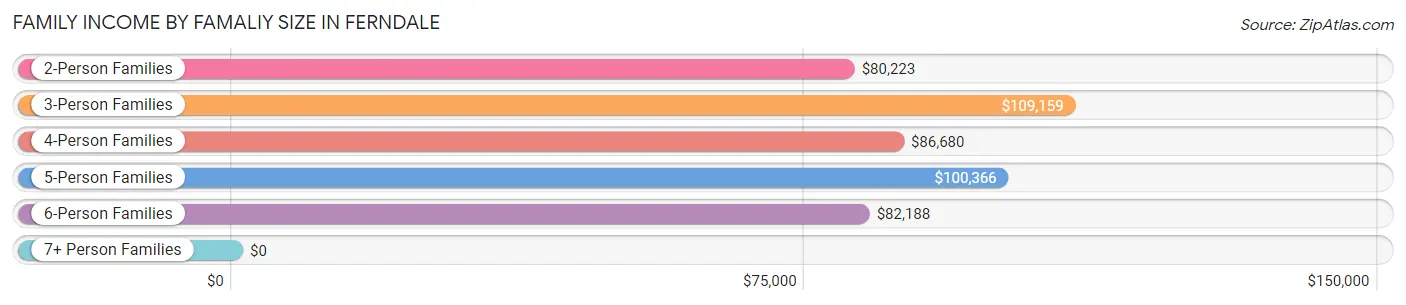
Family Income by Famaliy Size in Ferndale
3-person families (813 | 21.3%) account for the highest median family income in Ferndale with $109,159 per family, while 2-person families (1,253 | 32.8%) have the highest median income of $40,112 per family member.
| Income Bracket | # Families | Median Income |
| 2-Person Families | 1,253 (32.8%) | $80,223 |
| 3-Person Families | 813 (21.3%) | $109,159 |
| 4-Person Families | 1,125 (29.4%) | $86,680 |
| 5-Person Families | 536 (14.0%) | $100,366 |
| 6-Person Families | 96 (2.5%) | $82,188 |
| 7+ Person Families | 0 (0.0%) | $0 |
| Total | 3,823 (100.0%) | $91,352 |
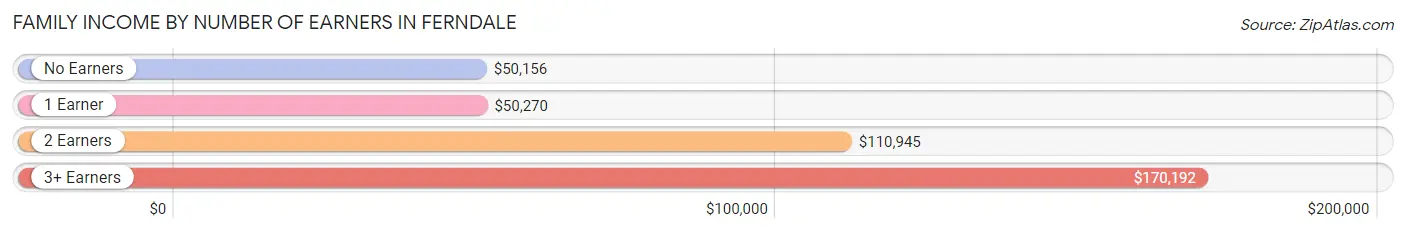
Family Income by Number of Earners in Ferndale
The median family income in Ferndale is $91,352, with families comprising 3+ earners (570) having the highest median family income of $170,192, while families with no earners (567) have the lowest median family income of $50,156, accounting for 14.9% and 14.8% of families, respectively.
| Number of Earners | # Families | Median Income |
| No Earners | 567 (14.8%) | $50,156 |
| 1 Earner | 1,448 (37.9%) | $50,270 |
| 2 Earners | 1,238 (32.4%) | $110,945 |
| 3+ Earners | 570 (14.9%) | $170,192 |
| Total | 3,823 (100.0%) | $91,352 |
Household Income in Ferndale
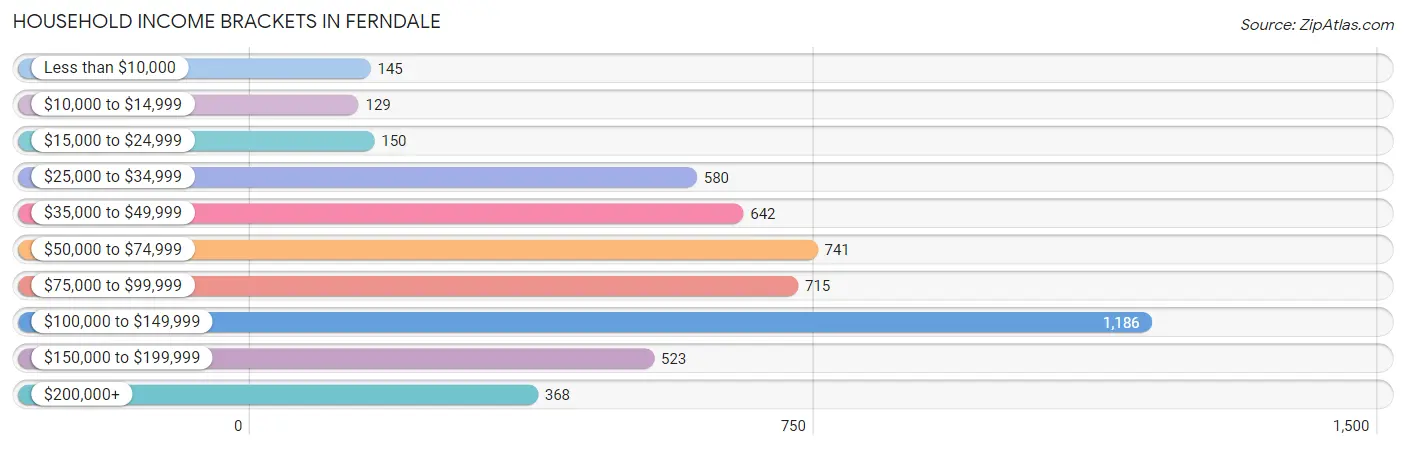
Household Income Brackets in Ferndale
With 1,186 households falling in the category, the $100,000 to $149,999 income range is the most frequent in Ferndale, accounting for 22.9% of all households. In contrast, only 129 households (2.5%) fall into the $10,000 to $14,999 income bracket, making it the least populous group.
| Income Bracket | # Households | % Households |
| Less than $10,000 | 145 | 2.8% |
| $10,000 to $14,999 | 129 | 2.5% |
| $15,000 to $24,999 | 150 | 2.9% |
| $25,000 to $34,999 | 580 | 11.2% |
| $35,000 to $49,999 | 642 | 12.4% |
| $50,000 to $74,999 | 741 | 14.3% |
| $75,000 to $99,999 | 715 | 13.8% |
| $100,000 to $149,999 | 1,186 | 22.9% |
| $150,000 to $199,999 | 523 | 10.1% |
| $200,000+ | 368 | 7.1% |
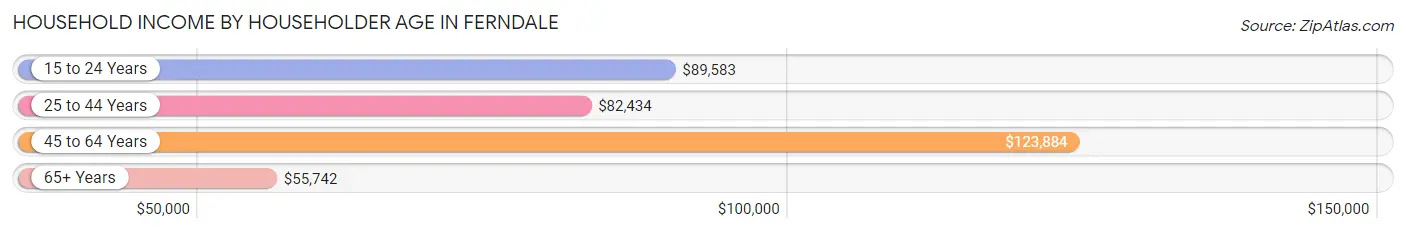
Household Income by Householder Age in Ferndale
The median household income in Ferndale is $82,466, with the highest median household income of $123,884 found in the 45 to 64 years age bracket for the primary householder. A total of 1,509 households (29.1%) fall into this category. Meanwhile, the 65+ years age bracket for the primary householder has the lowest median household income of $55,742, with 1,285 households (24.8%) in this group.
| Income Bracket | # Households | Median Income |
| 15 to 24 Years | 65 (1.3%) | $89,583 |
| 25 to 44 Years | 2,320 (44.8%) | $82,434 |
| 45 to 64 Years | 1,509 (29.1%) | $123,884 |
| 65+ Years | 1,285 (24.8%) | $55,742 |
| Total | 5,179 (100.0%) | $82,466 |
Poverty in Ferndale
Income Below Poverty by Sex and Age in Ferndale
With 12.0% poverty level for males and 9.9% for females among the residents of Ferndale, under 5 year old males and under 5 year old females are the most vulnerable to poverty, with 218 males (26.7%) and 178 females (33.3%) in their respective age groups living below the poverty level.
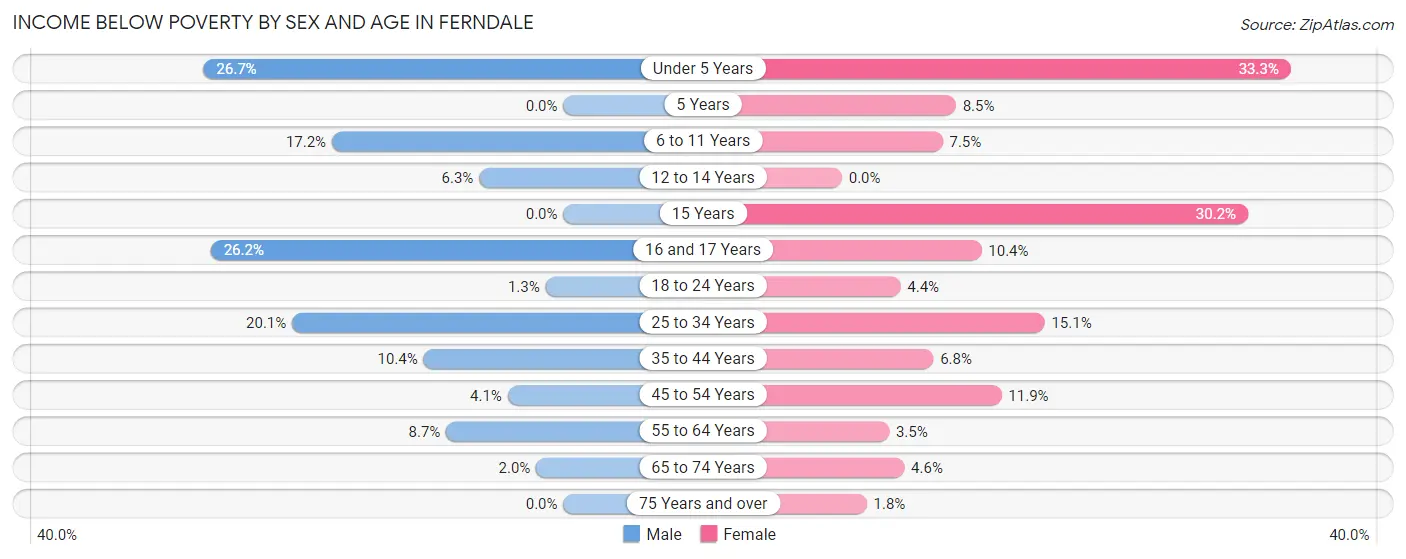
| Age Bracket | Male | Female |
| Under 5 Years | 218 (26.7%) | 178 (33.3%) |
| 5 Years | 0 (0.0%) | 11 (8.5%) |
| 6 to 11 Years | 90 (17.2%) | 60 (7.5%) |
| 12 to 14 Years | 15 (6.2%) | 0 (0.0%) |
| 15 Years | 0 (0.0%) | 41 (30.1%) |
| 16 and 17 Years | 61 (26.2%) | 29 (10.4%) |
| 18 to 24 Years | 8 (1.3%) | 15 (4.3%) |
| 25 to 34 Years | 265 (20.1%) | 209 (15.0%) |
| 35 to 44 Years | 85 (10.4%) | 80 (6.8%) |
| 45 to 54 Years | 36 (4.1%) | 94 (11.8%) |
| 55 to 64 Years | 59 (8.7%) | 22 (3.5%) |
| 65 to 74 Years | 12 (2.0%) | 36 (4.6%) |
| 75 Years and over | 0 (0.0%) | 10 (1.8%) |
| Total | 849 (12.0%) | 785 (9.9%) |
Income Above Poverty by Sex and Age in Ferndale
According to the poverty statistics in Ferndale, males aged 5 years and females aged 12 to 14 years are the age groups that are most secure financially, with 100.0% of males and 100.0% of females in these age groups living above the poverty line.
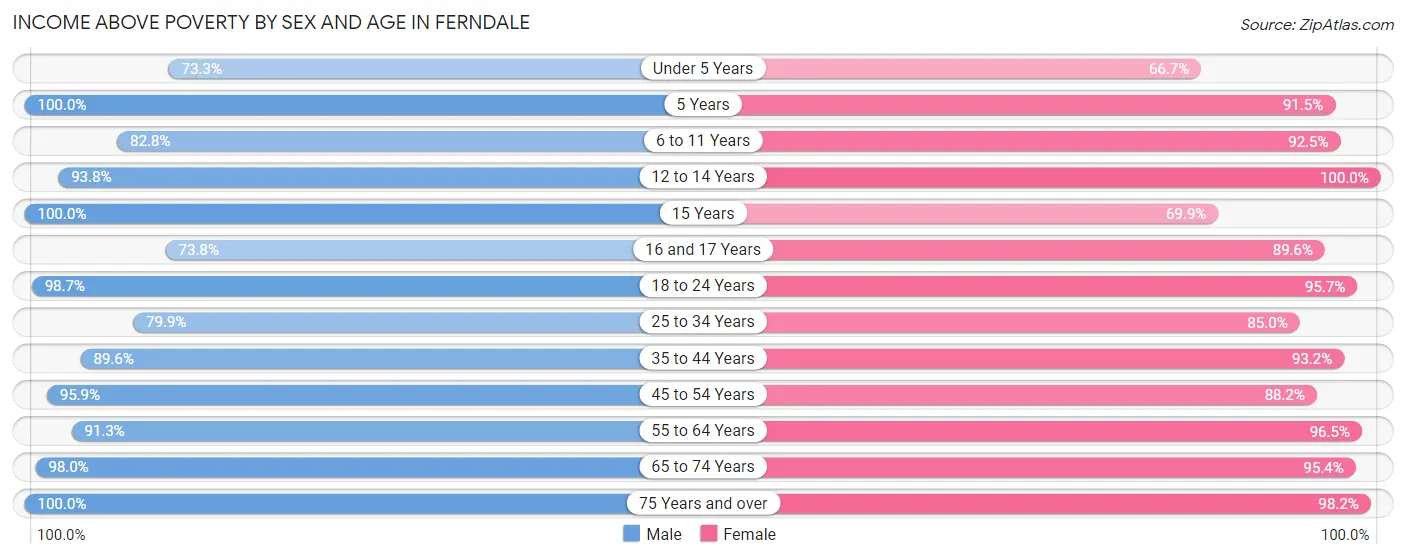
| Age Bracket | Male | Female |
| Under 5 Years | 598 (73.3%) | 356 (66.7%) |
| 5 Years | 192 (100.0%) | 119 (91.5%) |
| 6 to 11 Years | 434 (82.8%) | 742 (92.5%) |
| 12 to 14 Years | 225 (93.8%) | 366 (100.0%) |
| 15 Years | 26 (100.0%) | 95 (69.9%) |
| 16 and 17 Years | 172 (73.8%) | 251 (89.6%) |
| 18 to 24 Years | 599 (98.7%) | 330 (95.7%) |
| 25 to 34 Years | 1,051 (79.9%) | 1,180 (85.0%) |
| 35 to 44 Years | 734 (89.6%) | 1,098 (93.2%) |
| 45 to 54 Years | 835 (95.9%) | 699 (88.1%) |
| 55 to 64 Years | 619 (91.3%) | 606 (96.5%) |
| 65 to 74 Years | 583 (98.0%) | 741 (95.4%) |
| 75 Years and over | 181 (100.0%) | 534 (98.2%) |
| Total | 6,249 (88.0%) | 7,117 (90.1%) |
Income Below Poverty Among Married-Couple Families in Ferndale
The poverty statistics for married-couple families in Ferndale show that 10.5% or 303 of the total 2,889 families live below the poverty line. Families with 1 or 2 children have the highest poverty rate of 19.5%, comprising of 265 families. On the other hand, families with no children have the lowest poverty rate of 1.0%, which includes 12 families.
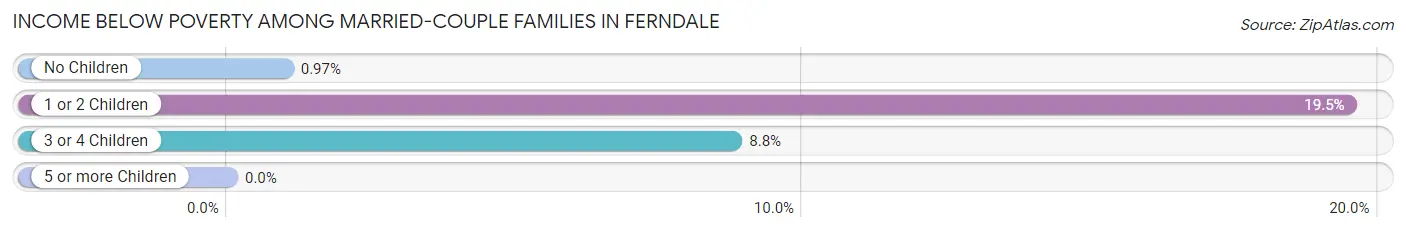
| Children | Above Poverty | Below Poverty |
| No Children | 1,220 (99.0%) | 12 (1.0%) |
| 1 or 2 Children | 1,096 (80.5%) | 265 (19.5%) |
| 3 or 4 Children | 270 (91.2%) | 26 (8.8%) |
| 5 or more Children | 0 (0.0%) | 0 (0.0%) |
| Total | 2,586 (89.5%) | 303 (10.5%) |
Income Below Poverty Among Single-Parent Households in Ferndale
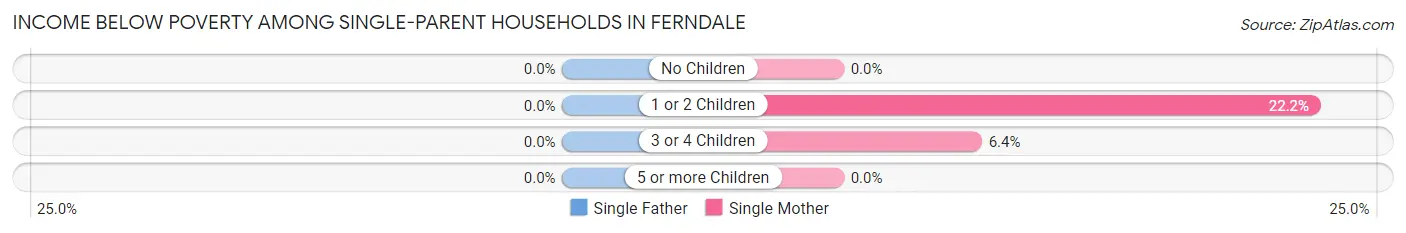
| Children | Single Father | Single Mother |
| No Children | 0 (0.0%) | 0 (0.0%) |
| 1 or 2 Children | 0 (0.0%) | 82 (22.2%) |
| 3 or 4 Children | 0 (0.0%) | 11 (6.4%) |
| 5 or more Children | 0 (0.0%) | 0 (0.0%) |
| Total | 0 (0.0%) | 93 (14.3%) |
Income Below Poverty Among Married-Couple vs Single-Parent Households in Ferndale
The poverty data for Ferndale shows that 303 of the married-couple family households (10.5%) and 93 of the single-parent households (10.0%) are living below the poverty level. Within the married-couple family households, those with 1 or 2 children have the highest poverty rate, with 265 households (19.5%) falling below the poverty line. Among the single-parent households, those with 1 or 2 children have the highest poverty rate, with 82 household (15.7%) living below poverty.
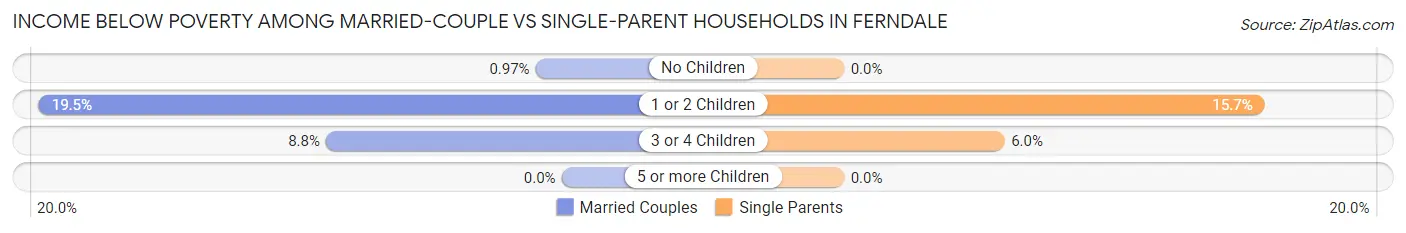
| Children | Married-Couple Families | Single-Parent Households |
| No Children | 12 (1.0%) | 0 (0.0%) |
| 1 or 2 Children | 265 (19.5%) | 82 (15.7%) |
| 3 or 4 Children | 26 (8.8%) | 11 (6.0%) |
| 5 or more Children | 0 (0.0%) | 0 (0.0%) |
| Total | 303 (10.5%) | 93 (10.0%) |
Race in Ferndale
The most populous races in Ferndale are White / Caucasian (11,748 | 77.6%), Hispanic or Latino (2,007 | 13.3%), and Two or more Races (1,119 | 7.4%).
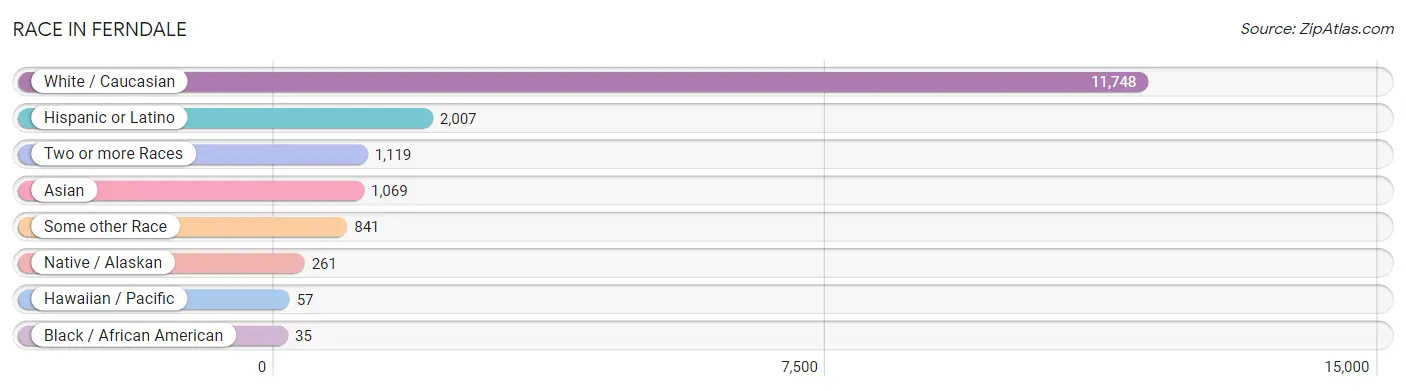
| Race | # Population | % Population |
| Asian | 1,069 | 7.1% |
| Black / African American | 35 | 0.2% |
| Hawaiian / Pacific | 57 | 0.4% |
| Hispanic or Latino | 2,007 | 13.3% |
| Native / Alaskan | 261 | 1.7% |
| White / Caucasian | 11,748 | 77.6% |
| Two or more Races | 1,119 | 7.4% |
| Some other Race | 841 | 5.6% |
| Total | 15,130 | 100.0% |
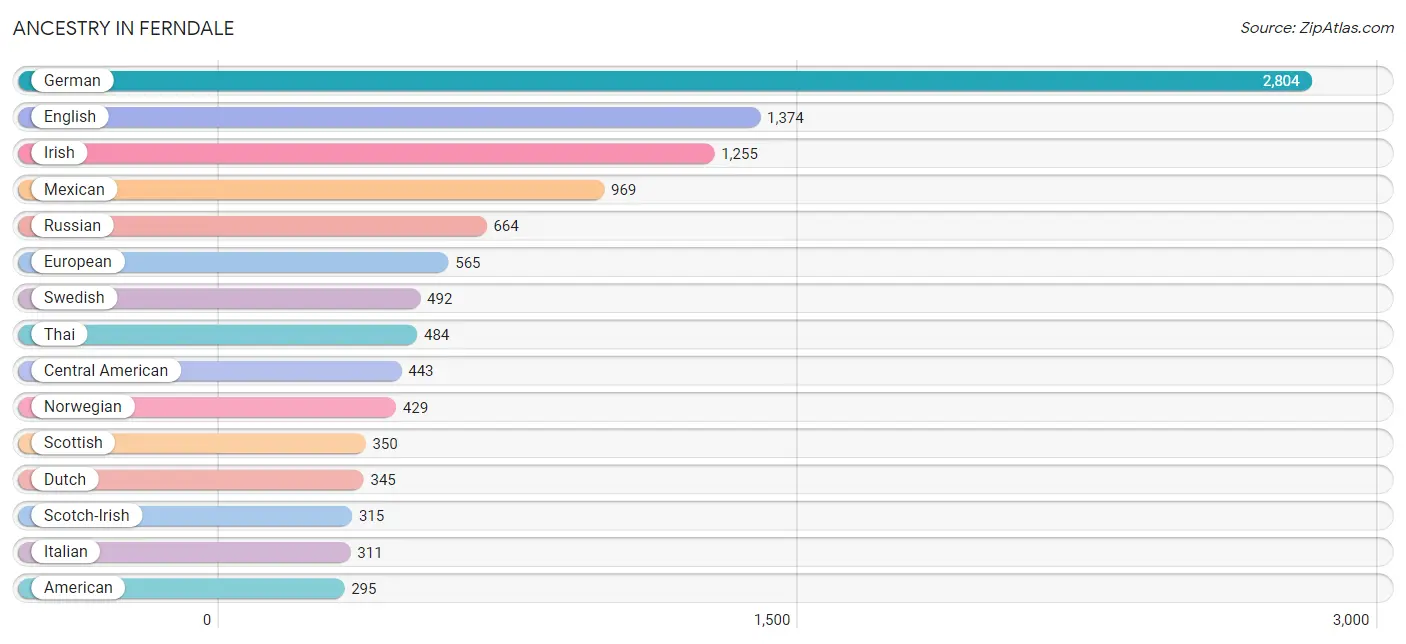
Ancestry in Ferndale
The most populous ancestries reported in Ferndale are German (2,804 | 18.5%), English (1,374 | 9.1%), Irish (1,255 | 8.3%), Mexican (969 | 6.4%), and Russian (664 | 4.4%), together accounting for 46.7% of all Ferndale residents.
| Ancestry | # Population | % Population |
| Afghan | 152 | 1.0% |
| American | 295 | 1.9% |
| Arab | 265 | 1.8% |
| Austrian | 24 | 0.2% |
| Belgian | 81 | 0.5% |
| Bhutanese | 269 | 1.8% |
| British | 59 | 0.4% |
| Canadian | 96 | 0.6% |
| Central American | 443 | 2.9% |
| Cherokee | 27 | 0.2% |
| Costa Rican | 79 | 0.5% |
| Czech | 12 | 0.1% |
| Danish | 69 | 0.5% |
| Dutch | 345 | 2.3% |
| Eastern European | 21 | 0.1% |
| English | 1,374 | 9.1% |
| Ethiopian | 13 | 0.1% |
| European | 565 | 3.7% |
| Finnish | 105 | 0.7% |
| French | 266 | 1.8% |
| French Canadian | 228 | 1.5% |
| German | 2,804 | 18.5% |
| Greek | 12 | 0.1% |
| Guatemalan | 266 | 1.8% |
| Honduran | 79 | 0.5% |
| Icelander | 134 | 0.9% |
| Iranian | 68 | 0.4% |
| Irish | 1,255 | 8.3% |
| Italian | 311 | 2.1% |
| Jamaican | 49 | 0.3% |
| Japanese | 48 | 0.3% |
| Korean | 235 | 1.5% |
| Lebanese | 233 | 1.5% |
| Lithuanian | 17 | 0.1% |
| Macedonian | 40 | 0.3% |
| Mexican | 969 | 6.4% |
| Native Hawaiian | 30 | 0.2% |
| Northern European | 129 | 0.9% |
| Norwegian | 429 | 2.8% |
| Pakistani | 40 | 0.3% |
| Palestinian | 32 | 0.2% |
| Peruvian | 17 | 0.1% |
| Polish | 240 | 1.6% |
| Portuguese | 29 | 0.2% |
| Potawatomi | 26 | 0.2% |
| Puerto Rican | 144 | 0.9% |
| Puget Sound Salish | 121 | 0.8% |
| Russian | 664 | 4.4% |
| Salvadoran | 19 | 0.1% |
| Samoan | 57 | 0.4% |
| Scandinavian | 190 | 1.3% |
| Scotch-Irish | 315 | 2.1% |
| Scottish | 350 | 2.3% |
| Serbian | 28 | 0.2% |
| Slavic | 20 | 0.1% |
| South American | 17 | 0.1% |
| Spaniard | 162 | 1.1% |
| Spanish | 58 | 0.4% |
| Sri Lankan | 158 | 1.0% |
| Subsaharan African | 13 | 0.1% |
| Swedish | 492 | 3.3% |
| Swiss | 39 | 0.3% |
| Thai | 484 | 3.2% |
| Tlingit-Haida | 68 | 0.4% |
| Ukrainian | 52 | 0.3% |
| Welsh | 180 | 1.2% |
| Yup'ik | 30 | 0.2% | View All 67 Rows |
Immigrants in Ferndale
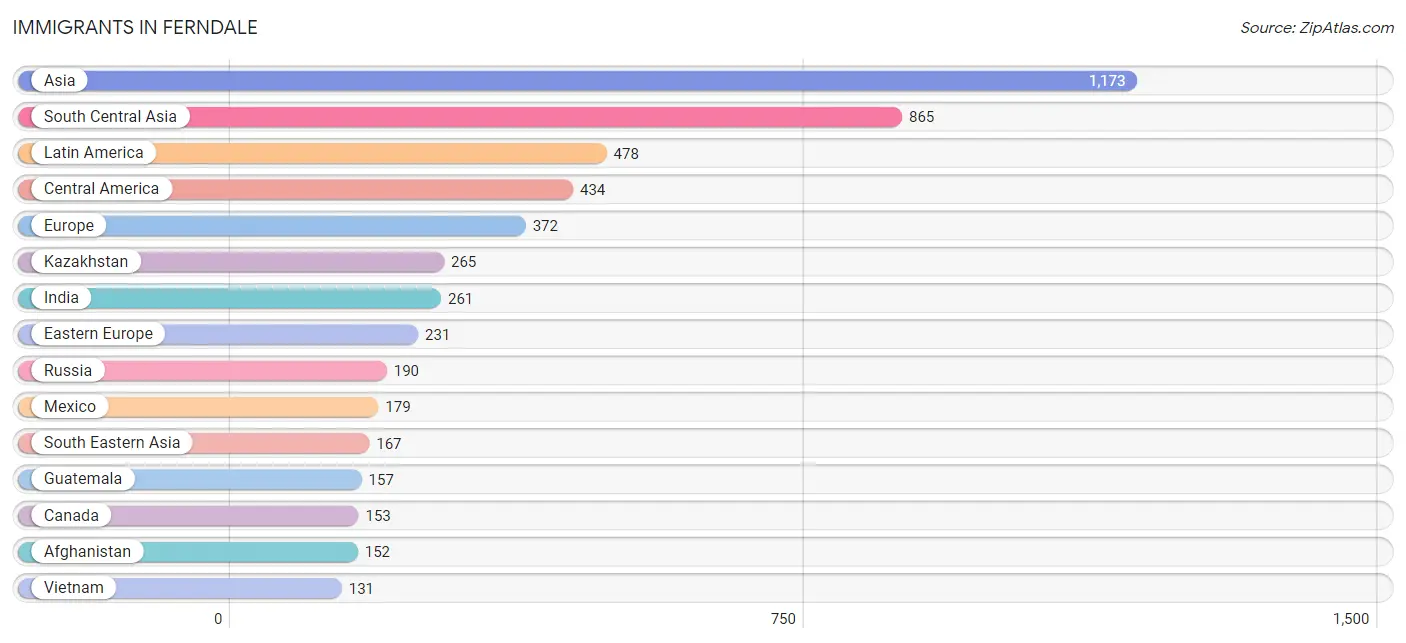
The most numerous immigrant groups reported in Ferndale came from Asia (1,173 | 7.7%), South Central Asia (865 | 5.7%), Latin America (478 | 3.2%), Central America (434 | 2.9%), and Europe (372 | 2.5%), together accounting for 22.0% of all Ferndale residents.
| Immigration Origin | # Population | % Population |
| Afghanistan | 152 | 1.0% |
| Asia | 1,173 | 7.7% |
| Brazil | 27 | 0.2% |
| Cambodia | 7 | 0.1% |
| Canada | 153 | 1.0% |
| Central America | 434 | 2.9% |
| Denmark | 7 | 0.1% |
| Eastern Asia | 15 | 0.1% |
| Eastern Europe | 231 | 1.5% |
| El Salvador | 19 | 0.1% |
| England | 8 | 0.1% |
| Europe | 372 | 2.5% |
| France | 46 | 0.3% |
| Guatemala | 157 | 1.0% |
| Honduras | 79 | 0.5% |
| India | 261 | 1.7% |
| Iran | 68 | 0.4% |
| Japan | 15 | 0.1% |
| Kazakhstan | 265 | 1.8% |
| Latin America | 478 | 3.2% |
| Lebanon | 126 | 0.8% |
| Mexico | 179 | 1.2% |
| Northern Europe | 95 | 0.6% |
| Pakistan | 119 | 0.8% |
| Peru | 17 | 0.1% |
| Philippines | 29 | 0.2% |
| Poland | 26 | 0.2% |
| Russia | 190 | 1.3% |
| Scotland | 35 | 0.2% |
| South America | 44 | 0.3% |
| South Central Asia | 865 | 5.7% |
| South Eastern Asia | 167 | 1.1% |
| Ukraine | 15 | 0.1% |
| Vietnam | 131 | 0.9% |
| Western Asia | 126 | 0.8% |
| Western Europe | 46 | 0.3% | View All 36 Rows |
Sex and Age in Ferndale
Sex and Age in Ferndale
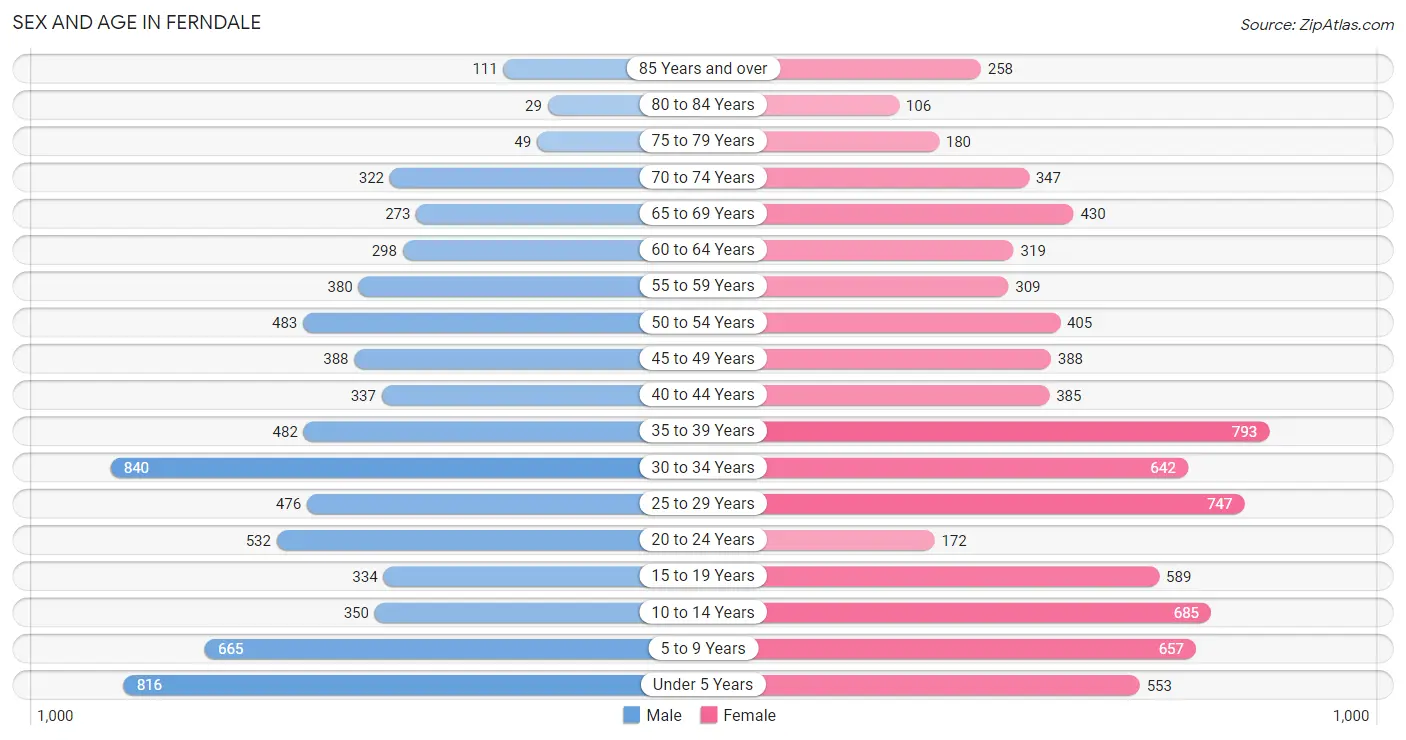
The most populous age groups in Ferndale are 30 to 34 Years (840 | 11.7%) for men and 35 to 39 Years (793 | 10.0%) for women.
| Age Bracket | Male | Female |
| Under 5 Years | 816 (11.4%) | 553 (6.9%) |
| 5 to 9 Years | 665 (9.3%) | 657 (8.3%) |
| 10 to 14 Years | 350 (4.9%) | 685 (8.6%) |
| 15 to 19 Years | 334 (4.7%) | 589 (7.4%) |
| 20 to 24 Years | 532 (7.4%) | 172 (2.2%) |
| 25 to 29 Years | 476 (6.6%) | 747 (9.4%) |
| 30 to 34 Years | 840 (11.7%) | 642 (8.1%) |
| 35 to 39 Years | 482 (6.7%) | 793 (10.0%) |
| 40 to 44 Years | 337 (4.7%) | 385 (4.8%) |
| 45 to 49 Years | 388 (5.4%) | 388 (4.9%) |
| 50 to 54 Years | 483 (6.7%) | 405 (5.1%) |
| 55 to 59 Years | 380 (5.3%) | 309 (3.9%) |
| 60 to 64 Years | 298 (4.2%) | 319 (4.0%) |
| 65 to 69 Years | 273 (3.8%) | 430 (5.4%) |
| 70 to 74 Years | 322 (4.5%) | 347 (4.4%) |
| 75 to 79 Years | 49 (0.7%) | 180 (2.3%) |
| 80 to 84 Years | 29 (0.4%) | 106 (1.3%) |
| 85 Years and over | 111 (1.5%) | 258 (3.2%) |
| Total | 7,165 (100.0%) | 7,965 (100.0%) |
Families and Households in Ferndale
Median Family Size in Ferndale
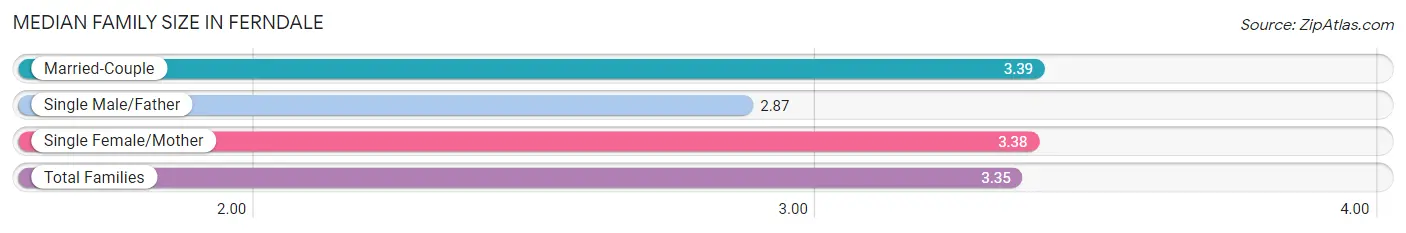
The median family size in Ferndale is 3.35 persons per family, with married-couple families (2,889 | 75.6%) accounting for the largest median family size of 3.39 persons per family. On the other hand, single male/father families (283 | 7.4%) represent the smallest median family size with 2.87 persons per family.
| Family Type | # Families | Family Size |
| Married-Couple | 2,889 (75.6%) | 3.39 |
| Single Male/Father | 283 (7.4%) | 2.87 |
| Single Female/Mother | 651 (17.0%) | 3.38 |
| Total Families | 3,823 (100.0%) | 3.35 |
Median Household Size in Ferndale
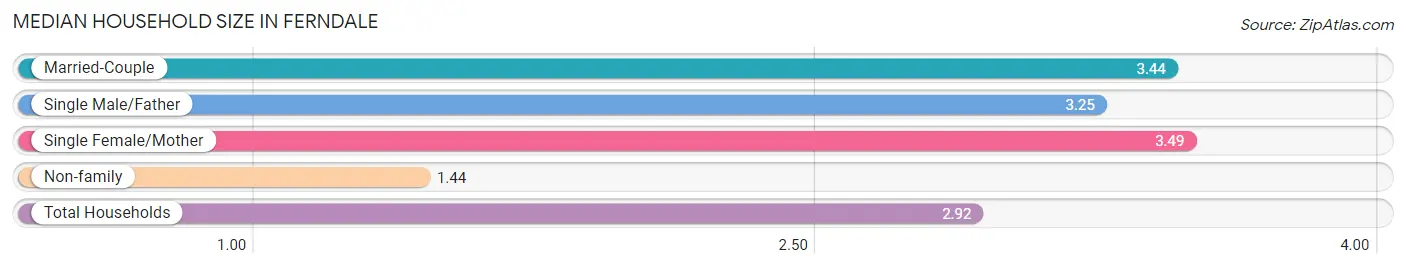
The median household size in Ferndale is 2.92 persons per household, with single female/mother households (651 | 12.6%) accounting for the largest median household size of 3.49 persons per household. non-family households (1,356 | 26.2%) represent the smallest median household size with 1.44 persons per household.
| Household Type | # Households | Household Size |
| Married-Couple | 2,889 (55.8%) | 3.44 |
| Single Male/Father | 283 (5.5%) | 3.25 |
| Single Female/Mother | 651 (12.6%) | 3.49 |
| Non-family | 1,356 (26.2%) | 1.44 |
| Total Households | 5,179 (100.0%) | 2.92 |
Household Size by Marriage Status in Ferndale
Out of a total of 5,179 households in Ferndale, 3,823 (73.8%) are family households, while 1,356 (26.2%) are nonfamily households. The most numerous type of family households are 4-person households, comprising 1,183, and the most common type of nonfamily households are 1-person households, comprising 985.
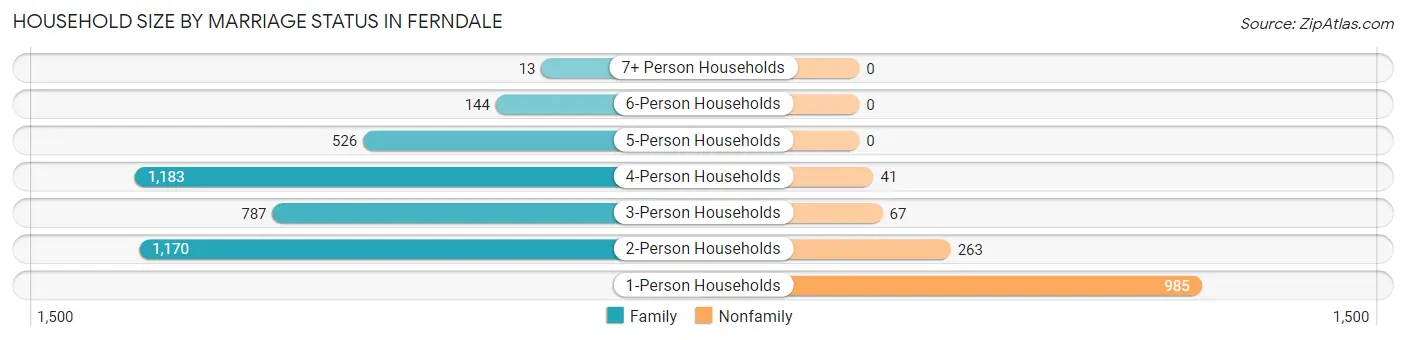
| Household Size | Family Households | Nonfamily Households |
| 1-Person Households | - | 985 (19.0%) |
| 2-Person Households | 1,170 (22.6%) | 263 (5.1%) |
| 3-Person Households | 787 (15.2%) | 67 (1.3%) |
| 4-Person Households | 1,183 (22.8%) | 41 (0.8%) |
| 5-Person Households | 526 (10.2%) | 0 (0.0%) |
| 6-Person Households | 144 (2.8%) | 0 (0.0%) |
| 7+ Person Households | 13 (0.3%) | 0 (0.0%) |
| Total | 3,823 (73.8%) | 1,356 (26.2%) |
Female Fertility in Ferndale
Fertility by Age in Ferndale
Average fertility rate in Ferndale is 112.0 births per 1,000 women. Women in the age bracket of 20 to 34 years have the highest fertility rate with 223.0 births per 1,000 women. Women in the age bracket of 20 to 34 years acount for 82.9% of all women with births.
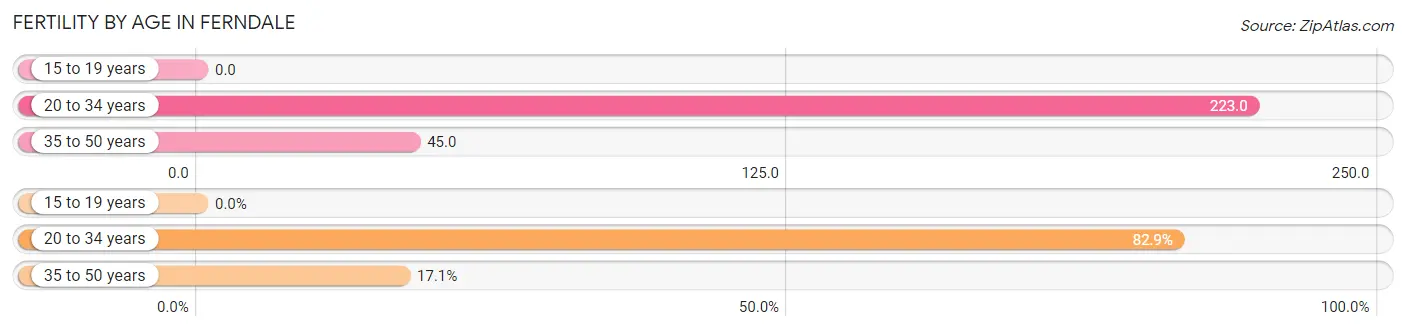
| Age Bracket | Women with Births | Births / 1,000 Women |
| 15 to 19 years | 0 (0.0%) | 0.0 |
| 20 to 34 years | 348 (82.9%) | 223.0 |
| 35 to 50 years | 72 (17.1%) | 45.0 |
| Total | 420 (100.0%) | 112.0 |
Fertility by Age by Marriage Status in Ferndale
96.9% of women with births (420) in Ferndale are married. The highest percentage of unmarried women with births falls into 20 to 34 years age bracket with 3.7% of them unmarried at the time of birth, while the lowest percentage of unmarried women with births belong to 35 to 50 years age bracket with 0.0% of them unmarried.
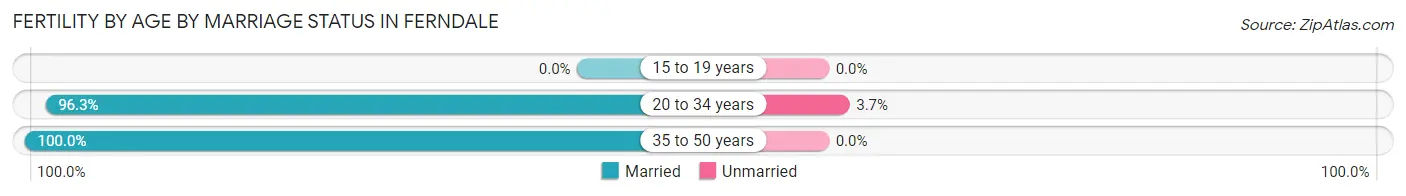
| Age Bracket | Married | Unmarried |
| 15 to 19 years | 0 (0.0%) | 0 (0.0%) |
| 20 to 34 years | 335 (96.3%) | 13 (3.7%) |
| 35 to 50 years | 72 (100.0%) | 0 (0.0%) |
| Total | 407 (96.9%) | 13 (3.1%) |
Fertility by Education in Ferndale
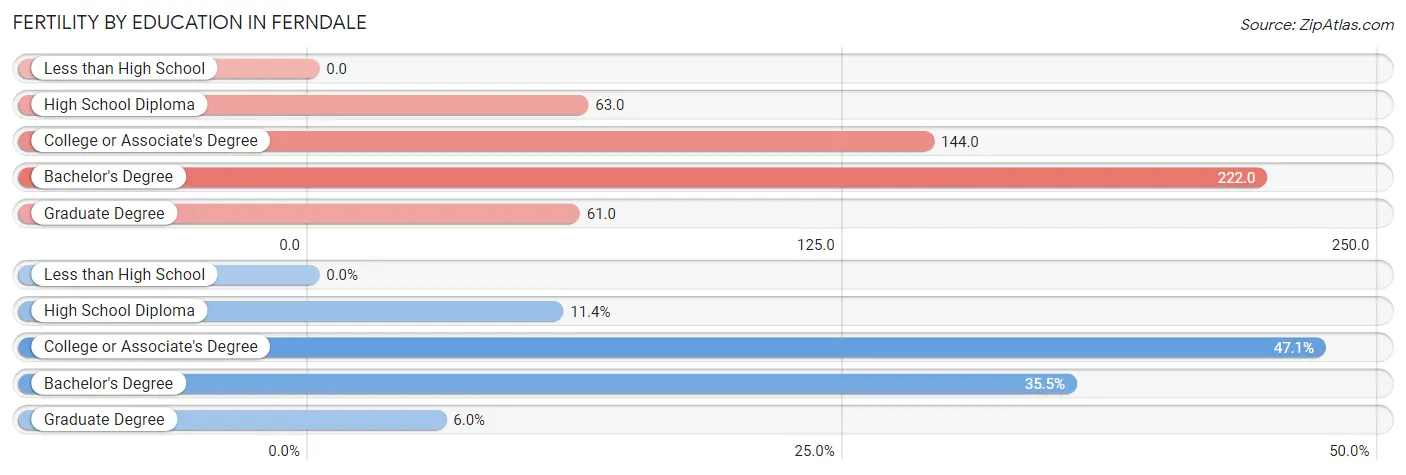
| Educational Attainment | Women with Births | Births / 1,000 Women |
| Less than High School | 0 (0.0%) | 0.0 |
| High School Diploma | 48 (11.4%) | 63.0 |
| College or Associate's Degree | 198 (47.1%) | 144.0 |
| Bachelor's Degree | 149 (35.5%) | 222.0 |
| Graduate Degree | 25 (5.9%) | 61.0 |
| Total | 420 (100.0%) | 112.0 |
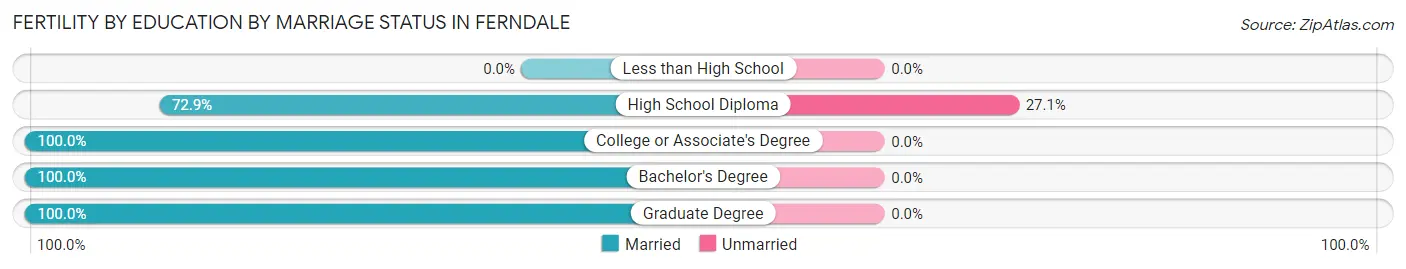
Fertility by Education by Marriage Status in Ferndale
3.1% of women with births in Ferndale are unmarried. Women with the educational attainment of college or associate's degree are most likely to be married with 100.0% of them married at childbirth, while women with the educational attainment of high school diploma are least likely to be married with 27.1% of them unmarried at childbirth.
| Educational Attainment | Married | Unmarried |
| Less than High School | 0 (0.0%) | 0 (0.0%) |
| High School Diploma | 35 (72.9%) | 13 (27.1%) |
| College or Associate's Degree | 198 (100.0%) | 0 (0.0%) |
| Bachelor's Degree | 149 (100.0%) | 0 (0.0%) |
| Graduate Degree | 25 (100.0%) | 0 (0.0%) |
| Total | 407 (96.9%) | 13 (3.1%) |
Employment Characteristics in Ferndale
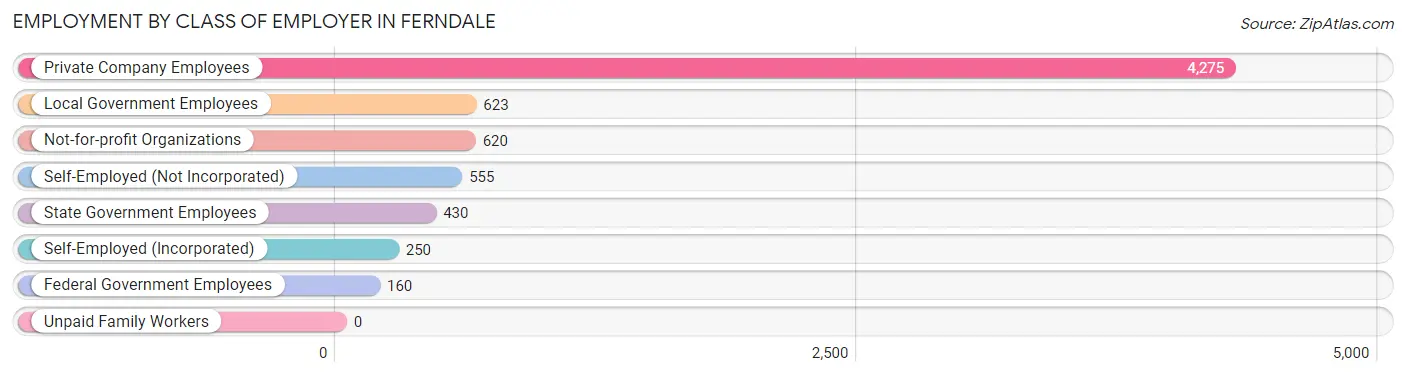
Employment by Class of Employer in Ferndale
Among the 6,913 employed individuals in Ferndale, private company employees (4,275 | 61.8%), local government employees (623 | 9.0%), and not-for-profit organizations (620 | 9.0%) make up the most common classes of employment.
| Employer Class | # Employees | % Employees |
| Private Company Employees | 4,275 | 61.8% |
| Self-Employed (Incorporated) | 250 | 3.6% |
| Self-Employed (Not Incorporated) | 555 | 8.0% |
| Not-for-profit Organizations | 620 | 9.0% |
| Local Government Employees | 623 | 9.0% |
| State Government Employees | 430 | 6.2% |
| Federal Government Employees | 160 | 2.3% |
| Unpaid Family Workers | 0 | 0.0% |
| Total | 6,913 | 100.0% |
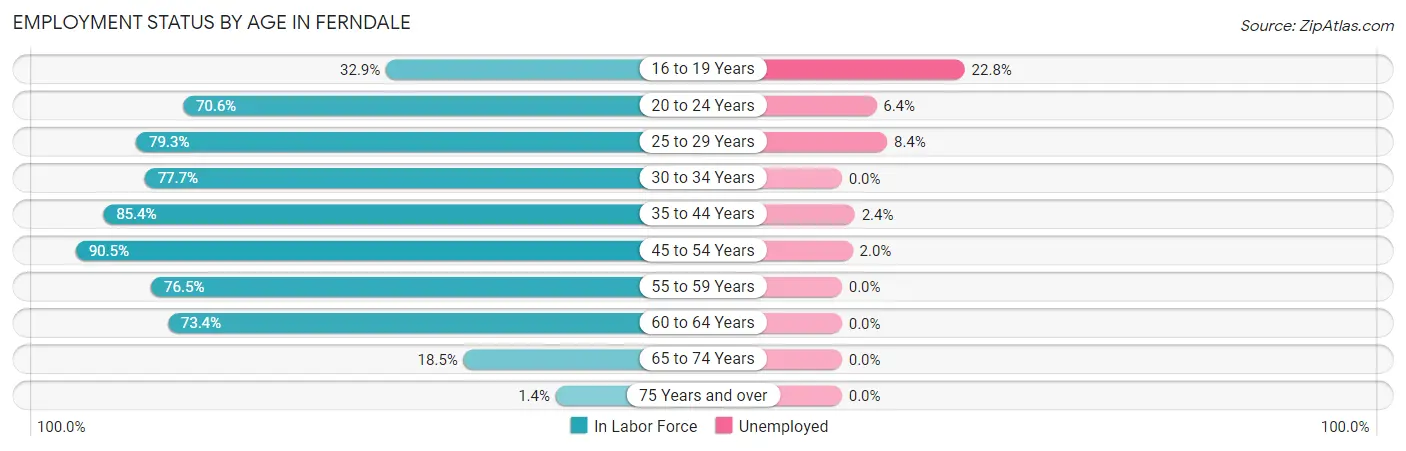
Employment Status by Age in Ferndale
According to the labor force statistics for Ferndale, out of the total population over 16 years of age (11,242), 65.1% or 7,319 individuals are in the labor force, with 3.3% or 242 of them unemployed. The age group with the highest labor force participation rate is 45 to 54 years, with 90.5% or 1,506 individuals in the labor force. Within the labor force, the 16 to 19 years age range has the highest percentage of unemployed individuals, with 22.8% or 57 of them being unemployed.
| Age Bracket | In Labor Force | Unemployed |
| 16 to 19 Years | 250 (32.9%) | 57 (22.8%) |
| 20 to 24 Years | 497 (70.6%) | 32 (6.4%) |
| 25 to 29 Years | 970 (79.3%) | 81 (8.4%) |
| 30 to 34 Years | 1,152 (77.7%) | 0 (0.0%) |
| 35 to 44 Years | 1,705 (85.4%) | 41 (2.4%) |
| 45 to 54 Years | 1,506 (90.5%) | 30 (2.0%) |
| 55 to 59 Years | 527 (76.5%) | 0 (0.0%) |
| 60 to 64 Years | 453 (73.4%) | 0 (0.0%) |
| 65 to 74 Years | 254 (18.5%) | 0 (0.0%) |
| 75 Years and over | 10 (1.4%) | 0 (0.0%) |
| Total | 7,319 (65.1%) | 242 (3.3%) |
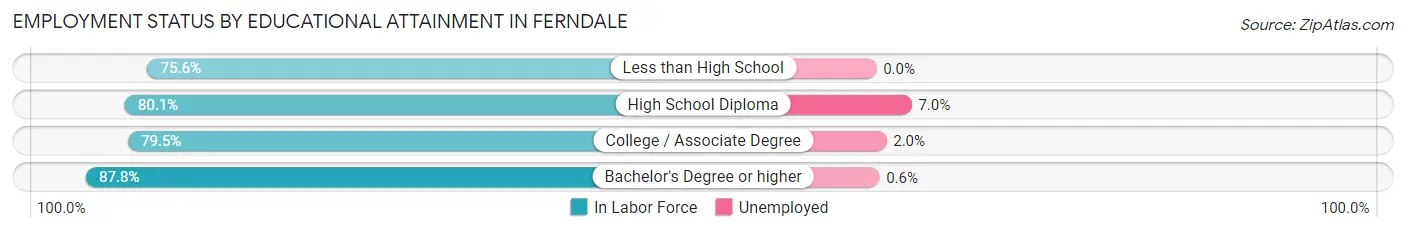
Employment Status by Educational Attainment in Ferndale
According to labor force statistics for Ferndale, 82.3% of individuals (6,314) out of the total population between 25 and 64 years of age (7,672) are in the labor force, with 2.4% or 152 of them being unemployed. The group with the highest labor force participation rate are those with the educational attainment of bachelor's degree or higher, with 87.8% or 2,352 individuals in the labor force. Within the labor force, individuals with high school diploma education have the highest percentage of unemployment, with 7.0% or 92 of them being unemployed.
| Educational Attainment | In Labor Force | Unemployed |
| Less than High School | 322 (75.6%) | 0 (0.0%) |
| High School Diploma | 1,319 (80.1%) | 115 (7.0%) |
| College / Associate Degree | 2,321 (79.5%) | 58 (2.0%) |
| Bachelor's Degree or higher | 2,352 (87.8%) | 16 (0.6%) |
| Total | 6,314 (82.3%) | 184 (2.4%) |
Employment Occupations by Sex in Ferndale
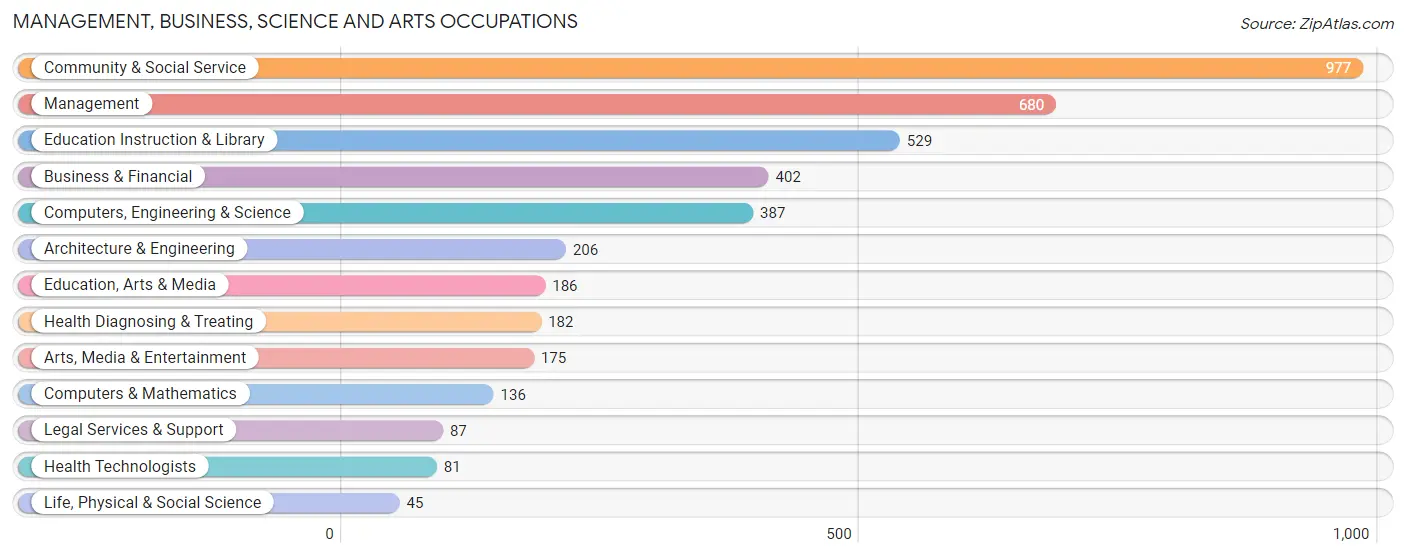
Management, Business, Science and Arts Occupations
The most common Management, Business, Science and Arts occupations in Ferndale are Community & Social Service (977 | 13.9%), Management (680 | 9.7%), Education Instruction & Library (529 | 7.5%), Business & Financial (402 | 5.7%), and Computers, Engineering & Science (387 | 5.5%).
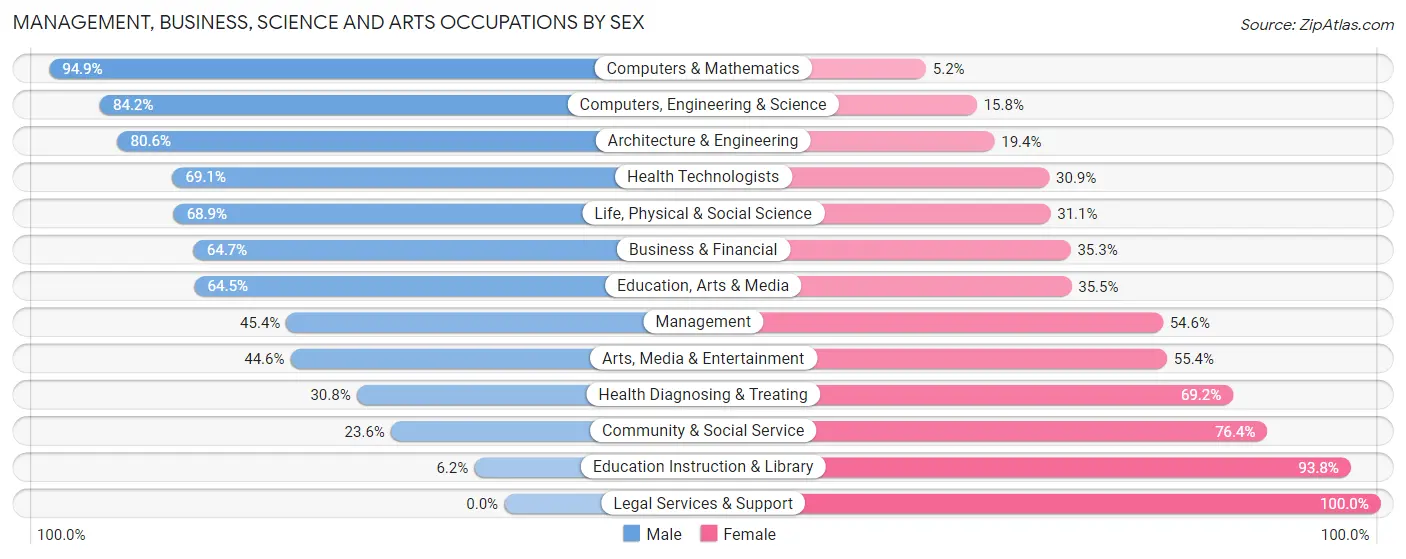
Management, Business, Science and Arts Occupations by Sex
Within the Management, Business, Science and Arts occupations in Ferndale, the most male-oriented occupations are Computers & Mathematics (94.9%), Computers, Engineering & Science (84.2%), and Architecture & Engineering (80.6%), while the most female-oriented occupations are Legal Services & Support (100.0%), Education Instruction & Library (93.8%), and Community & Social Service (76.4%).
| Occupation | Male | Female |
| Management | 309 (45.4%) | 371 (54.6%) |
| Business & Financial | 260 (64.7%) | 142 (35.3%) |
| Computers, Engineering & Science | 326 (84.2%) | 61 (15.8%) |
| Computers & Mathematics | 129 (94.9%) | 7 (5.1%) |
| Architecture & Engineering | 166 (80.6%) | 40 (19.4%) |
| Life, Physical & Social Science | 31 (68.9%) | 14 (31.1%) |
| Community & Social Service | 231 (23.6%) | 746 (76.4%) |
| Education, Arts & Media | 120 (64.5%) | 66 (35.5%) |
| Legal Services & Support | 0 (0.0%) | 87 (100.0%) |
| Education Instruction & Library | 33 (6.2%) | 496 (93.8%) |
| Arts, Media & Entertainment | 78 (44.6%) | 97 (55.4%) |
| Health Diagnosing & Treating | 56 (30.8%) | 126 (69.2%) |
| Health Technologists | 56 (69.1%) | 25 (30.9%) |
| Total (Category) | 1,182 (45.0%) | 1,446 (55.0%) |
| Total (Overall) | 3,812 (54.2%) | 3,224 (45.8%) |
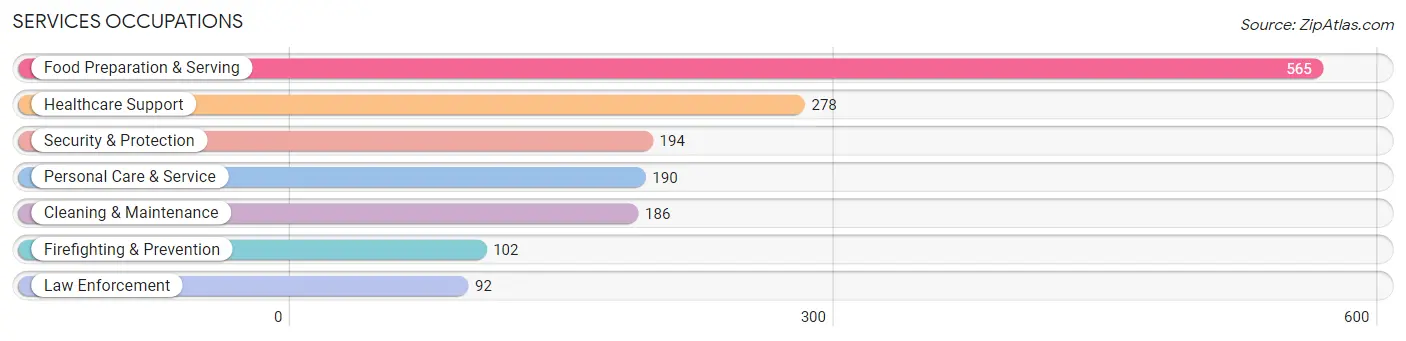
Services Occupations
The most common Services occupations in Ferndale are Food Preparation & Serving (565 | 8.0%), Healthcare Support (278 | 4.0%), Security & Protection (194 | 2.8%), Personal Care & Service (190 | 2.7%), and Cleaning & Maintenance (186 | 2.6%).
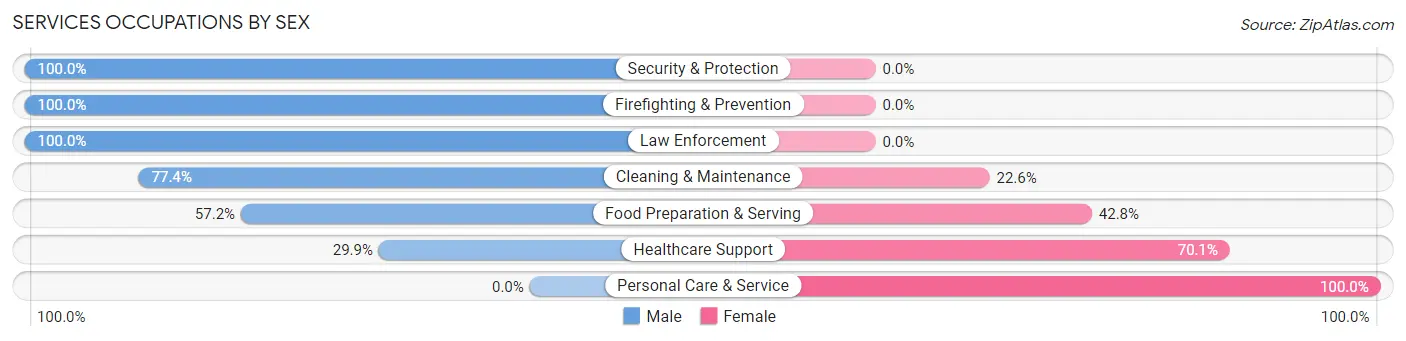
Services Occupations by Sex
Within the Services occupations in Ferndale, the most male-oriented occupations are Security & Protection (100.0%), Firefighting & Prevention (100.0%), and Law Enforcement (100.0%), while the most female-oriented occupations are Personal Care & Service (100.0%), Healthcare Support (70.1%), and Food Preparation & Serving (42.8%).
| Occupation | Male | Female |
| Healthcare Support | 83 (29.9%) | 195 (70.1%) |
| Security & Protection | 194 (100.0%) | 0 (0.0%) |
| Firefighting & Prevention | 102 (100.0%) | 0 (0.0%) |
| Law Enforcement | 92 (100.0%) | 0 (0.0%) |
| Food Preparation & Serving | 323 (57.2%) | 242 (42.8%) |
| Cleaning & Maintenance | 144 (77.4%) | 42 (22.6%) |
| Personal Care & Service | 0 (0.0%) | 190 (100.0%) |
| Total (Category) | 744 (52.6%) | 669 (47.3%) |
| Total (Overall) | 3,812 (54.2%) | 3,224 (45.8%) |
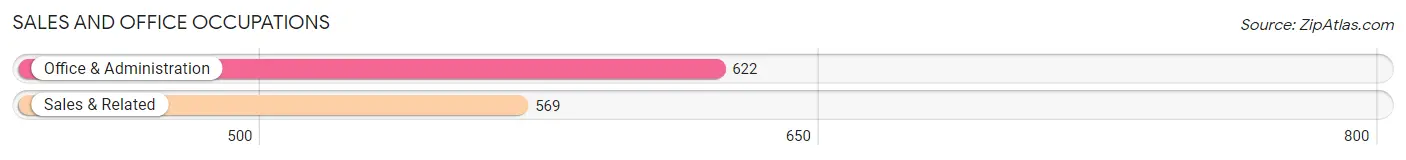
Sales and Office Occupations
The most common Sales and Office occupations in Ferndale are Office & Administration (622 | 8.8%), and Sales & Related (569 | 8.1%).
Sales and Office Occupations by Sex
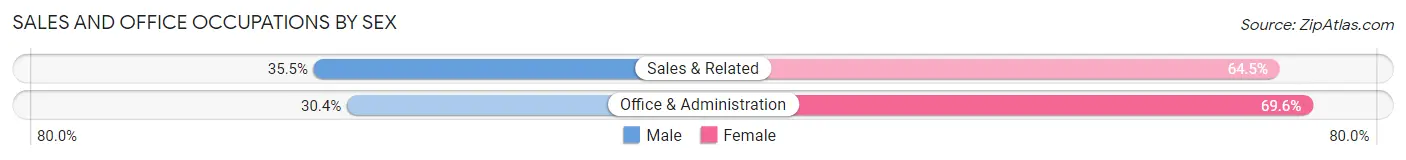
| Occupation | Male | Female |
| Sales & Related | 202 (35.5%) | 367 (64.5%) |
| Office & Administration | 189 (30.4%) | 433 (69.6%) |
| Total (Category) | 391 (32.8%) | 800 (67.2%) |
| Total (Overall) | 3,812 (54.2%) | 3,224 (45.8%) |
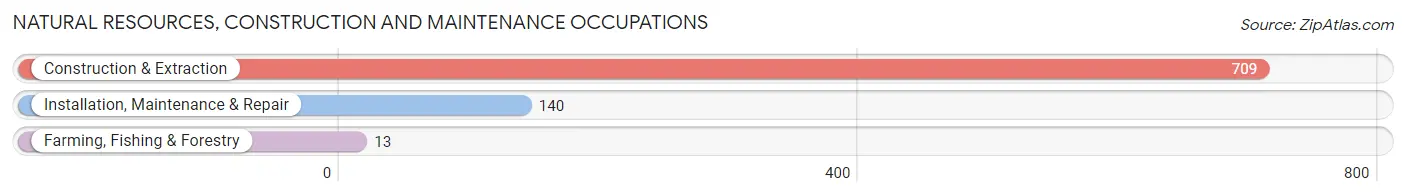
Natural Resources, Construction and Maintenance Occupations
The most common Natural Resources, Construction and Maintenance occupations in Ferndale are Construction & Extraction (709 | 10.1%), Installation, Maintenance & Repair (140 | 2.0%), and Farming, Fishing & Forestry (13 | 0.2%).
Natural Resources, Construction and Maintenance Occupations by Sex
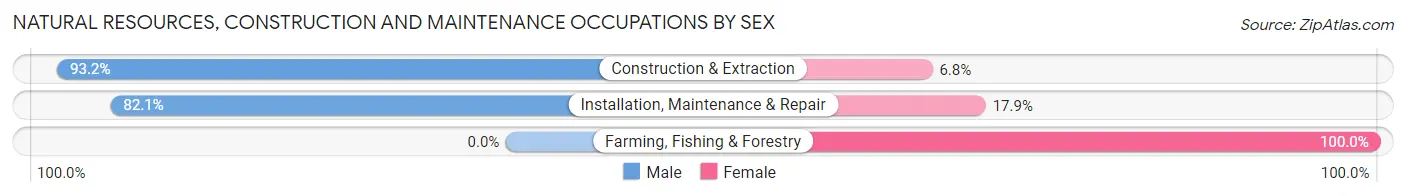
| Occupation | Male | Female |
| Farming, Fishing & Forestry | 0 (0.0%) | 13 (100.0%) |
| Construction & Extraction | 661 (93.2%) | 48 (6.8%) |
| Installation, Maintenance & Repair | 115 (82.1%) | 25 (17.9%) |
| Total (Category) | 776 (90.0%) | 86 (10.0%) |
| Total (Overall) | 3,812 (54.2%) | 3,224 (45.8%) |
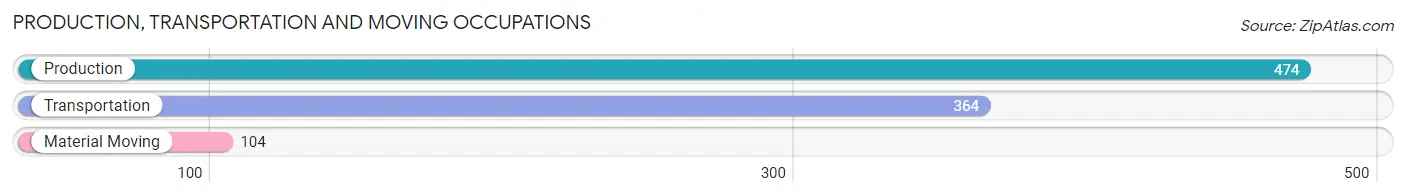
Production, Transportation and Moving Occupations
The most common Production, Transportation and Moving occupations in Ferndale are Production (474 | 6.7%), Transportation (364 | 5.2%), and Material Moving (104 | 1.5%).
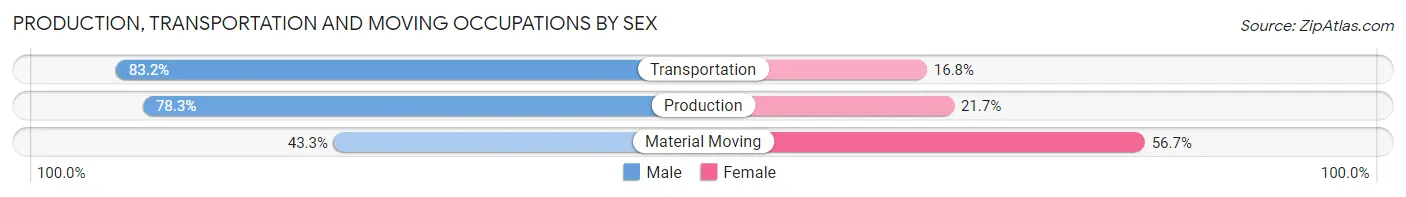
Production, Transportation and Moving Occupations by Sex
| Occupation | Male | Female |
| Production | 371 (78.3%) | 103 (21.7%) |
| Transportation | 303 (83.2%) | 61 (16.8%) |
| Material Moving | 45 (43.3%) | 59 (56.7%) |
| Total (Category) | 719 (76.3%) | 223 (23.7%) |
| Total (Overall) | 3,812 (54.2%) | 3,224 (45.8%) |
Employment Industries by Sex in Ferndale
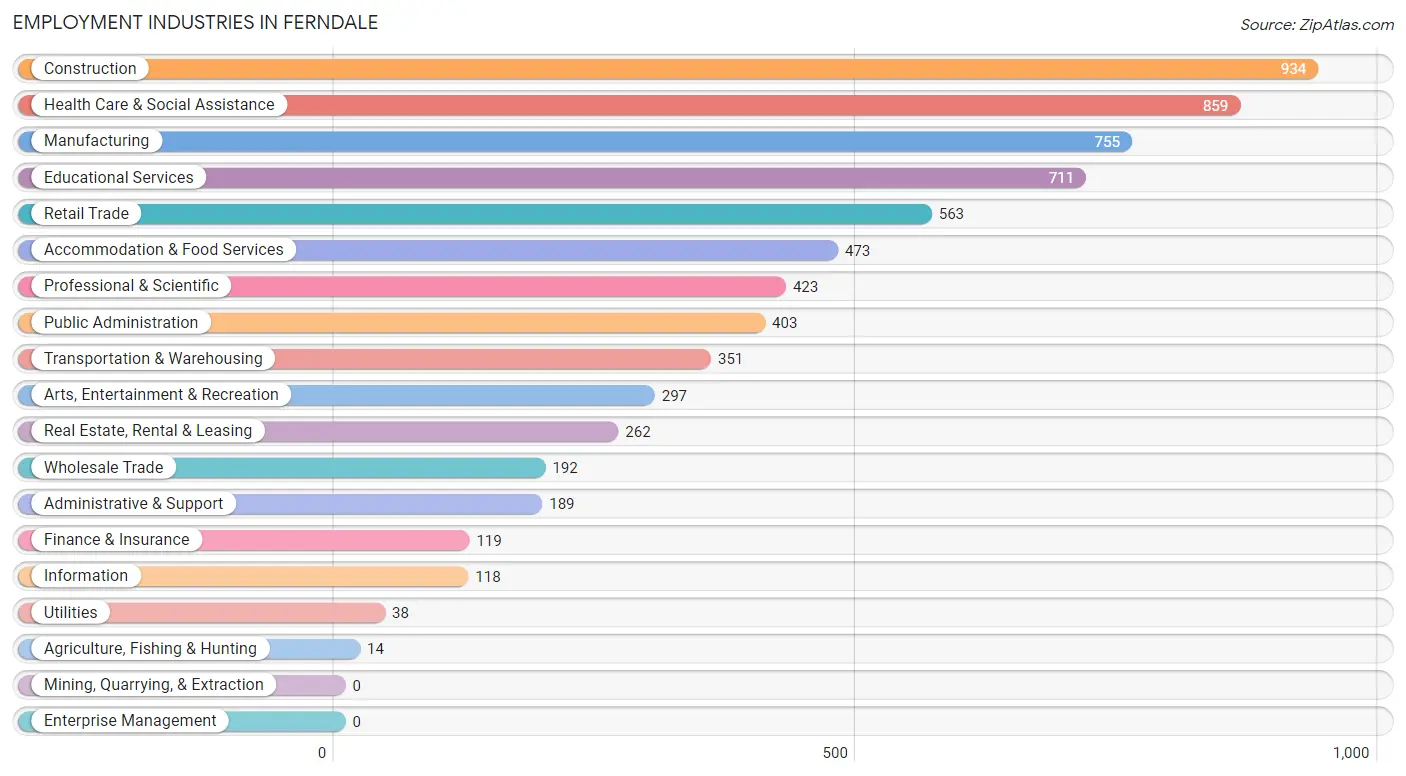
Employment Industries in Ferndale
The major employment industries in Ferndale include Construction (934 | 13.3%), Health Care & Social Assistance (859 | 12.2%), Manufacturing (755 | 10.7%), Educational Services (711 | 10.1%), and Retail Trade (563 | 8.0%).
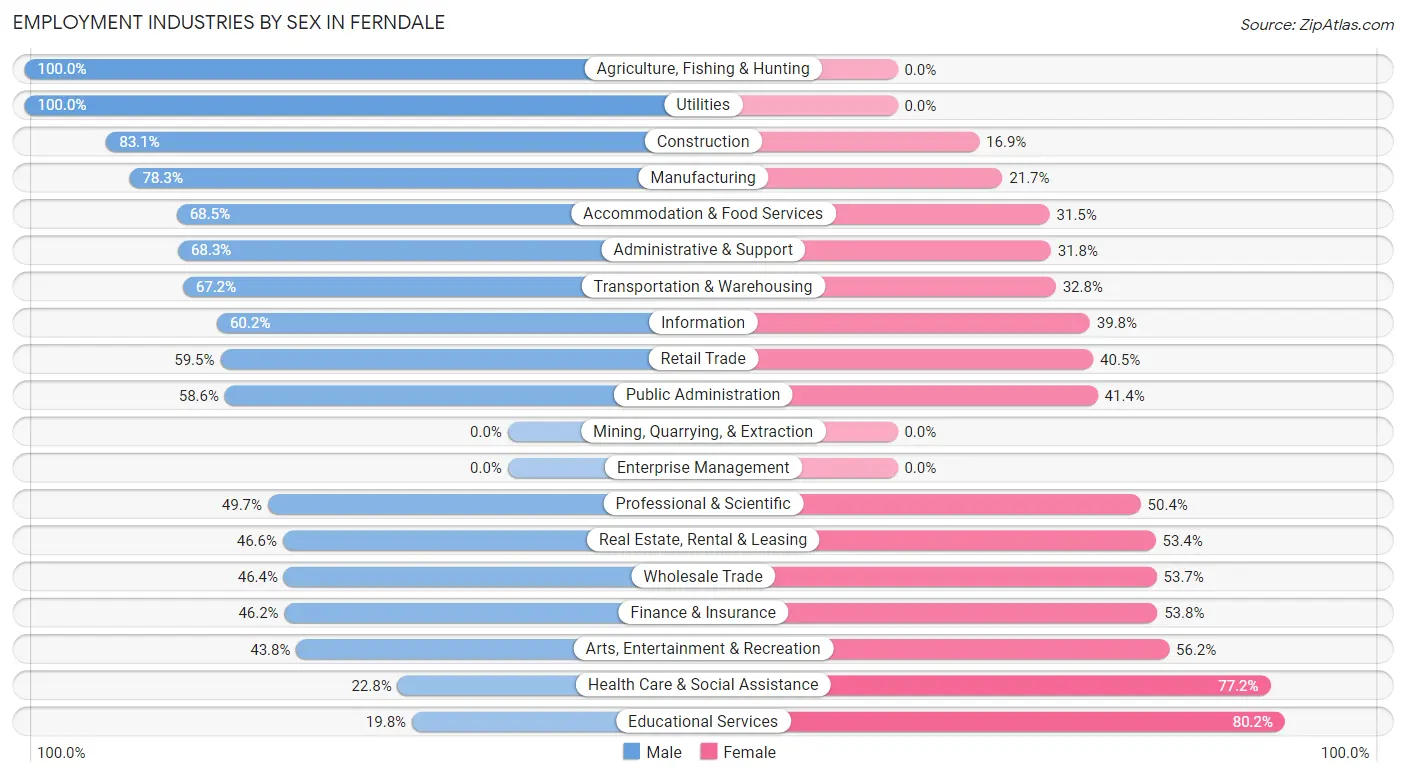
Employment Industries by Sex in Ferndale
The Ferndale industries that see more men than women are Agriculture, Fishing & Hunting (100.0%), Utilities (100.0%), and Construction (83.1%), whereas the industries that tend to have a higher number of women are Educational Services (80.2%), Health Care & Social Assistance (77.2%), and Arts, Entertainment & Recreation (56.2%).
| Industry | Male | Female |
| Agriculture, Fishing & Hunting | 14 (100.0%) | 0 (0.0%) |
| Mining, Quarrying, & Extraction | 0 (0.0%) | 0 (0.0%) |
| Construction | 776 (83.1%) | 158 (16.9%) |
| Manufacturing | 591 (78.3%) | 164 (21.7%) |
| Wholesale Trade | 89 (46.4%) | 103 (53.6%) |
| Retail Trade | 335 (59.5%) | 228 (40.5%) |
| Transportation & Warehousing | 236 (67.2%) | 115 (32.8%) |
| Utilities | 38 (100.0%) | 0 (0.0%) |
| Information | 71 (60.2%) | 47 (39.8%) |
| Finance & Insurance | 55 (46.2%) | 64 (53.8%) |
| Real Estate, Rental & Leasing | 122 (46.6%) | 140 (53.4%) |
| Professional & Scientific | 210 (49.6%) | 213 (50.3%) |
| Enterprise Management | 0 (0.0%) | 0 (0.0%) |
| Administrative & Support | 129 (68.2%) | 60 (31.8%) |
| Educational Services | 141 (19.8%) | 570 (80.2%) |
| Health Care & Social Assistance | 196 (22.8%) | 663 (77.2%) |
| Arts, Entertainment & Recreation | 130 (43.8%) | 167 (56.2%) |
| Accommodation & Food Services | 324 (68.5%) | 149 (31.5%) |
| Public Administration | 236 (58.6%) | 167 (41.4%) |
| Total | 3,812 (54.2%) | 3,224 (45.8%) |
Education in Ferndale
School Enrollment in Ferndale
The most common levels of schooling among the 3,778 students in Ferndale are middle school (909 | 24.1%), high school (800 | 21.2%), and elementary school (791 | 20.9%).
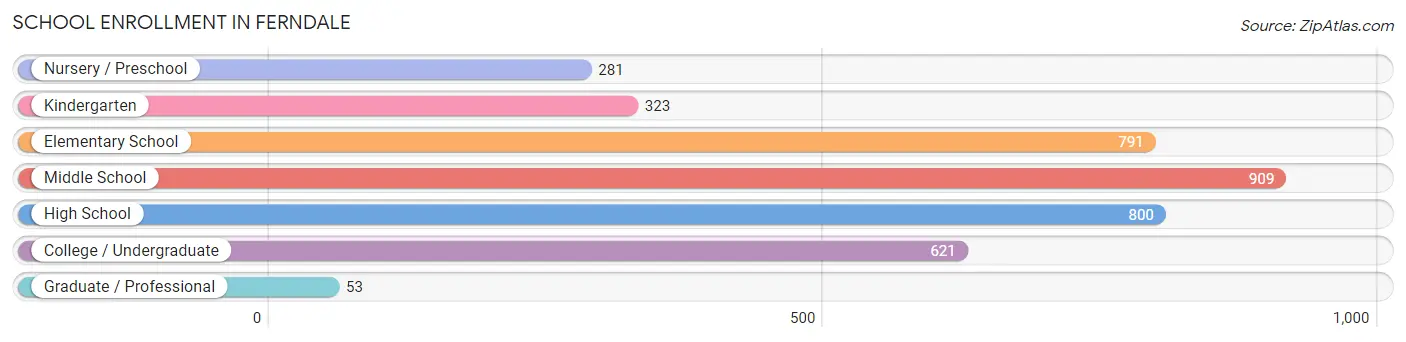
| School Level | # Students | % Students |
| Nursery / Preschool | 281 | 7.4% |
| Kindergarten | 323 | 8.6% |
| Elementary School | 791 | 20.9% |
| Middle School | 909 | 24.1% |
| High School | 800 | 21.2% |
| College / Undergraduate | 621 | 16.4% |
| Graduate / Professional | 53 | 1.4% |
| Total | 3,778 | 100.0% |
School Enrollment by Age by Funding Source in Ferndale
Out of a total of 3,778 students who are enrolled in schools in Ferndale, 434 (11.5%) attend a private institution, while the remaining 3,344 (88.5%) are enrolled in public schools. The age group of 35 years and over has the highest likelihood of being enrolled in private schools, with 41 (36.3% in the age bracket) enrolled. Conversely, the age group of 18 to 19 year olds has the lowest likelihood of being enrolled in a private school, with 200 (100.0% in the age bracket) attending a public institution.
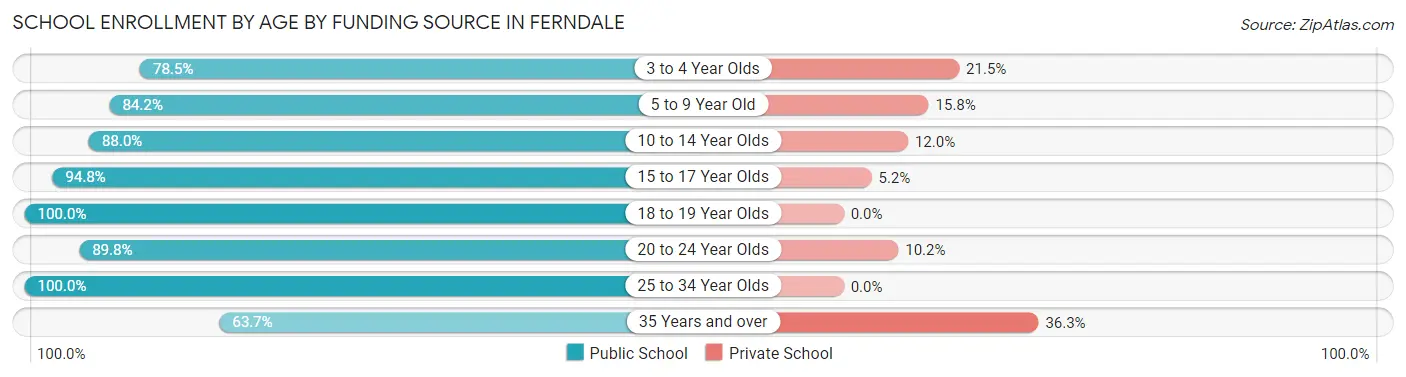
| Age Bracket | Public School | Private School |
| 3 to 4 Year Olds | 73 (78.5%) | 20 (21.5%) |
| 5 to 9 Year Old | 1,048 (84.2%) | 197 (15.8%) |
| 10 to 14 Year Olds | 911 (88.0%) | 124 (12.0%) |
| 15 to 17 Year Olds | 640 (94.8%) | 35 (5.2%) |
| 18 to 19 Year Olds | 200 (100.0%) | 0 (0.0%) |
| 20 to 24 Year Olds | 150 (89.8%) | 17 (10.2%) |
| 25 to 34 Year Olds | 250 (100.0%) | 0 (0.0%) |
| 35 Years and over | 72 (63.7%) | 41 (36.3%) |
| Total | 3,344 (88.5%) | 434 (11.5%) |
Educational Attainment by Field of Study in Ferndale
Engineering (493 | 14.0%), business (459 | 13.1%), education (411 | 11.7%), social sciences (383 | 10.9%), and liberal arts & history (324 | 9.2%) are the most common fields of study among 3,511 individuals in Ferndale who have obtained a bachelor's degree or higher.
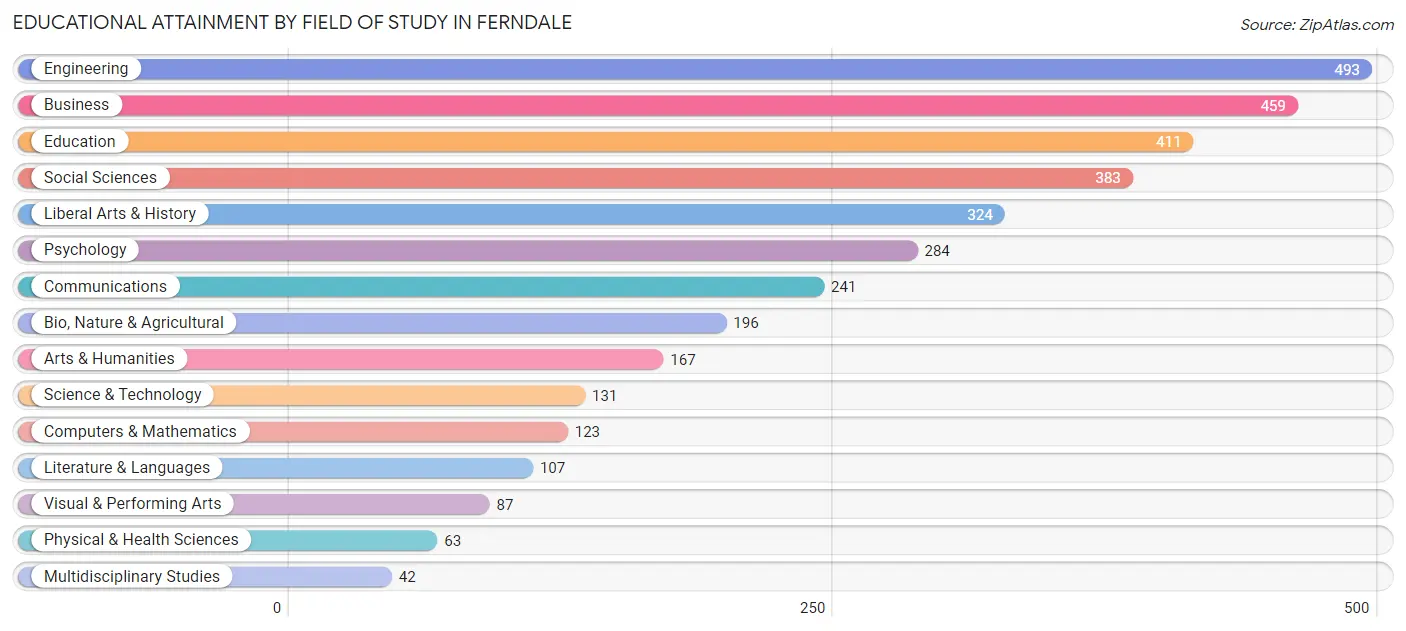
| Field of Study | # Graduates | % Graduates |
| Computers & Mathematics | 123 | 3.5% |
| Bio, Nature & Agricultural | 196 | 5.6% |
| Physical & Health Sciences | 63 | 1.8% |
| Psychology | 284 | 8.1% |
| Social Sciences | 383 | 10.9% |
| Engineering | 493 | 14.0% |
| Multidisciplinary Studies | 42 | 1.2% |
| Science & Technology | 131 | 3.7% |
| Business | 459 | 13.1% |
| Education | 411 | 11.7% |
| Literature & Languages | 107 | 3.0% |
| Liberal Arts & History | 324 | 9.2% |
| Visual & Performing Arts | 87 | 2.5% |
| Communications | 241 | 6.9% |
| Arts & Humanities | 167 | 4.8% |
| Total | 3,511 | 100.0% |
Transportation & Commute in Ferndale
Vehicle Availability by Sex in Ferndale
The most prevalent vehicle ownership categories in Ferndale are males with 2 vehicles (1,439, accounting for 37.6%) and females with 2 vehicles (1,145, making up 46.7%).
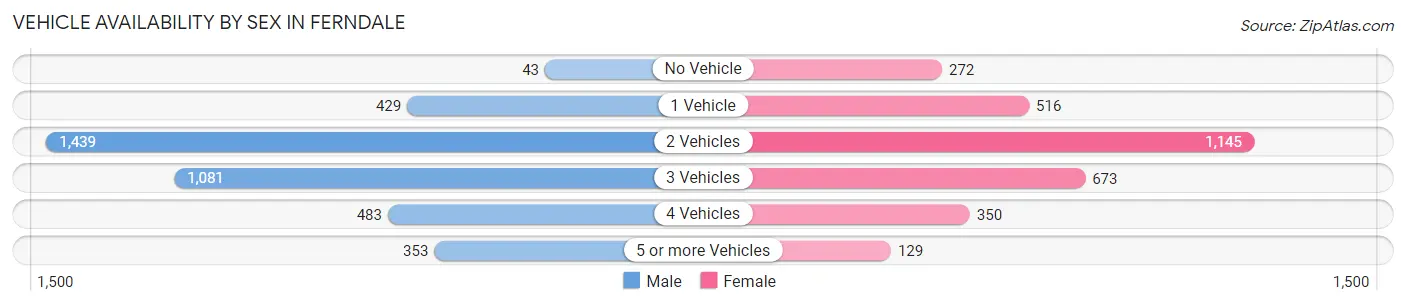
| Vehicles Available | Male | Female |
| No Vehicle | 43 (1.1%) | 272 (8.8%) |
| 1 Vehicle | 429 (11.2%) | 516 (16.7%) |
| 2 Vehicles | 1,439 (37.6%) | 1,145 (37.1%) |
| 3 Vehicles | 1,081 (28.2%) | 673 (21.8%) |
| 4 Vehicles | 483 (12.6%) | 350 (11.4%) |
| 5 or more Vehicles | 353 (9.2%) | 129 (4.2%) |
| Total | 3,828 (100.0%) | 3,085 (100.0%) |
Commute Time in Ferndale
The most frequently occuring commute durations in Ferndale are 20 to 24 minutes (1,688 commuters, 27.1%), 15 to 19 minutes (1,412 commuters, 22.6%), and 10 to 14 minutes (1,010 commuters, 16.2%).
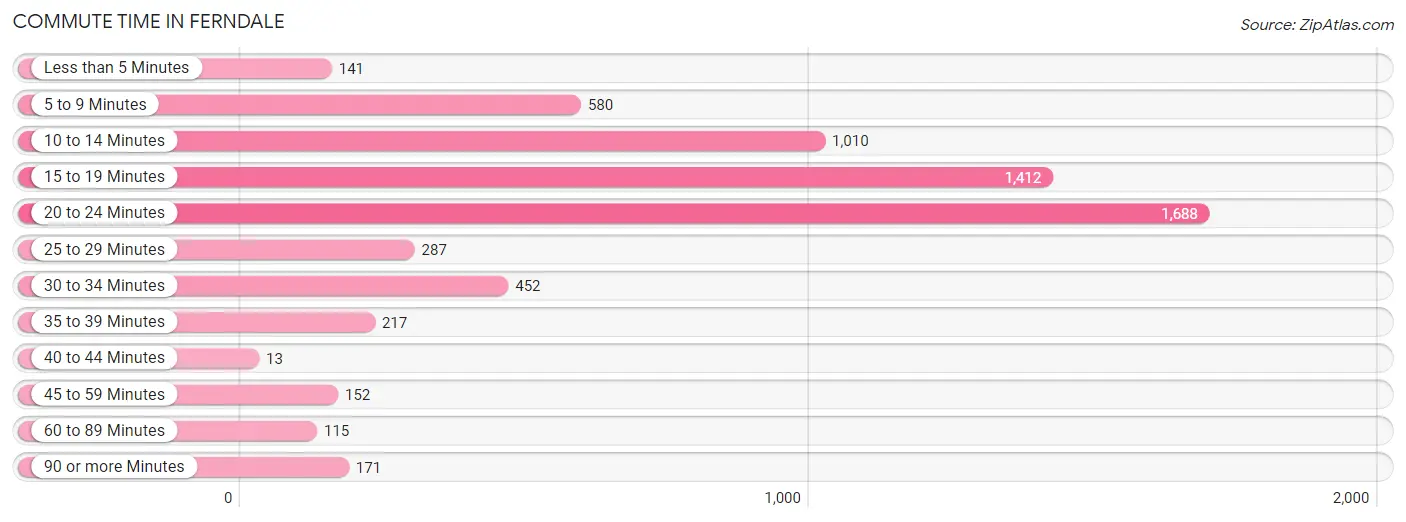
| Commute Time | # Commuters | % Commuters |
| Less than 5 Minutes | 141 | 2.3% |
| 5 to 9 Minutes | 580 | 9.3% |
| 10 to 14 Minutes | 1,010 | 16.2% |
| 15 to 19 Minutes | 1,412 | 22.6% |
| 20 to 24 Minutes | 1,688 | 27.1% |
| 25 to 29 Minutes | 287 | 4.6% |
| 30 to 34 Minutes | 452 | 7.2% |
| 35 to 39 Minutes | 217 | 3.5% |
| 40 to 44 Minutes | 13 | 0.2% |
| 45 to 59 Minutes | 152 | 2.4% |
| 60 to 89 Minutes | 115 | 1.8% |
| 90 or more Minutes | 171 | 2.7% |
Commute Time by Sex in Ferndale
The most common commute times in Ferndale are 15 to 19 minutes (853 commuters, 24.5%) for males and 20 to 24 minutes (853 commuters, 31.0%) for females.
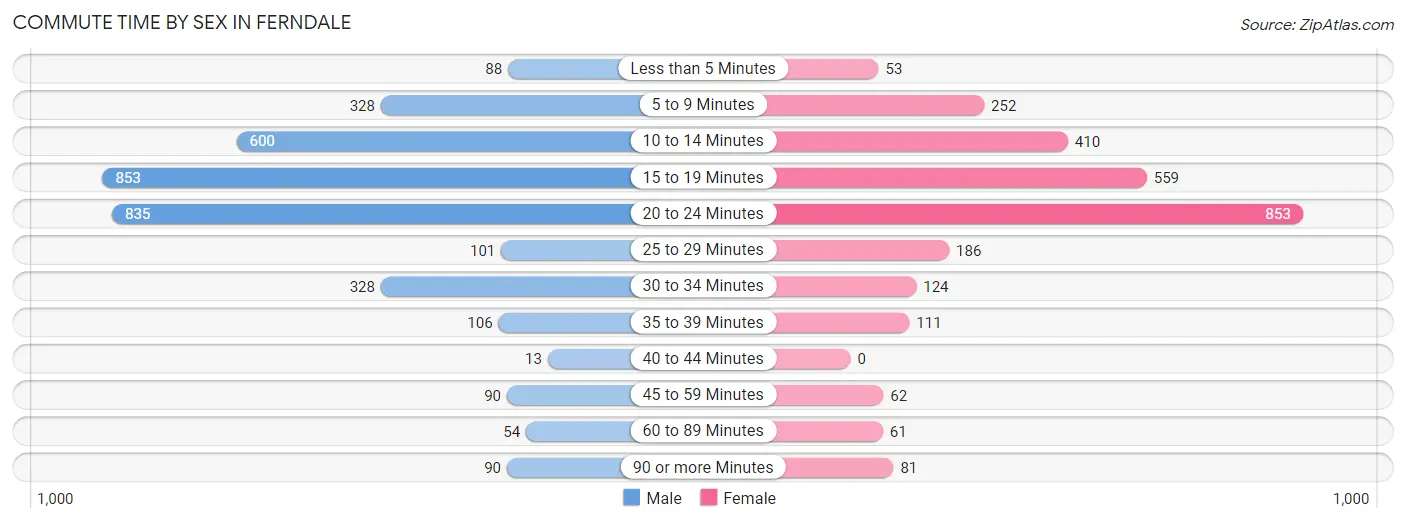
| Commute Time | Male | Female |
| Less than 5 Minutes | 88 (2.5%) | 53 (1.9%) |
| 5 to 9 Minutes | 328 (9.4%) | 252 (9.2%) |
| 10 to 14 Minutes | 600 (17.2%) | 410 (14.9%) |
| 15 to 19 Minutes | 853 (24.5%) | 559 (20.3%) |
| 20 to 24 Minutes | 835 (23.9%) | 853 (31.0%) |
| 25 to 29 Minutes | 101 (2.9%) | 186 (6.8%) |
| 30 to 34 Minutes | 328 (9.4%) | 124 (4.5%) |
| 35 to 39 Minutes | 106 (3.0%) | 111 (4.0%) |
| 40 to 44 Minutes | 13 (0.4%) | 0 (0.0%) |
| 45 to 59 Minutes | 90 (2.6%) | 62 (2.2%) |
| 60 to 89 Minutes | 54 (1.5%) | 61 (2.2%) |
| 90 or more Minutes | 90 (2.6%) | 81 (2.9%) |
Time of Departure to Work by Sex in Ferndale
The most frequent times of departure to work in Ferndale are 8:00 AM to 8:29 AM (459, 13.2%) for males and 7:30 AM to 7:59 AM (755, 27.4%) for females.
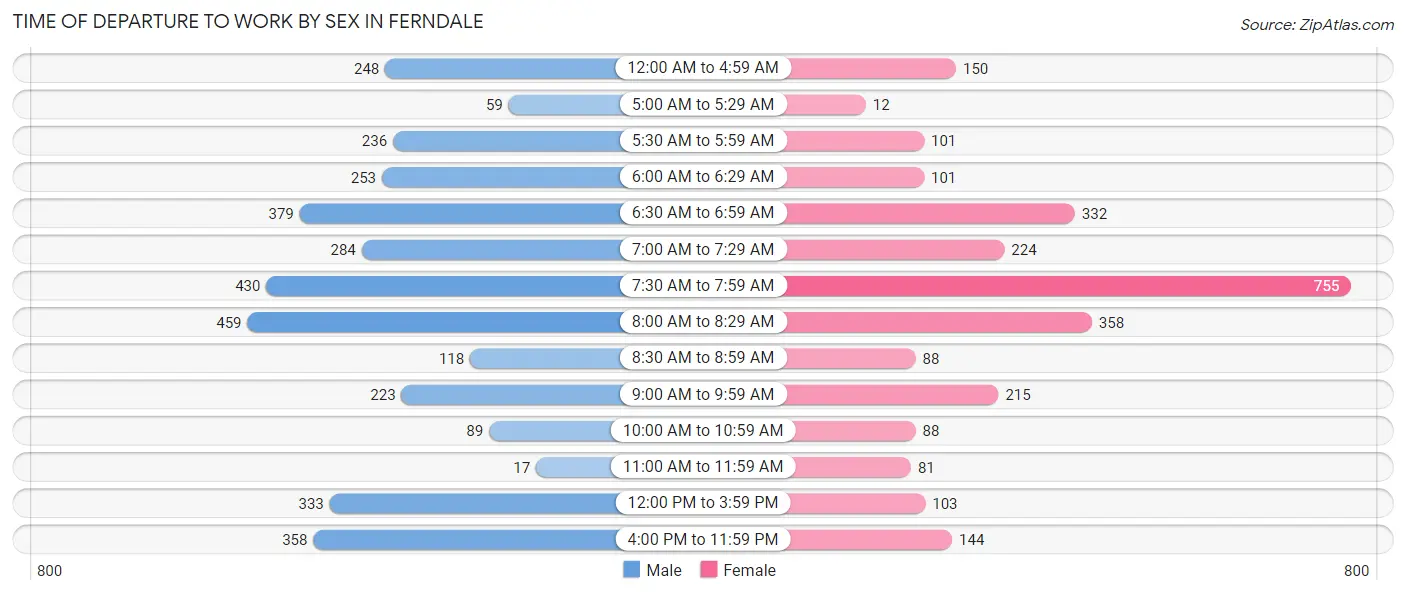
| Time of Departure | Male | Female |
| 12:00 AM to 4:59 AM | 248 (7.1%) | 150 (5.4%) |
| 5:00 AM to 5:29 AM | 59 (1.7%) | 12 (0.4%) |
| 5:30 AM to 5:59 AM | 236 (6.8%) | 101 (3.7%) |
| 6:00 AM to 6:29 AM | 253 (7.3%) | 101 (3.7%) |
| 6:30 AM to 6:59 AM | 379 (10.9%) | 332 (12.1%) |
| 7:00 AM to 7:29 AM | 284 (8.2%) | 224 (8.1%) |
| 7:30 AM to 7:59 AM | 430 (12.3%) | 755 (27.4%) |
| 8:00 AM to 8:29 AM | 459 (13.2%) | 358 (13.0%) |
| 8:30 AM to 8:59 AM | 118 (3.4%) | 88 (3.2%) |
| 9:00 AM to 9:59 AM | 223 (6.4%) | 215 (7.8%) |
| 10:00 AM to 10:59 AM | 89 (2.5%) | 88 (3.2%) |
| 11:00 AM to 11:59 AM | 17 (0.5%) | 81 (2.9%) |
| 12:00 PM to 3:59 PM | 333 (9.6%) | 103 (3.7%) |
| 4:00 PM to 11:59 PM | 358 (10.3%) | 144 (5.2%) |
| Total | 3,486 (100.0%) | 2,752 (100.0%) |
Housing Occupancy in Ferndale
Occupancy by Ownership in Ferndale
Of the total 5,179 dwellings in Ferndale, owner-occupied units account for 3,399 (65.6%), while renter-occupied units make up 1,780 (34.4%).
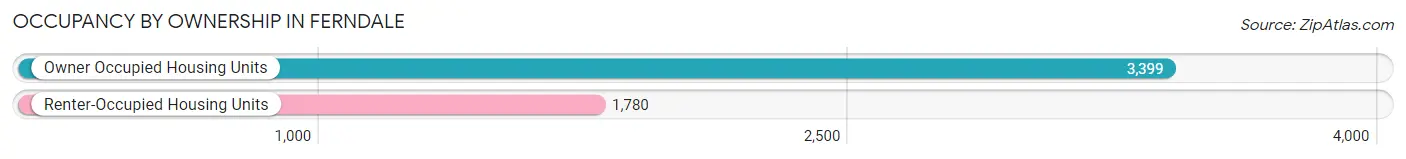
| Occupancy | # Housing Units | % Housing Units |
| Owner Occupied Housing Units | 3,399 | 65.6% |
| Renter-Occupied Housing Units | 1,780 | 34.4% |
| Total Occupied Housing Units | 5,179 | 100.0% |
Occupancy by Household Size in Ferndale
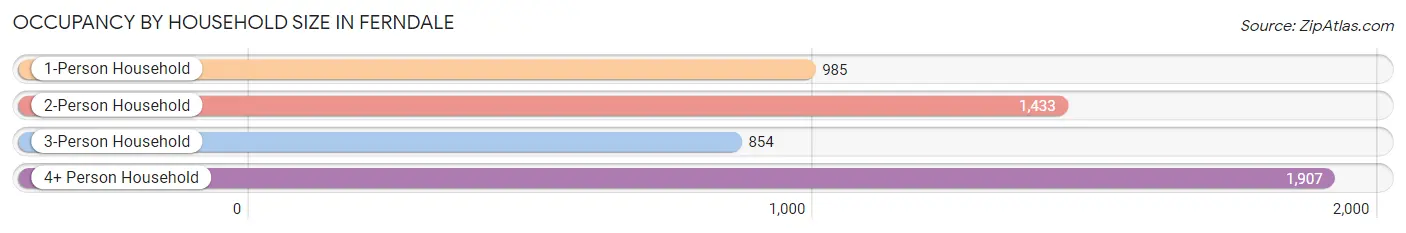
| Household Size | # Housing Units | % Housing Units |
| 1-Person Household | 985 | 19.0% |
| 2-Person Household | 1,433 | 27.7% |
| 3-Person Household | 854 | 16.5% |
| 4+ Person Household | 1,907 | 36.8% |
| Total Housing Units | 5,179 | 100.0% |
Occupancy by Ownership by Household Size in Ferndale
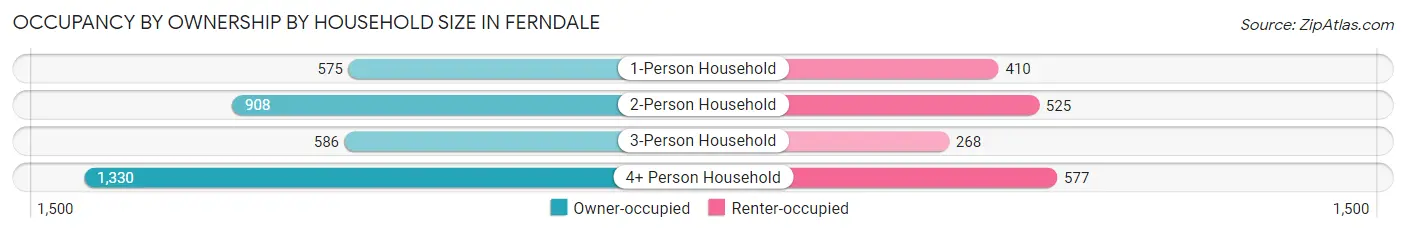
| Household Size | Owner-occupied | Renter-occupied |
| 1-Person Household | 575 (58.4%) | 410 (41.6%) |
| 2-Person Household | 908 (63.4%) | 525 (36.6%) |
| 3-Person Household | 586 (68.6%) | 268 (31.4%) |
| 4+ Person Household | 1,330 (69.7%) | 577 (30.3%) |
| Total Housing Units | 3,399 (65.6%) | 1,780 (34.4%) |
Occupancy by Educational Attainment in Ferndale
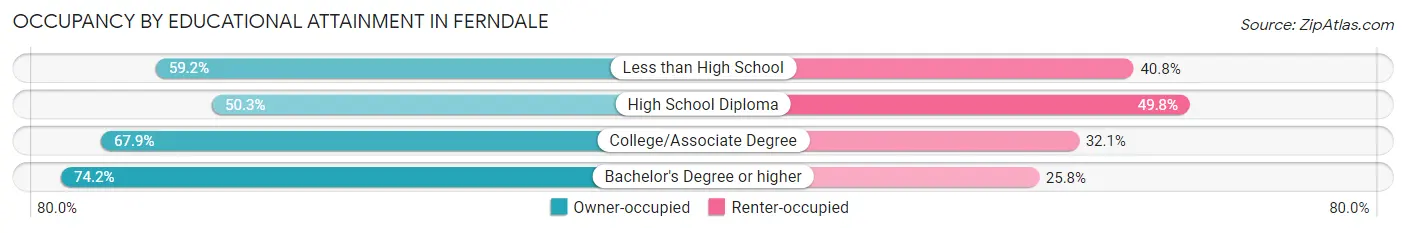
| Household Size | Owner-occupied | Renter-occupied |
| Less than High School | 161 (59.2%) | 111 (40.8%) |
| High School Diploma | 595 (50.2%) | 589 (49.7%) |
| College/Associate Degree | 1,283 (67.9%) | 607 (32.1%) |
| Bachelor's Degree or higher | 1,360 (74.2%) | 473 (25.8%) |
Occupancy by Age of Householder in Ferndale
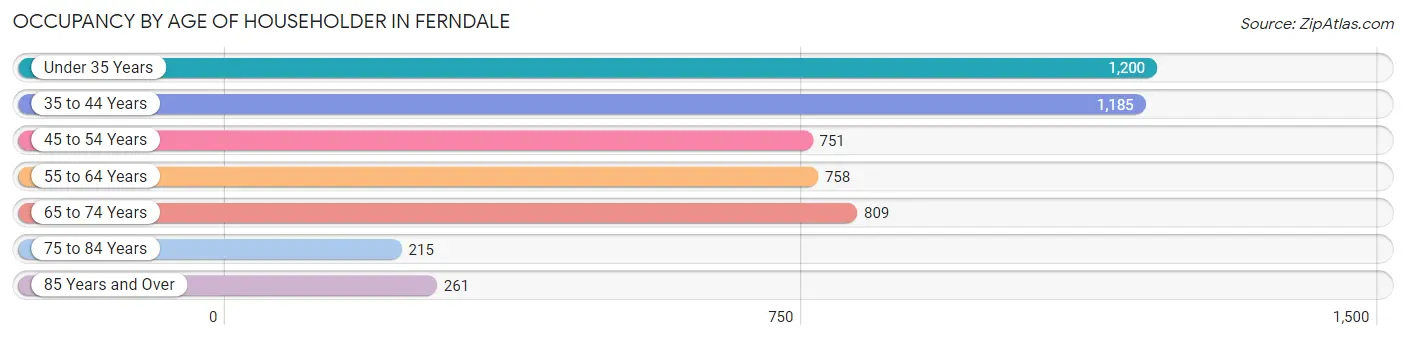
| Age Bracket | # Households | % Households |
| Under 35 Years | 1,200 | 23.2% |
| 35 to 44 Years | 1,185 | 22.9% |
| 45 to 54 Years | 751 | 14.5% |
| 55 to 64 Years | 758 | 14.6% |
| 65 to 74 Years | 809 | 15.6% |
| 75 to 84 Years | 215 | 4.2% |
| 85 Years and Over | 261 | 5.0% |
| Total | 5,179 | 100.0% |
Housing Finances in Ferndale
Median Income by Occupancy in Ferndale
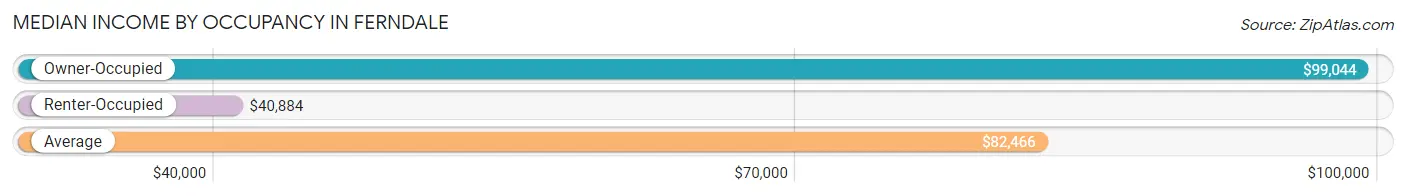
| Occupancy Type | # Households | Median Income |
| Owner-Occupied | 3,399 (65.6%) | $99,044 |
| Renter-Occupied | 1,780 (34.4%) | $40,884 |
| Average | 5,179 (100.0%) | $82,466 |
Occupancy by Householder Income Bracket in Ferndale
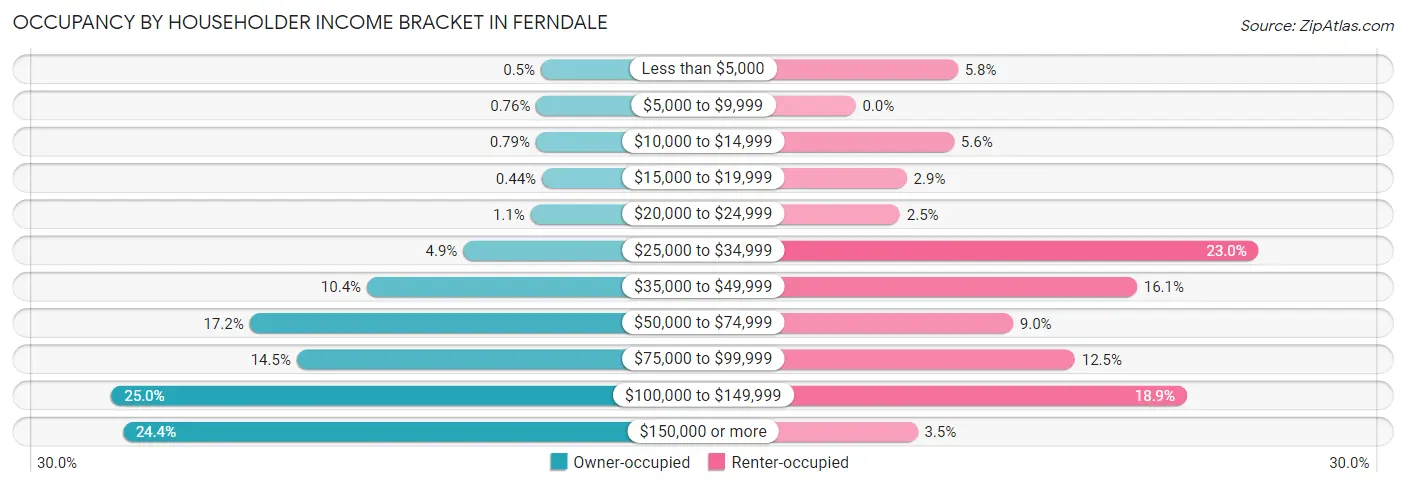
| Income Bracket | Owner-occupied | Renter-occupied |
| Less than $5,000 | 17 (0.5%) | 104 (5.8%) |
| $5,000 to $9,999 | 26 (0.8%) | 0 (0.0%) |
| $10,000 to $14,999 | 27 (0.8%) | 100 (5.6%) |
| $15,000 to $19,999 | 15 (0.4%) | 52 (2.9%) |
| $20,000 to $24,999 | 37 (1.1%) | 45 (2.5%) |
| $25,000 to $34,999 | 168 (4.9%) | 410 (23.0%) |
| $35,000 to $49,999 | 355 (10.4%) | 286 (16.1%) |
| $50,000 to $74,999 | 583 (17.2%) | 160 (9.0%) |
| $75,000 to $99,999 | 491 (14.4%) | 223 (12.5%) |
| $100,000 to $149,999 | 851 (25.0%) | 337 (18.9%) |
| $150,000 or more | 829 (24.4%) | 63 (3.5%) |
| Total | 3,399 (100.0%) | 1,780 (100.0%) |
Monthly Housing Cost Tiers in Ferndale
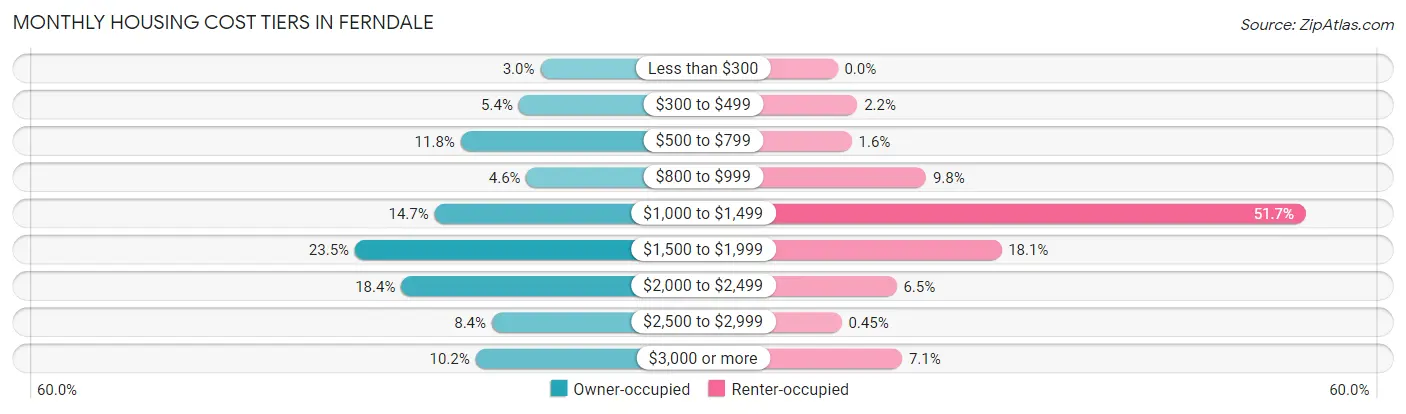
| Monthly Cost | Owner-occupied | Renter-occupied |
| Less than $300 | 103 (3.0%) | 0 (0.0%) |
| $300 to $499 | 184 (5.4%) | 39 (2.2%) |
| $500 to $799 | 402 (11.8%) | 28 (1.6%) |
| $800 to $999 | 155 (4.6%) | 174 (9.8%) |
| $1,000 to $1,499 | 500 (14.7%) | 921 (51.7%) |
| $1,500 to $1,999 | 799 (23.5%) | 322 (18.1%) |
| $2,000 to $2,499 | 625 (18.4%) | 116 (6.5%) |
| $2,500 to $2,999 | 285 (8.4%) | 8 (0.4%) |
| $3,000 or more | 346 (10.2%) | 127 (7.1%) |
| Total | 3,399 (100.0%) | 1,780 (100.0%) |
Physical Housing Characteristics in Ferndale
Housing Structures in Ferndale
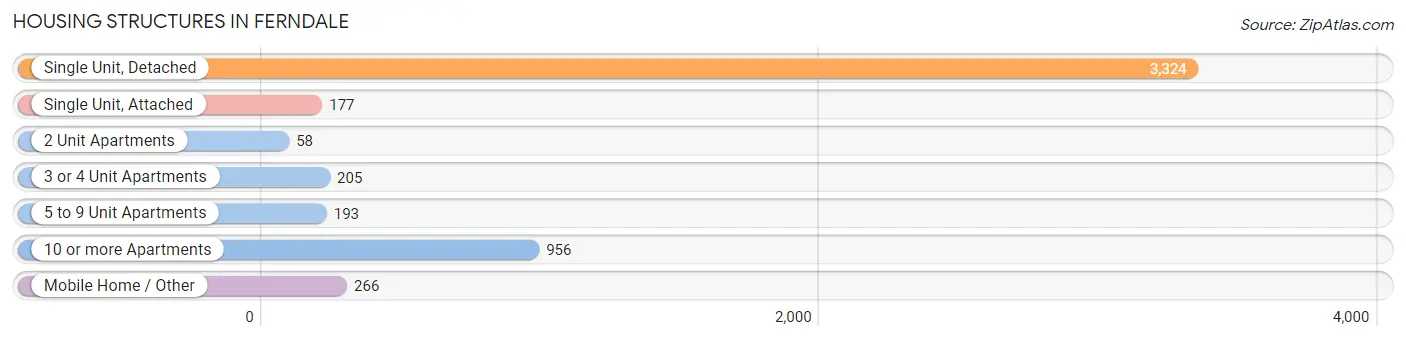
| Structure Type | # Housing Units | % Housing Units |
| Single Unit, Detached | 3,324 | 64.2% |
| Single Unit, Attached | 177 | 3.4% |
| 2 Unit Apartments | 58 | 1.1% |
| 3 or 4 Unit Apartments | 205 | 4.0% |
| 5 to 9 Unit Apartments | 193 | 3.7% |
| 10 or more Apartments | 956 | 18.5% |
| Mobile Home / Other | 266 | 5.1% |
| Total | 5,179 | 100.0% |
Housing Structures by Occupancy in Ferndale
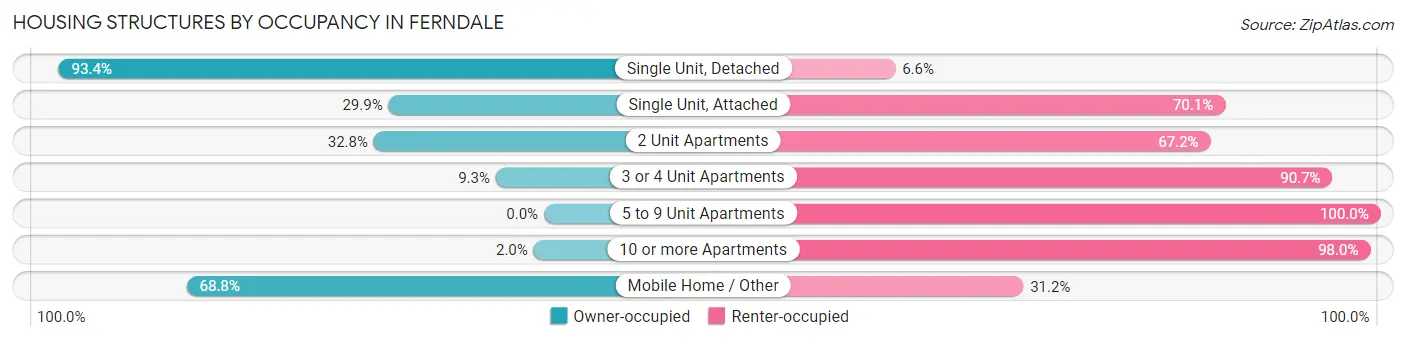
| Structure Type | Owner-occupied | Renter-occupied |
| Single Unit, Detached | 3,106 (93.4%) | 218 (6.6%) |
| Single Unit, Attached | 53 (29.9%) | 124 (70.1%) |
| 2 Unit Apartments | 19 (32.8%) | 39 (67.2%) |
| 3 or 4 Unit Apartments | 19 (9.3%) | 186 (90.7%) |
| 5 to 9 Unit Apartments | 0 (0.0%) | 193 (100.0%) |
| 10 or more Apartments | 19 (2.0%) | 937 (98.0%) |
| Mobile Home / Other | 183 (68.8%) | 83 (31.2%) |
| Total | 3,399 (65.6%) | 1,780 (34.4%) |
Housing Structures by Number of Rooms in Ferndale
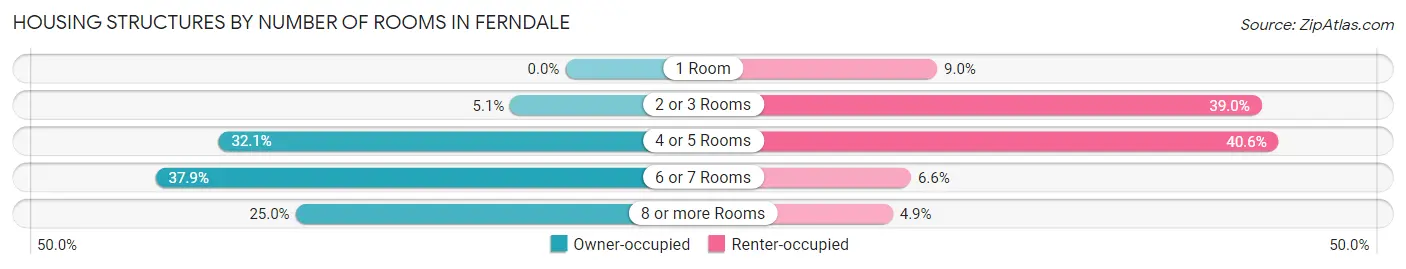
| Number of Rooms | Owner-occupied | Renter-occupied |
| 1 Room | 0 (0.0%) | 160 (9.0%) |
| 2 or 3 Rooms | 173 (5.1%) | 694 (39.0%) |
| 4 or 5 Rooms | 1,090 (32.1%) | 722 (40.6%) |
| 6 or 7 Rooms | 1,288 (37.9%) | 117 (6.6%) |
| 8 or more Rooms | 848 (24.9%) | 87 (4.9%) |
| Total | 3,399 (100.0%) | 1,780 (100.0%) |
Housing Structure by Heating Type in Ferndale
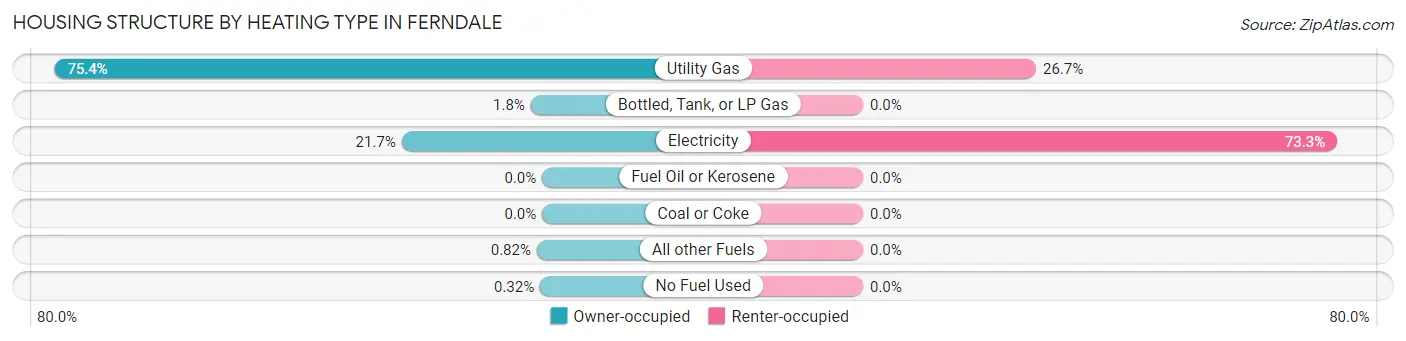
| Heating Type | Owner-occupied | Renter-occupied |
| Utility Gas | 2,562 (75.4%) | 476 (26.7%) |
| Bottled, Tank, or LP Gas | 60 (1.8%) | 0 (0.0%) |
| Electricity | 738 (21.7%) | 1,304 (73.3%) |
| Fuel Oil or Kerosene | 0 (0.0%) | 0 (0.0%) |
| Coal or Coke | 0 (0.0%) | 0 (0.0%) |
| All other Fuels | 28 (0.8%) | 0 (0.0%) |
| No Fuel Used | 11 (0.3%) | 0 (0.0%) |
| Total | 3,399 (100.0%) | 1,780 (100.0%) |
Household Vehicle Usage in Ferndale
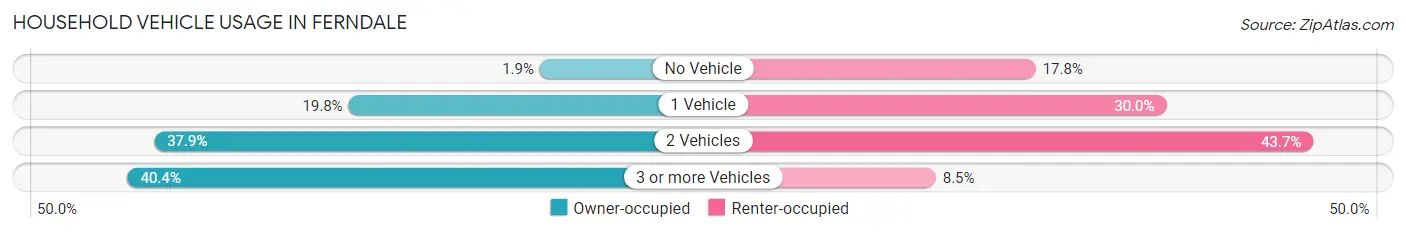
| Vehicles per Household | Owner-occupied | Renter-occupied |
| No Vehicle | 65 (1.9%) | 317 (17.8%) |
| 1 Vehicle | 672 (19.8%) | 534 (30.0%) |
| 2 Vehicles | 1,289 (37.9%) | 778 (43.7%) |
| 3 or more Vehicles | 1,373 (40.4%) | 151 (8.5%) |
| Total | 3,399 (100.0%) | 1,780 (100.0%) |
Real Estate & Mortgages in Ferndale
Real Estate and Mortgage Overview in Ferndale
| Characteristic | Without Mortgage | With Mortgage |
| Housing Units | 814 | 2,585 |
| Median Property Value | $366,900 | $442,100 |
| Median Household Income | $67,105 | $745 |
| Monthly Housing Costs | $579 | $346 |
| Real Estate Taxes | $2,436 | $38 |
Property Value by Mortgage Status in Ferndale
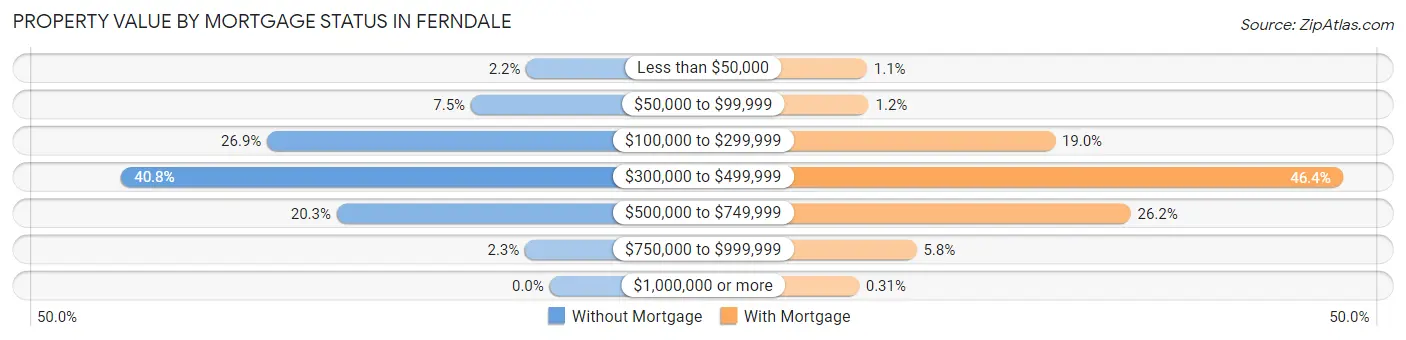
| Property Value | Without Mortgage | With Mortgage |
| Less than $50,000 | 18 (2.2%) | 28 (1.1%) |
| $50,000 to $99,999 | 61 (7.5%) | 32 (1.2%) |
| $100,000 to $299,999 | 219 (26.9%) | 491 (19.0%) |
| $300,000 to $499,999 | 332 (40.8%) | 1,199 (46.4%) |
| $500,000 to $749,999 | 165 (20.3%) | 677 (26.2%) |
| $750,000 to $999,999 | 19 (2.3%) | 150 (5.8%) |
| $1,000,000 or more | 0 (0.0%) | 8 (0.3%) |
| Total | 814 (100.0%) | 2,585 (100.0%) |
Household Income by Mortgage Status in Ferndale
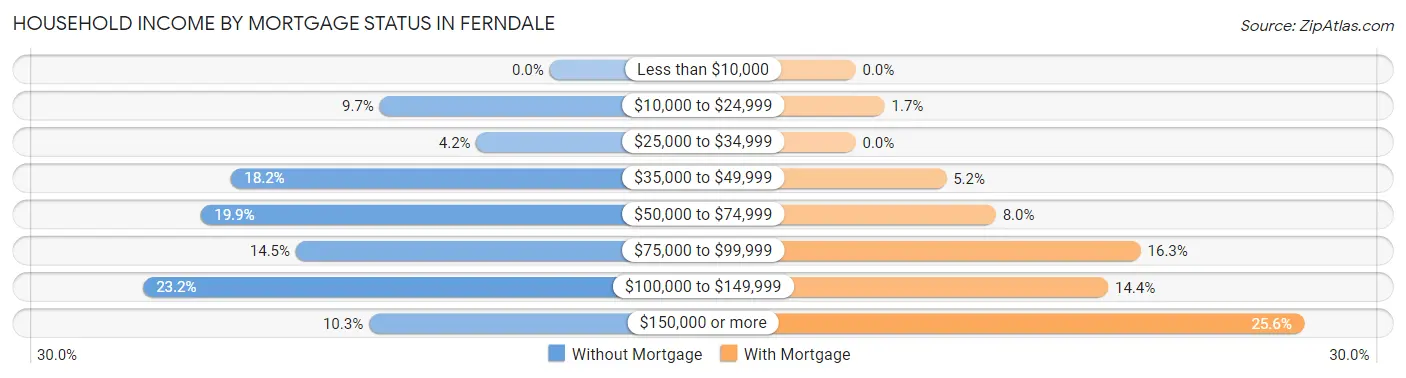
| Household Income | Without Mortgage | With Mortgage |
| Less than $10,000 | 0 (0.0%) | 0 (0.0%) |
| $10,000 to $24,999 | 79 (9.7%) | 43 (1.7%) |
| $25,000 to $34,999 | 34 (4.2%) | 0 (0.0%) |
| $35,000 to $49,999 | 148 (18.2%) | 134 (5.2%) |
| $50,000 to $74,999 | 162 (19.9%) | 207 (8.0%) |
| $75,000 to $99,999 | 118 (14.5%) | 421 (16.3%) |
| $100,000 to $149,999 | 189 (23.2%) | 373 (14.4%) |
| $150,000 or more | 84 (10.3%) | 662 (25.6%) |
| Total | 814 (100.0%) | 2,585 (100.0%) |
Property Value to Household Income Ratio in Ferndale
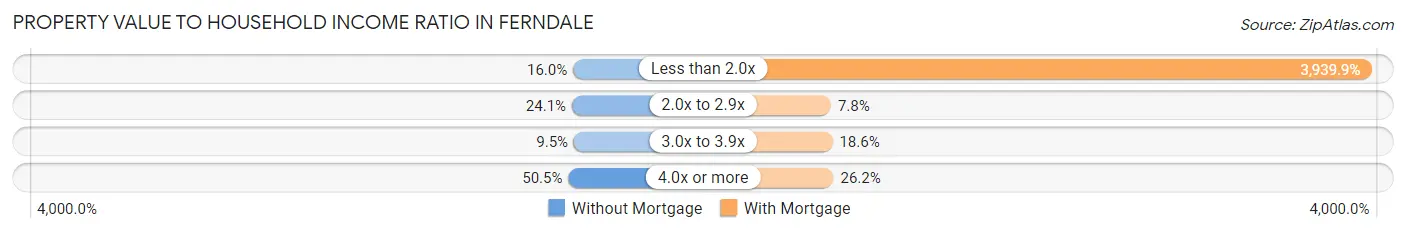
| Value-to-Income Ratio | Without Mortgage | With Mortgage |
| Less than 2.0x | 130 (16.0%) | 101,847 (3,939.9%) |
| 2.0x to 2.9x | 196 (24.1%) | 201 (7.8%) |
| 3.0x to 3.9x | 77 (9.5%) | 480 (18.6%) |
| 4.0x or more | 411 (50.5%) | 676 (26.2%) |
| Total | 814 (100.0%) | 2,585 (100.0%) |
Real Estate Taxes by Mortgage Status in Ferndale
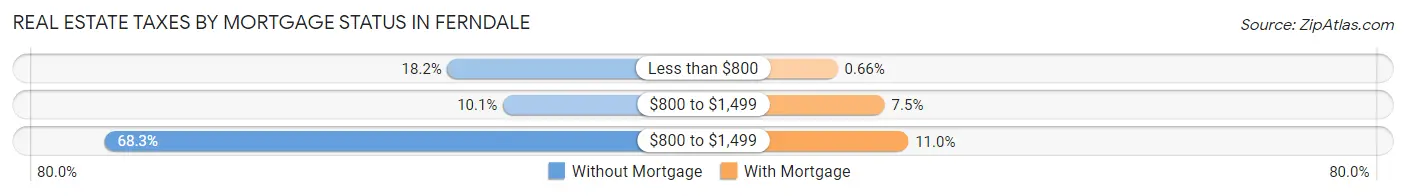
| Property Taxes | Without Mortgage | With Mortgage |
| Less than $800 | 148 (18.2%) | 17 (0.7%) |
| $800 to $1,499 | 82 (10.1%) | 195 (7.5%) |
| $800 to $1,499 | 556 (68.3%) | 284 (11.0%) |
| Total | 814 (100.0%) | 2,585 (100.0%) |
Health & Disability in Ferndale
Health Insurance Coverage by Age in Ferndale
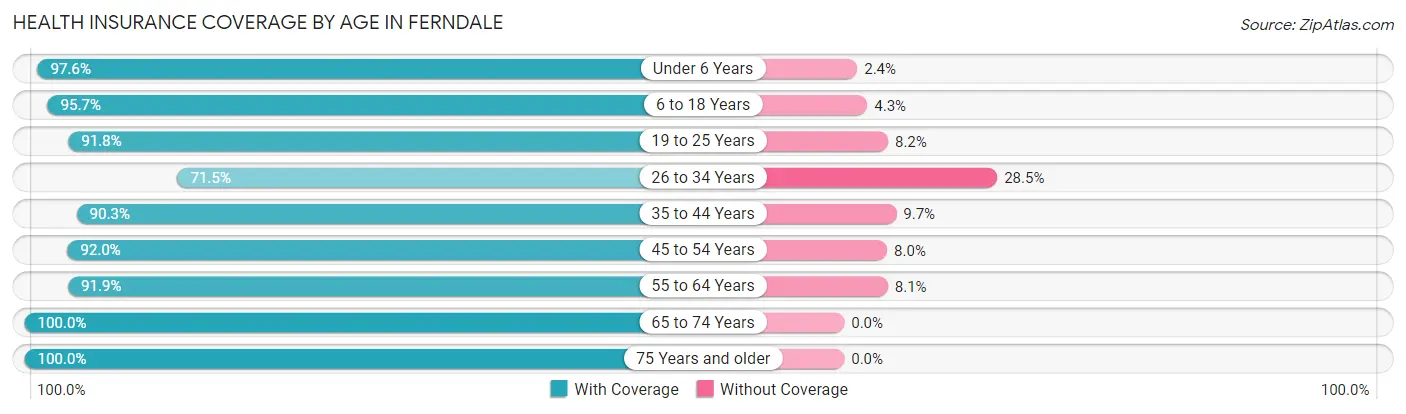
| Age Bracket | With Coverage | Without Coverage |
| Under 6 Years | 1,650 (97.6%) | 41 (2.4%) |
| 6 to 18 Years | 2,762 (95.7%) | 124 (4.3%) |
| 19 to 25 Years | 822 (91.8%) | 73 (8.2%) |
| 26 to 34 Years | 1,815 (71.5%) | 724 (28.5%) |
| 35 to 44 Years | 1,803 (90.3%) | 194 (9.7%) |
| 45 to 54 Years | 1,531 (92.0%) | 133 (8.0%) |
| 55 to 64 Years | 1,200 (91.9%) | 106 (8.1%) |
| 65 to 74 Years | 1,372 (100.0%) | 0 (0.0%) |
| 75 Years and older | 725 (100.0%) | 0 (0.0%) |
| Total | 13,680 (90.7%) | 1,395 (9.2%) |
Health Insurance Coverage by Citizenship Status in Ferndale
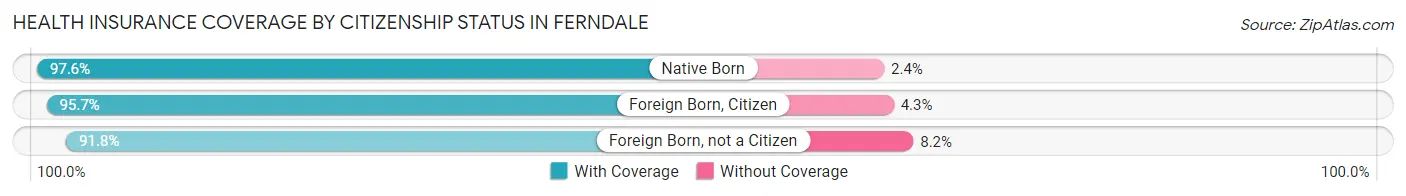
| Citizenship Status | With Coverage | Without Coverage |
| Native Born | 1,650 (97.6%) | 41 (2.4%) |
| Foreign Born, Citizen | 2,762 (95.7%) | 124 (4.3%) |
| Foreign Born, not a Citizen | 822 (91.8%) | 73 (8.2%) |
Health Insurance Coverage by Household Income in Ferndale
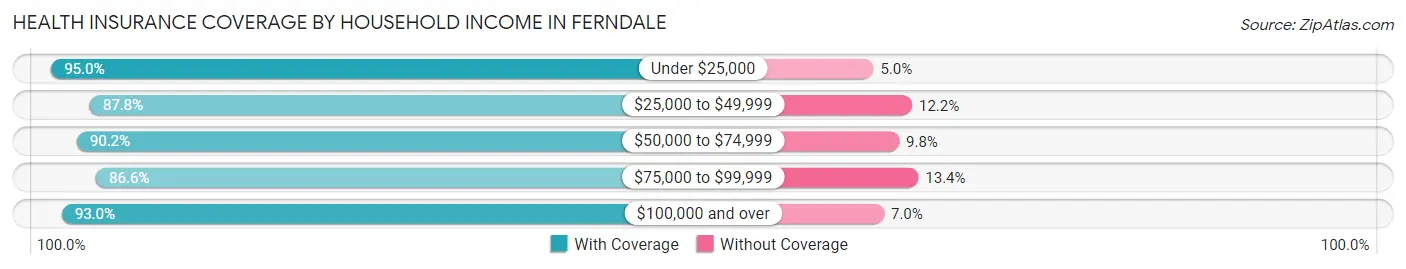
| Household Income | With Coverage | Without Coverage |
| Under $25,000 | 665 (95.0%) | 35 (5.0%) |
| $25,000 to $49,999 | 2,980 (87.8%) | 415 (12.2%) |
| $50,000 to $74,999 | 1,656 (90.2%) | 180 (9.8%) |
| $75,000 to $99,999 | 1,730 (86.6%) | 268 (13.4%) |
| $100,000 and over | 6,624 (93.0%) | 497 (7.0%) |
Public vs Private Health Insurance Coverage by Age in Ferndale
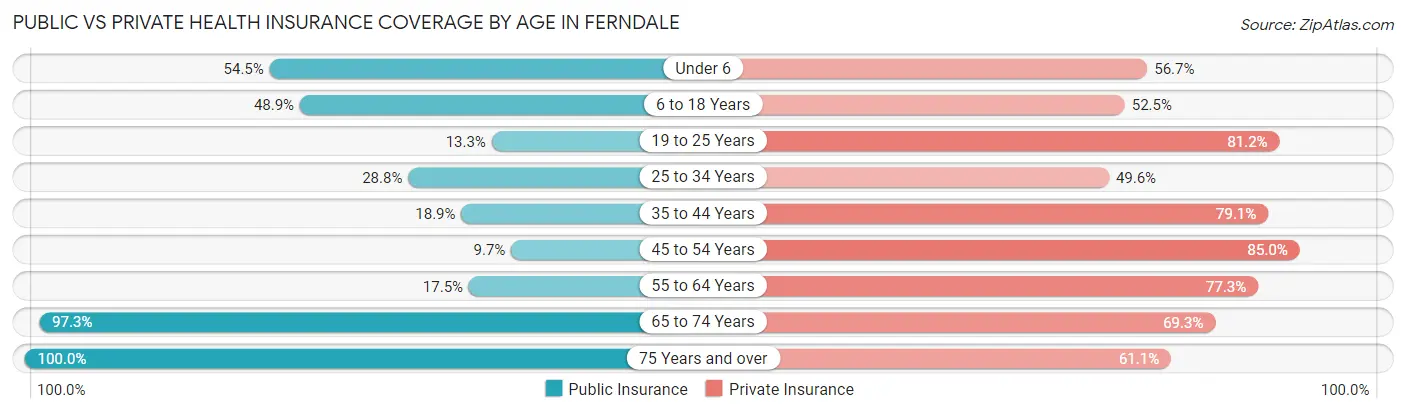
| Age Bracket | Public Insurance | Private Insurance |
| Under 6 | 922 (54.5%) | 959 (56.7%) |
| 6 to 18 Years | 1,411 (48.9%) | 1,516 (52.5%) |
| 19 to 25 Years | 119 (13.3%) | 727 (81.2%) |
| 25 to 34 Years | 731 (28.8%) | 1,259 (49.6%) |
| 35 to 44 Years | 378 (18.9%) | 1,580 (79.1%) |
| 45 to 54 Years | 161 (9.7%) | 1,414 (85.0%) |
| 55 to 64 Years | 229 (17.5%) | 1,009 (77.3%) |
| 65 to 74 Years | 1,335 (97.3%) | 951 (69.3%) |
| 75 Years and over | 725 (100.0%) | 443 (61.1%) |
| Total | 6,011 (39.9%) | 9,858 (65.4%) |
Disability Status by Sex by Age in Ferndale
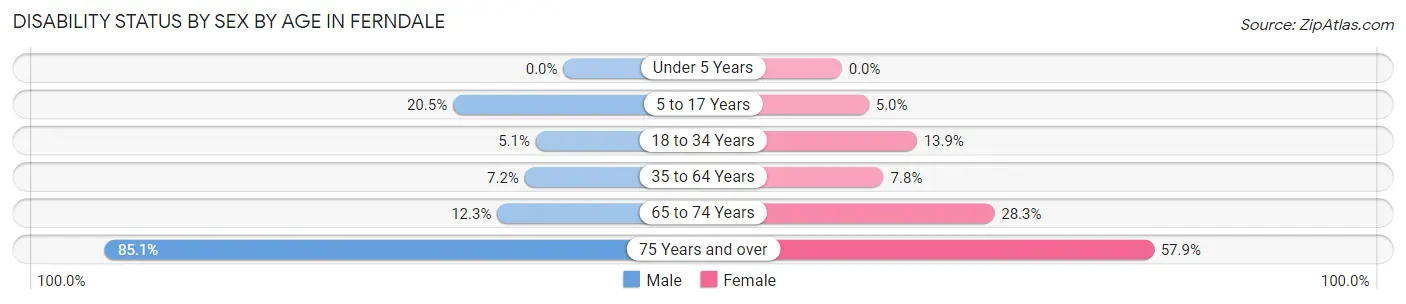
| Age Bracket | Male | Female |
| Under 5 Years | 0 (0.0%) | 0 (0.0%) |
| 5 to 17 Years | 261 (20.5%) | 88 (5.0%) |
| 18 to 34 Years | 96 (5.1%) | 241 (13.9%) |
| 35 to 64 Years | 170 (7.2%) | 202 (7.8%) |
| 65 to 74 Years | 73 (12.3%) | 220 (28.3%) |
| 75 Years and over | 154 (85.1%) | 315 (57.9%) |
Disability Class by Sex by Age in Ferndale
Disability Class: Hearing Difficulty
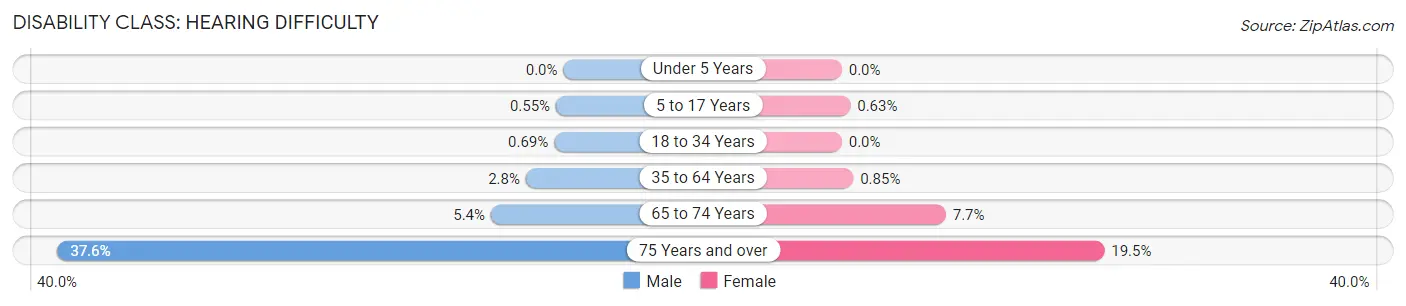
| Age Bracket | Male | Female |
| Under 5 Years | 0 (0.0%) | 0 (0.0%) |
| 5 to 17 Years | 7 (0.5%) | 11 (0.6%) |
| 18 to 34 Years | 13 (0.7%) | 0 (0.0%) |
| 35 to 64 Years | 66 (2.8%) | 22 (0.9%) |
| 65 to 74 Years | 32 (5.4%) | 60 (7.7%) |
| 75 Years and over | 68 (37.6%) | 106 (19.5%) |
Disability Class: Vision Difficulty
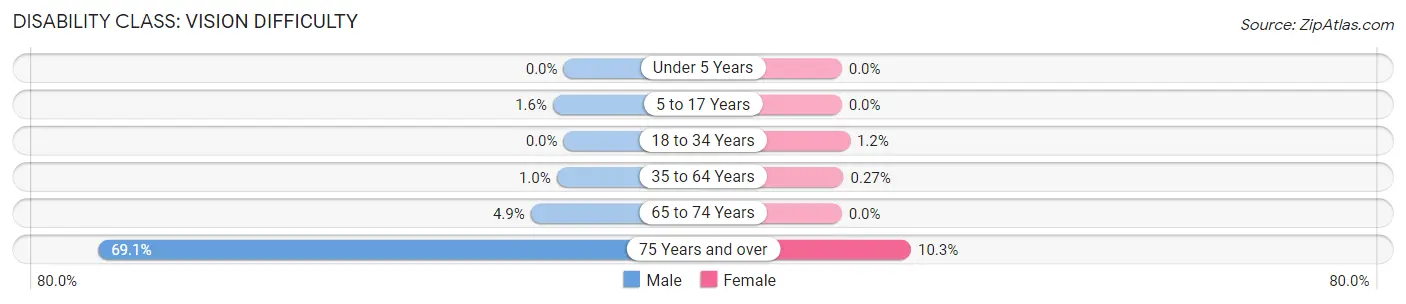
| Age Bracket | Male | Female |
| Under 5 Years | 0 (0.0%) | 0 (0.0%) |
| 5 to 17 Years | 20 (1.6%) | 0 (0.0%) |
| 18 to 34 Years | 0 (0.0%) | 21 (1.2%) |
| 35 to 64 Years | 24 (1.0%) | 7 (0.3%) |
| 65 to 74 Years | 29 (4.9%) | 0 (0.0%) |
| 75 Years and over | 125 (69.1%) | 56 (10.3%) |
Disability Class: Cognitive Difficulty
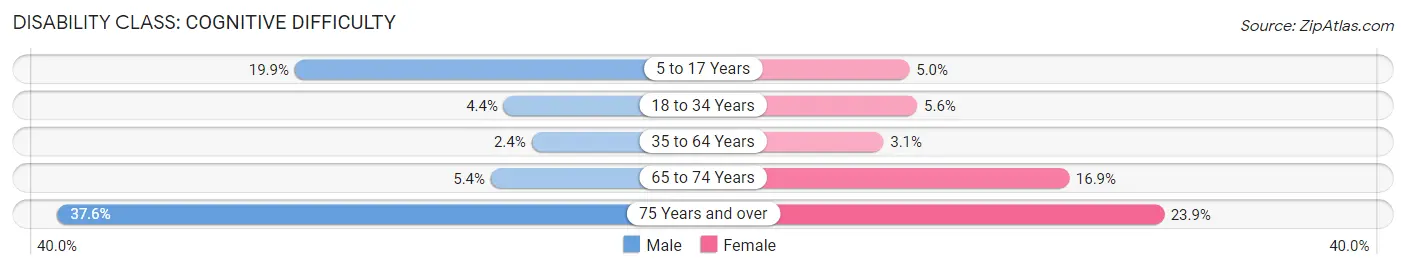
| Age Bracket | Male | Female |
| 5 to 17 Years | 254 (19.9%) | 88 (5.0%) |
| 18 to 34 Years | 83 (4.4%) | 97 (5.6%) |
| 35 to 64 Years | 56 (2.4%) | 80 (3.1%) |
| 65 to 74 Years | 32 (5.4%) | 131 (16.9%) |
| 75 Years and over | 68 (37.6%) | 130 (23.9%) |
Disability Class: Ambulatory Difficulty
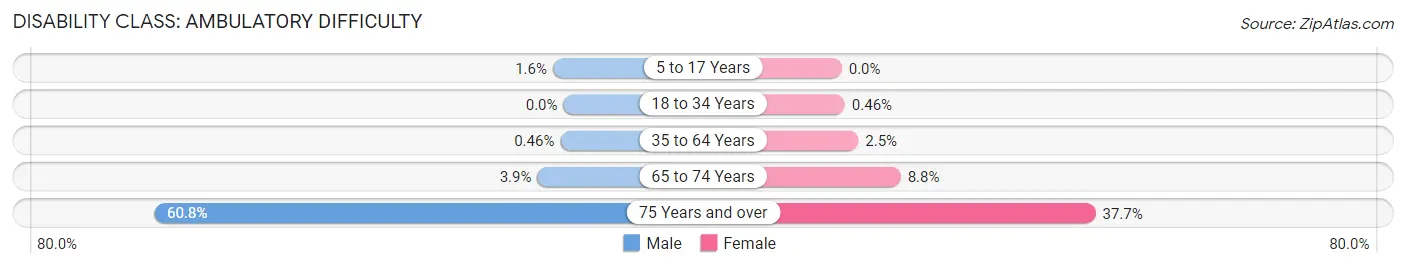
| Age Bracket | Male | Female |
| 5 to 17 Years | 20 (1.6%) | 0 (0.0%) |
| 18 to 34 Years | 0 (0.0%) | 8 (0.5%) |
| 35 to 64 Years | 11 (0.5%) | 64 (2.5%) |
| 65 to 74 Years | 23 (3.9%) | 68 (8.7%) |
| 75 Years and over | 110 (60.8%) | 205 (37.7%) |
Disability Class: Self-Care Difficulty
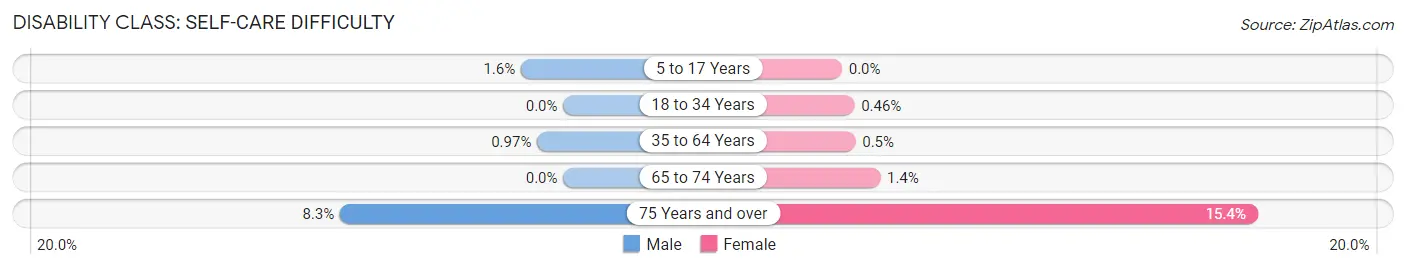
| Age Bracket | Male | Female |
| 5 to 17 Years | 20 (1.6%) | 0 (0.0%) |
| 18 to 34 Years | 0 (0.0%) | 8 (0.5%) |
| 35 to 64 Years | 23 (1.0%) | 13 (0.5%) |
| 65 to 74 Years | 0 (0.0%) | 11 (1.4%) |
| 75 Years and over | 15 (8.3%) | 84 (15.4%) |
Technology Access in Ferndale
Computing Device Access in Ferndale
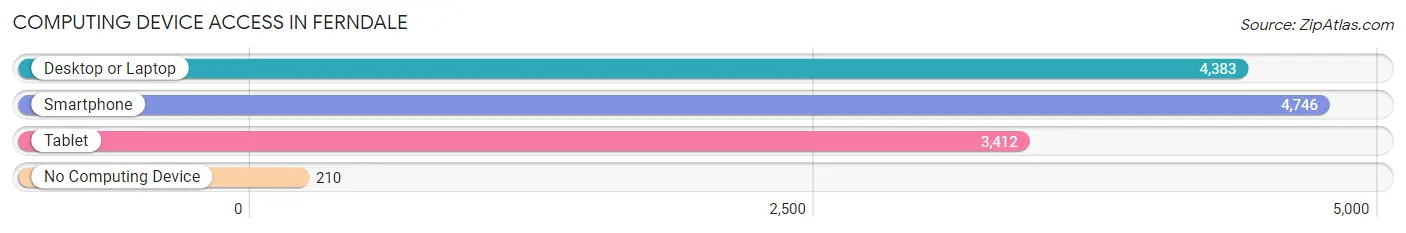
| Device Type | # Households | % Households |
| Desktop or Laptop | 4,383 | 84.6% |
| Smartphone | 4,746 | 91.6% |
| Tablet | 3,412 | 65.9% |
| No Computing Device | 210 | 4.1% |
| Total | 5,179 | 100.0% |
Internet Access in Ferndale
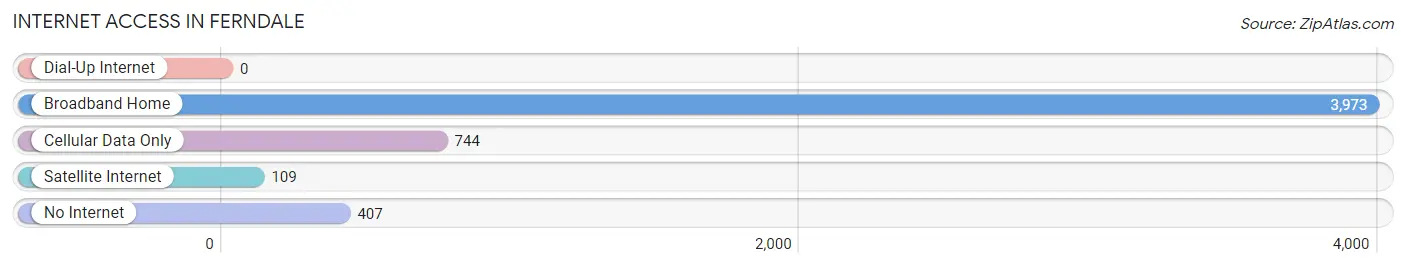
| Internet Type | # Households | % Households |
| Dial-Up Internet | 0 | 0.0% |
| Broadband Home | 3,973 | 76.7% |
| Cellular Data Only | 744 | 14.4% |
| Satellite Internet | 109 | 2.1% |
| No Internet | 407 | 7.9% |
| Total | 5,179 | 100.0% |
Ferndale Summary
Ferndale, Washington is a city located in Whatcom County, Washington, United States. It is part of the Bellingham metropolitan area, and is located approximately 20 miles south of the Canadian border. As of the 2010 census, the population of Ferndale was 11,415.
History
Ferndale was first settled in the late 1800s by a group of settlers from the Midwest. The town was originally known as Jam, but was later renamed Ferndale after the abundance of ferns in the area. The first post office was established in 1891, and the town was officially incorporated in 1907.
Ferndale was initially a farming and logging community, and the economy was largely based on these industries. In the early 1900s, the town began to grow and develop, and by the 1950s, it had become a popular tourist destination.
Geography
Ferndale is located in Whatcom County, Washington, approximately 20 miles south of the Canadian border. It is part of the Bellingham metropolitan area, and is situated on the Nooksack River. The city has a total area of 8.3 square miles, of which 8.2 square miles is land and 0.1 square miles is water.
The city is located in a temperate rainforest climate, with mild temperatures and abundant rainfall. The average annual temperature is 48.3°F, and the average annual precipitation is 44.3 inches.
Economy
Ferndale’s economy is largely based on the service industry, with many businesses providing services to the local community. The city is also home to several manufacturing companies, including a paper mill and a wood products plant.
The city is also home to several retail stores, restaurants, and other businesses. The city’s largest employer is the Ferndale School District, which employs over 1,000 people.
Demographics
As of the 2010 census, the population of Ferndale was 11,415. The racial makeup of the city was 87.3% White, 1.2% African American, 1.2% Native American, 2.2% Asian, 0.2% Pacific Islander, 5.2% from other races, and 3.0% from two or more races. Hispanic or Latino of any race were 10.2% of the population.
The median income for a household in Ferndale was $50,945, and the median income for a family was $60,945. The per capita income for the city was $24,945. About 8.2% of families and 10.7% of the population were below the poverty line, including 14.2% of those under age 18 and 6.2% of those age 65 or over.
Common Questions
What is Per Capita Income in Ferndale?
Per Capita income in Ferndale is $33,508.
What is the Median Family Income in Ferndale?
Median Family Income in Ferndale is $91,352.
What is the Median Household income in Ferndale?
Median Household Income in Ferndale is $82,466.
What is Income or Wage Gap in Ferndale?
Income or Wage Gap in Ferndale is 35.0%.
Women in Ferndale earn 65.0 cents for every dollar earned by a man.
What is Family Income Deficit in Ferndale?
Family Income Deficit in Ferndale is $4,392.
Families that are below poverty line in Ferndale earn $4,392 less on average than the poverty threshold level.
What is Inequality or Gini Index in Ferndale?
Inequality or Gini Index in Ferndale is 0.39.
What is the Total Population of Ferndale?
Total Population of Ferndale is 15,130.
What is the Total Male Population of Ferndale?
Total Male Population of Ferndale is 7,165.
What is the Total Female Population of Ferndale?
Total Female Population of Ferndale is 7,965.
What is the Ratio of Males per 100 Females in Ferndale?
There are 89.96 Males per 100 Females in Ferndale.
What is the Ratio of Females per 100 Males in Ferndale?
There are 111.17 Females per 100 Males in Ferndale.
What is the Median Population Age in Ferndale?
Median Population Age in Ferndale is 32.9 Years.
What is the Average Family Size in Ferndale
Average Family Size in Ferndale is 3.4 People.
What is the Average Household Size in Ferndale
Average Household Size in Ferndale is 2.9 People.
How Large is the Labor Force in Ferndale?
There are 7,319 People in the Labor Forcein in Ferndale.
What is the Percentage of People in the Labor Force in Ferndale?
65.1% of People are in the Labor Force in Ferndale.
What is the Unemployment Rate in Ferndale?
Unemployment Rate in Ferndale is 3.3%.