Lakewood, WA Map & Demographics
Lakewood Map
Lakewood Overview
$39,363
PER CAPITA INCOME
$77,675
AVG FAMILY INCOME
$65,531
AVG HOUSEHOLD INCOME
18.1%
WAGE / INCOME GAP [ % ]
81.9¢/ $1
WAGE / INCOME GAP [ $ ]
$10,158
FAMILY INCOME DEFICIT
0.45
INEQUALITY / GINI INDEX
63,142
TOTAL POPULATION
31,679
MALE POPULATION
31,463
FEMALE POPULATION
100.69
MALES / 100 FEMALES
99.32
FEMALES / 100 MALES
36.2
MEDIAN AGE
2.9
AVG FAMILY SIZE
2.3
AVG HOUSEHOLD SIZE
32,040
LABOR FORCE [ PEOPLE ]
62.1%
PERCENT IN LABOR FORCE
5.2%
UNEMPLOYMENT RATE
Lakewood Area Codes
Income in Lakewood
Income Overview in Lakewood
Per Capita Income in Lakewood is $39,363, while median incomes of families and households are $77,675 and $65,531 respectively.
| Characteristic | Number | Measure |
| Per Capita Income | 63,142 | $39,363 |
| Median Family Income | 15,676 | $77,675 |
| Mean Family Income | 15,676 | $102,816 |
| Median Household Income | 26,366 | $65,531 |
| Mean Household Income | 26,366 | $90,725 |
| Income Deficit | 15,676 | $10,158 |
| Wage / Income Gap (%) | 63,142 | 18.12% |
| Wage / Income Gap ($) | 63,142 | 81.88¢ per $1 |
| Gini / Inequality Index | 63,142 | 0.45 |
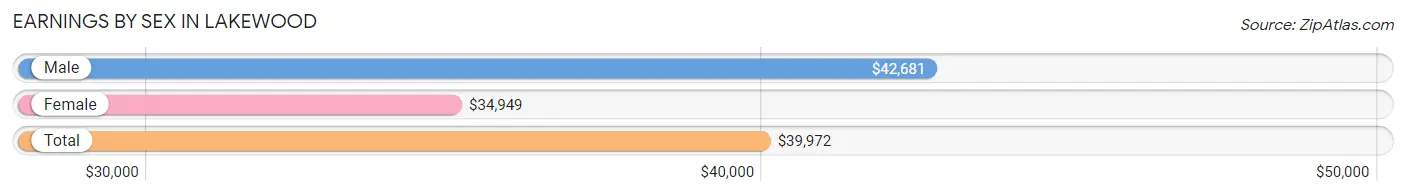
Earnings by Sex in Lakewood
Average Earnings in Lakewood are $39,972, $42,681 for men and $34,949 for women, a difference of 18.1%.
| Sex | Number | Average Earnings |
| Male | 17,530 (52.5%) | $42,681 |
| Female | 15,875 (47.5%) | $34,949 |
| Total | 33,405 (100.0%) | $39,972 |
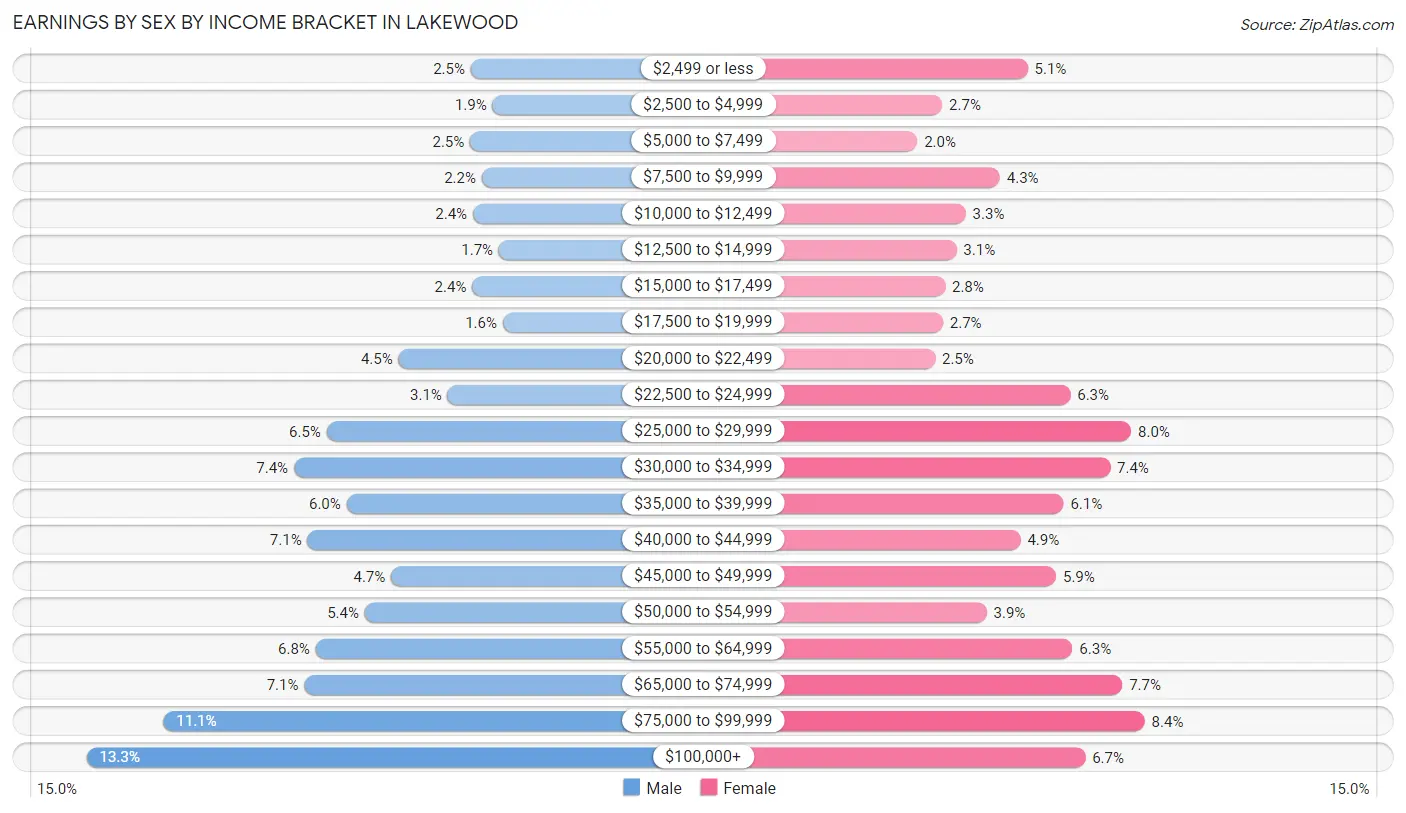
Earnings by Sex by Income Bracket in Lakewood
The most common earnings brackets in Lakewood are $100,000+ for men (2,325 | 13.3%) and $75,000 to $99,999 for women (1,328 | 8.4%).
| Income | Male | Female |
| $2,499 or less | 432 (2.5%) | 806 (5.1%) |
| $2,500 to $4,999 | 325 (1.8%) | 426 (2.7%) |
| $5,000 to $7,499 | 434 (2.5%) | 314 (2.0%) |
| $7,500 to $9,999 | 377 (2.1%) | 683 (4.3%) |
| $10,000 to $12,499 | 420 (2.4%) | 531 (3.3%) |
| $12,500 to $14,999 | 292 (1.7%) | 489 (3.1%) |
| $15,000 to $17,499 | 424 (2.4%) | 438 (2.8%) |
| $17,500 to $19,999 | 274 (1.6%) | 428 (2.7%) |
| $20,000 to $22,499 | 787 (4.5%) | 393 (2.5%) |
| $22,500 to $24,999 | 545 (3.1%) | 997 (6.3%) |
| $25,000 to $29,999 | 1,142 (6.5%) | 1,269 (8.0%) |
| $30,000 to $34,999 | 1,303 (7.4%) | 1,175 (7.4%) |
| $35,000 to $39,999 | 1,043 (5.9%) | 967 (6.1%) |
| $40,000 to $44,999 | 1,236 (7.0%) | 774 (4.9%) |
| $45,000 to $49,999 | 824 (4.7%) | 933 (5.9%) |
| $50,000 to $54,999 | 954 (5.4%) | 624 (3.9%) |
| $55,000 to $64,999 | 1,196 (6.8%) | 1,007 (6.3%) |
| $65,000 to $74,999 | 1,251 (7.1%) | 1,229 (7.7%) |
| $75,000 to $99,999 | 1,946 (11.1%) | 1,328 (8.4%) |
| $100,000+ | 2,325 (13.3%) | 1,064 (6.7%) |
| Total | 17,530 (100.0%) | 15,875 (100.0%) |
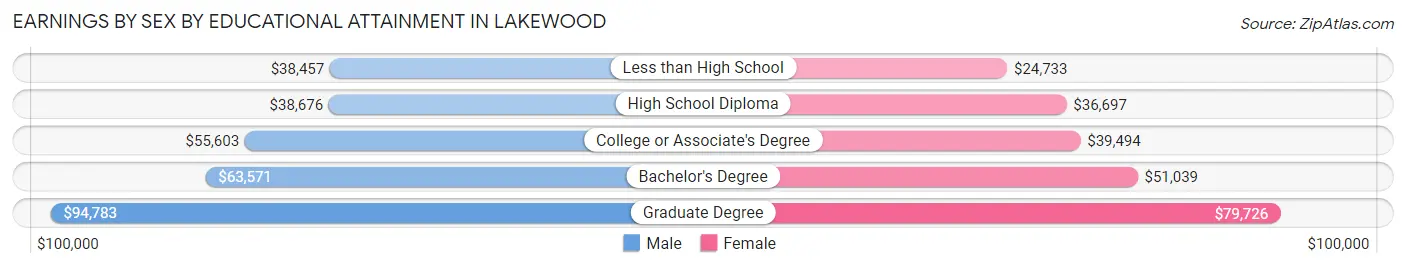
Earnings by Sex by Educational Attainment in Lakewood
Average earnings in Lakewood are $48,371 for men and $41,424 for women, a difference of 14.4%. Men with an educational attainment of graduate degree enjoy the highest average annual earnings of $94,783, while those with less than high school education earn the least with $38,457. Women with an educational attainment of graduate degree earn the most with the average annual earnings of $79,726, while those with less than high school education have the smallest earnings of $24,733.
| Educational Attainment | Male Income | Female Income |
| Less than High School | $38,457 | $24,733 |
| High School Diploma | $38,676 | $36,697 |
| College or Associate's Degree | $55,603 | $39,494 |
| Bachelor's Degree | $63,571 | $51,039 |
| Graduate Degree | $94,783 | $79,726 |
| Total | $48,371 | $41,424 |
Family Income in Lakewood
Family Income Brackets in Lakewood
According to the Lakewood family income data, there are 2,994 families falling into the $50,000 to $74,999 income range, which is the most common income bracket and makes up 19.1% of all families. Conversely, the $10,000 to $14,999 income bracket is the least frequent group with only 157 families (1.0%) belonging to this category.
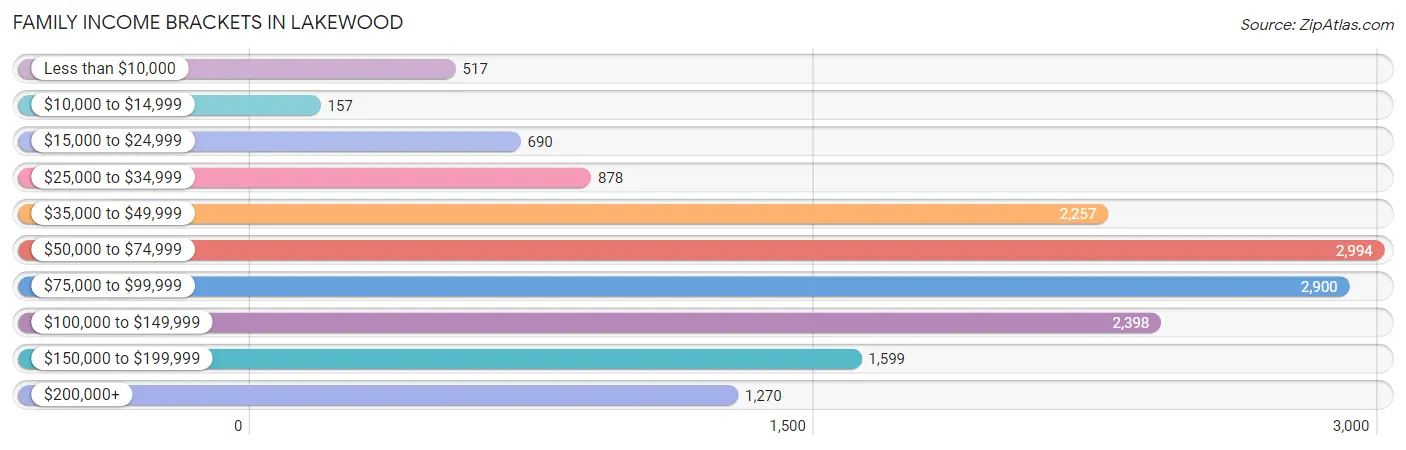
| Income Bracket | # Families | % Families |
| Less than $10,000 | 517 | 3.3% |
| $10,000 to $14,999 | 157 | 1.0% |
| $15,000 to $24,999 | 690 | 4.4% |
| $25,000 to $34,999 | 878 | 5.6% |
| $35,000 to $49,999 | 2,257 | 14.4% |
| $50,000 to $74,999 | 2,994 | 19.1% |
| $75,000 to $99,999 | 2,900 | 18.5% |
| $100,000 to $149,999 | 2,398 | 15.3% |
| $150,000 to $199,999 | 1,599 | 10.2% |
| $200,000+ | 1,270 | 8.1% |
Family Income by Famaliy Size in Lakewood
6-person families (213 | 1.4%) account for the highest median family income in Lakewood with $138,482 per family, while 2-person families (7,948 | 50.7%) have the highest median income of $36,441 per family member.
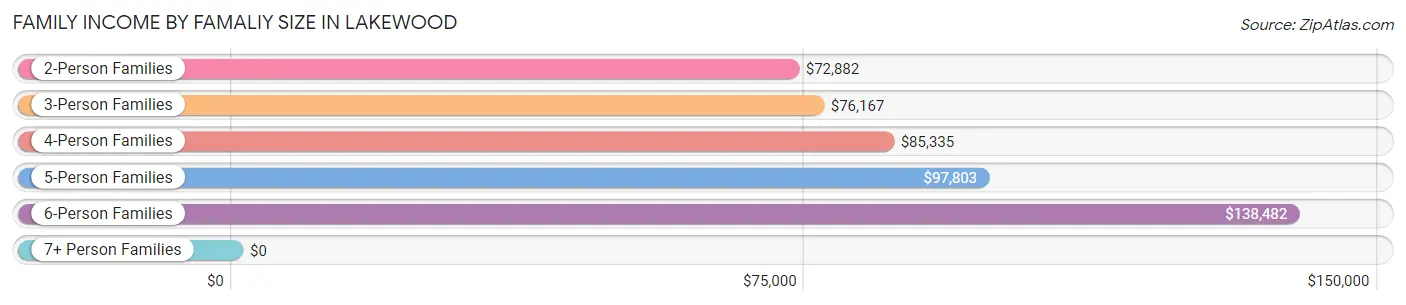
| Income Bracket | # Families | Median Income |
| 2-Person Families | 7,948 (50.7%) | $72,882 |
| 3-Person Families | 3,796 (24.2%) | $76,167 |
| 4-Person Families | 2,485 (15.9%) | $85,335 |
| 5-Person Families | 820 (5.2%) | $97,803 |
| 6-Person Families | 213 (1.4%) | $138,482 |
| 7+ Person Families | 414 (2.6%) | $0 |
| Total | 15,676 (100.0%) | $77,675 |
Family Income by Number of Earners in Lakewood
The median family income in Lakewood is $77,675, with families comprising 3+ earners (1,398) having the highest median family income of $153,008, while families with 1 earner (5,977) have the lowest median family income of $53,736, accounting for 8.9% and 38.1% of families, respectively.
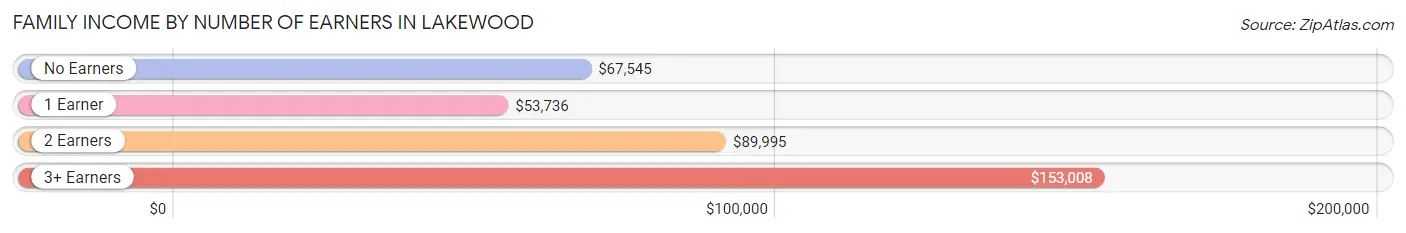
| Number of Earners | # Families | Median Income |
| No Earners | 2,212 (14.1%) | $67,545 |
| 1 Earner | 5,977 (38.1%) | $53,736 |
| 2 Earners | 6,089 (38.8%) | $89,995 |
| 3+ Earners | 1,398 (8.9%) | $153,008 |
| Total | 15,676 (100.0%) | $77,675 |
Household Income in Lakewood
Household Income Brackets in Lakewood
With 5,959 households falling in the category, the $50,000 to $74,999 income range is the most frequent in Lakewood, accounting for 22.6% of all households. In contrast, only 738 households (2.8%) fall into the $10,000 to $14,999 income bracket, making it the least populous group.
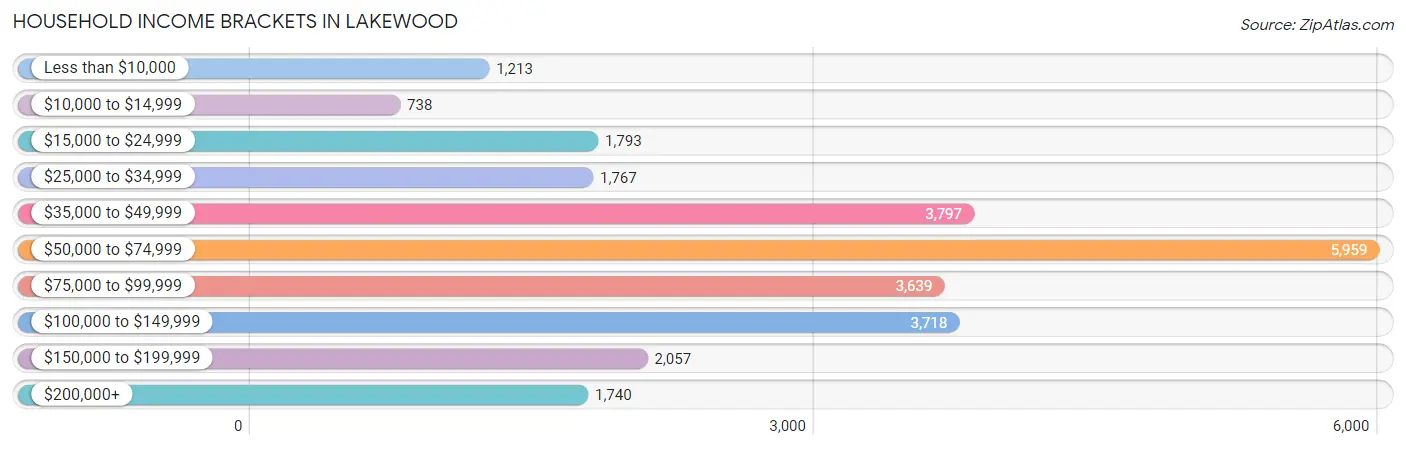
| Income Bracket | # Households | % Households |
| Less than $10,000 | 1,213 | 4.6% |
| $10,000 to $14,999 | 738 | 2.8% |
| $15,000 to $24,999 | 1,793 | 6.8% |
| $25,000 to $34,999 | 1,767 | 6.7% |
| $35,000 to $49,999 | 3,797 | 14.4% |
| $50,000 to $74,999 | 5,959 | 22.6% |
| $75,000 to $99,999 | 3,639 | 13.8% |
| $100,000 to $149,999 | 3,718 | 14.1% |
| $150,000 to $199,999 | 2,057 | 7.8% |
| $200,000+ | 1,740 | 6.6% |
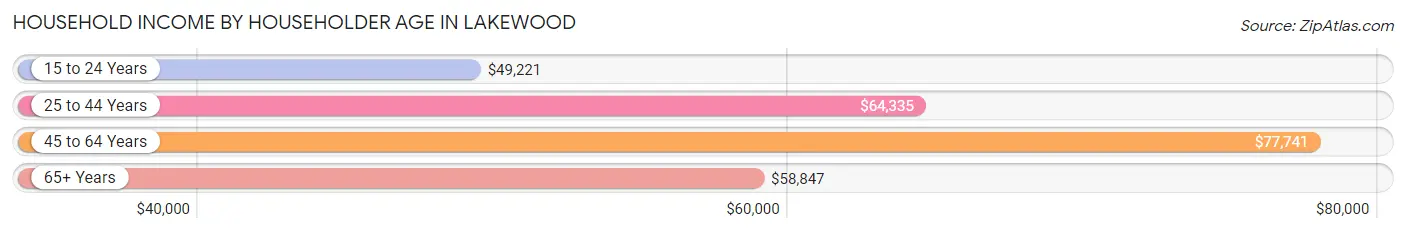
Household Income by Householder Age in Lakewood
The median household income in Lakewood is $65,531, with the highest median household income of $77,741 found in the 45 to 64 years age bracket for the primary householder. A total of 8,386 households (31.8%) fall into this category. Meanwhile, the 15 to 24 years age bracket for the primary householder has the lowest median household income of $49,221, with 1,965 households (7.4%) in this group.
| Income Bracket | # Households | Median Income |
| 15 to 24 Years | 1,965 (7.4%) | $49,221 |
| 25 to 44 Years | 9,499 (36.0%) | $64,335 |
| 45 to 64 Years | 8,386 (31.8%) | $77,741 |
| 65+ Years | 6,516 (24.7%) | $58,847 |
| Total | 26,366 (100.0%) | $65,531 |
Poverty in Lakewood
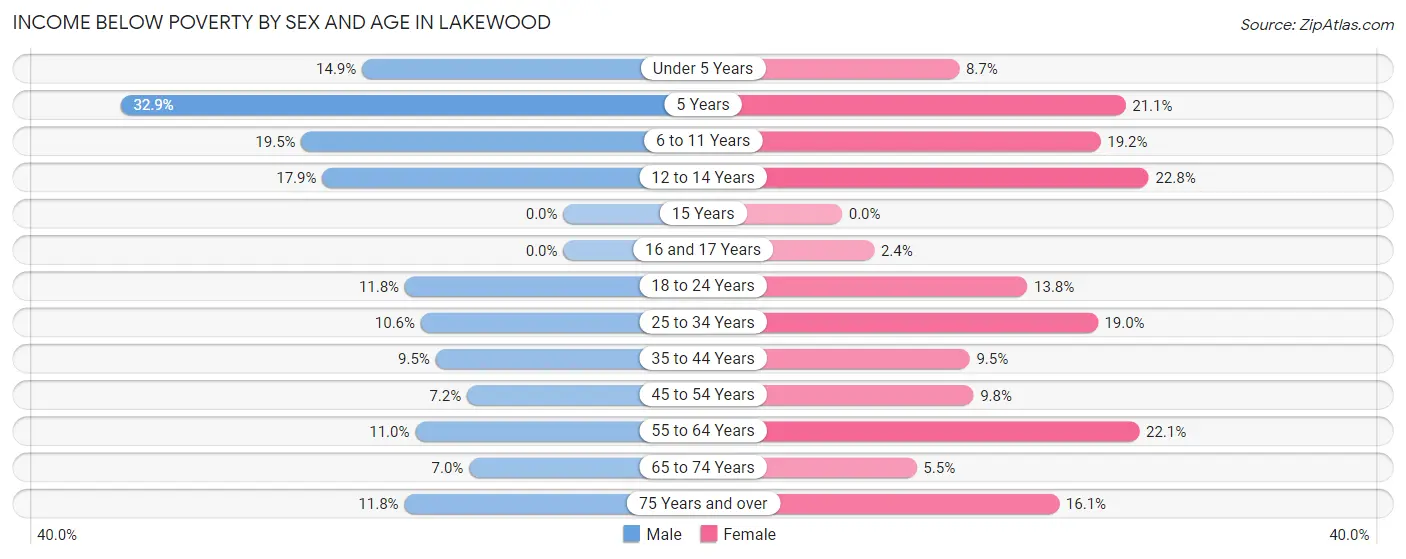
Income Below Poverty by Sex and Age in Lakewood
With 11.1% poverty level for males and 14.2% for females among the residents of Lakewood, 5 year old males and 12 to 14 year old females are the most vulnerable to poverty, with 168 males (32.9%) and 222 females (22.8%) in their respective age groups living below the poverty level.
| Age Bracket | Male | Female |
| Under 5 Years | 284 (14.9%) | 151 (8.7%) |
| 5 Years | 168 (32.9%) | 68 (21.0%) |
| 6 to 11 Years | 381 (19.5%) | 362 (19.2%) |
| 12 to 14 Years | 210 (17.9%) | 222 (22.8%) |
| 15 Years | 0 (0.0%) | 0 (0.0%) |
| 16 and 17 Years | 0 (0.0%) | 10 (2.4%) |
| 18 to 24 Years | 405 (11.8%) | 406 (13.8%) |
| 25 to 34 Years | 635 (10.6%) | 989 (19.0%) |
| 35 to 44 Years | 376 (9.5%) | 346 (9.5%) |
| 45 to 54 Years | 225 (7.1%) | 344 (9.8%) |
| 55 to 64 Years | 389 (11.0%) | 961 (22.1%) |
| 65 to 74 Years | 199 (7.0%) | 179 (5.5%) |
| 75 Years and over | 203 (11.8%) | 369 (16.1%) |
| Total | 3,475 (11.1%) | 4,407 (14.2%) |
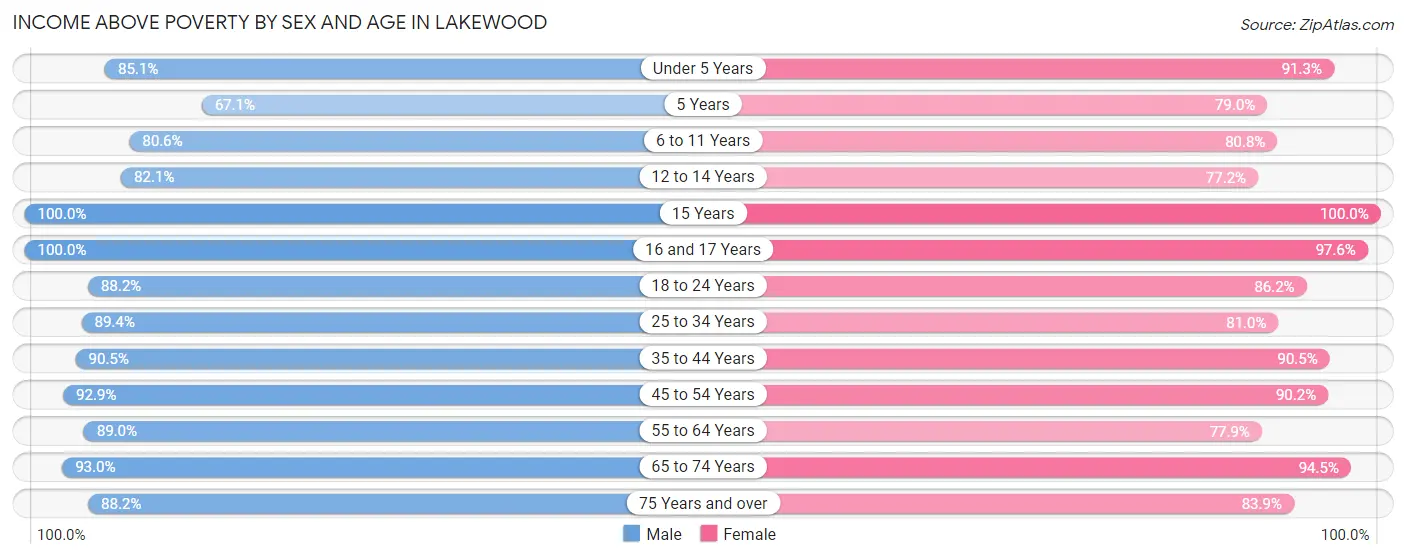
Income Above Poverty by Sex and Age in Lakewood
According to the poverty statistics in Lakewood, males aged 15 years and females aged 15 years are the age groups that are most secure financially, with 100.0% of males and 100.0% of females in these age groups living above the poverty line.
| Age Bracket | Male | Female |
| Under 5 Years | 1,617 (85.1%) | 1,584 (91.3%) |
| 5 Years | 343 (67.1%) | 255 (78.9%) |
| 6 to 11 Years | 1,578 (80.5%) | 1,524 (80.8%) |
| 12 to 14 Years | 963 (82.1%) | 753 (77.2%) |
| 15 Years | 304 (100.0%) | 545 (100.0%) |
| 16 and 17 Years | 677 (100.0%) | 408 (97.6%) |
| 18 to 24 Years | 3,038 (88.2%) | 2,545 (86.2%) |
| 25 to 34 Years | 5,367 (89.4%) | 4,223 (81.0%) |
| 35 to 44 Years | 3,590 (90.5%) | 3,304 (90.5%) |
| 45 to 54 Years | 2,920 (92.8%) | 3,181 (90.2%) |
| 55 to 64 Years | 3,152 (89.0%) | 3,394 (77.9%) |
| 65 to 74 Years | 2,649 (93.0%) | 3,050 (94.5%) |
| 75 Years and over | 1,518 (88.2%) | 1,920 (83.9%) |
| Total | 27,716 (88.9%) | 26,686 (85.8%) |
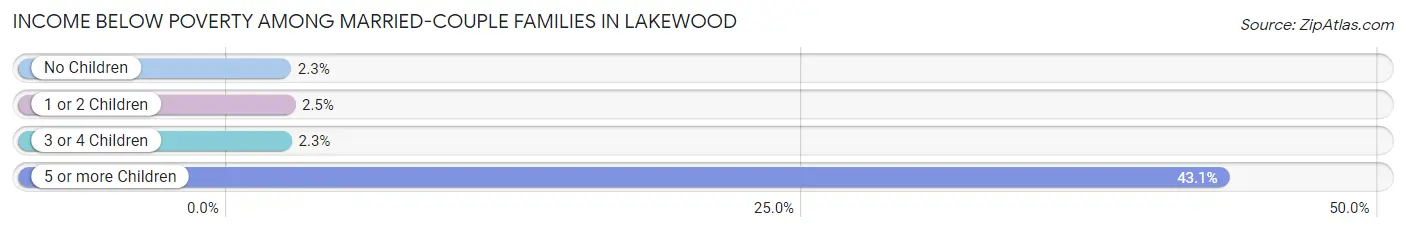
Income Below Poverty Among Married-Couple Families in Lakewood
The poverty statistics for married-couple families in Lakewood show that 2.6% or 265 of the total 10,348 families live below the poverty line. Families with 5 or more children have the highest poverty rate of 43.1%, comprising of 22 families. On the other hand, families with no children have the lowest poverty rate of 2.3%, which includes 151 families.
| Children | Above Poverty | Below Poverty |
| No Children | 6,401 (97.7%) | 151 (2.3%) |
| 1 or 2 Children | 3,066 (97.5%) | 78 (2.5%) |
| 3 or 4 Children | 587 (97.7%) | 14 (2.3%) |
| 5 or more Children | 29 (56.9%) | 22 (43.1%) |
| Total | 10,083 (97.4%) | 265 (2.6%) |
Income Below Poverty Among Single-Parent Households in Lakewood
According to the poverty data in Lakewood, 8.7% or 131 single-father households and 21.5% or 824 single-mother households are living below the poverty line. Among single-father households, those with 1 or 2 children have the highest poverty rate, with 116 households (15.8%) experiencing poverty. Likewise, among single-mother households, those with 3 or 4 children have the highest poverty rate, with 168 households (54.7%) falling below the poverty line.
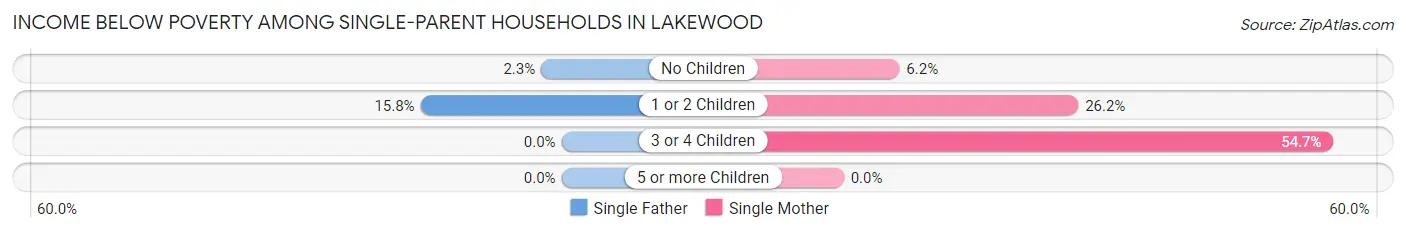
| Children | Single Father | Single Mother |
| No Children | 15 (2.3%) | 81 (6.2%) |
| 1 or 2 Children | 116 (15.8%) | 575 (26.2%) |
| 3 or 4 Children | 0 (0.0%) | 168 (54.7%) |
| 5 or more Children | 0 (0.0%) | 0 (0.0%) |
| Total | 131 (8.7%) | 824 (21.5%) |
Income Below Poverty Among Married-Couple vs Single-Parent Households in Lakewood
The poverty data for Lakewood shows that 265 of the married-couple family households (2.6%) and 955 of the single-parent households (17.9%) are living below the poverty level. Within the married-couple family households, those with 5 or more children have the highest poverty rate, with 22 households (43.1%) falling below the poverty line. Among the single-parent households, those with 3 or 4 children have the highest poverty rate, with 168 household (41.0%) living below poverty.
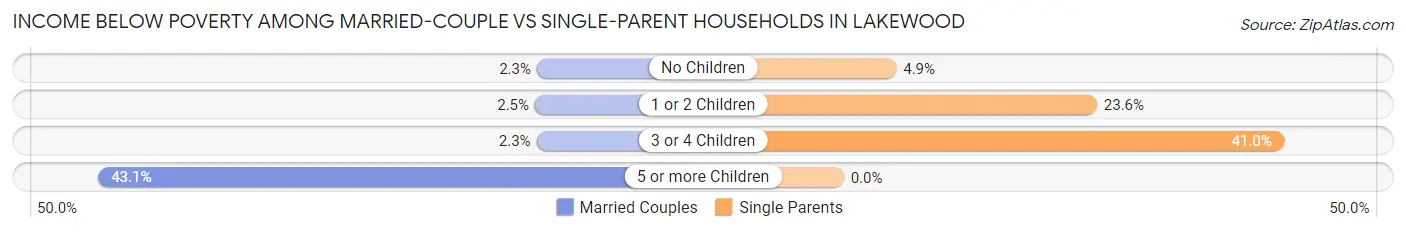
| Children | Married-Couple Families | Single-Parent Households |
| No Children | 151 (2.3%) | 96 (4.9%) |
| 1 or 2 Children | 78 (2.5%) | 691 (23.6%) |
| 3 or 4 Children | 14 (2.3%) | 168 (41.0%) |
| 5 or more Children | 22 (43.1%) | 0 (0.0%) |
| Total | 265 (2.6%) | 955 (17.9%) |
Race in Lakewood
The most populous races in Lakewood are White / Caucasian (32,458 | 51.4%), Hispanic or Latino (11,439 | 18.1%), and Two or more Races (9,532 | 15.1%).
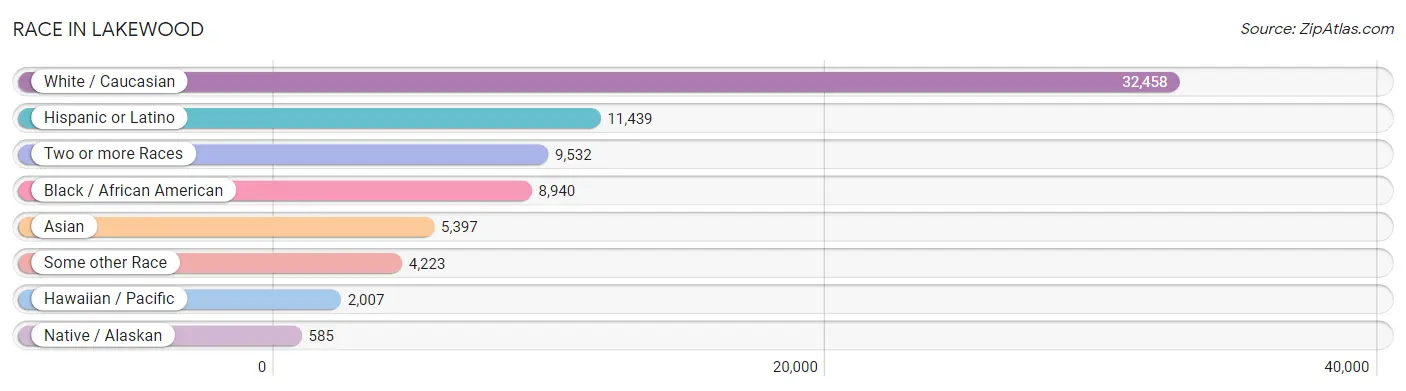
| Race | # Population | % Population |
| Asian | 5,397 | 8.6% |
| Black / African American | 8,940 | 14.2% |
| Hawaiian / Pacific | 2,007 | 3.2% |
| Hispanic or Latino | 11,439 | 18.1% |
| Native / Alaskan | 585 | 0.9% |
| White / Caucasian | 32,458 | 51.4% |
| Two or more Races | 9,532 | 15.1% |
| Some other Race | 4,223 | 6.7% |
| Total | 63,142 | 100.0% |
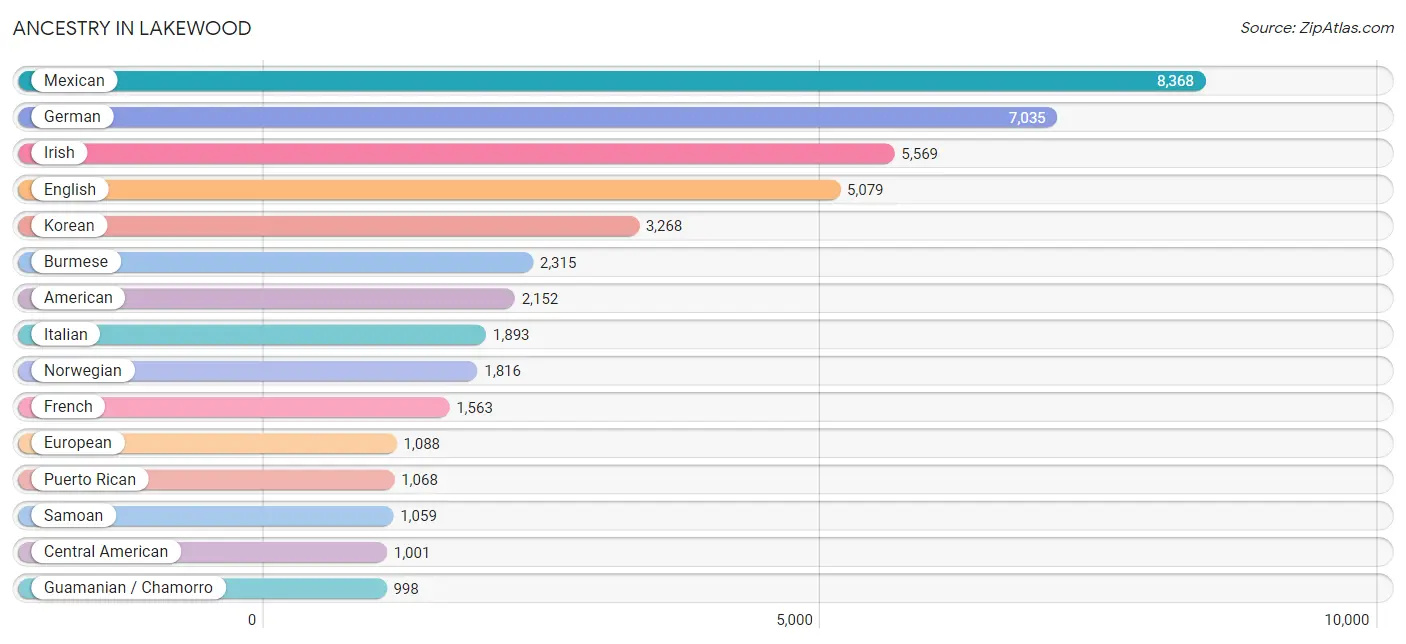
Ancestry in Lakewood
The most populous ancestries reported in Lakewood are Mexican (8,368 | 13.3%), German (7,035 | 11.1%), Irish (5,569 | 8.8%), English (5,079 | 8.0%), and Korean (3,268 | 5.2%), together accounting for 46.4% of all Lakewood residents.
| Ancestry | # Population | % Population |
| African | 451 | 0.7% |
| Alaska Native | 2 | 0.0% |
| Aleut | 85 | 0.1% |
| American | 2,152 | 3.4% |
| Arab | 387 | 0.6% |
| Armenian | 57 | 0.1% |
| Austrian | 45 | 0.1% |
| Bahamian | 5 | 0.0% |
| Belgian | 30 | 0.1% |
| Belizean | 106 | 0.2% |
| Bhutanese | 826 | 1.3% |
| Blackfeet | 91 | 0.1% |
| Brazilian | 34 | 0.1% |
| British | 446 | 0.7% |
| British West Indian | 16 | 0.0% |
| Burmese | 2,315 | 3.7% |
| Cajun | 13 | 0.0% |
| Canadian | 201 | 0.3% |
| Central American | 1,001 | 1.6% |
| Central American Indian | 109 | 0.2% |
| Cherokee | 144 | 0.2% |
| Chilean | 4 | 0.0% |
| Choctaw | 89 | 0.1% |
| Colombian | 27 | 0.0% |
| Colville | 30 | 0.1% |
| Croatian | 98 | 0.2% |
| Crow | 13 | 0.0% |
| Cuban | 193 | 0.3% |
| Czech | 198 | 0.3% |
| Danish | 447 | 0.7% |
| Dominican | 36 | 0.1% |
| Dutch | 398 | 0.6% |
| Eastern European | 43 | 0.1% |
| Ecuadorian | 68 | 0.1% |
| Egyptian | 14 | 0.0% |
| English | 5,079 | 8.0% |
| Ethiopian | 84 | 0.1% |
| European | 1,088 | 1.7% |
| Filipino | 40 | 0.1% |
| Finnish | 207 | 0.3% |
| French | 1,563 | 2.5% |
| French American Indian | 3 | 0.0% |
| French Canadian | 301 | 0.5% |
| German | 7,035 | 11.1% |
| Ghanaian | 80 | 0.1% |
| Greek | 28 | 0.0% |
| Guamanian / Chamorro | 998 | 1.6% |
| Guatemalan | 94 | 0.2% |
| Haitian | 10 | 0.0% |
| Honduran | 128 | 0.2% |
| Hopi | 6 | 0.0% |
| Hungarian | 67 | 0.1% |
| Icelander | 10 | 0.0% |
| Indian (Asian) | 421 | 0.7% |
| Indonesian | 2 | 0.0% |
| Inupiat | 56 | 0.1% |
| Iranian | 27 | 0.0% |
| Iraqi | 83 | 0.1% |
| Irish | 5,569 | 8.8% |
| Italian | 1,893 | 3.0% |
| Jamaican | 170 | 0.3% |
| Japanese | 148 | 0.2% |
| Kenyan | 121 | 0.2% |
| Korean | 3,268 | 5.2% |
| Latvian | 7 | 0.0% |
| Lebanese | 49 | 0.1% |
| Luxembourger | 8 | 0.0% |
| Mexican | 8,368 | 13.3% |
| Moroccan | 169 | 0.3% |
| Native Hawaiian | 851 | 1.3% |
| Navajo | 151 | 0.2% |
| Nicaraguan | 46 | 0.1% |
| Nigerian | 175 | 0.3% |
| Northern European | 342 | 0.5% |
| Norwegian | 1,816 | 2.9% |
| Osage | 66 | 0.1% |
| Pakistani | 61 | 0.1% |
| Palestinian | 30 | 0.1% |
| Panamanian | 215 | 0.3% |
| Pennsylvania German | 17 | 0.0% |
| Peruvian | 18 | 0.0% |
| Polish | 860 | 1.4% |
| Portuguese | 858 | 1.4% |
| Pueblo | 74 | 0.1% |
| Puerto Rican | 1,068 | 1.7% |
| Puget Sound Salish | 63 | 0.1% |
| Romanian | 35 | 0.1% |
| Russian | 141 | 0.2% |
| Salvadoran | 518 | 0.8% |
| Samoan | 1,059 | 1.7% |
| Scandinavian | 557 | 0.9% |
| Scotch-Irish | 400 | 0.6% |
| Scottish | 937 | 1.5% |
| Seminole | 32 | 0.1% |
| Shoshone | 8 | 0.0% |
| Sioux | 192 | 0.3% |
| Slavic | 10 | 0.0% |
| Slovak | 29 | 0.1% |
| South American | 134 | 0.2% |
| Spaniard | 70 | 0.1% |
| Spanish | 67 | 0.1% |
| Spanish American | 8 | 0.0% |
| Sri Lankan | 838 | 1.3% |
| Subsaharan African | 950 | 1.5% |
| Swedish | 685 | 1.1% |
| Swiss | 82 | 0.1% |
| Syrian | 29 | 0.1% |
| Thai | 184 | 0.3% |
| Tlingit-Haida | 97 | 0.2% |
| Tongan | 94 | 0.2% |
| Trinidadian and Tobagonian | 146 | 0.2% |
| Turkish | 26 | 0.0% |
| Ugandan | 29 | 0.1% |
| Ukrainian | 170 | 0.3% |
| Venezuelan | 17 | 0.0% |
| Welsh | 443 | 0.7% |
| West Indian | 115 | 0.2% |
| Yaqui | 12 | 0.0% |
| Yugoslavian | 9 | 0.0% | View All 119 Rows |
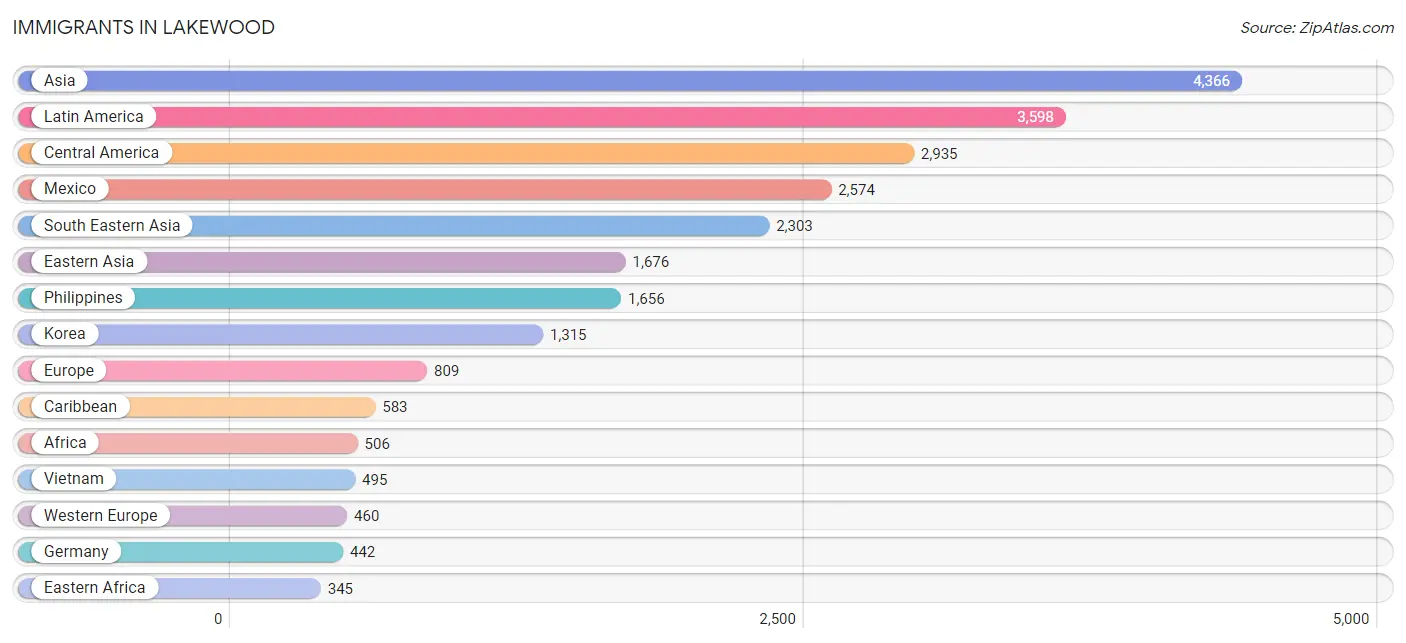
Immigrants in Lakewood
The most numerous immigrant groups reported in Lakewood came from Asia (4,366 | 6.9%), Latin America (3,598 | 5.7%), Central America (2,935 | 4.6%), Mexico (2,574 | 4.1%), and South Eastern Asia (2,303 | 3.6%), together accounting for 25.0% of all Lakewood residents.
| Immigration Origin | # Population | % Population |
| Africa | 506 | 0.8% |
| Asia | 4,366 | 6.9% |
| Australia | 5 | 0.0% |
| Austria | 18 | 0.0% |
| Belize | 77 | 0.1% |
| Brazil | 12 | 0.0% |
| Cambodia | 19 | 0.0% |
| Canada | 205 | 0.3% |
| Caribbean | 583 | 0.9% |
| Central America | 2,935 | 4.6% |
| China | 116 | 0.2% |
| Colombia | 16 | 0.0% |
| Cuba | 77 | 0.1% |
| Dominican Republic | 36 | 0.1% |
| Eastern Africa | 345 | 0.5% |
| Eastern Asia | 1,676 | 2.6% |
| Eastern Europe | 172 | 0.3% |
| Ecuador | 25 | 0.0% |
| El Salvador | 127 | 0.2% |
| England | 32 | 0.1% |
| Europe | 809 | 1.3% |
| Fiji | 11 | 0.0% |
| Germany | 442 | 0.7% |
| Guatemala | 50 | 0.1% |
| Honduras | 99 | 0.2% |
| India | 85 | 0.1% |
| Iraq | 83 | 0.1% |
| Ireland | 17 | 0.0% |
| Italy | 45 | 0.1% |
| Jamaica | 194 | 0.3% |
| Japan | 245 | 0.4% |
| Kazakhstan | 12 | 0.0% |
| Kenya | 267 | 0.4% |
| Korea | 1,315 | 2.1% |
| Latin America | 3,598 | 5.7% |
| Lebanon | 9 | 0.0% |
| Mexico | 2,574 | 4.1% |
| Micronesia | 135 | 0.2% |
| Moldova | 12 | 0.0% |
| Nepal | 113 | 0.2% |
| Nigeria | 111 | 0.2% |
| Northern Europe | 125 | 0.2% |
| Oceania | 246 | 0.4% |
| Pakistan | 7 | 0.0% |
| Panama | 8 | 0.0% |
| Peru | 18 | 0.0% |
| Philippines | 1,656 | 2.6% |
| Poland | 31 | 0.1% |
| Romania | 15 | 0.0% |
| Russia | 39 | 0.1% |
| Scotland | 42 | 0.1% |
| Senegal | 24 | 0.0% |
| South America | 80 | 0.1% |
| South Central Asia | 217 | 0.3% |
| South Eastern Asia | 2,303 | 3.6% |
| Southern Europe | 52 | 0.1% |
| Spain | 7 | 0.0% |
| Taiwan | 25 | 0.0% |
| Thailand | 131 | 0.2% |
| Trinidad and Tobago | 260 | 0.4% |
| Uganda | 56 | 0.1% |
| Ukraine | 75 | 0.1% |
| Venezuela | 9 | 0.0% |
| Vietnam | 495 | 0.8% |
| Western Africa | 161 | 0.3% |
| Western Asia | 170 | 0.3% |
| Western Europe | 460 | 0.7% |
| Zimbabwe | 22 | 0.0% | View All 68 Rows |
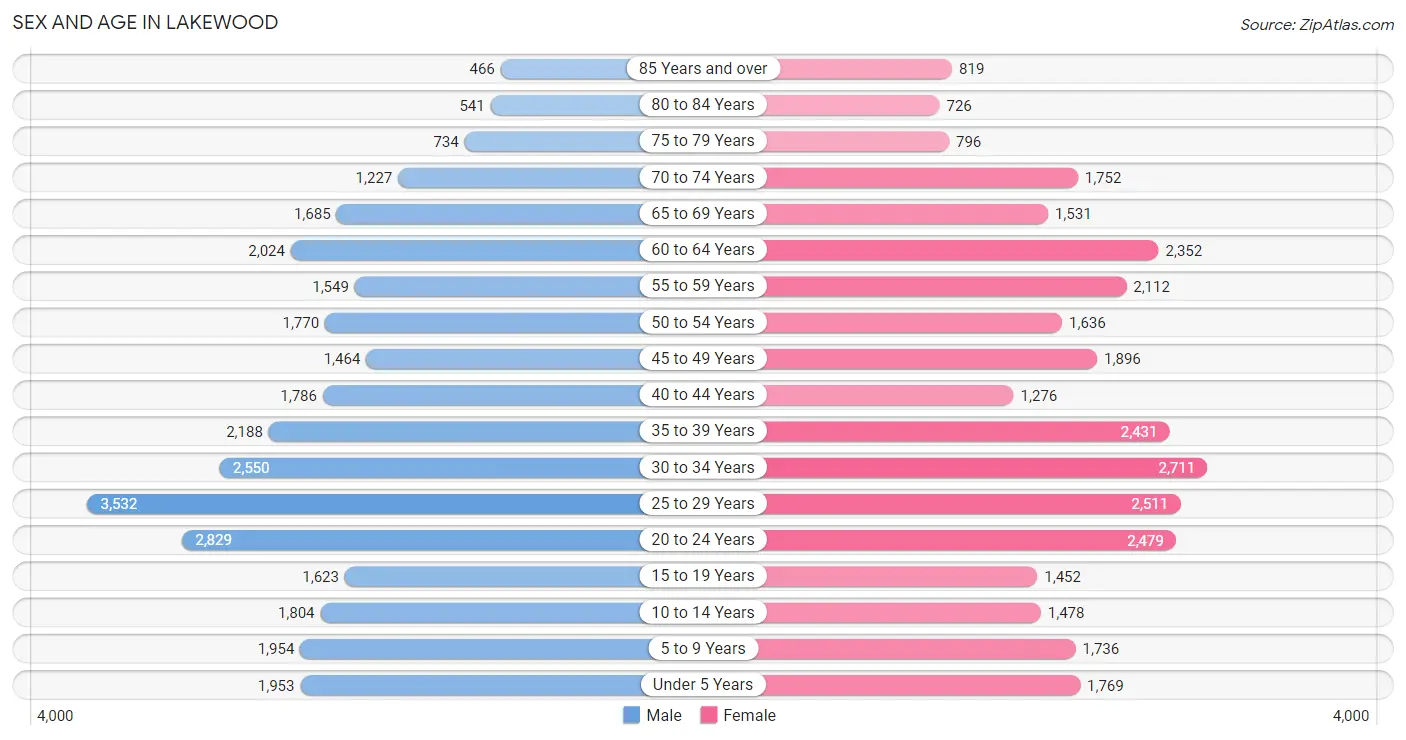
Sex and Age in Lakewood
Sex and Age in Lakewood
The most populous age groups in Lakewood are 25 to 29 Years (3,532 | 11.2%) for men and 30 to 34 Years (2,711 | 8.6%) for women.
| Age Bracket | Male | Female |
| Under 5 Years | 1,953 (6.2%) | 1,769 (5.6%) |
| 5 to 9 Years | 1,954 (6.2%) | 1,736 (5.5%) |
| 10 to 14 Years | 1,804 (5.7%) | 1,478 (4.7%) |
| 15 to 19 Years | 1,623 (5.1%) | 1,452 (4.6%) |
| 20 to 24 Years | 2,829 (8.9%) | 2,479 (7.9%) |
| 25 to 29 Years | 3,532 (11.2%) | 2,511 (8.0%) |
| 30 to 34 Years | 2,550 (8.1%) | 2,711 (8.6%) |
| 35 to 39 Years | 2,188 (6.9%) | 2,431 (7.7%) |
| 40 to 44 Years | 1,786 (5.6%) | 1,276 (4.1%) |
| 45 to 49 Years | 1,464 (4.6%) | 1,896 (6.0%) |
| 50 to 54 Years | 1,770 (5.6%) | 1,636 (5.2%) |
| 55 to 59 Years | 1,549 (4.9%) | 2,112 (6.7%) |
| 60 to 64 Years | 2,024 (6.4%) | 2,352 (7.5%) |
| 65 to 69 Years | 1,685 (5.3%) | 1,531 (4.9%) |
| 70 to 74 Years | 1,227 (3.9%) | 1,752 (5.6%) |
| 75 to 79 Years | 734 (2.3%) | 796 (2.5%) |
| 80 to 84 Years | 541 (1.7%) | 726 (2.3%) |
| 85 Years and over | 466 (1.5%) | 819 (2.6%) |
| Total | 31,679 (100.0%) | 31,463 (100.0%) |
Families and Households in Lakewood
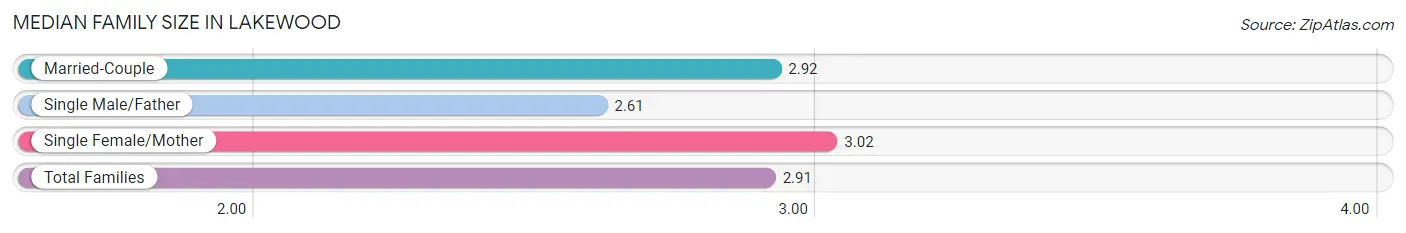
Median Family Size in Lakewood
The median family size in Lakewood is 2.91 persons per family, with single female/mother families (3,831 | 24.4%) accounting for the largest median family size of 3.02 persons per family. On the other hand, single male/father families (1,497 | 9.6%) represent the smallest median family size with 2.61 persons per family.
| Family Type | # Families | Family Size |
| Married-Couple | 10,348 (66.0%) | 2.92 |
| Single Male/Father | 1,497 (9.6%) | 2.61 |
| Single Female/Mother | 3,831 (24.4%) | 3.02 |
| Total Families | 15,676 (100.0%) | 2.91 |
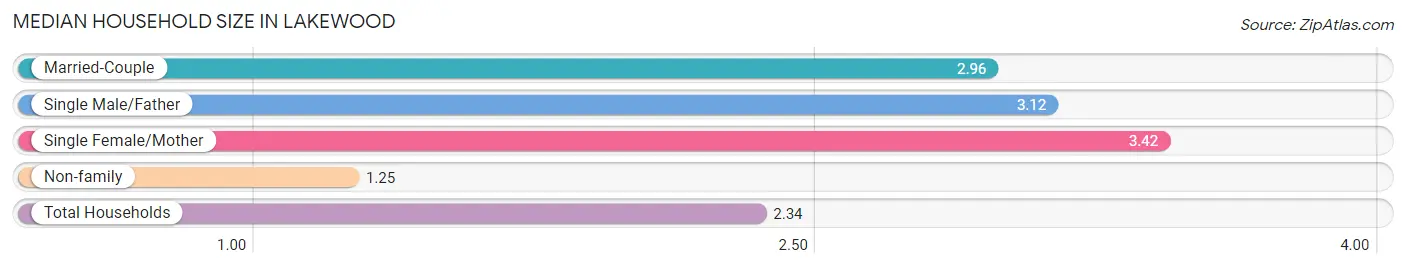
Median Household Size in Lakewood
The median household size in Lakewood is 2.34 persons per household, with single female/mother households (3,831 | 14.5%) accounting for the largest median household size of 3.42 persons per household. non-family households (10,690 | 40.5%) represent the smallest median household size with 1.25 persons per household.
| Household Type | # Households | Household Size |
| Married-Couple | 10,348 (39.3%) | 2.96 |
| Single Male/Father | 1,497 (5.7%) | 3.12 |
| Single Female/Mother | 3,831 (14.5%) | 3.42 |
| Non-family | 10,690 (40.5%) | 1.25 |
| Total Households | 26,366 (100.0%) | 2.34 |
Household Size by Marriage Status in Lakewood
Out of a total of 26,366 households in Lakewood, 15,676 (59.5%) are family households, while 10,690 (40.5%) are nonfamily households. The most numerous type of family households are 2-person households, comprising 7,048, and the most common type of nonfamily households are 1-person households, comprising 8,707.
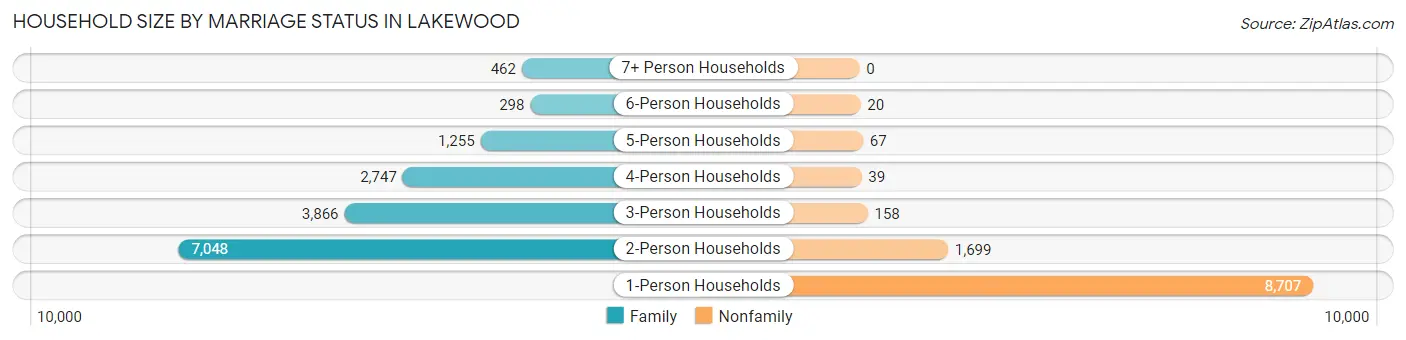
| Household Size | Family Households | Nonfamily Households |
| 1-Person Households | - | 8,707 (33.0%) |
| 2-Person Households | 7,048 (26.7%) | 1,699 (6.4%) |
| 3-Person Households | 3,866 (14.7%) | 158 (0.6%) |
| 4-Person Households | 2,747 (10.4%) | 39 (0.2%) |
| 5-Person Households | 1,255 (4.8%) | 67 (0.3%) |
| 6-Person Households | 298 (1.1%) | 20 (0.1%) |
| 7+ Person Households | 462 (1.8%) | 0 (0.0%) |
| Total | 15,676 (59.5%) | 10,690 (40.5%) |
Female Fertility in Lakewood
Fertility by Age in Lakewood
Average fertility rate in Lakewood is 64.0 births per 1,000 women. Women in the age bracket of 20 to 34 years have the highest fertility rate with 109.0 births per 1,000 women. Women in the age bracket of 20 to 34 years acount for 88.1% of all women with births.
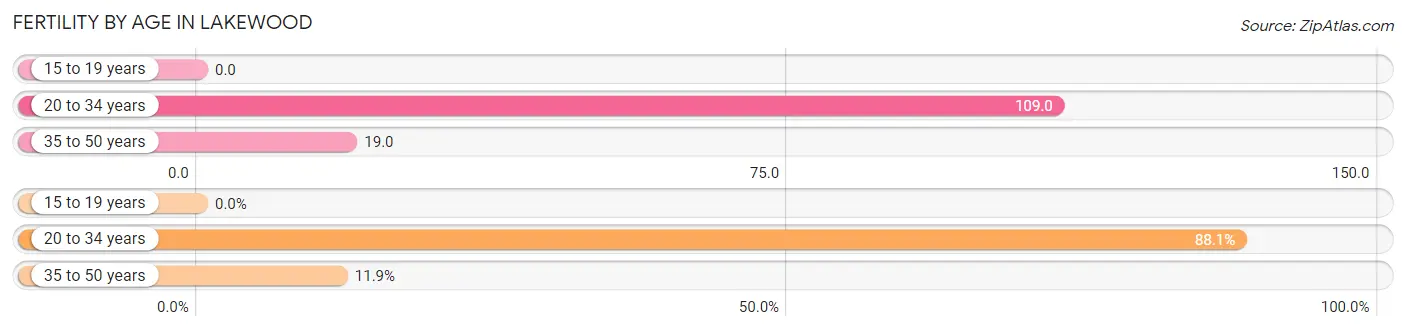
| Age Bracket | Women with Births | Births / 1,000 Women |
| 15 to 19 years | 0 (0.0%) | 0.0 |
| 20 to 34 years | 840 (88.1%) | 109.0 |
| 35 to 50 years | 113 (11.9%) | 19.0 |
| Total | 953 (100.0%) | 64.0 |
Fertility by Age by Marriage Status in Lakewood
72.6% of women with births (953) in Lakewood are married. The highest percentage of unmarried women with births falls into 20 to 34 years age bracket with 28.9% of them unmarried at the time of birth, while the lowest percentage of unmarried women with births belong to 35 to 50 years age bracket with 15.9% of them unmarried.
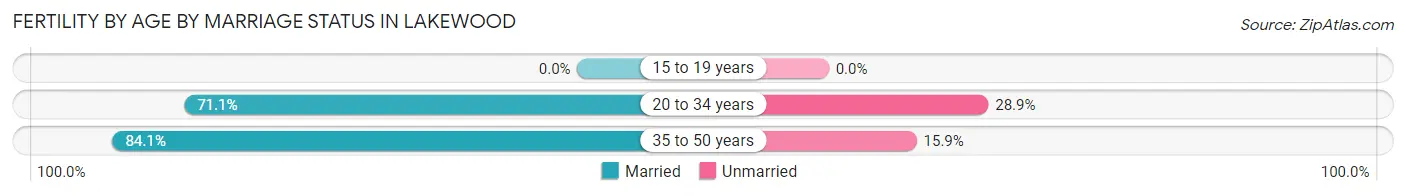
| Age Bracket | Married | Unmarried |
| 15 to 19 years | 0 (0.0%) | 0 (0.0%) |
| 20 to 34 years | 597 (71.1%) | 243 (28.9%) |
| 35 to 50 years | 95 (84.1%) | 18 (15.9%) |
| Total | 692 (72.6%) | 261 (27.4%) |
Fertility by Education in Lakewood
Average fertility rate in Lakewood is 64.0 births per 1,000 women. Women with the education attainment of bachelor's degree have the highest fertility rate of 91.0 births per 1,000 women, while women with the education attainment of less than high school have the lowest fertility at 33.0 births per 1,000 women. Women with the education attainment of high school diploma represent 34.1% of all women with births.
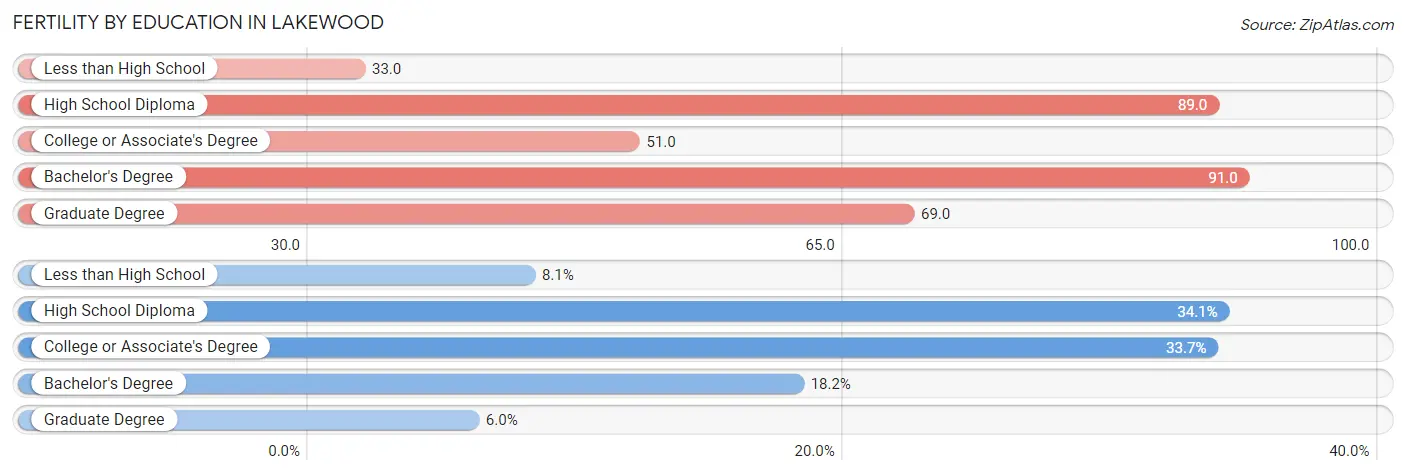
| Educational Attainment | Women with Births | Births / 1,000 Women |
| Less than High School | 77 (8.1%) | 33.0 |
| High School Diploma | 325 (34.1%) | 89.0 |
| College or Associate's Degree | 321 (33.7%) | 51.0 |
| Bachelor's Degree | 173 (18.1%) | 91.0 |
| Graduate Degree | 57 (6.0%) | 69.0 |
| Total | 953 (100.0%) | 64.0 |
Fertility by Education by Marriage Status in Lakewood
27.4% of women with births in Lakewood are unmarried. Women with the educational attainment of less than high school are most likely to be married with 100.0% of them married at childbirth, while women with the educational attainment of college or associate's degree are least likely to be married with 57.9% of them unmarried at childbirth.
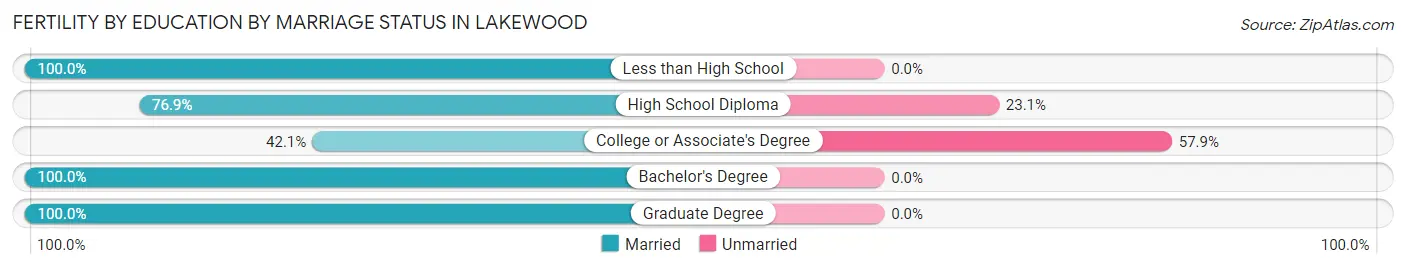
| Educational Attainment | Married | Unmarried |
| Less than High School | 77 (100.0%) | 0 (0.0%) |
| High School Diploma | 250 (76.9%) | 75 (23.1%) |
| College or Associate's Degree | 135 (42.1%) | 186 (57.9%) |
| Bachelor's Degree | 173 (100.0%) | 0 (0.0%) |
| Graduate Degree | 57 (100.0%) | 0 (0.0%) |
| Total | 692 (72.6%) | 261 (27.4%) |
Employment Characteristics in Lakewood
Employment by Class of Employer in Lakewood
Among the 29,649 employed individuals in Lakewood, private company employees (18,061 | 60.9%), federal government employees (4,038 | 13.6%), and not-for-profit organizations (2,159 | 7.3%) make up the most common classes of employment.
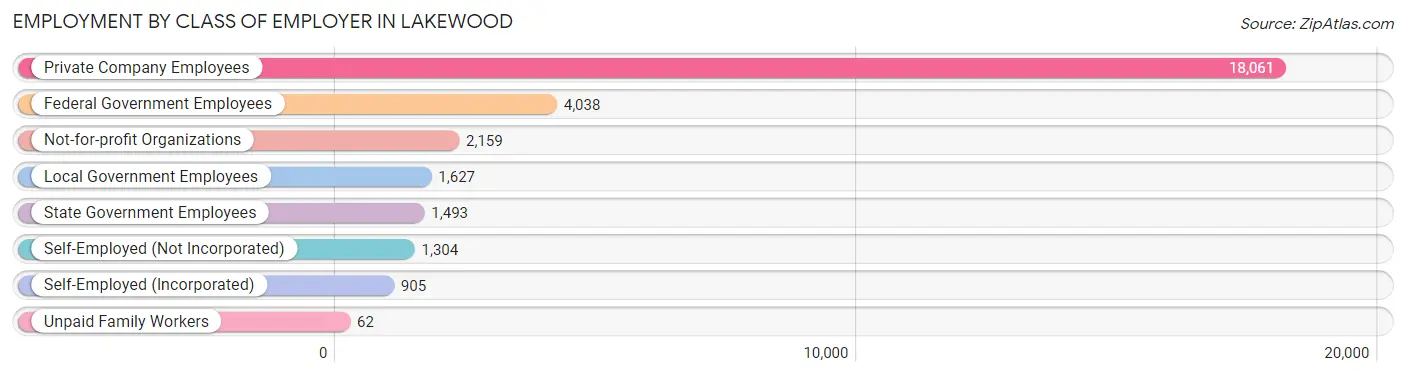
| Employer Class | # Employees | % Employees |
| Private Company Employees | 18,061 | 60.9% |
| Self-Employed (Incorporated) | 905 | 3.0% |
| Self-Employed (Not Incorporated) | 1,304 | 4.4% |
| Not-for-profit Organizations | 2,159 | 7.3% |
| Local Government Employees | 1,627 | 5.5% |
| State Government Employees | 1,493 | 5.0% |
| Federal Government Employees | 4,038 | 13.6% |
| Unpaid Family Workers | 62 | 0.2% |
| Total | 29,649 | 100.0% |
Employment Status by Age in Lakewood
According to the labor force statistics for Lakewood, out of the total population over 16 years of age (51,594), 62.1% or 32,040 individuals are in the labor force, with 5.2% or 1,666 of them unemployed. The age group with the highest labor force participation rate is 35 to 44 years, with 82.8% or 6,360 individuals in the labor force. Within the labor force, the 16 to 19 years age range has the highest percentage of unemployed individuals, with 12.5% or 105 of them being unemployed.
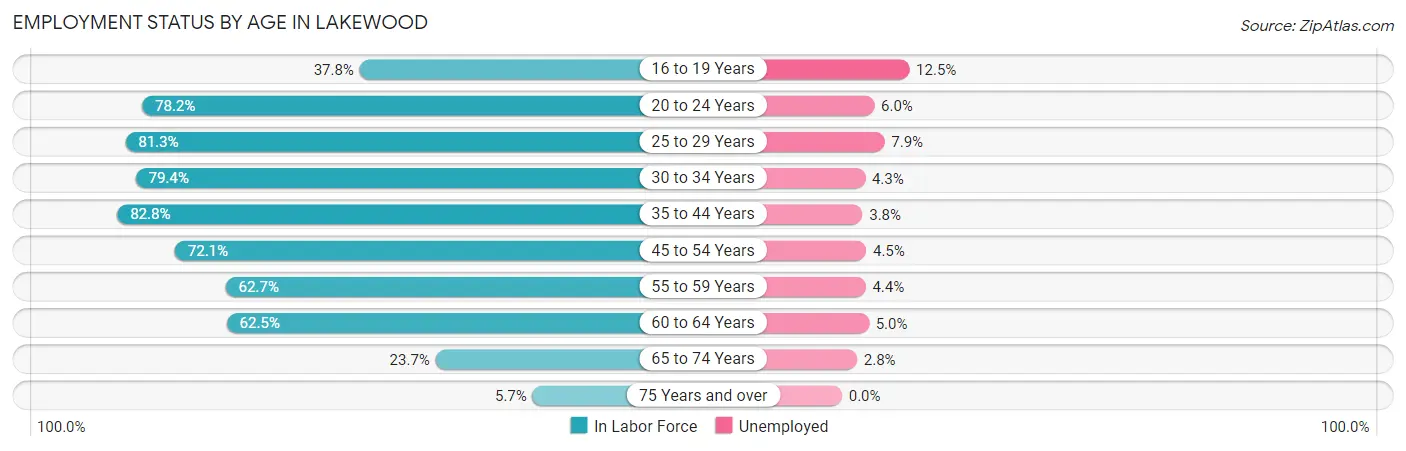
| Age Bracket | In Labor Force | Unemployed |
| 16 to 19 Years | 840 (37.8%) | 105 (12.5%) |
| 20 to 24 Years | 4,151 (78.2%) | 249 (6.0%) |
| 25 to 29 Years | 4,913 (81.3%) | 388 (7.9%) |
| 30 to 34 Years | 4,177 (79.4%) | 180 (4.3%) |
| 35 to 44 Years | 6,360 (82.8%) | 242 (3.8%) |
| 45 to 54 Years | 4,878 (72.1%) | 220 (4.5%) |
| 55 to 59 Years | 2,295 (62.7%) | 101 (4.4%) |
| 60 to 64 Years | 2,735 (62.5%) | 137 (5.0%) |
| 65 to 74 Years | 1,468 (23.7%) | 41 (2.8%) |
| 75 Years and over | 233 (5.7%) | 0 (0.0%) |
| Total | 32,040 (62.1%) | 1,666 (5.2%) |
Employment Status by Educational Attainment in Lakewood
According to labor force statistics for Lakewood, 75.1% of individuals (25,375) out of the total population between 25 and 64 years of age (33,788) are in the labor force, with 5.0% or 1,269 of them being unemployed. The group with the highest labor force participation rate are those with the educational attainment of bachelor's degree or higher, with 85.5% or 6,200 individuals in the labor force. Within the labor force, individuals with less than high school education have the highest percentage of unemployment, with 12.2% or 307 of them being unemployed.
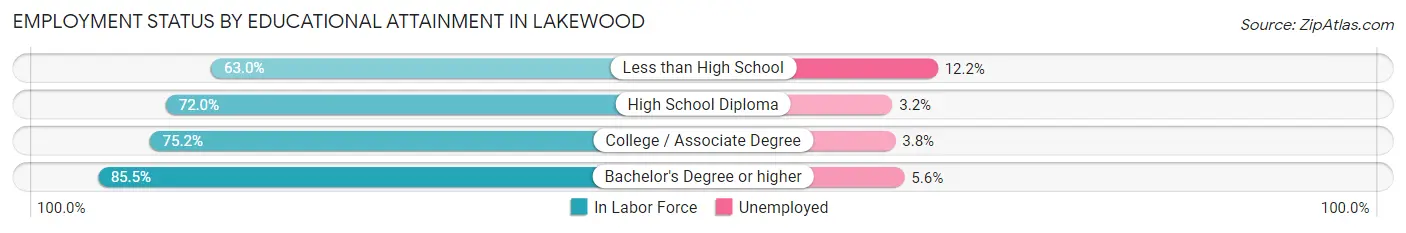
| Educational Attainment | In Labor Force | Unemployed |
| Less than High School | 2,519 (63.0%) | 488 (12.2%) |
| High School Diploma | 6,705 (72.0%) | 298 (3.2%) |
| College / Associate Degree | 9,945 (75.2%) | 503 (3.8%) |
| Bachelor's Degree or higher | 6,200 (85.5%) | 406 (5.6%) |
| Total | 25,375 (75.1%) | 1,689 (5.0%) |
Employment Occupations by Sex in Lakewood
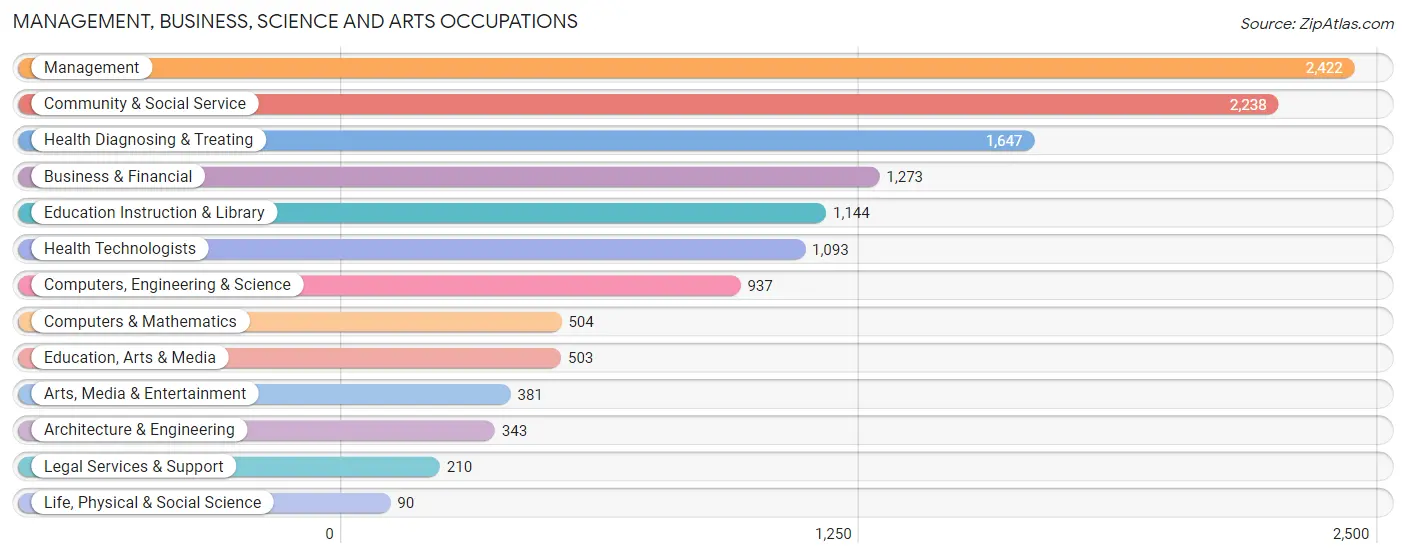
Management, Business, Science and Arts Occupations
The most common Management, Business, Science and Arts occupations in Lakewood are Management (2,422 | 8.5%), Community & Social Service (2,238 | 7.9%), Health Diagnosing & Treating (1,647 | 5.8%), Business & Financial (1,273 | 4.5%), and Education Instruction & Library (1,144 | 4.0%).
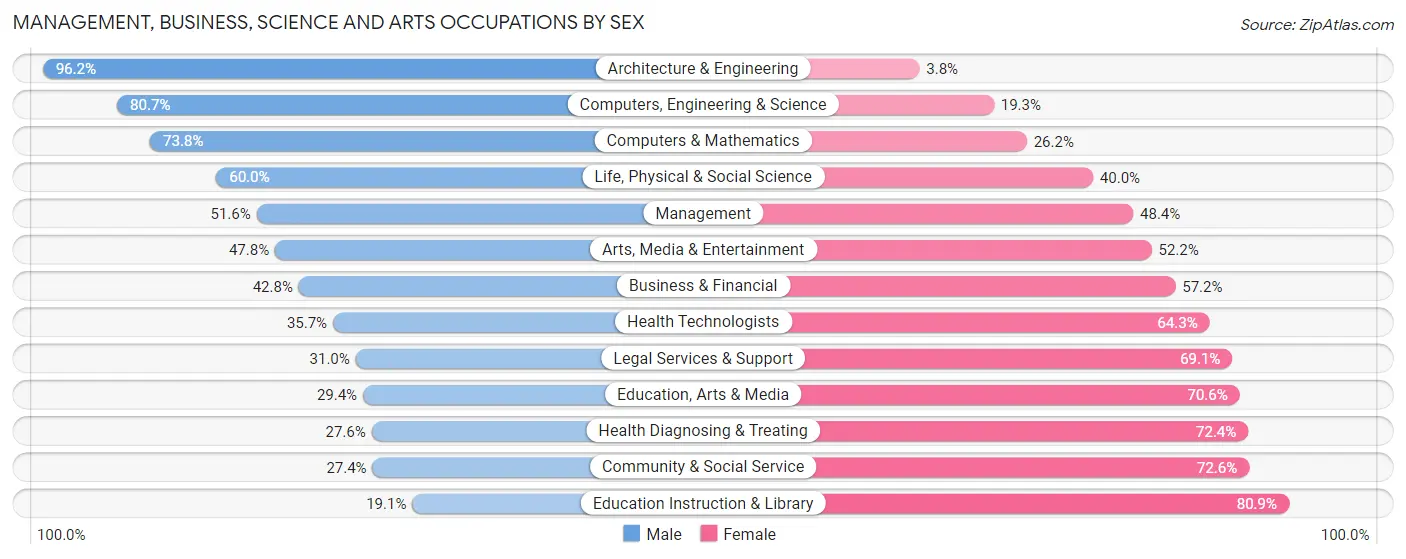
Management, Business, Science and Arts Occupations by Sex
Within the Management, Business, Science and Arts occupations in Lakewood, the most male-oriented occupations are Architecture & Engineering (96.2%), Computers, Engineering & Science (80.7%), and Computers & Mathematics (73.8%), while the most female-oriented occupations are Education Instruction & Library (80.9%), Community & Social Service (72.6%), and Health Diagnosing & Treating (72.4%).
| Occupation | Male | Female |
| Management | 1,250 (51.6%) | 1,172 (48.4%) |
| Business & Financial | 545 (42.8%) | 728 (57.2%) |
| Computers, Engineering & Science | 756 (80.7%) | 181 (19.3%) |
| Computers & Mathematics | 372 (73.8%) | 132 (26.2%) |
| Architecture & Engineering | 330 (96.2%) | 13 (3.8%) |
| Life, Physical & Social Science | 54 (60.0%) | 36 (40.0%) |
| Community & Social Service | 614 (27.4%) | 1,624 (72.6%) |
| Education, Arts & Media | 148 (29.4%) | 355 (70.6%) |
| Legal Services & Support | 65 (30.9%) | 145 (69.1%) |
| Education Instruction & Library | 219 (19.1%) | 925 (80.9%) |
| Arts, Media & Entertainment | 182 (47.8%) | 199 (52.2%) |
| Health Diagnosing & Treating | 455 (27.6%) | 1,192 (72.4%) |
| Health Technologists | 390 (35.7%) | 703 (64.3%) |
| Total (Category) | 3,620 (42.5%) | 4,897 (57.5%) |
| Total (Overall) | 14,494 (51.0%) | 13,937 (49.0%) |
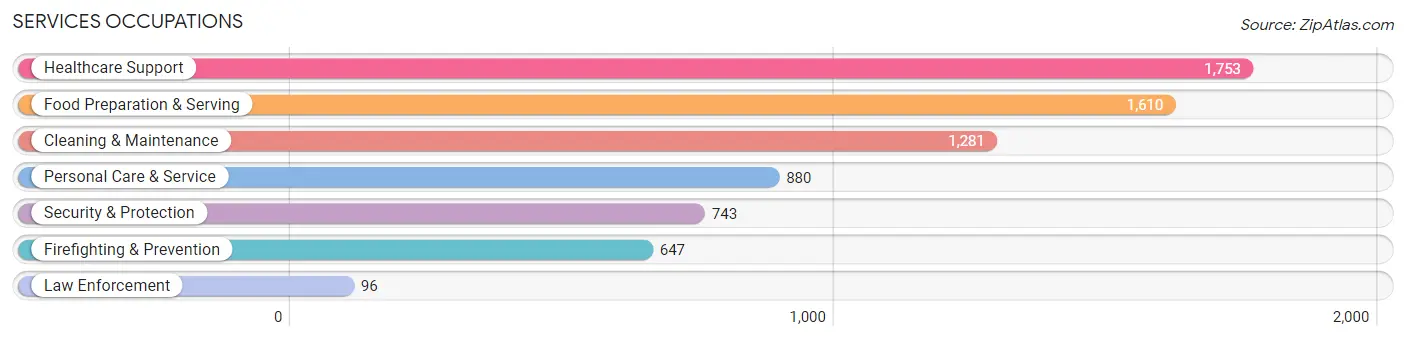
Services Occupations
The most common Services occupations in Lakewood are Healthcare Support (1,753 | 6.2%), Food Preparation & Serving (1,610 | 5.7%), Cleaning & Maintenance (1,281 | 4.5%), Personal Care & Service (880 | 3.1%), and Security & Protection (743 | 2.6%).
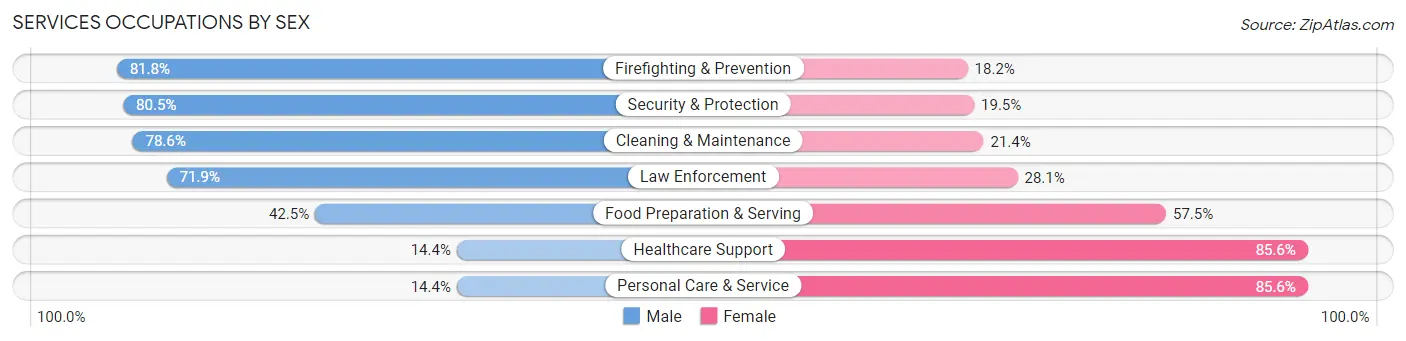
Services Occupations by Sex
Within the Services occupations in Lakewood, the most male-oriented occupations are Firefighting & Prevention (81.8%), Security & Protection (80.5%), and Cleaning & Maintenance (78.6%), while the most female-oriented occupations are Healthcare Support (85.6%), Personal Care & Service (85.6%), and Food Preparation & Serving (57.5%).
| Occupation | Male | Female |
| Healthcare Support | 253 (14.4%) | 1,500 (85.6%) |
| Security & Protection | 598 (80.5%) | 145 (19.5%) |
| Firefighting & Prevention | 529 (81.8%) | 118 (18.2%) |
| Law Enforcement | 69 (71.9%) | 27 (28.1%) |
| Food Preparation & Serving | 684 (42.5%) | 926 (57.5%) |
| Cleaning & Maintenance | 1,007 (78.6%) | 274 (21.4%) |
| Personal Care & Service | 127 (14.4%) | 753 (85.6%) |
| Total (Category) | 2,669 (42.6%) | 3,598 (57.4%) |
| Total (Overall) | 14,494 (51.0%) | 13,937 (49.0%) |
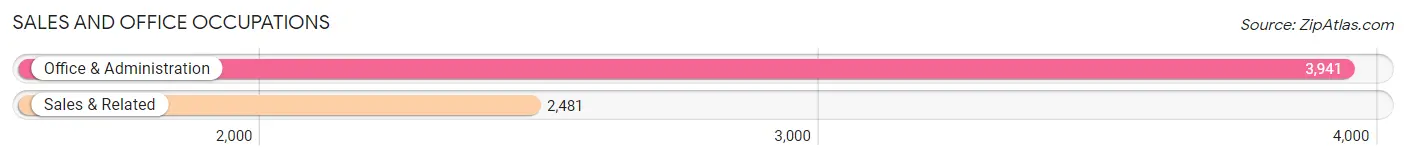
Sales and Office Occupations
The most common Sales and Office occupations in Lakewood are Office & Administration (3,941 | 13.9%), and Sales & Related (2,481 | 8.7%).
Sales and Office Occupations by Sex
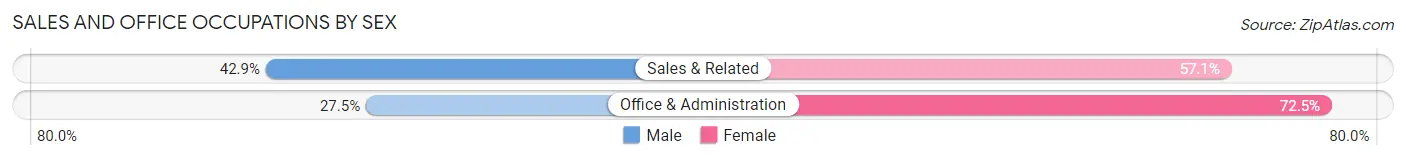
| Occupation | Male | Female |
| Sales & Related | 1,064 (42.9%) | 1,417 (57.1%) |
| Office & Administration | 1,083 (27.5%) | 2,858 (72.5%) |
| Total (Category) | 2,147 (33.4%) | 4,275 (66.6%) |
| Total (Overall) | 14,494 (51.0%) | 13,937 (49.0%) |
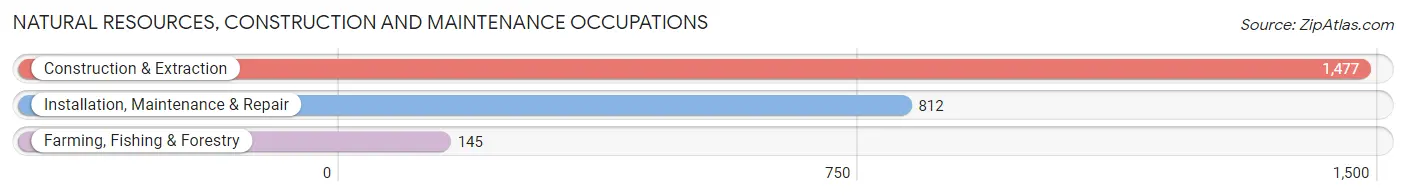
Natural Resources, Construction and Maintenance Occupations
The most common Natural Resources, Construction and Maintenance occupations in Lakewood are Construction & Extraction (1,477 | 5.2%), Installation, Maintenance & Repair (812 | 2.9%), and Farming, Fishing & Forestry (145 | 0.5%).
Natural Resources, Construction and Maintenance Occupations by Sex
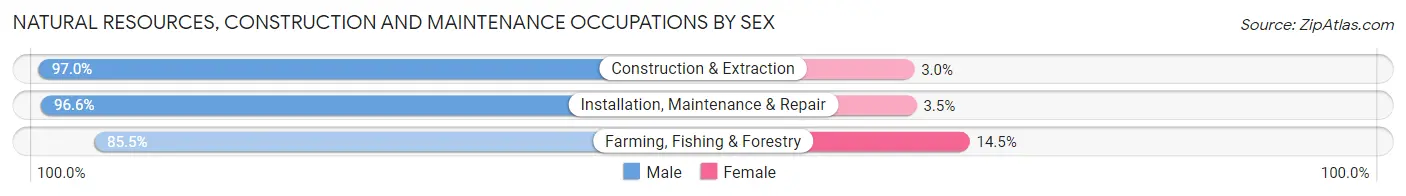
| Occupation | Male | Female |
| Farming, Fishing & Forestry | 124 (85.5%) | 21 (14.5%) |
| Construction & Extraction | 1,433 (97.0%) | 44 (3.0%) |
| Installation, Maintenance & Repair | 784 (96.6%) | 28 (3.5%) |
| Total (Category) | 2,341 (96.2%) | 93 (3.8%) |
| Total (Overall) | 14,494 (51.0%) | 13,937 (49.0%) |
Production, Transportation and Moving Occupations
The most common Production, Transportation and Moving occupations in Lakewood are Material Moving (1,695 | 6.0%), Transportation (1,691 | 5.9%), and Production (1,405 | 4.9%).
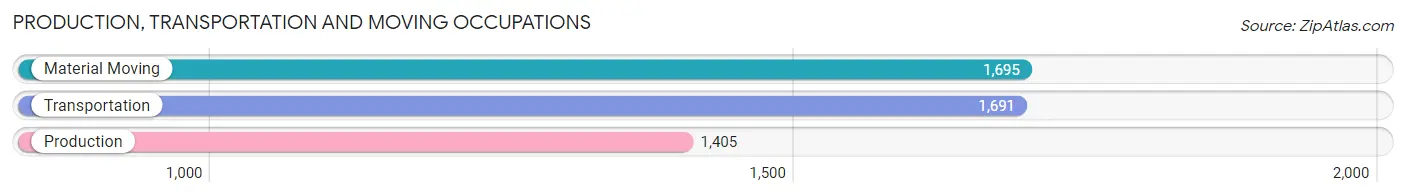
Production, Transportation and Moving Occupations by Sex
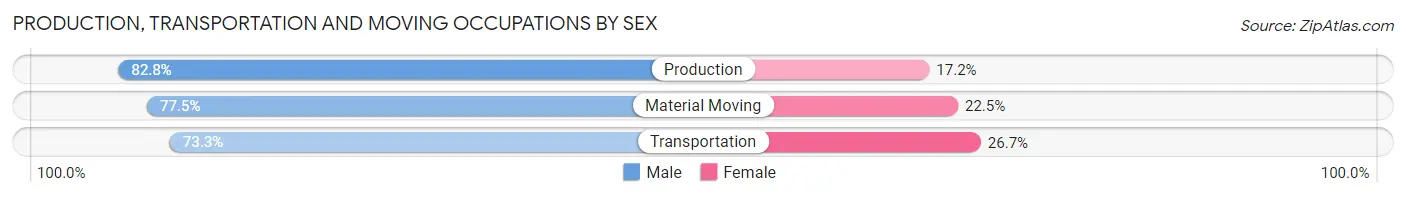
| Occupation | Male | Female |
| Production | 1,163 (82.8%) | 242 (17.2%) |
| Transportation | 1,240 (73.3%) | 451 (26.7%) |
| Material Moving | 1,314 (77.5%) | 381 (22.5%) |
| Total (Category) | 3,717 (77.6%) | 1,074 (22.4%) |
| Total (Overall) | 14,494 (51.0%) | 13,937 (49.0%) |
Employment Industries by Sex in Lakewood
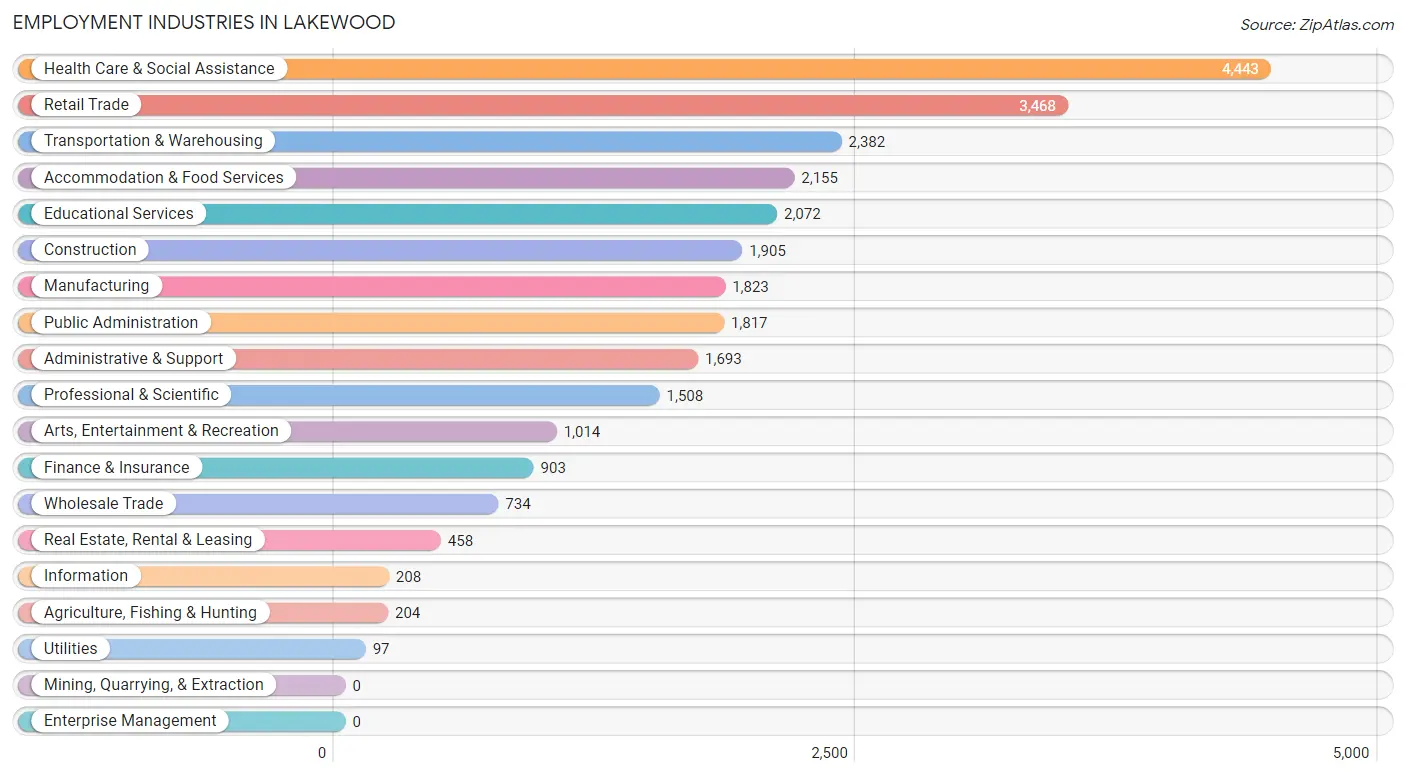
Employment Industries in Lakewood
The major employment industries in Lakewood include Health Care & Social Assistance (4,443 | 15.6%), Retail Trade (3,468 | 12.2%), Transportation & Warehousing (2,382 | 8.4%), Accommodation & Food Services (2,155 | 7.6%), and Educational Services (2,072 | 7.3%).
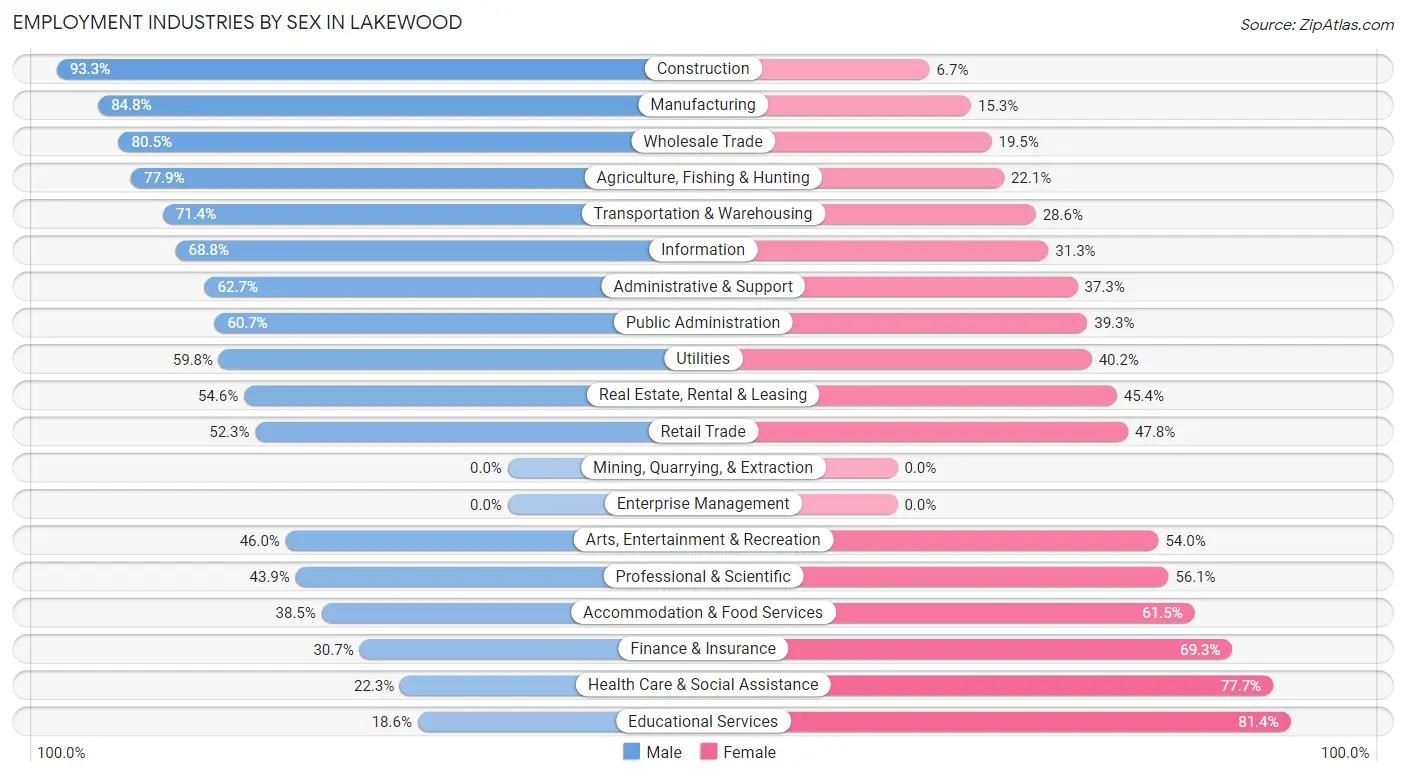
Employment Industries by Sex in Lakewood
The Lakewood industries that see more men than women are Construction (93.3%), Manufacturing (84.8%), and Wholesale Trade (80.5%), whereas the industries that tend to have a higher number of women are Educational Services (81.4%), Health Care & Social Assistance (77.7%), and Finance & Insurance (69.3%).
| Industry | Male | Female |
| Agriculture, Fishing & Hunting | 159 (77.9%) | 45 (22.1%) |
| Mining, Quarrying, & Extraction | 0 (0.0%) | 0 (0.0%) |
| Construction | 1,778 (93.3%) | 127 (6.7%) |
| Manufacturing | 1,545 (84.8%) | 278 (15.2%) |
| Wholesale Trade | 591 (80.5%) | 143 (19.5%) |
| Retail Trade | 1,812 (52.2%) | 1,656 (47.7%) |
| Transportation & Warehousing | 1,700 (71.4%) | 682 (28.6%) |
| Utilities | 58 (59.8%) | 39 (40.2%) |
| Information | 143 (68.8%) | 65 (31.2%) |
| Finance & Insurance | 277 (30.7%) | 626 (69.3%) |
| Real Estate, Rental & Leasing | 250 (54.6%) | 208 (45.4%) |
| Professional & Scientific | 662 (43.9%) | 846 (56.1%) |
| Enterprise Management | 0 (0.0%) | 0 (0.0%) |
| Administrative & Support | 1,062 (62.7%) | 631 (37.3%) |
| Educational Services | 386 (18.6%) | 1,686 (81.4%) |
| Health Care & Social Assistance | 990 (22.3%) | 3,453 (77.7%) |
| Arts, Entertainment & Recreation | 466 (46.0%) | 548 (54.0%) |
| Accommodation & Food Services | 830 (38.5%) | 1,325 (61.5%) |
| Public Administration | 1,103 (60.7%) | 714 (39.3%) |
| Total | 14,494 (51.0%) | 13,937 (49.0%) |
Education in Lakewood
School Enrollment in Lakewood
The most common levels of schooling among the 12,799 students in Lakewood are college / undergraduate (3,098 | 24.2%), middle school (2,888 | 22.6%), and high school (2,699 | 21.1%).
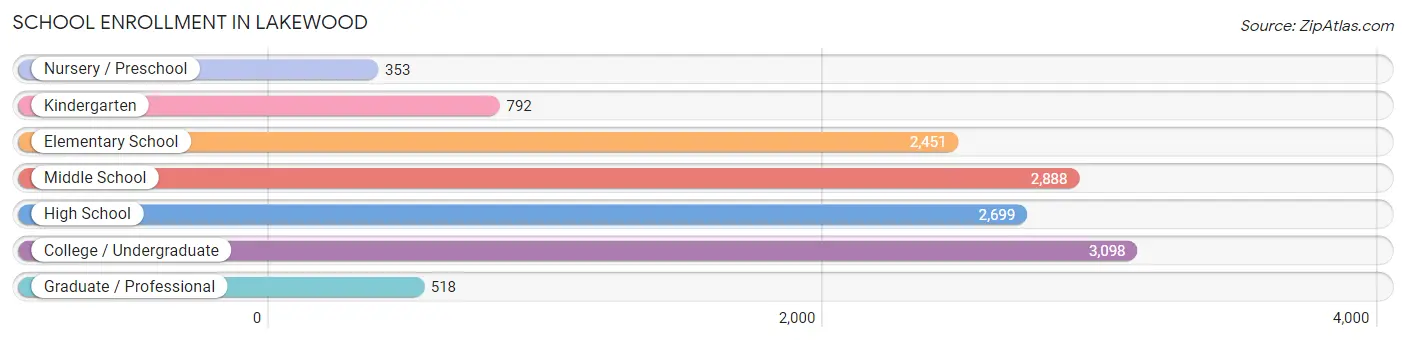
| School Level | # Students | % Students |
| Nursery / Preschool | 353 | 2.8% |
| Kindergarten | 792 | 6.2% |
| Elementary School | 2,451 | 19.2% |
| Middle School | 2,888 | 22.6% |
| High School | 2,699 | 21.1% |
| College / Undergraduate | 3,098 | 24.2% |
| Graduate / Professional | 518 | 4.1% |
| Total | 12,799 | 100.0% |
School Enrollment by Age by Funding Source in Lakewood
Out of a total of 12,799 students who are enrolled in schools in Lakewood, 1,369 (10.7%) attend a private institution, while the remaining 11,430 (89.3%) are enrolled in public schools. The age group of 35 years and over has the highest likelihood of being enrolled in private schools, with 294 (31.9% in the age bracket) enrolled. Conversely, the age group of 15 to 17 year olds has the lowest likelihood of being enrolled in a private school, with 1,826 (96.3% in the age bracket) attending a public institution.
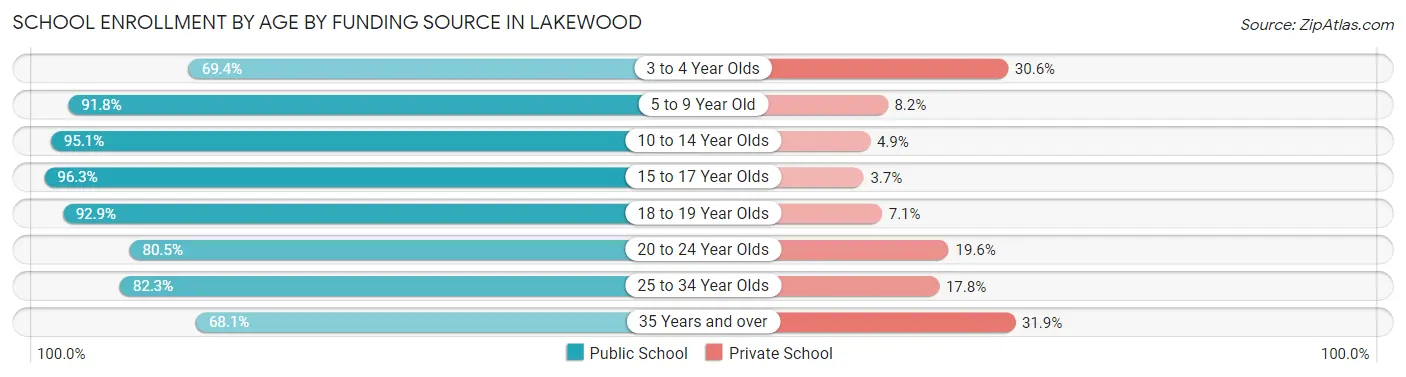
| Age Bracket | Public School | Private School |
| 3 to 4 Year Olds | 152 (69.4%) | 67 (30.6%) |
| 5 to 9 Year Old | 3,094 (91.8%) | 275 (8.2%) |
| 10 to 14 Year Olds | 3,047 (95.1%) | 157 (4.9%) |
| 15 to 17 Year Olds | 1,826 (96.3%) | 70 (3.7%) |
| 18 to 19 Year Olds | 694 (92.9%) | 53 (7.1%) |
| 20 to 24 Year Olds | 1,041 (80.4%) | 253 (19.6%) |
| 25 to 34 Year Olds | 945 (82.3%) | 204 (17.7%) |
| 35 Years and over | 627 (68.1%) | 294 (31.9%) |
| Total | 11,430 (89.3%) | 1,369 (10.7%) |
Educational Attainment by Field of Study in Lakewood
Business (1,770 | 15.6%), education (1,671 | 14.7%), social sciences (1,082 | 9.5%), science & technology (970 | 8.6%), and liberal arts & history (966 | 8.5%) are the most common fields of study among 11,351 individuals in Lakewood who have obtained a bachelor's degree or higher.
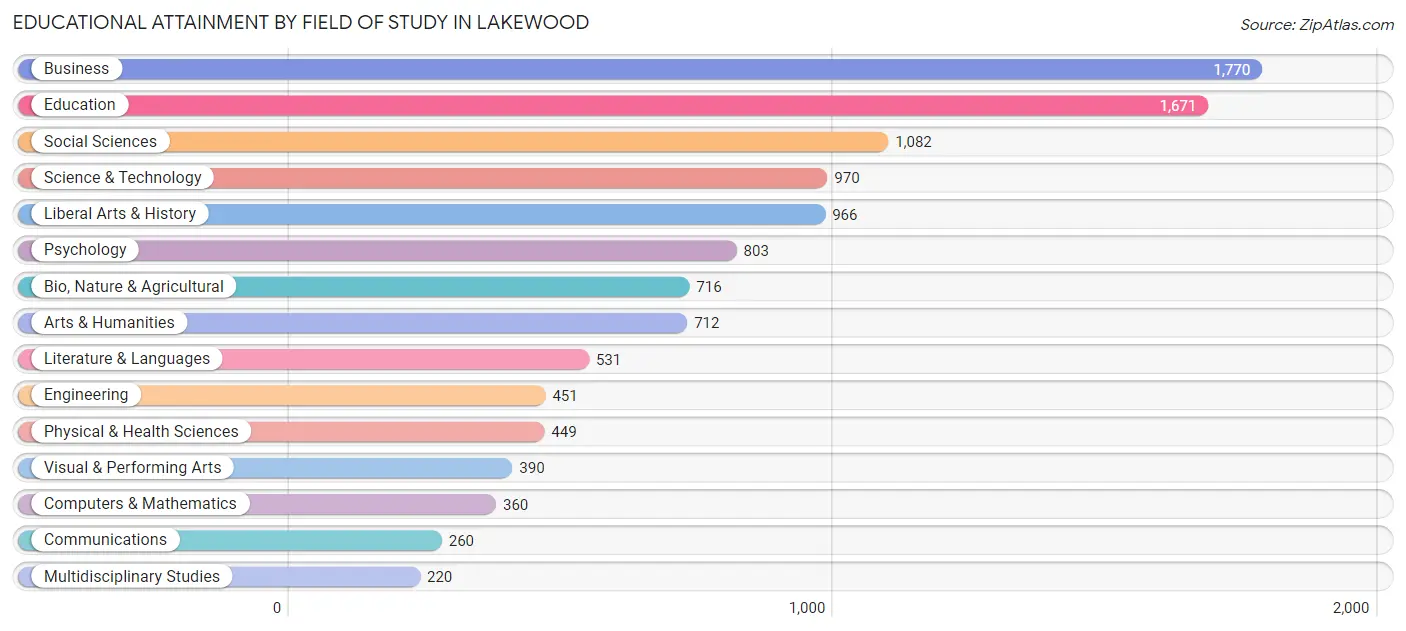
| Field of Study | # Graduates | % Graduates |
| Computers & Mathematics | 360 | 3.2% |
| Bio, Nature & Agricultural | 716 | 6.3% |
| Physical & Health Sciences | 449 | 4.0% |
| Psychology | 803 | 7.1% |
| Social Sciences | 1,082 | 9.5% |
| Engineering | 451 | 4.0% |
| Multidisciplinary Studies | 220 | 1.9% |
| Science & Technology | 970 | 8.6% |
| Business | 1,770 | 15.6% |
| Education | 1,671 | 14.7% |
| Literature & Languages | 531 | 4.7% |
| Liberal Arts & History | 966 | 8.5% |
| Visual & Performing Arts | 390 | 3.4% |
| Communications | 260 | 2.3% |
| Arts & Humanities | 712 | 6.3% |
| Total | 11,351 | 100.0% |
Transportation & Commute in Lakewood
Vehicle Availability by Sex in Lakewood
The most prevalent vehicle ownership categories in Lakewood are males with 2 vehicles (5,860, accounting for 37.0%) and females with 2 vehicles (5,257, making up 42.5%).
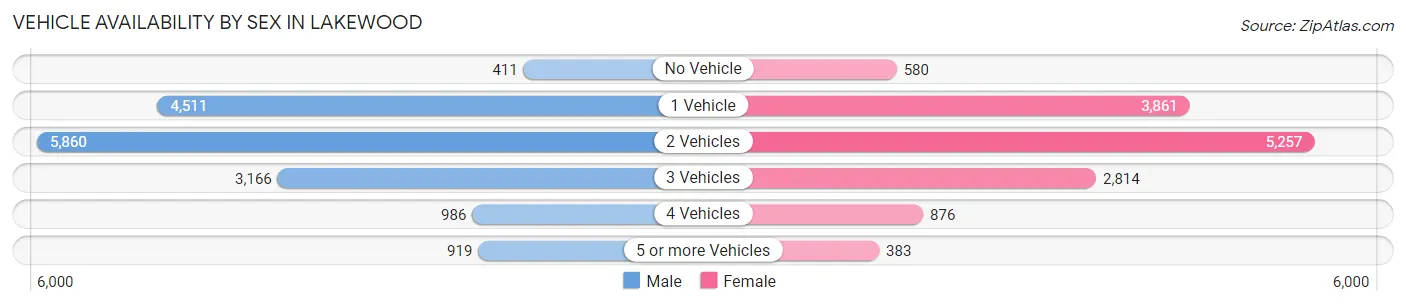
| Vehicles Available | Male | Female |
| No Vehicle | 411 (2.6%) | 580 (4.2%) |
| 1 Vehicle | 4,511 (28.5%) | 3,861 (28.0%) |
| 2 Vehicles | 5,860 (37.0%) | 5,257 (38.2%) |
| 3 Vehicles | 3,166 (20.0%) | 2,814 (20.4%) |
| 4 Vehicles | 986 (6.2%) | 876 (6.4%) |
| 5 or more Vehicles | 919 (5.8%) | 383 (2.8%) |
| Total | 15,853 (100.0%) | 13,771 (100.0%) |
Commute Time in Lakewood
The most frequently occuring commute durations in Lakewood are 15 to 19 minutes (4,807 commuters, 17.5%), 20 to 24 minutes (4,237 commuters, 15.4%), and 30 to 34 minutes (4,061 commuters, 14.8%).
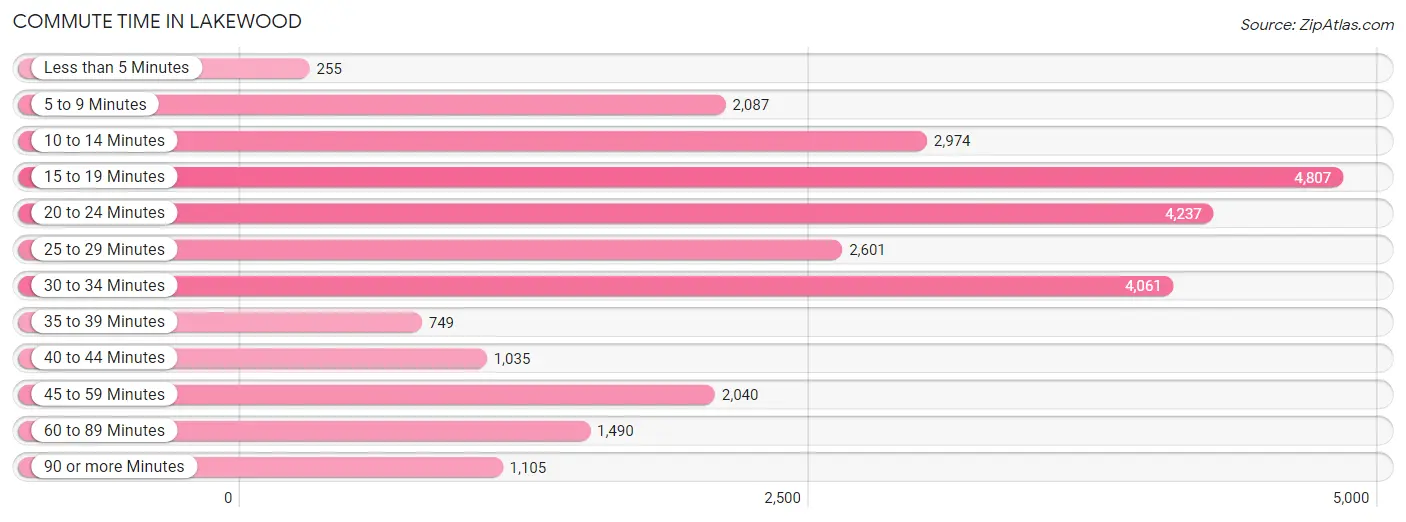
| Commute Time | # Commuters | % Commuters |
| Less than 5 Minutes | 255 | 0.9% |
| 5 to 9 Minutes | 2,087 | 7.6% |
| 10 to 14 Minutes | 2,974 | 10.8% |
| 15 to 19 Minutes | 4,807 | 17.5% |
| 20 to 24 Minutes | 4,237 | 15.4% |
| 25 to 29 Minutes | 2,601 | 9.5% |
| 30 to 34 Minutes | 4,061 | 14.8% |
| 35 to 39 Minutes | 749 | 2.7% |
| 40 to 44 Minutes | 1,035 | 3.8% |
| 45 to 59 Minutes | 2,040 | 7.4% |
| 60 to 89 Minutes | 1,490 | 5.4% |
| 90 or more Minutes | 1,105 | 4.0% |
Commute Time by Sex in Lakewood
The most common commute times in Lakewood are 15 to 19 minutes (2,475 commuters, 16.6%) for males and 15 to 19 minutes (2,332 commuters, 18.6%) for females.
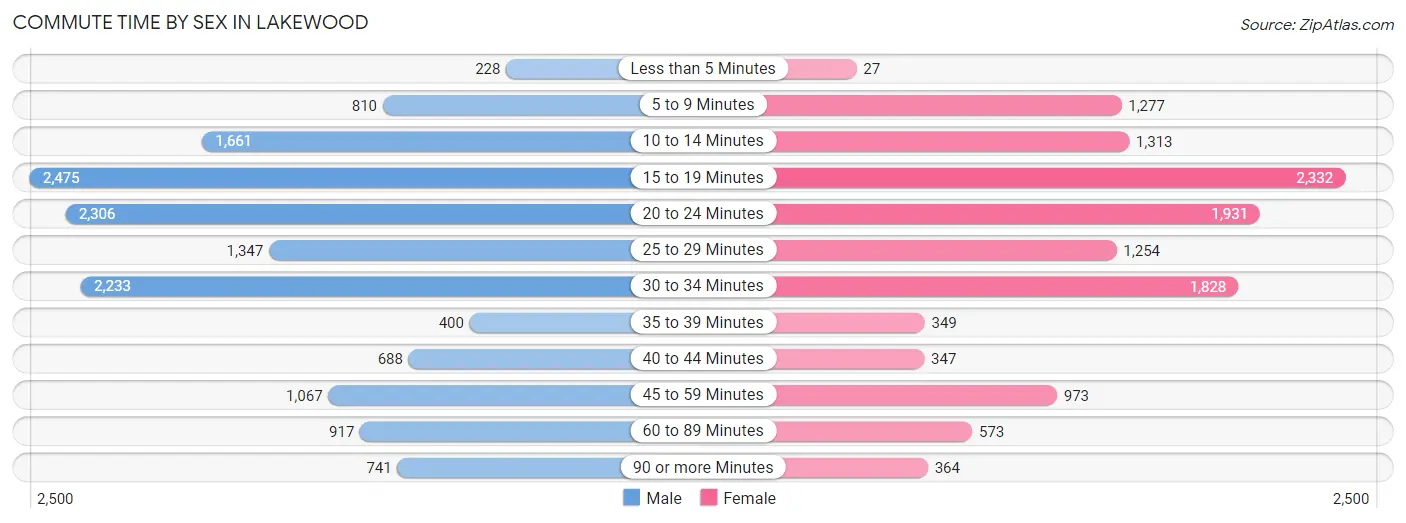
| Commute Time | Male | Female |
| Less than 5 Minutes | 228 (1.5%) | 27 (0.2%) |
| 5 to 9 Minutes | 810 (5.4%) | 1,277 (10.2%) |
| 10 to 14 Minutes | 1,661 (11.2%) | 1,313 (10.4%) |
| 15 to 19 Minutes | 2,475 (16.6%) | 2,332 (18.6%) |
| 20 to 24 Minutes | 2,306 (15.5%) | 1,931 (15.4%) |
| 25 to 29 Minutes | 1,347 (9.1%) | 1,254 (10.0%) |
| 30 to 34 Minutes | 2,233 (15.0%) | 1,828 (14.5%) |
| 35 to 39 Minutes | 400 (2.7%) | 349 (2.8%) |
| 40 to 44 Minutes | 688 (4.6%) | 347 (2.8%) |
| 45 to 59 Minutes | 1,067 (7.2%) | 973 (7.7%) |
| 60 to 89 Minutes | 917 (6.2%) | 573 (4.6%) |
| 90 or more Minutes | 741 (5.0%) | 364 (2.9%) |
Time of Departure to Work by Sex in Lakewood
The most frequent times of departure to work in Lakewood are 12:00 AM to 4:59 AM (2,027, 13.6%) for males and 7:00 AM to 7:29 AM (1,791, 14.2%) for females.
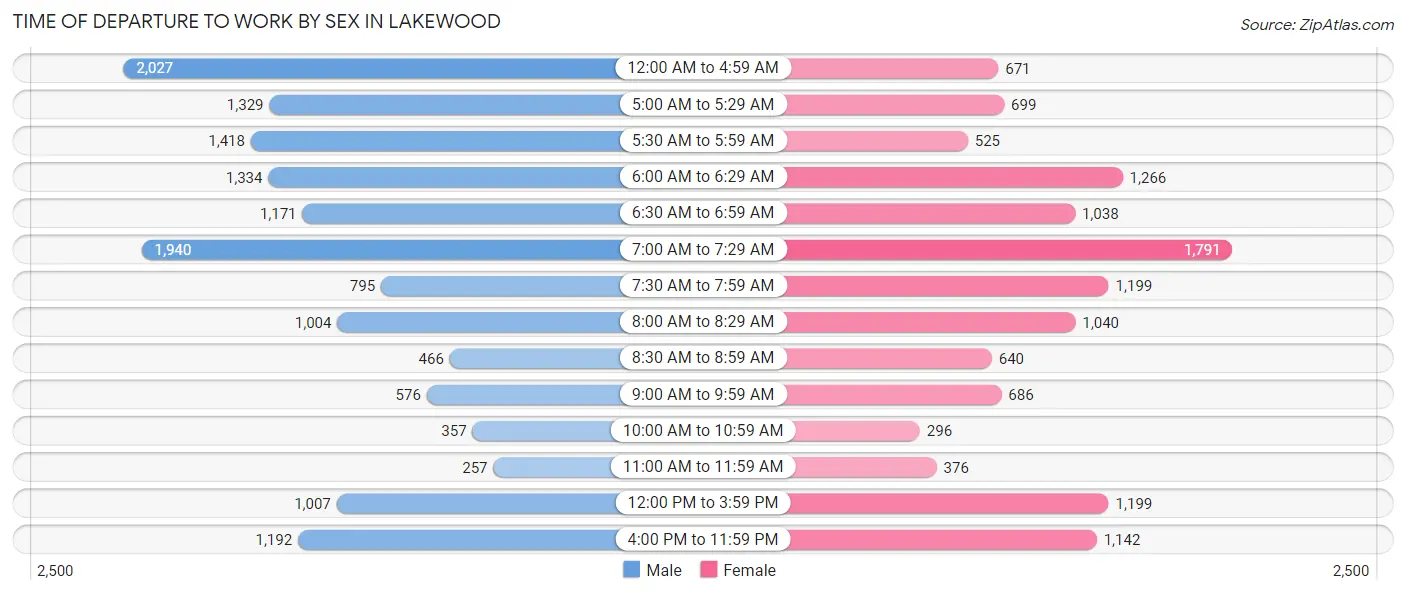
| Time of Departure | Male | Female |
| 12:00 AM to 4:59 AM | 2,027 (13.6%) | 671 (5.3%) |
| 5:00 AM to 5:29 AM | 1,329 (8.9%) | 699 (5.6%) |
| 5:30 AM to 5:59 AM | 1,418 (9.5%) | 525 (4.2%) |
| 6:00 AM to 6:29 AM | 1,334 (9.0%) | 1,266 (10.1%) |
| 6:30 AM to 6:59 AM | 1,171 (7.9%) | 1,038 (8.3%) |
| 7:00 AM to 7:29 AM | 1,940 (13.0%) | 1,791 (14.2%) |
| 7:30 AM to 7:59 AM | 795 (5.3%) | 1,199 (9.5%) |
| 8:00 AM to 8:29 AM | 1,004 (6.8%) | 1,040 (8.3%) |
| 8:30 AM to 8:59 AM | 466 (3.1%) | 640 (5.1%) |
| 9:00 AM to 9:59 AM | 576 (3.9%) | 686 (5.5%) |
| 10:00 AM to 10:59 AM | 357 (2.4%) | 296 (2.4%) |
| 11:00 AM to 11:59 AM | 257 (1.7%) | 376 (3.0%) |
| 12:00 PM to 3:59 PM | 1,007 (6.8%) | 1,199 (9.5%) |
| 4:00 PM to 11:59 PM | 1,192 (8.0%) | 1,142 (9.1%) |
| Total | 14,873 (100.0%) | 12,568 (100.0%) |
Housing Occupancy in Lakewood
Occupancy by Ownership in Lakewood
Of the total 26,366 dwellings in Lakewood, owner-occupied units account for 11,488 (43.6%), while renter-occupied units make up 14,878 (56.4%).
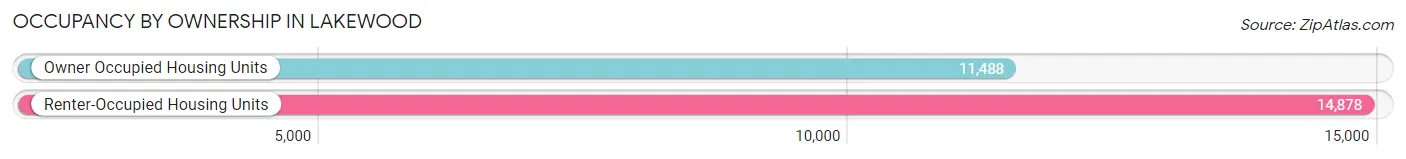
| Occupancy | # Housing Units | % Housing Units |
| Owner Occupied Housing Units | 11,488 | 43.6% |
| Renter-Occupied Housing Units | 14,878 | 56.4% |
| Total Occupied Housing Units | 26,366 | 100.0% |
Occupancy by Household Size in Lakewood
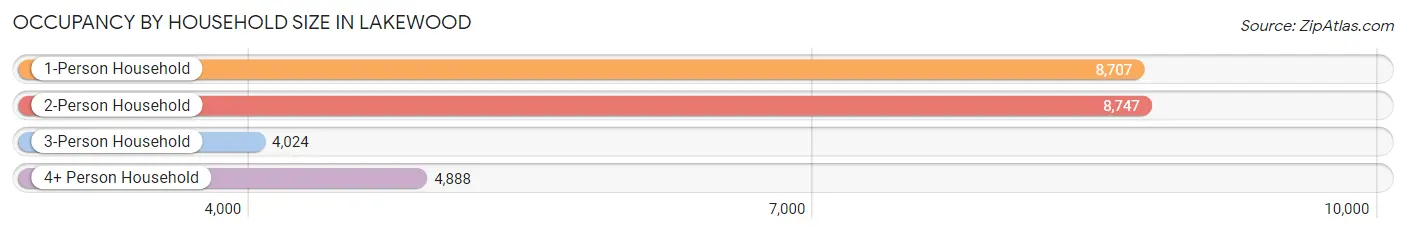
| Household Size | # Housing Units | % Housing Units |
| 1-Person Household | 8,707 | 33.0% |
| 2-Person Household | 8,747 | 33.2% |
| 3-Person Household | 4,024 | 15.3% |
| 4+ Person Household | 4,888 | 18.5% |
| Total Housing Units | 26,366 | 100.0% |
Occupancy by Ownership by Household Size in Lakewood
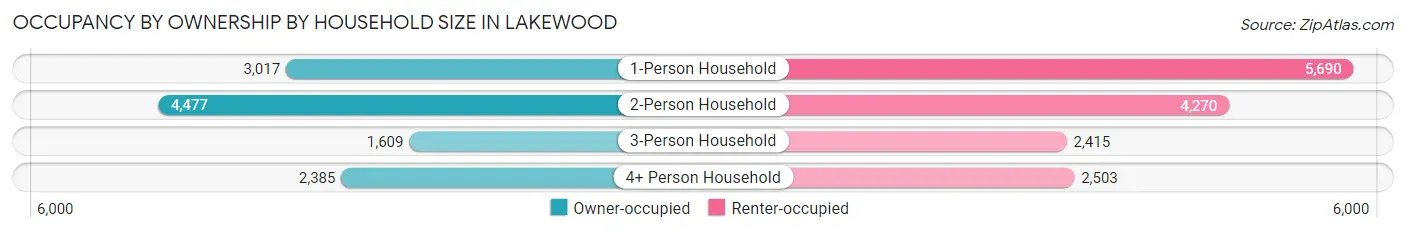
| Household Size | Owner-occupied | Renter-occupied |
| 1-Person Household | 3,017 (34.6%) | 5,690 (65.3%) |
| 2-Person Household | 4,477 (51.2%) | 4,270 (48.8%) |
| 3-Person Household | 1,609 (40.0%) | 2,415 (60.0%) |
| 4+ Person Household | 2,385 (48.8%) | 2,503 (51.2%) |
| Total Housing Units | 11,488 (43.6%) | 14,878 (56.4%) |
Occupancy by Educational Attainment in Lakewood
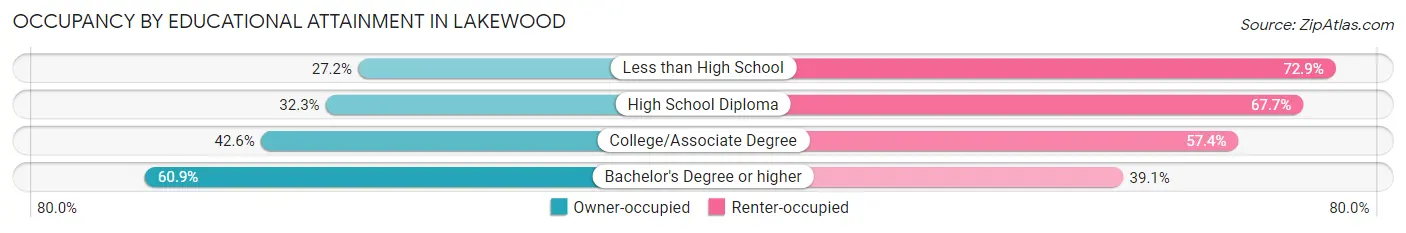
| Household Size | Owner-occupied | Renter-occupied |
| Less than High School | 586 (27.2%) | 1,572 (72.9%) |
| High School Diploma | 1,962 (32.3%) | 4,115 (67.7%) |
| College/Associate Degree | 4,881 (42.6%) | 6,586 (57.4%) |
| Bachelor's Degree or higher | 4,059 (60.9%) | 2,605 (39.1%) |
Occupancy by Age of Householder in Lakewood
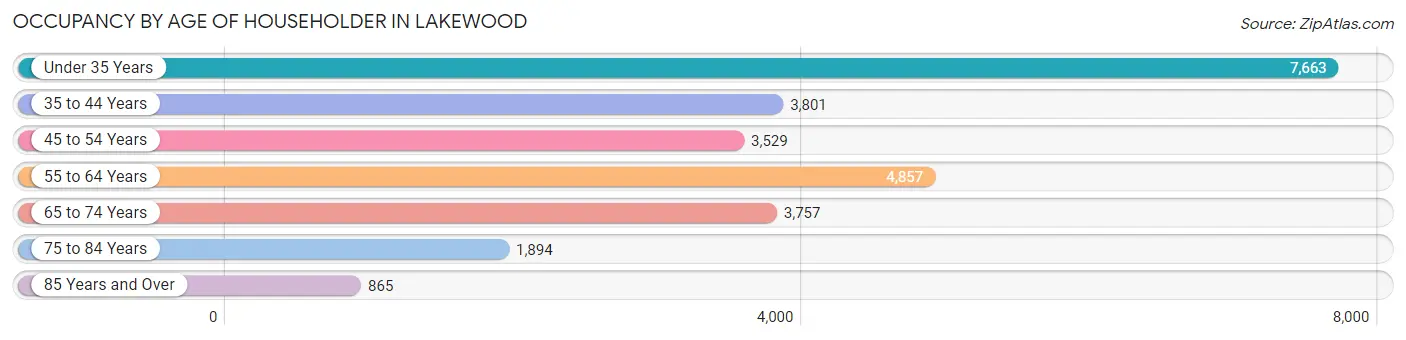
| Age Bracket | # Households | % Households |
| Under 35 Years | 7,663 | 29.1% |
| 35 to 44 Years | 3,801 | 14.4% |
| 45 to 54 Years | 3,529 | 13.4% |
| 55 to 64 Years | 4,857 | 18.4% |
| 65 to 74 Years | 3,757 | 14.2% |
| 75 to 84 Years | 1,894 | 7.2% |
| 85 Years and Over | 865 | 3.3% |
| Total | 26,366 | 100.0% |
Housing Finances in Lakewood
Median Income by Occupancy in Lakewood
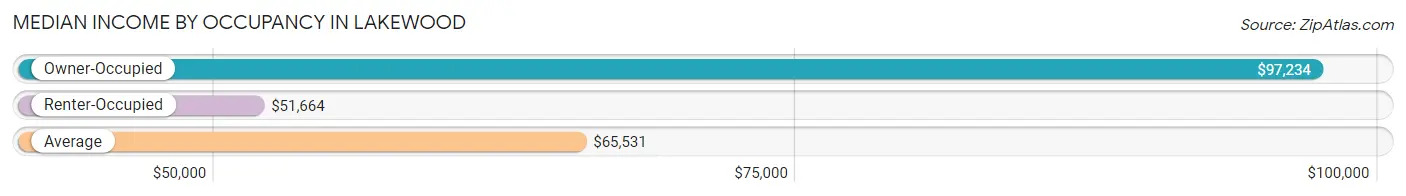
| Occupancy Type | # Households | Median Income |
| Owner-Occupied | 11,488 (43.6%) | $97,234 |
| Renter-Occupied | 14,878 (56.4%) | $51,664 |
| Average | 26,366 (100.0%) | $65,531 |
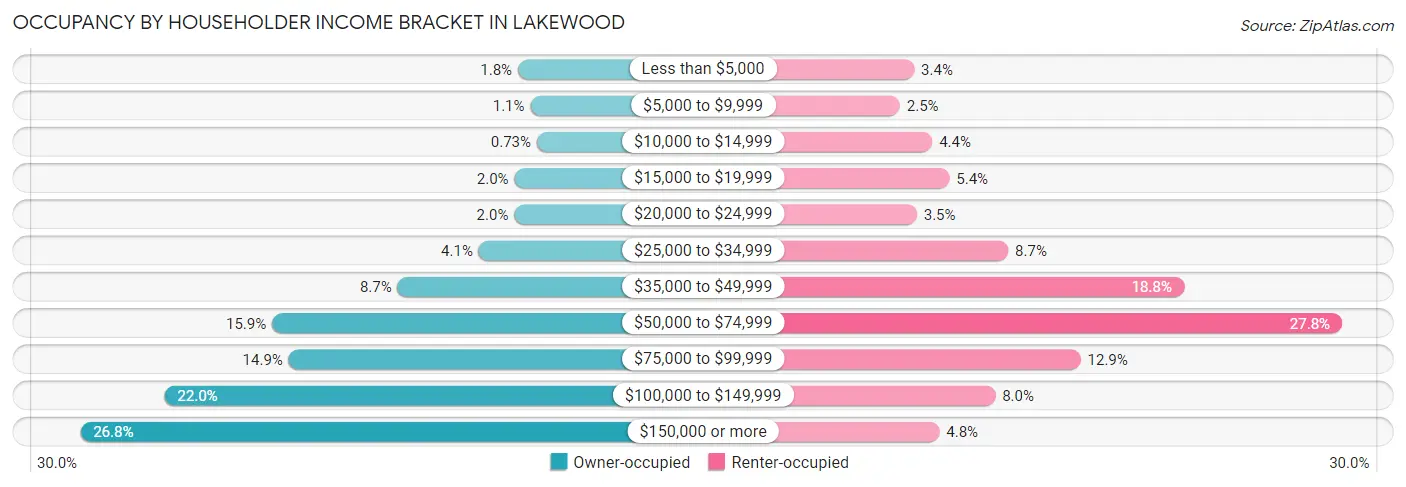
Occupancy by Householder Income Bracket in Lakewood
| Income Bracket | Owner-occupied | Renter-occupied |
| Less than $5,000 | 208 (1.8%) | 499 (3.4%) |
| $5,000 to $9,999 | 126 (1.1%) | 376 (2.5%) |
| $10,000 to $14,999 | 84 (0.7%) | 651 (4.4%) |
| $15,000 to $19,999 | 231 (2.0%) | 797 (5.4%) |
| $20,000 to $24,999 | 232 (2.0%) | 521 (3.5%) |
| $25,000 to $34,999 | 465 (4.1%) | 1,297 (8.7%) |
| $35,000 to $49,999 | 998 (8.7%) | 2,790 (18.8%) |
| $50,000 to $74,999 | 1,822 (15.9%) | 4,134 (27.8%) |
| $75,000 to $99,999 | 1,713 (14.9%) | 1,913 (12.9%) |
| $100,000 to $149,999 | 2,528 (22.0%) | 1,187 (8.0%) |
| $150,000 or more | 3,081 (26.8%) | 713 (4.8%) |
| Total | 11,488 (100.0%) | 14,878 (100.0%) |
Monthly Housing Cost Tiers in Lakewood
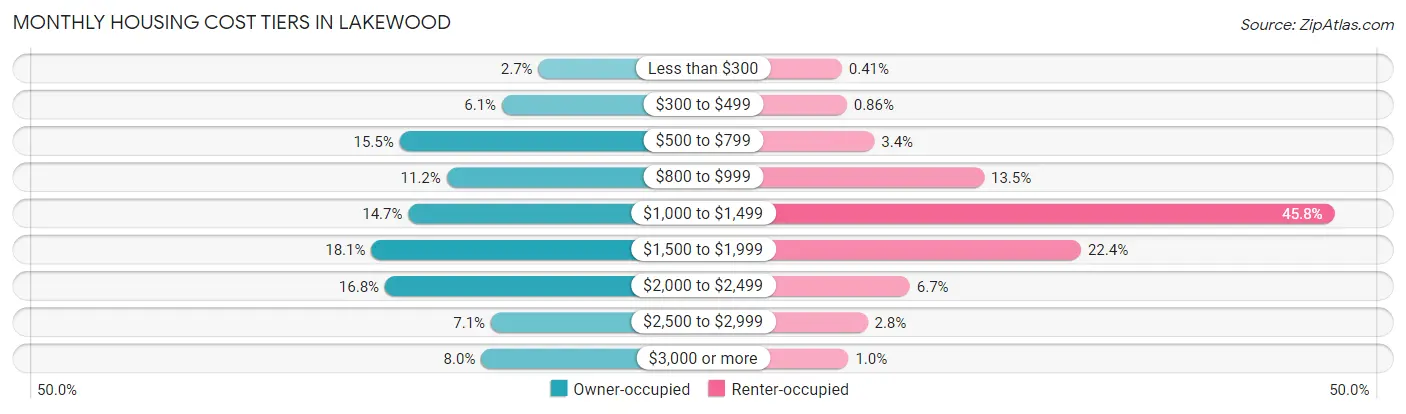
| Monthly Cost | Owner-occupied | Renter-occupied |
| Less than $300 | 310 (2.7%) | 61 (0.4%) |
| $300 to $499 | 696 (6.1%) | 128 (0.9%) |
| $500 to $799 | 1,778 (15.5%) | 506 (3.4%) |
| $800 to $999 | 1,281 (11.2%) | 2,009 (13.5%) |
| $1,000 to $1,499 | 1,686 (14.7%) | 6,806 (45.8%) |
| $1,500 to $1,999 | 2,077 (18.1%) | 3,336 (22.4%) |
| $2,000 to $2,499 | 1,933 (16.8%) | 993 (6.7%) |
| $2,500 to $2,999 | 812 (7.1%) | 412 (2.8%) |
| $3,000 or more | 915 (8.0%) | 152 (1.0%) |
| Total | 11,488 (100.0%) | 14,878 (100.0%) |
Physical Housing Characteristics in Lakewood
Housing Structures in Lakewood
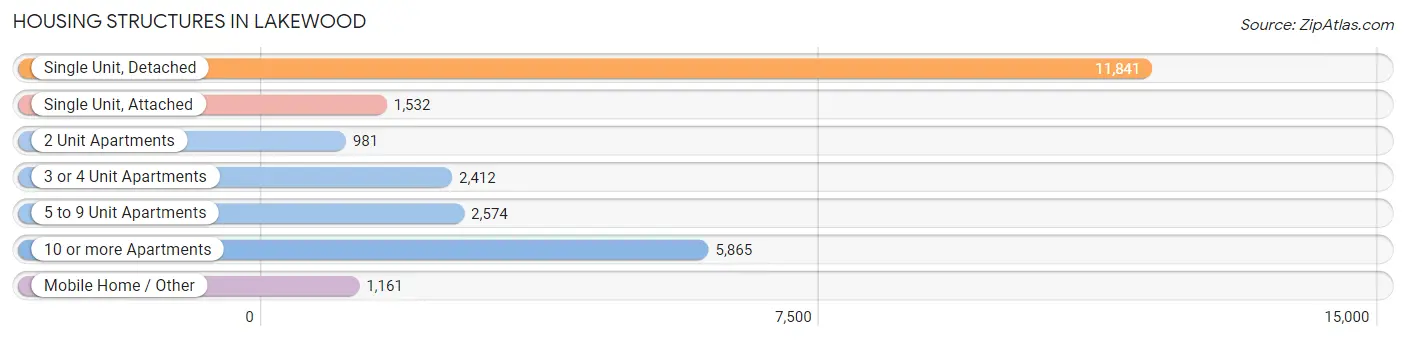
| Structure Type | # Housing Units | % Housing Units |
| Single Unit, Detached | 11,841 | 44.9% |
| Single Unit, Attached | 1,532 | 5.8% |
| 2 Unit Apartments | 981 | 3.7% |
| 3 or 4 Unit Apartments | 2,412 | 9.1% |
| 5 to 9 Unit Apartments | 2,574 | 9.8% |
| 10 or more Apartments | 5,865 | 22.2% |
| Mobile Home / Other | 1,161 | 4.4% |
| Total | 26,366 | 100.0% |
Housing Structures by Occupancy in Lakewood
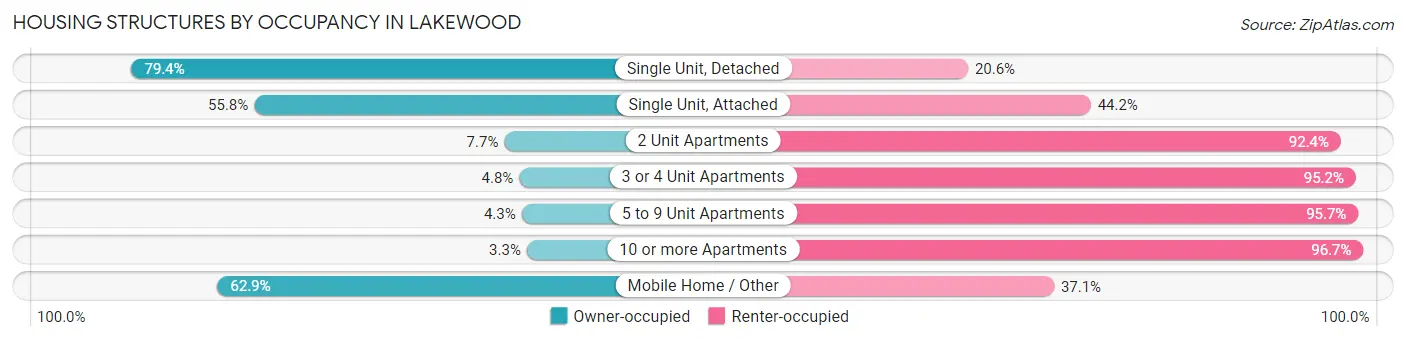
| Structure Type | Owner-occupied | Renter-occupied |
| Single Unit, Detached | 9,407 (79.4%) | 2,434 (20.6%) |
| Single Unit, Attached | 855 (55.8%) | 677 (44.2%) |
| 2 Unit Apartments | 75 (7.6%) | 906 (92.3%) |
| 3 or 4 Unit Apartments | 115 (4.8%) | 2,297 (95.2%) |
| 5 to 9 Unit Apartments | 111 (4.3%) | 2,463 (95.7%) |
| 10 or more Apartments | 195 (3.3%) | 5,670 (96.7%) |
| Mobile Home / Other | 730 (62.9%) | 431 (37.1%) |
| Total | 11,488 (43.6%) | 14,878 (56.4%) |
Housing Structures by Number of Rooms in Lakewood
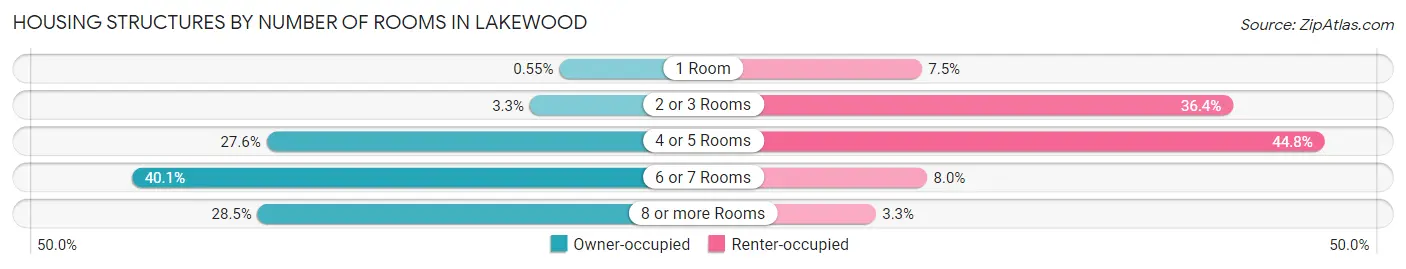
| Number of Rooms | Owner-occupied | Renter-occupied |
| 1 Room | 63 (0.5%) | 1,121 (7.5%) |
| 2 or 3 Rooms | 377 (3.3%) | 5,409 (36.4%) |
| 4 or 5 Rooms | 3,174 (27.6%) | 6,668 (44.8%) |
| 6 or 7 Rooms | 4,606 (40.1%) | 1,193 (8.0%) |
| 8 or more Rooms | 3,268 (28.4%) | 487 (3.3%) |
| Total | 11,488 (100.0%) | 14,878 (100.0%) |
Housing Structure by Heating Type in Lakewood
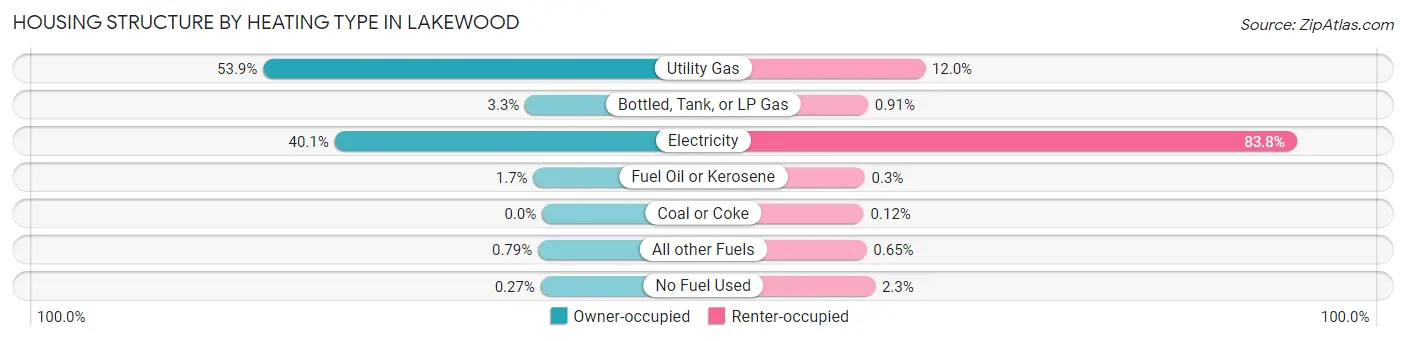
| Heating Type | Owner-occupied | Renter-occupied |
| Utility Gas | 6,193 (53.9%) | 1,779 (12.0%) |
| Bottled, Tank, or LP Gas | 376 (3.3%) | 136 (0.9%) |
| Electricity | 4,605 (40.1%) | 12,462 (83.8%) |
| Fuel Oil or Kerosene | 192 (1.7%) | 44 (0.3%) |
| Coal or Coke | 0 (0.0%) | 18 (0.1%) |
| All other Fuels | 91 (0.8%) | 97 (0.6%) |
| No Fuel Used | 31 (0.3%) | 342 (2.3%) |
| Total | 11,488 (100.0%) | 14,878 (100.0%) |
Household Vehicle Usage in Lakewood
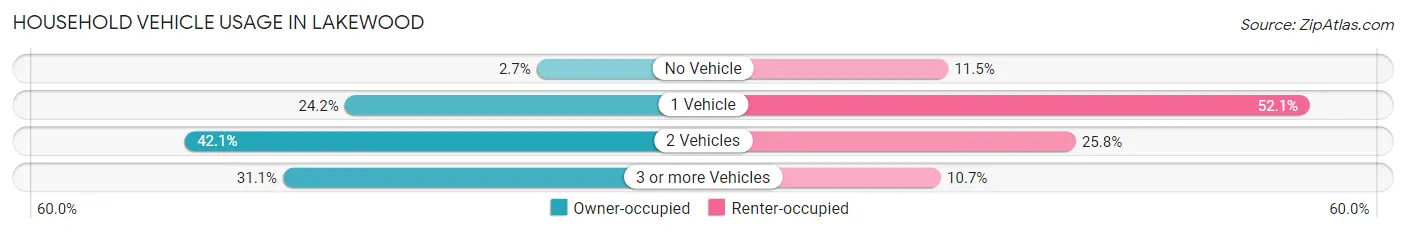
| Vehicles per Household | Owner-occupied | Renter-occupied |
| No Vehicle | 304 (2.6%) | 1,709 (11.5%) |
| 1 Vehicle | 2,776 (24.2%) | 7,748 (52.1%) |
| 2 Vehicles | 4,839 (42.1%) | 3,834 (25.8%) |
| 3 or more Vehicles | 3,569 (31.1%) | 1,587 (10.7%) |
| Total | 11,488 (100.0%) | 14,878 (100.0%) |
Real Estate & Mortgages in Lakewood
Real Estate and Mortgage Overview in Lakewood
| Characteristic | Without Mortgage | With Mortgage |
| Housing Units | 4,763 | 6,725 |
| Median Property Value | $393,500 | $413,200 |
| Median Household Income | $70,558 | $2,131 |
| Monthly Housing Costs | $762 | $871 |
| Real Estate Taxes | $4,045 | $198 |
Property Value by Mortgage Status in Lakewood
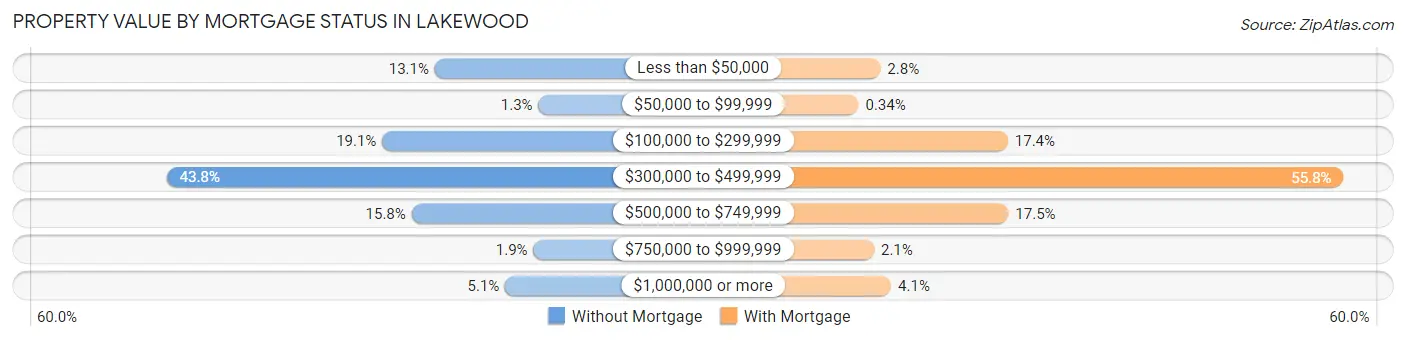
| Property Value | Without Mortgage | With Mortgage |
| Less than $50,000 | 625 (13.1%) | 191 (2.8%) |
| $50,000 to $99,999 | 61 (1.3%) | 23 (0.3%) |
| $100,000 to $299,999 | 911 (19.1%) | 1,171 (17.4%) |
| $300,000 to $499,999 | 2,085 (43.8%) | 3,749 (55.7%) |
| $500,000 to $749,999 | 751 (15.8%) | 1,175 (17.5%) |
| $750,000 to $999,999 | 88 (1.8%) | 142 (2.1%) |
| $1,000,000 or more | 242 (5.1%) | 274 (4.1%) |
| Total | 4,763 (100.0%) | 6,725 (100.0%) |
Household Income by Mortgage Status in Lakewood
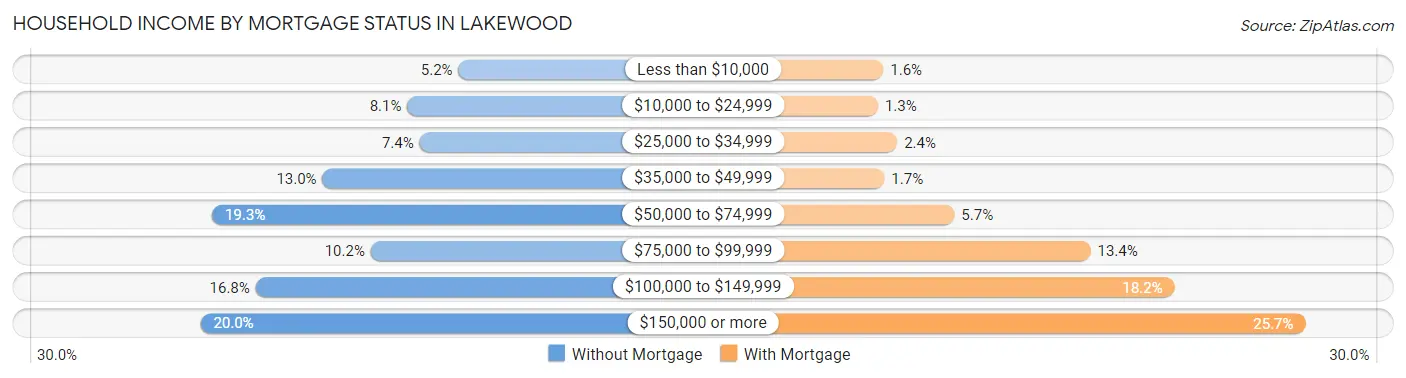
| Household Income | Without Mortgage | With Mortgage |
| Less than $10,000 | 248 (5.2%) | 107 (1.6%) |
| $10,000 to $24,999 | 387 (8.1%) | 86 (1.3%) |
| $25,000 to $34,999 | 354 (7.4%) | 160 (2.4%) |
| $35,000 to $49,999 | 618 (13.0%) | 111 (1.7%) |
| $50,000 to $74,999 | 919 (19.3%) | 380 (5.7%) |
| $75,000 to $99,999 | 487 (10.2%) | 903 (13.4%) |
| $100,000 to $149,999 | 800 (16.8%) | 1,226 (18.2%) |
| $150,000 or more | 950 (20.0%) | 1,728 (25.7%) |
| Total | 4,763 (100.0%) | 6,725 (100.0%) |
Property Value to Household Income Ratio in Lakewood
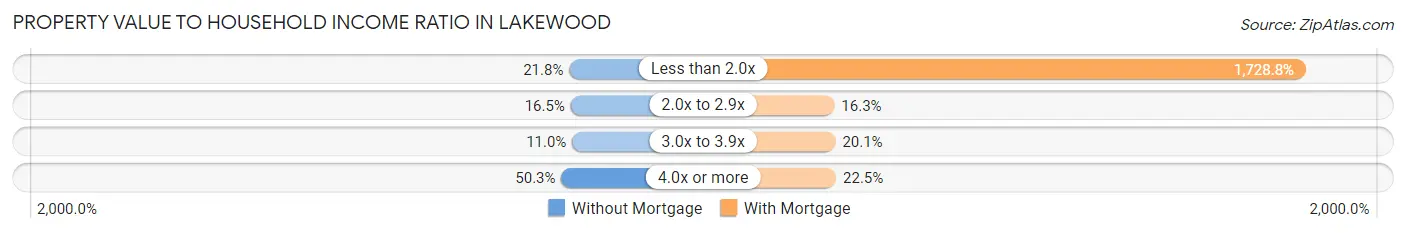
| Value-to-Income Ratio | Without Mortgage | With Mortgage |
| Less than 2.0x | 1,040 (21.8%) | 116,264 (1,728.8%) |
| 2.0x to 2.9x | 784 (16.5%) | 1,093 (16.3%) |
| 3.0x to 3.9x | 525 (11.0%) | 1,353 (20.1%) |
| 4.0x or more | 2,397 (50.3%) | 1,513 (22.5%) |
| Total | 4,763 (100.0%) | 6,725 (100.0%) |
Real Estate Taxes by Mortgage Status in Lakewood
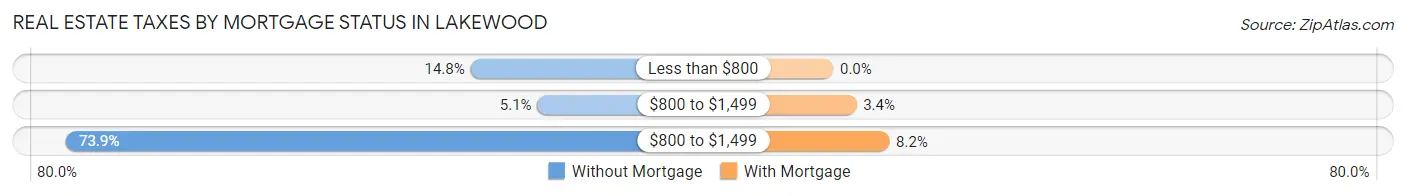
| Property Taxes | Without Mortgage | With Mortgage |
| Less than $800 | 707 (14.8%) | 0 (0.0%) |
| $800 to $1,499 | 241 (5.1%) | 227 (3.4%) |
| $800 to $1,499 | 3,522 (73.9%) | 551 (8.2%) |
| Total | 4,763 (100.0%) | 6,725 (100.0%) |
Health & Disability in Lakewood
Health Insurance Coverage by Age in Lakewood
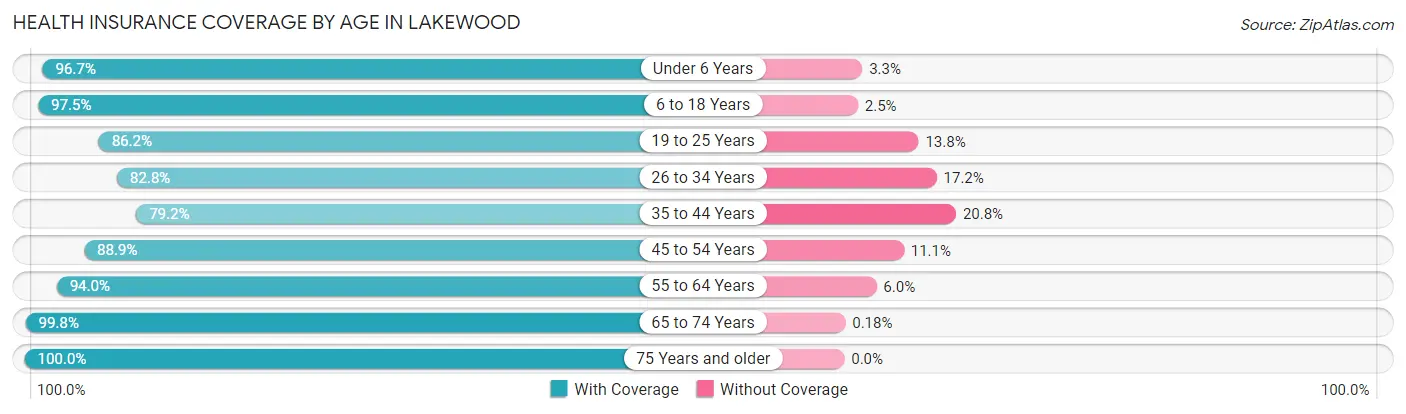
| Age Bracket | With Coverage | Without Coverage |
| Under 6 Years | 4,404 (96.7%) | 152 (3.3%) |
| 6 to 18 Years | 8,239 (97.5%) | 214 (2.5%) |
| 19 to 25 Years | 5,556 (86.2%) | 892 (13.8%) |
| 26 to 34 Years | 7,551 (82.8%) | 1,571 (17.2%) |
| 35 to 44 Years | 5,755 (79.2%) | 1,513 (20.8%) |
| 45 to 54 Years | 5,861 (88.9%) | 731 (11.1%) |
| 55 to 64 Years | 7,423 (94.0%) | 473 (6.0%) |
| 65 to 74 Years | 6,066 (99.8%) | 11 (0.2%) |
| 75 Years and older | 4,010 (100.0%) | 0 (0.0%) |
| Total | 54,865 (90.8%) | 5,557 (9.2%) |
Health Insurance Coverage by Citizenship Status in Lakewood
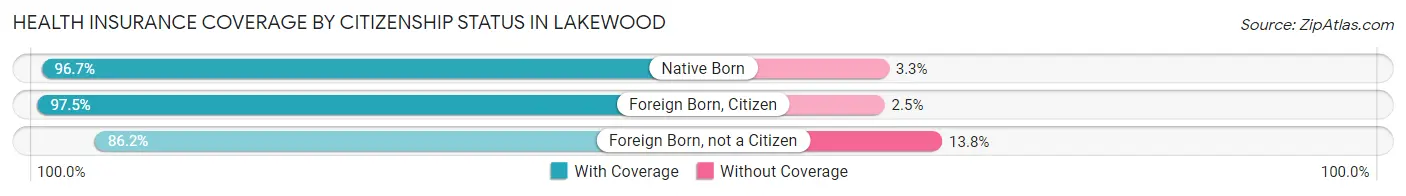
| Citizenship Status | With Coverage | Without Coverage |
| Native Born | 4,404 (96.7%) | 152 (3.3%) |
| Foreign Born, Citizen | 8,239 (97.5%) | 214 (2.5%) |
| Foreign Born, not a Citizen | 5,556 (86.2%) | 892 (13.8%) |
Health Insurance Coverage by Household Income in Lakewood
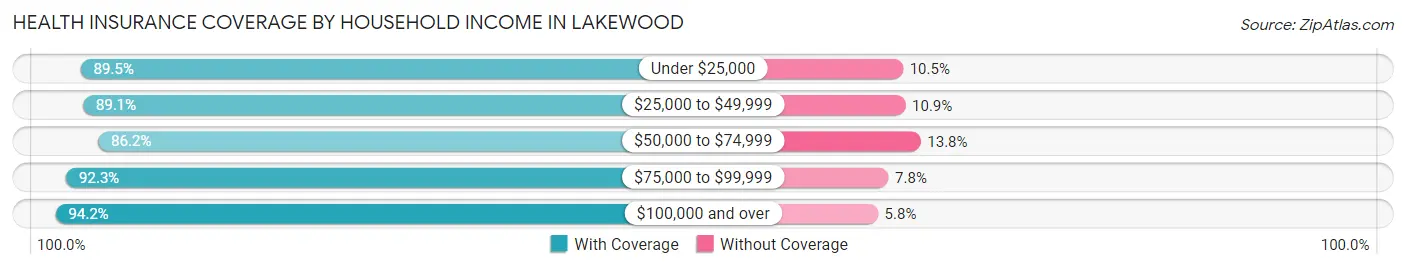
| Household Income | With Coverage | Without Coverage |
| Under $25,000 | 5,348 (89.5%) | 626 (10.5%) |
| $25,000 to $49,999 | 9,424 (89.1%) | 1,155 (10.9%) |
| $50,000 to $74,999 | 10,697 (86.2%) | 1,709 (13.8%) |
| $75,000 to $99,999 | 8,283 (92.2%) | 696 (7.7%) |
| $100,000 and over | 20,464 (94.2%) | 1,256 (5.8%) |
Public vs Private Health Insurance Coverage by Age in Lakewood
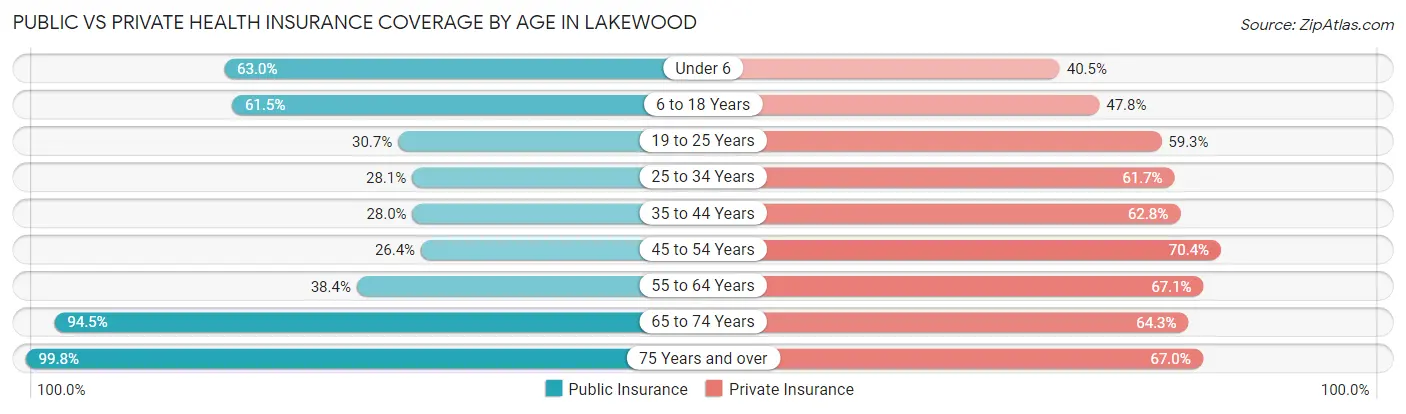
| Age Bracket | Public Insurance | Private Insurance |
| Under 6 | 2,869 (63.0%) | 1,844 (40.5%) |
| 6 to 18 Years | 5,199 (61.5%) | 4,040 (47.8%) |
| 19 to 25 Years | 1,978 (30.7%) | 3,825 (59.3%) |
| 25 to 34 Years | 2,562 (28.1%) | 5,632 (61.7%) |
| 35 to 44 Years | 2,036 (28.0%) | 4,562 (62.8%) |
| 45 to 54 Years | 1,742 (26.4%) | 4,638 (70.4%) |
| 55 to 64 Years | 3,028 (38.4%) | 5,300 (67.1%) |
| 65 to 74 Years | 5,741 (94.5%) | 3,909 (64.3%) |
| 75 Years and over | 4,002 (99.8%) | 2,685 (67.0%) |
| Total | 29,157 (48.3%) | 36,435 (60.3%) |
Disability Status by Sex by Age in Lakewood
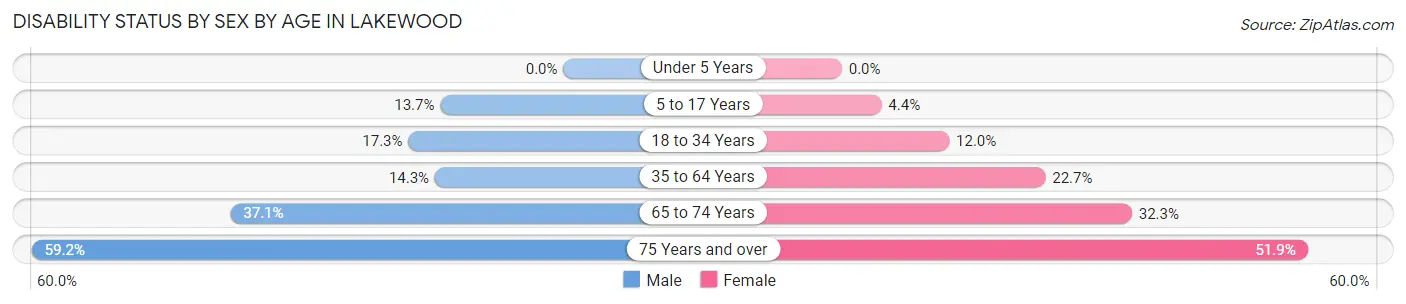
| Age Bracket | Male | Female |
| Under 5 Years | 0 (0.0%) | 0 (0.0%) |
| 5 to 17 Years | 648 (13.7%) | 184 (4.4%) |
| 18 to 34 Years | 1,409 (17.3%) | 931 (11.9%) |
| 35 to 64 Years | 1,486 (14.3%) | 2,575 (22.7%) |
| 65 to 74 Years | 1,056 (37.1%) | 1,043 (32.3%) |
| 75 Years and over | 1,019 (59.2%) | 1,187 (51.9%) |
Disability Class by Sex by Age in Lakewood
Disability Class: Hearing Difficulty
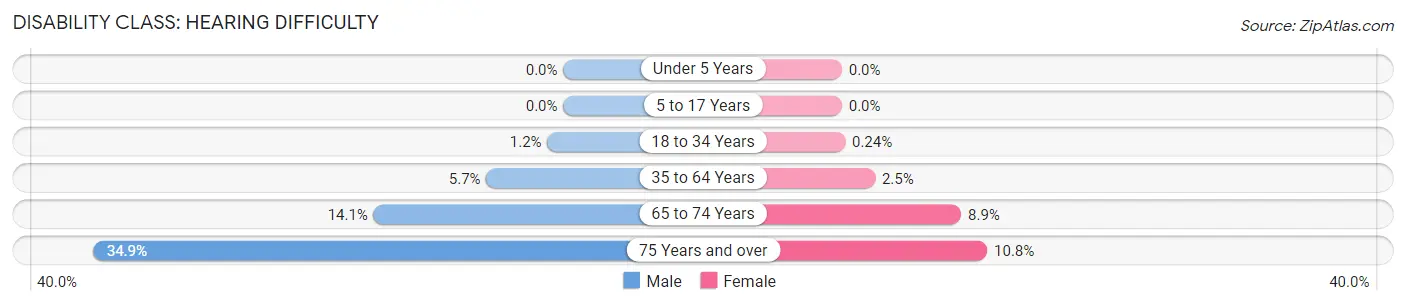
| Age Bracket | Male | Female |
| Under 5 Years | 0 (0.0%) | 0 (0.0%) |
| 5 to 17 Years | 0 (0.0%) | 0 (0.0%) |
| 18 to 34 Years | 96 (1.2%) | 19 (0.2%) |
| 35 to 64 Years | 593 (5.7%) | 280 (2.5%) |
| 65 to 74 Years | 401 (14.1%) | 286 (8.9%) |
| 75 Years and over | 600 (34.9%) | 247 (10.8%) |
Disability Class: Vision Difficulty
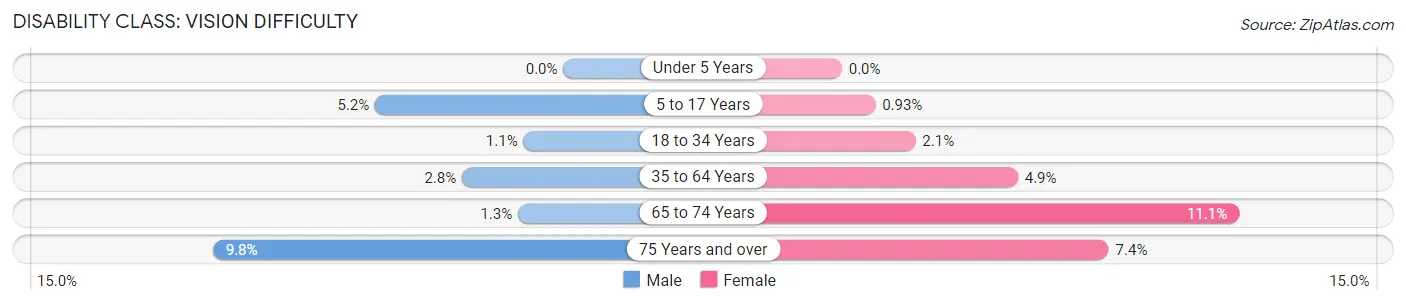
| Age Bracket | Male | Female |
| Under 5 Years | 0 (0.0%) | 0 (0.0%) |
| 5 to 17 Years | 248 (5.2%) | 39 (0.9%) |
| 18 to 34 Years | 91 (1.1%) | 160 (2.1%) |
| 35 to 64 Years | 293 (2.8%) | 557 (4.9%) |
| 65 to 74 Years | 36 (1.3%) | 357 (11.1%) |
| 75 Years and over | 168 (9.8%) | 170 (7.4%) |
Disability Class: Cognitive Difficulty
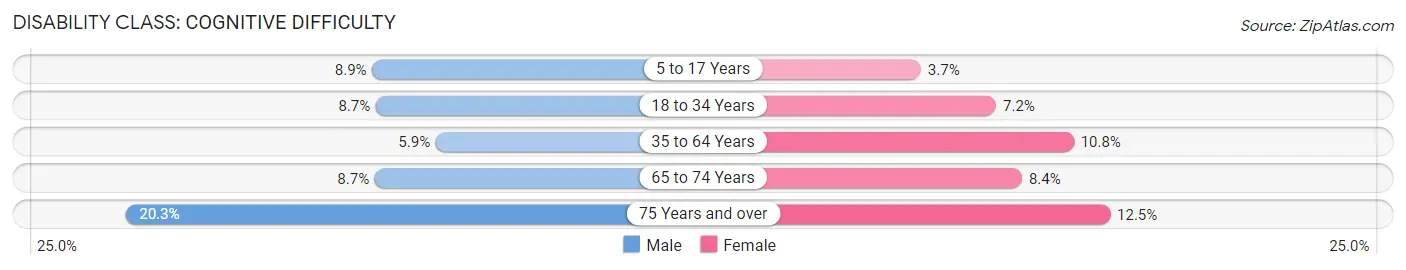
| Age Bracket | Male | Female |
| 5 to 17 Years | 419 (8.9%) | 153 (3.7%) |
| 18 to 34 Years | 709 (8.7%) | 558 (7.2%) |
| 35 to 64 Years | 614 (5.9%) | 1,223 (10.8%) |
| 65 to 74 Years | 249 (8.7%) | 270 (8.4%) |
| 75 Years and over | 349 (20.3%) | 285 (12.4%) |
Disability Class: Ambulatory Difficulty
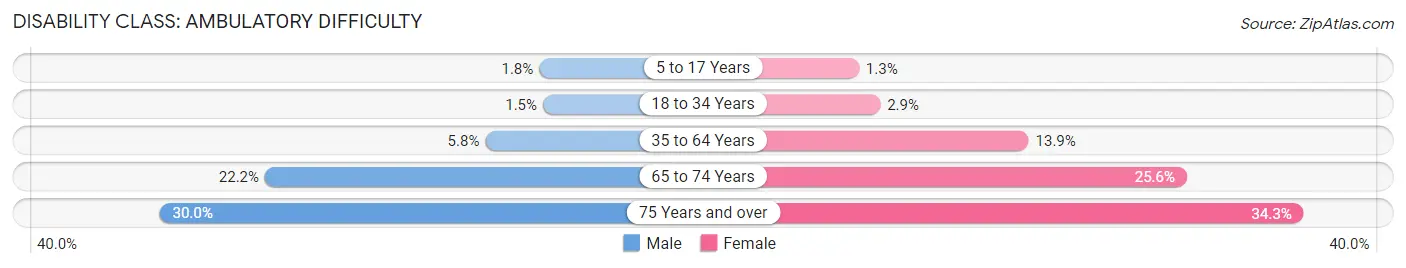
| Age Bracket | Male | Female |
| 5 to 17 Years | 85 (1.8%) | 53 (1.3%) |
| 18 to 34 Years | 124 (1.5%) | 222 (2.9%) |
| 35 to 64 Years | 603 (5.8%) | 1,576 (13.9%) |
| 65 to 74 Years | 631 (22.2%) | 827 (25.6%) |
| 75 Years and over | 516 (30.0%) | 785 (34.3%) |
Disability Class: Self-Care Difficulty
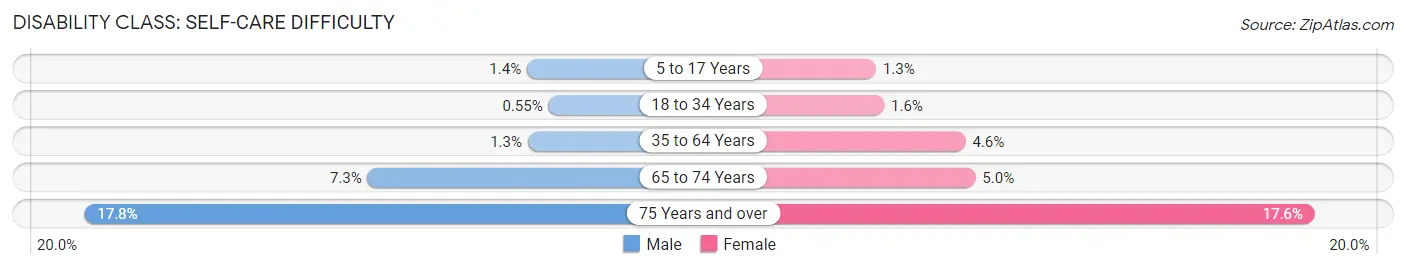
| Age Bracket | Male | Female |
| 5 to 17 Years | 64 (1.3%) | 53 (1.3%) |
| 18 to 34 Years | 45 (0.5%) | 122 (1.6%) |
| 35 to 64 Years | 137 (1.3%) | 521 (4.6%) |
| 65 to 74 Years | 207 (7.3%) | 160 (5.0%) |
| 75 Years and over | 306 (17.8%) | 402 (17.6%) |
Technology Access in Lakewood
Computing Device Access in Lakewood
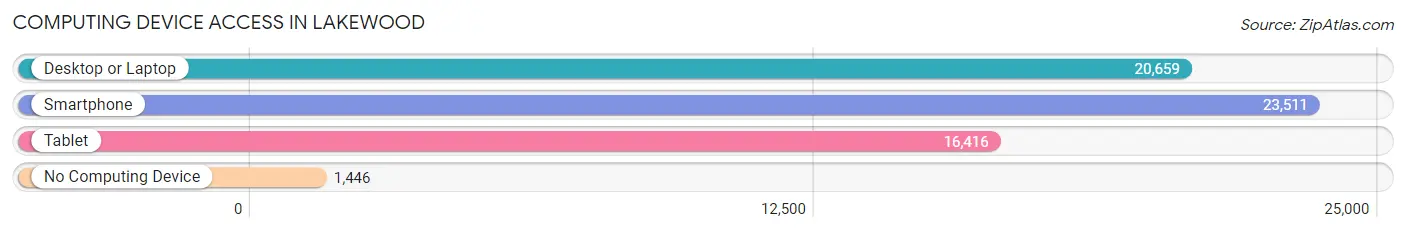
| Device Type | # Households | % Households |
| Desktop or Laptop | 20,659 | 78.3% |
| Smartphone | 23,511 | 89.2% |
| Tablet | 16,416 | 62.3% |
| No Computing Device | 1,446 | 5.5% |
| Total | 26,366 | 100.0% |
Internet Access in Lakewood
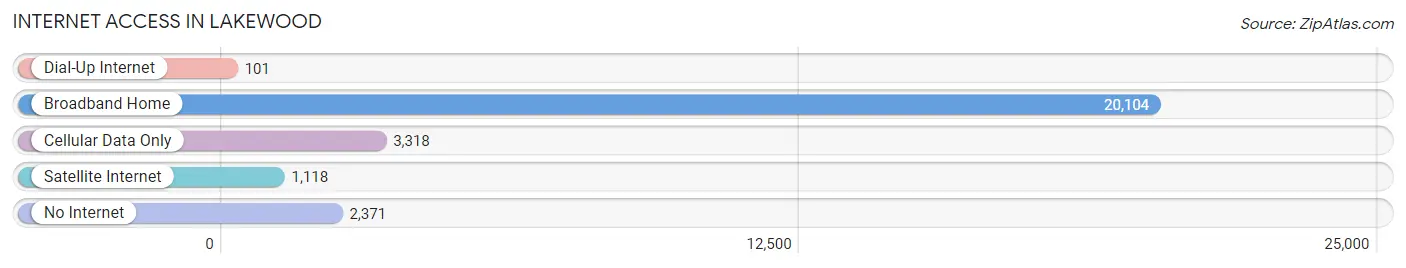
| Internet Type | # Households | % Households |
| Dial-Up Internet | 101 | 0.4% |
| Broadband Home | 20,104 | 76.2% |
| Cellular Data Only | 3,318 | 12.6% |
| Satellite Internet | 1,118 | 4.2% |
| No Internet | 2,371 | 9.0% |
| Total | 26,366 | 100.0% |
Lakewood Summary
Introduction
Located in the Puget Sound region of Washington State, the city of Lakewood is a vibrant and diverse community with a rich history and a bright future. With a population of over 60,000, Lakewood is the second largest city in Pierce County and the fifth largest in the state. The city is home to a variety of businesses, industries, and recreational activities, making it an attractive destination for both residents and visitors alike.
History
The area now known as Lakewood was first inhabited by the Nisqually and Puyallup tribes, who lived in the area for thousands of years before the arrival of European settlers. The first recorded European settlers in the area were members of the Hudson’s Bay Company, who arrived in 1845. The area was then known as Steilacoom, and was the first incorporated town in Washington State.
In the late 19th century, the area began to experience rapid growth due to the arrival of the Northern Pacific Railroad. The railroad brought with it an influx of new settlers, and the area began to develop into a bustling community. In 1896, the town of Lakewood was officially incorporated, and the city quickly grew in size and population.
Geography
Lakewood is located in the Puget Sound region of Washington State, approximately 15 miles south of Seattle. The city is bordered by Tacoma to the south, University Place to the west, and Joint Base Lewis-McChord to the east. The city is situated on the shores of American Lake, and is surrounded by several other lakes, including Gravelly Lake, Waughop Lake, and Lake Steilacoom.
The city has a total area of 18.7 square miles, of which 17.7 square miles is land and 1.0 square mile is water. The city is located at an elevation of approximately 200 feet above sea level.
Economy
Lakewood’s economy is largely driven by the presence of Joint Base Lewis-McChord, which is the largest military installation in the Pacific Northwest. The base is home to over 40,000 military personnel and civilian employees, and is a major employer in the city.
In addition to the military base, Lakewood is home to a variety of businesses and industries. The city is home to several large retail stores, including Walmart, Target, and Costco. The city is also home to several manufacturing companies, including Boeing, Lockheed Martin, and Weyerhaeuser.
Demographics
As of the 2010 census, the population of Lakewood was 58,163. The racial makeup of the city was 73.3% White, 11.2% African American, 0.7% Native American, 5.2% Asian, 0.3% Pacific Islander, and 8.5% from other races. Hispanic or Latino of any race were 14.3% of the population.
The median household income in Lakewood was $50,945, and the median family income was $60,945. The per capita income for the city was $25,945. Approximately 11.2% of the population was below the poverty line.
Conclusion
Lakewood is a vibrant and diverse city with a rich history and a bright future. The city is home to a variety of businesses, industries, and recreational activities, making it an attractive destination for both residents and visitors alike. With its strong economy, diverse population, and beautiful natural surroundings, Lakewood is an ideal place to live, work, and play.
Common Questions
What is Per Capita Income in Lakewood?
Per Capita income in Lakewood is $39,363.
What is the Median Family Income in Lakewood?
Median Family Income in Lakewood is $77,675.
What is the Median Household income in Lakewood?
Median Household Income in Lakewood is $65,531.
What is Income or Wage Gap in Lakewood?
Income or Wage Gap in Lakewood is 18.1%.
Women in Lakewood earn 81.9 cents for every dollar earned by a man.
What is Family Income Deficit in Lakewood?
Family Income Deficit in Lakewood is $10,158.
Families that are below poverty line in Lakewood earn $10,158 less on average than the poverty threshold level.
What is Inequality or Gini Index in Lakewood?
Inequality or Gini Index in Lakewood is 0.45.
What is the Total Population of Lakewood?
Total Population of Lakewood is 63,142.
What is the Total Male Population of Lakewood?
Total Male Population of Lakewood is 31,679.
What is the Total Female Population of Lakewood?
Total Female Population of Lakewood is 31,463.
What is the Ratio of Males per 100 Females in Lakewood?
There are 100.69 Males per 100 Females in Lakewood.
What is the Ratio of Females per 100 Males in Lakewood?
There are 99.32 Females per 100 Males in Lakewood.
What is the Median Population Age in Lakewood?
Median Population Age in Lakewood is 36.2 Years.
What is the Average Family Size in Lakewood
Average Family Size in Lakewood is 2.9 People.
What is the Average Household Size in Lakewood
Average Household Size in Lakewood is 2.3 People.
How Large is the Labor Force in Lakewood?
There are 32,040 People in the Labor Forcein in Lakewood.
What is the Percentage of People in the Labor Force in Lakewood?
62.1% of People are in the Labor Force in Lakewood.
What is the Unemployment Rate in Lakewood?
Unemployment Rate in Lakewood is 5.2%.