Federal Way, WA Map & Demographics
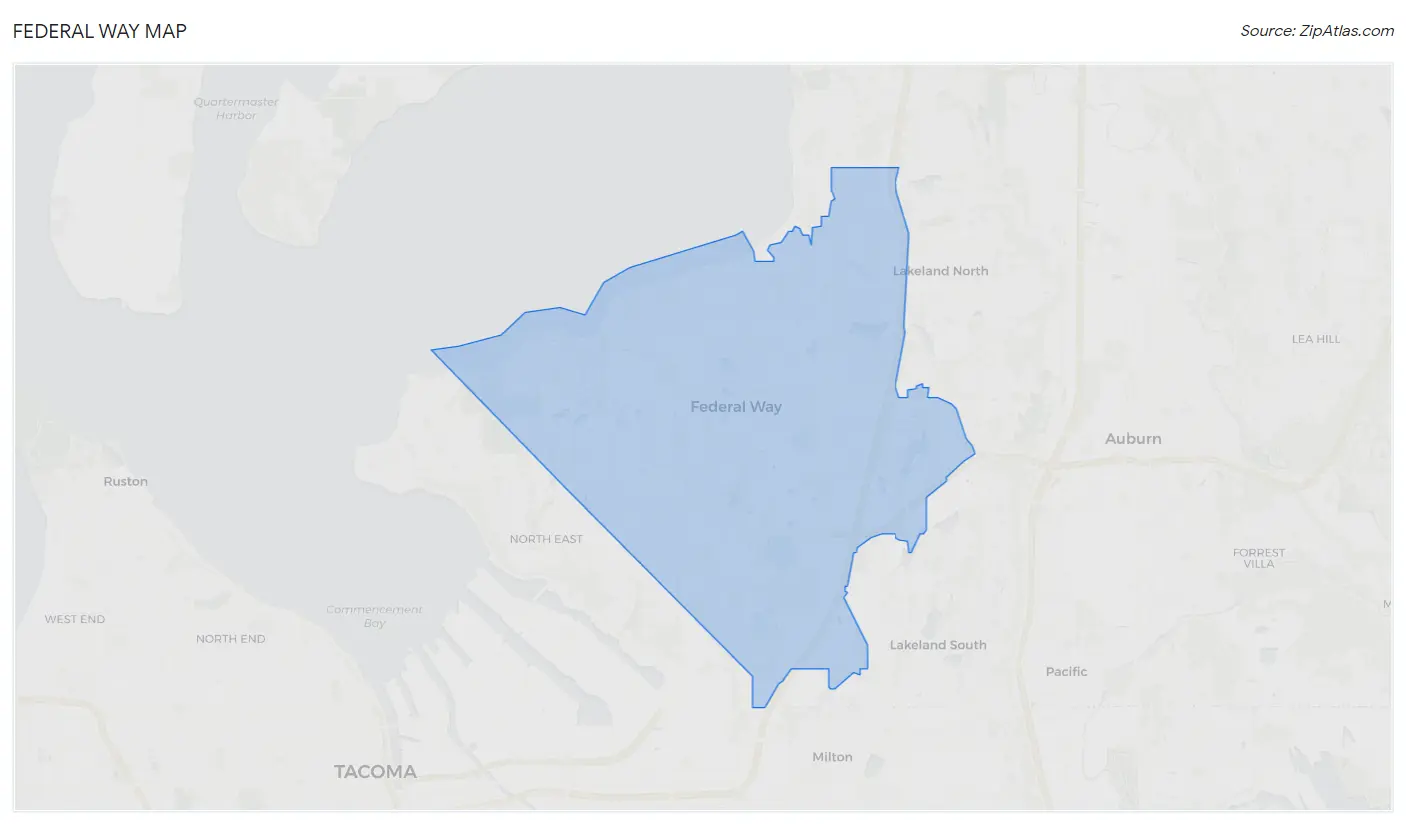
Federal Way Map
Federal Way Overview
$37,674
PER CAPITA INCOME
$93,141
AVG FAMILY INCOME
$80,360
AVG HOUSEHOLD INCOME
26.5%
WAGE / INCOME GAP [ % ]
73.5¢/ $1
WAGE / INCOME GAP [ $ ]
$11,153
FAMILY INCOME DEFICIT
0.42
INEQUALITY / GINI INDEX
99,614
TOTAL POPULATION
50,519
MALE POPULATION
49,095
FEMALE POPULATION
102.90
MALES / 100 FEMALES
97.18
FEMALES / 100 MALES
37.4
MEDIAN AGE
3.3
AVG FAMILY SIZE
2.7
AVG HOUSEHOLD SIZE
52,264
LABOR FORCE [ PEOPLE ]
65.7%
PERCENT IN LABOR FORCE
5.5%
UNEMPLOYMENT RATE
Federal Way Area Codes
Income in Federal Way
Income Overview in Federal Way
Per Capita Income in Federal Way is $37,674, while median incomes of families and households are $93,141 and $80,360 respectively.
| Characteristic | Number | Measure |
| Per Capita Income | 99,614 | $37,674 |
| Median Family Income | 24,230 | $93,141 |
| Mean Family Income | 24,230 | $113,757 |
| Median Household Income | 36,354 | $80,360 |
| Mean Household Income | 36,354 | $100,358 |
| Income Deficit | 24,230 | $11,153 |
| Wage / Income Gap (%) | 99,614 | 26.45% |
| Wage / Income Gap ($) | 99,614 | 73.55¢ per $1 |
| Gini / Inequality Index | 99,614 | 0.42 |
Earnings by Sex in Federal Way
Average Earnings in Federal Way are $43,520, $49,495 for men and $36,403 for women, a difference of 26.5%.
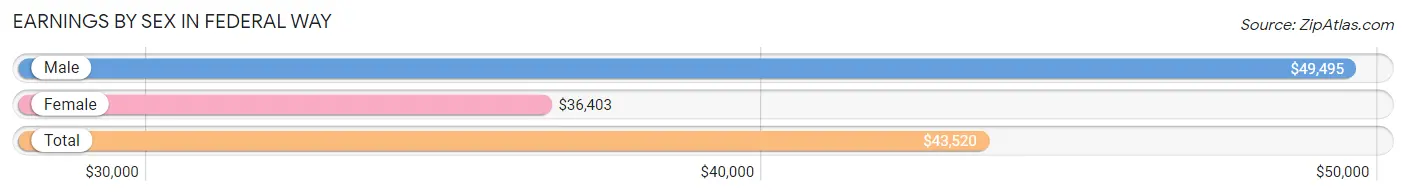
| Sex | Number | Average Earnings |
| Male | 29,637 (54.1%) | $49,495 |
| Female | 25,173 (45.9%) | $36,403 |
| Total | 54,810 (100.0%) | $43,520 |
Earnings by Sex by Income Bracket in Federal Way
The most common earnings brackets in Federal Way are $100,000+ for men (5,089 | 17.2%) and $100,000+ for women (2,410 | 9.6%).
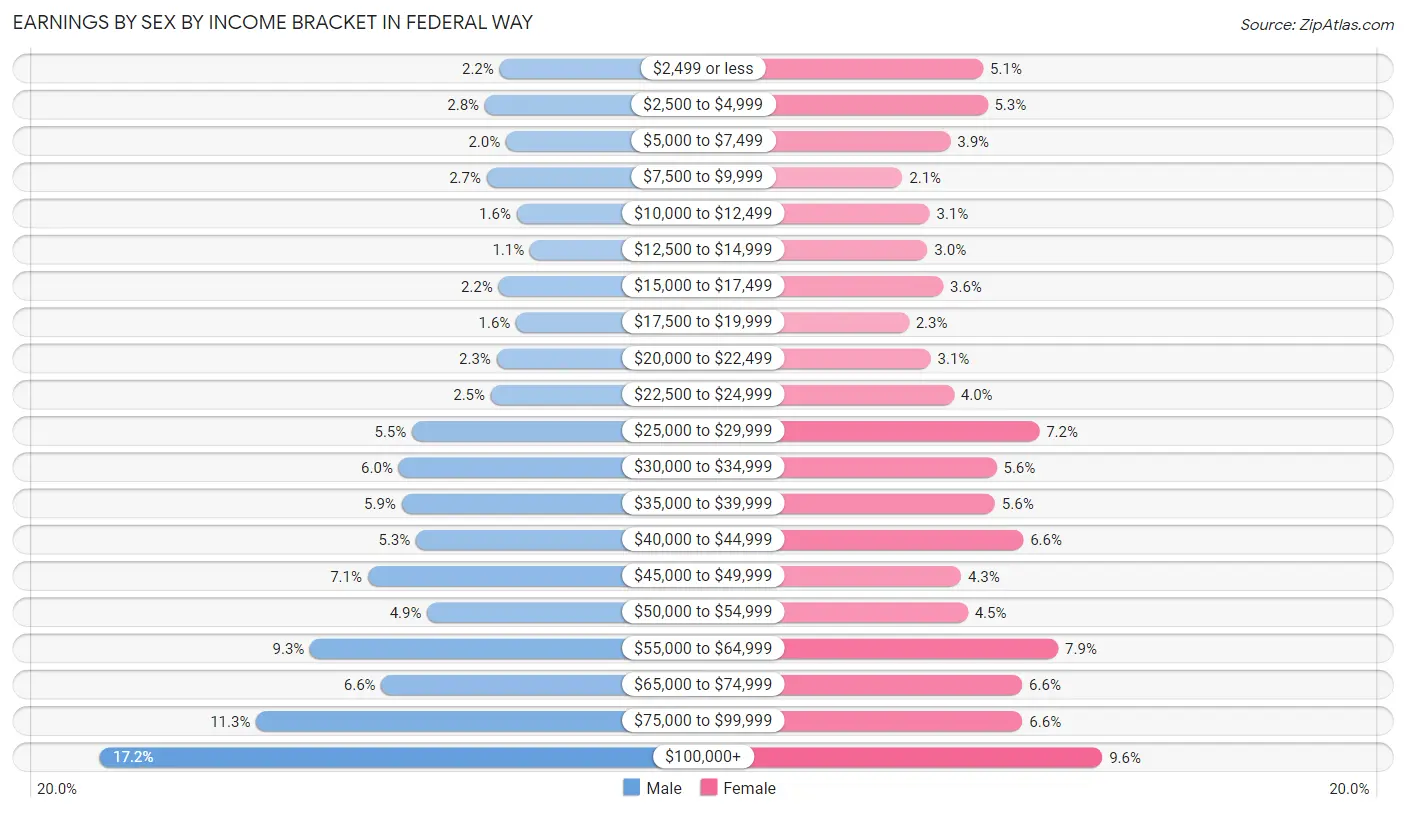
| Income | Male | Female |
| $2,499 or less | 651 (2.2%) | 1,287 (5.1%) |
| $2,500 to $4,999 | 815 (2.8%) | 1,327 (5.3%) |
| $5,000 to $7,499 | 580 (2.0%) | 977 (3.9%) |
| $7,500 to $9,999 | 795 (2.7%) | 524 (2.1%) |
| $10,000 to $12,499 | 462 (1.6%) | 781 (3.1%) |
| $12,500 to $14,999 | 315 (1.1%) | 760 (3.0%) |
| $15,000 to $17,499 | 664 (2.2%) | 909 (3.6%) |
| $17,500 to $19,999 | 469 (1.6%) | 585 (2.3%) |
| $20,000 to $22,499 | 686 (2.3%) | 791 (3.1%) |
| $22,500 to $24,999 | 750 (2.5%) | 1,010 (4.0%) |
| $25,000 to $29,999 | 1,623 (5.5%) | 1,814 (7.2%) |
| $30,000 to $34,999 | 1,772 (6.0%) | 1,413 (5.6%) |
| $35,000 to $39,999 | 1,741 (5.9%) | 1,398 (5.6%) |
| $40,000 to $44,999 | 1,581 (5.3%) | 1,663 (6.6%) |
| $45,000 to $49,999 | 2,115 (7.1%) | 1,078 (4.3%) |
| $50,000 to $54,999 | 1,454 (4.9%) | 1,141 (4.5%) |
| $55,000 to $64,999 | 2,755 (9.3%) | 1,993 (7.9%) |
| $65,000 to $74,999 | 1,966 (6.6%) | 1,655 (6.6%) |
| $75,000 to $99,999 | 3,354 (11.3%) | 1,657 (6.6%) |
| $100,000+ | 5,089 (17.2%) | 2,410 (9.6%) |
| Total | 29,637 (100.0%) | 25,173 (100.0%) |
Earnings by Sex by Educational Attainment in Federal Way
Average earnings in Federal Way are $54,805 for men and $41,438 for women, a difference of 24.4%. Men with an educational attainment of graduate degree enjoy the highest average annual earnings of $95,150, while those with less than high school education earn the least with $39,137. Women with an educational attainment of graduate degree earn the most with the average annual earnings of $62,188, while those with less than high school education have the smallest earnings of $28,750.
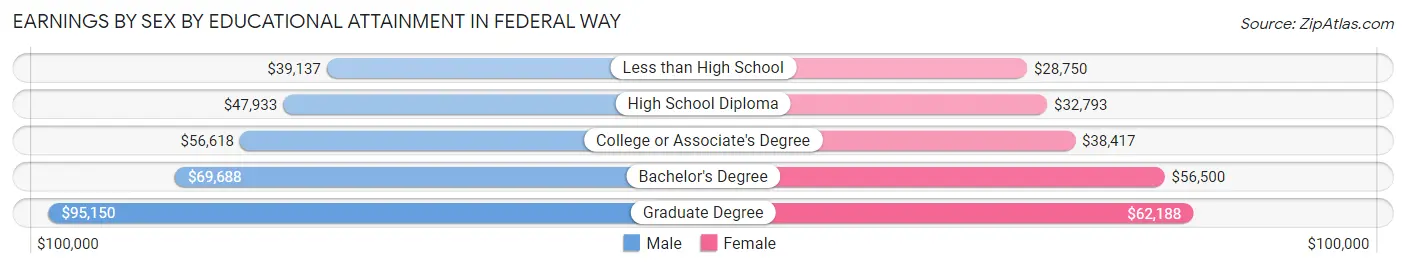
| Educational Attainment | Male Income | Female Income |
| Less than High School | $39,137 | $28,750 |
| High School Diploma | $47,933 | $32,793 |
| College or Associate's Degree | $56,618 | $38,417 |
| Bachelor's Degree | $69,688 | $56,500 |
| Graduate Degree | $95,150 | $62,188 |
| Total | $54,805 | $41,438 |
Family Income in Federal Way
Family Income Brackets in Federal Way
According to the Federal Way family income data, there are 5,428 families falling into the $100,000 to $149,999 income range, which is the most common income bracket and makes up 22.4% of all families. Conversely, the $10,000 to $14,999 income bracket is the least frequent group with only 509 families (2.1%) belonging to this category.
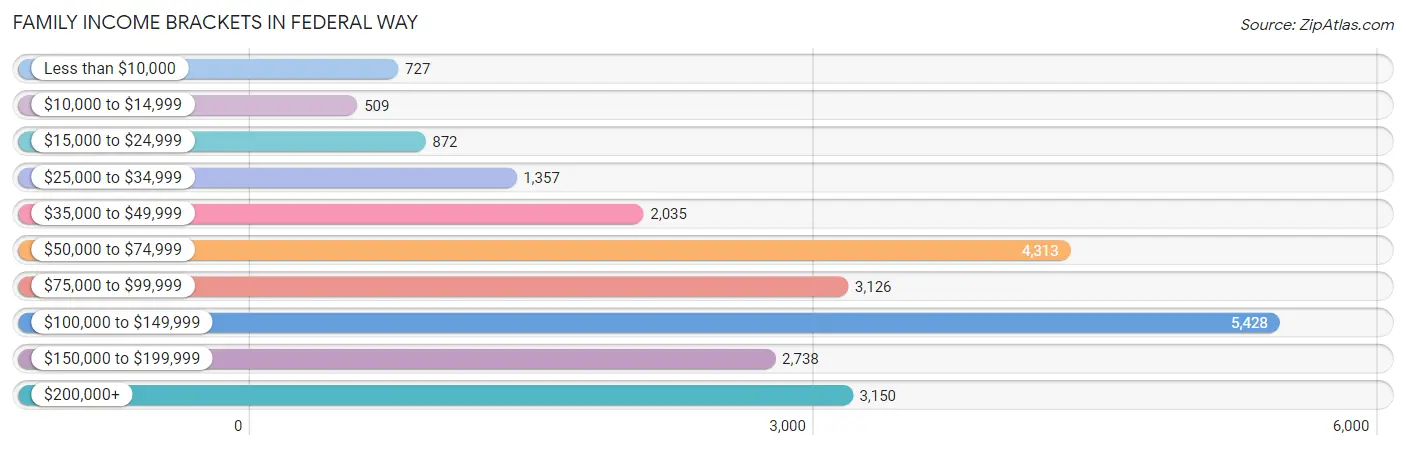
| Income Bracket | # Families | % Families |
| Less than $10,000 | 727 | 3.0% |
| $10,000 to $14,999 | 509 | 2.1% |
| $15,000 to $24,999 | 872 | 3.6% |
| $25,000 to $34,999 | 1,357 | 5.6% |
| $35,000 to $49,999 | 2,035 | 8.4% |
| $50,000 to $74,999 | 4,313 | 17.8% |
| $75,000 to $99,999 | 3,126 | 12.9% |
| $100,000 to $149,999 | 5,428 | 22.4% |
| $150,000 to $199,999 | 2,738 | 11.3% |
| $200,000+ | 3,150 | 13.0% |
Family Income by Famaliy Size in Federal Way
6-person families (1,068 | 4.4%) account for the highest median family income in Federal Way with $111,579 per family, while 2-person families (10,058 | 41.5%) have the highest median income of $41,197 per family member.
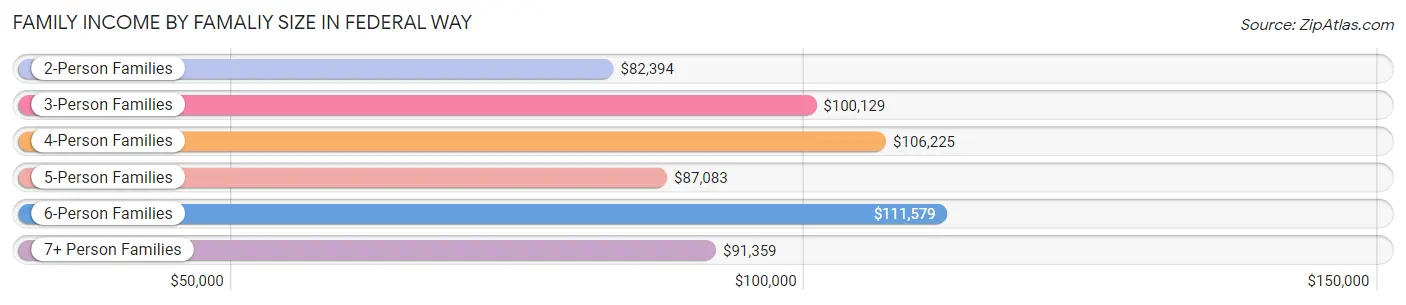
| Income Bracket | # Families | Median Income |
| 2-Person Families | 10,058 (41.5%) | $82,394 |
| 3-Person Families | 5,180 (21.4%) | $100,129 |
| 4-Person Families | 5,156 (21.3%) | $106,225 |
| 5-Person Families | 2,022 (8.4%) | $87,083 |
| 6-Person Families | 1,068 (4.4%) | $111,579 |
| 7+ Person Families | 746 (3.1%) | $91,359 |
| Total | 24,230 (100.0%) | $93,141 |
Family Income by Number of Earners in Federal Way
The median family income in Federal Way is $93,141, with families comprising 3+ earners (4,148) having the highest median family income of $136,168, while families with no earners (2,964) have the lowest median family income of $46,857, accounting for 17.1% and 12.2% of families, respectively.
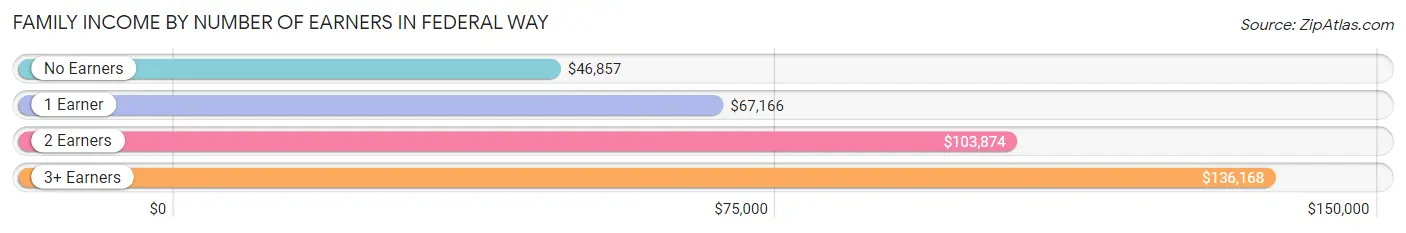
| Number of Earners | # Families | Median Income |
| No Earners | 2,964 (12.2%) | $46,857 |
| 1 Earner | 7,461 (30.8%) | $67,166 |
| 2 Earners | 9,657 (39.9%) | $103,874 |
| 3+ Earners | 4,148 (17.1%) | $136,168 |
| Total | 24,230 (100.0%) | $93,141 |
Household Income in Federal Way
Household Income Brackets in Federal Way
With 7,562 households falling in the category, the $100,000 to $149,999 income range is the most frequent in Federal Way, accounting for 20.8% of all households. In contrast, only 1,200 households (3.3%) fall into the $10,000 to $14,999 income bracket, making it the least populous group.
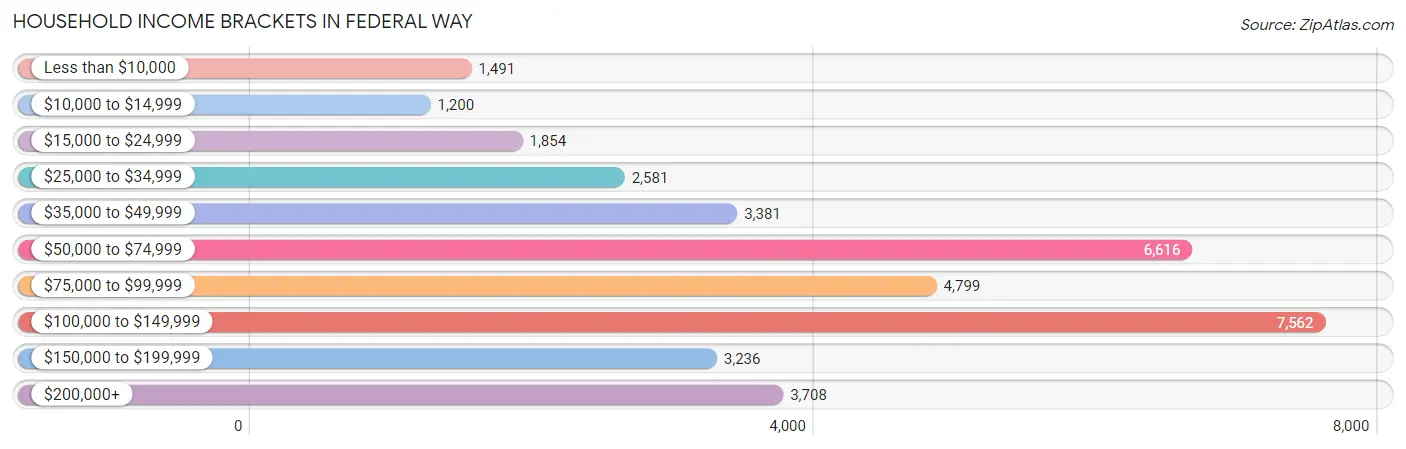
| Income Bracket | # Households | % Households |
| Less than $10,000 | 1,491 | 4.1% |
| $10,000 to $14,999 | 1,200 | 3.3% |
| $15,000 to $24,999 | 1,854 | 5.1% |
| $25,000 to $34,999 | 2,581 | 7.1% |
| $35,000 to $49,999 | 3,381 | 9.3% |
| $50,000 to $74,999 | 6,616 | 18.2% |
| $75,000 to $99,999 | 4,799 | 13.2% |
| $100,000 to $149,999 | 7,562 | 20.8% |
| $150,000 to $199,999 | 3,236 | 8.9% |
| $200,000+ | 3,708 | 10.2% |
Household Income by Householder Age in Federal Way
The median household income in Federal Way is $80,360, with the highest median household income of $96,815 found in the 45 to 64 years age bracket for the primary householder. A total of 14,151 households (38.9%) fall into this category. Meanwhile, the 15 to 24 years age bracket for the primary householder has the lowest median household income of $53,516, with 1,556 households (4.3%) in this group.
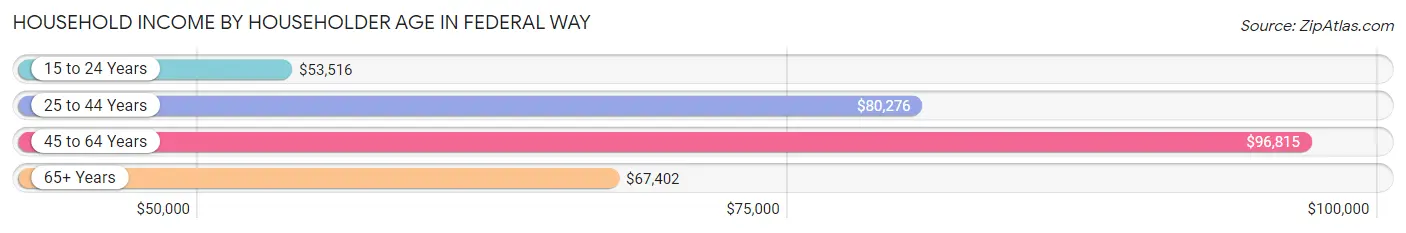
| Income Bracket | # Households | Median Income |
| 15 to 24 Years | 1,556 (4.3%) | $53,516 |
| 25 to 44 Years | 12,419 (34.2%) | $80,276 |
| 45 to 64 Years | 14,151 (38.9%) | $96,815 |
| 65+ Years | 8,228 (22.6%) | $67,402 |
| Total | 36,354 (100.0%) | $80,360 |
Poverty in Federal Way
Income Below Poverty by Sex and Age in Federal Way
With 10.0% poverty level for males and 13.6% for females among the residents of Federal Way, 5 year old males and 16 and 17 year old females are the most vulnerable to poverty, with 164 males (28.2%) and 352 females (23.7%) in their respective age groups living below the poverty level.
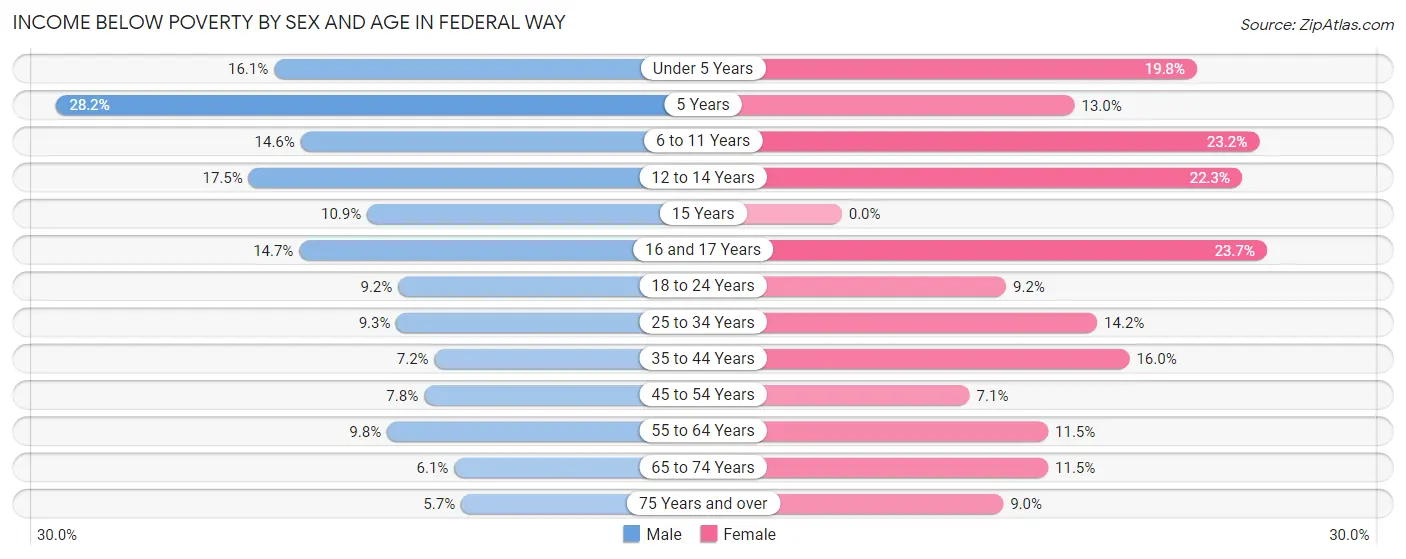
| Age Bracket | Male | Female |
| Under 5 Years | 620 (16.1%) | 585 (19.8%) |
| 5 Years | 164 (28.2%) | 95 (13.0%) |
| 6 to 11 Years | 465 (14.6%) | 792 (23.2%) |
| 12 to 14 Years | 362 (17.5%) | 442 (22.3%) |
| 15 Years | 53 (10.9%) | 0 (0.0%) |
| 16 and 17 Years | 207 (14.7%) | 352 (23.7%) |
| 18 to 24 Years | 416 (9.2%) | 399 (9.1%) |
| 25 to 34 Years | 755 (9.3%) | 934 (14.2%) |
| 35 to 44 Years | 516 (7.2%) | 957 (16.0%) |
| 45 to 54 Years | 456 (7.8%) | 415 (7.1%) |
| 55 to 64 Years | 649 (9.8%) | 856 (11.5%) |
| 65 to 74 Years | 241 (6.1%) | 510 (11.5%) |
| 75 Years and over | 133 (5.7%) | 260 (9.0%) |
| Total | 5,037 (10.0%) | 6,597 (13.6%) |
Income Above Poverty by Sex and Age in Federal Way
According to the poverty statistics in Federal Way, males aged 75 years and over and females aged 15 years are the age groups that are most secure financially, with 94.3% of males and 100.0% of females in these age groups living above the poverty line.
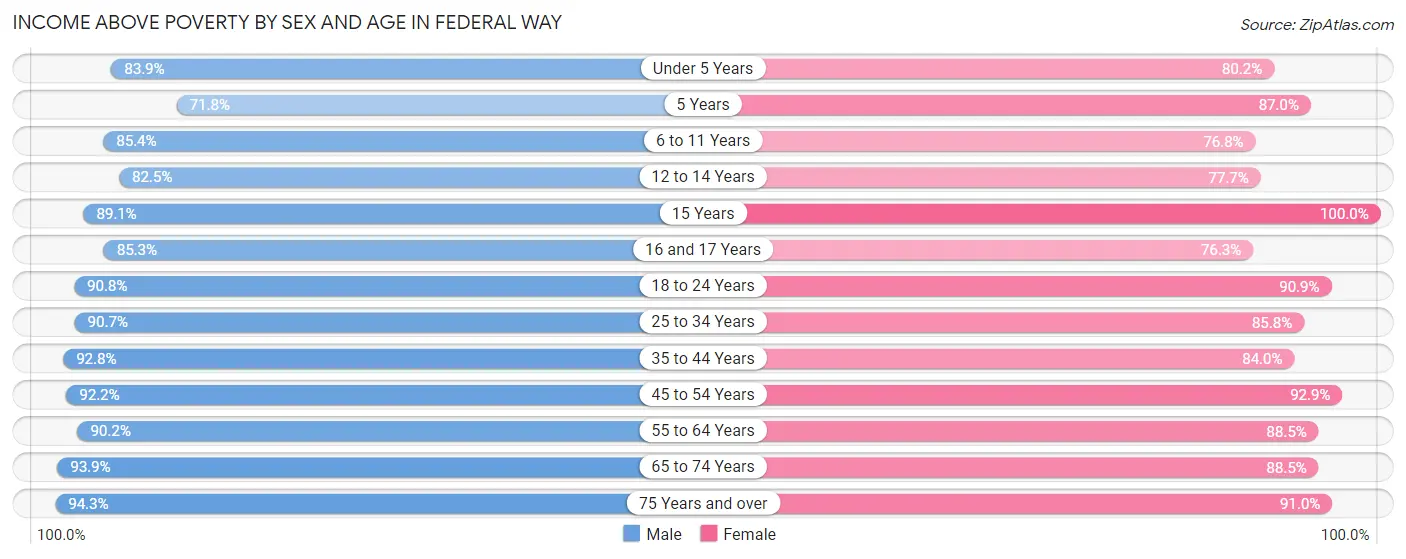
| Age Bracket | Male | Female |
| Under 5 Years | 3,229 (83.9%) | 2,374 (80.2%) |
| 5 Years | 417 (71.8%) | 638 (87.0%) |
| 6 to 11 Years | 2,713 (85.4%) | 2,618 (76.8%) |
| 12 to 14 Years | 1,703 (82.5%) | 1,543 (77.7%) |
| 15 Years | 432 (89.1%) | 553 (100.0%) |
| 16 and 17 Years | 1,200 (85.3%) | 1,136 (76.3%) |
| 18 to 24 Years | 4,104 (90.8%) | 3,962 (90.8%) |
| 25 to 34 Years | 7,361 (90.7%) | 5,632 (85.8%) |
| 35 to 44 Years | 6,667 (92.8%) | 5,016 (84.0%) |
| 45 to 54 Years | 5,424 (92.2%) | 5,412 (92.9%) |
| 55 to 64 Years | 5,959 (90.2%) | 6,597 (88.5%) |
| 65 to 74 Years | 3,721 (93.9%) | 3,929 (88.5%) |
| 75 Years and over | 2,200 (94.3%) | 2,633 (91.0%) |
| Total | 45,130 (90.0%) | 42,043 (86.4%) |
Income Below Poverty Among Married-Couple Families in Federal Way
The poverty statistics for married-couple families in Federal Way show that 5.6% or 957 of the total 17,255 families live below the poverty line. Families with 3 or 4 children have the highest poverty rate of 18.5%, comprising of 298 families. On the other hand, families with no children have the lowest poverty rate of 3.0%, which includes 289 families.
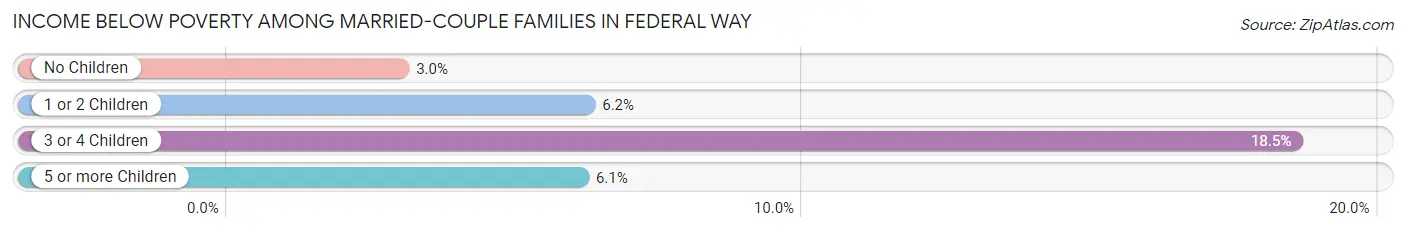
| Children | Above Poverty | Below Poverty |
| No Children | 9,407 (97.0%) | 289 (3.0%) |
| 1 or 2 Children | 5,413 (93.8%) | 359 (6.2%) |
| 3 or 4 Children | 1,309 (81.5%) | 298 (18.5%) |
| 5 or more Children | 169 (93.9%) | 11 (6.1%) |
| Total | 16,298 (94.5%) | 957 (5.6%) |
Income Below Poverty Among Single-Parent Households in Federal Way
According to the poverty data in Federal Way, 11.0% or 254 single-father households and 23.5% or 1,095 single-mother households are living below the poverty line. Among single-father households, those with 5 or more children have the highest poverty rate, with 18 households (100.0%) experiencing poverty. Likewise, among single-mother households, those with 3 or 4 children have the highest poverty rate, with 327 households (56.3%) falling below the poverty line.
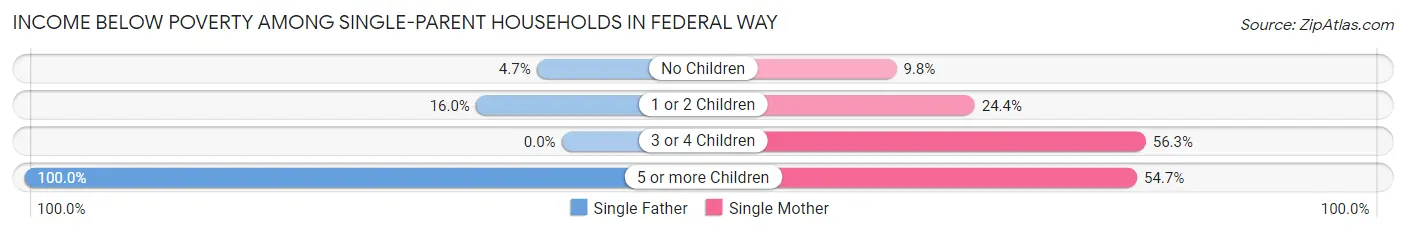
| Children | Single Father | Single Mother |
| No Children | 47 (4.6%) | 172 (9.8%) |
| 1 or 2 Children | 189 (16.0%) | 549 (24.4%) |
| 3 or 4 Children | 0 (0.0%) | 327 (56.3%) |
| 5 or more Children | 18 (100.0%) | 47 (54.6%) |
| Total | 254 (11.0%) | 1,095 (23.5%) |
Income Below Poverty Among Married-Couple vs Single-Parent Households in Federal Way
The poverty data for Federal Way shows that 957 of the married-couple family households (5.6%) and 1,349 of the single-parent households (19.3%) are living below the poverty level. Within the married-couple family households, those with 3 or 4 children have the highest poverty rate, with 298 households (18.5%) falling below the poverty line. Among the single-parent households, those with 5 or more children have the highest poverty rate, with 65 household (62.5%) living below poverty.
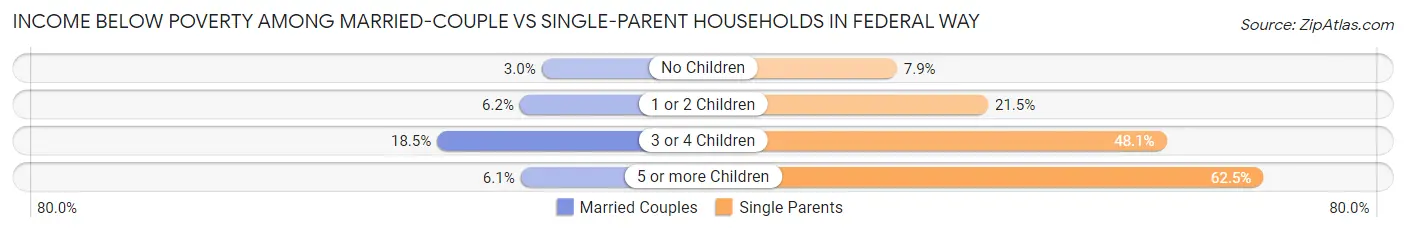
| Children | Married-Couple Families | Single-Parent Households |
| No Children | 289 (3.0%) | 219 (7.9%) |
| 1 or 2 Children | 359 (6.2%) | 738 (21.5%) |
| 3 or 4 Children | 298 (18.5%) | 327 (48.1%) |
| 5 or more Children | 11 (6.1%) | 65 (62.5%) |
| Total | 957 (5.6%) | 1,349 (19.3%) |
Race in Federal Way
The most populous races in Federal Way are White / Caucasian (42,024 | 42.2%), Hispanic or Latino (18,321 | 18.4%), and Black / African American (16,351 | 16.4%).
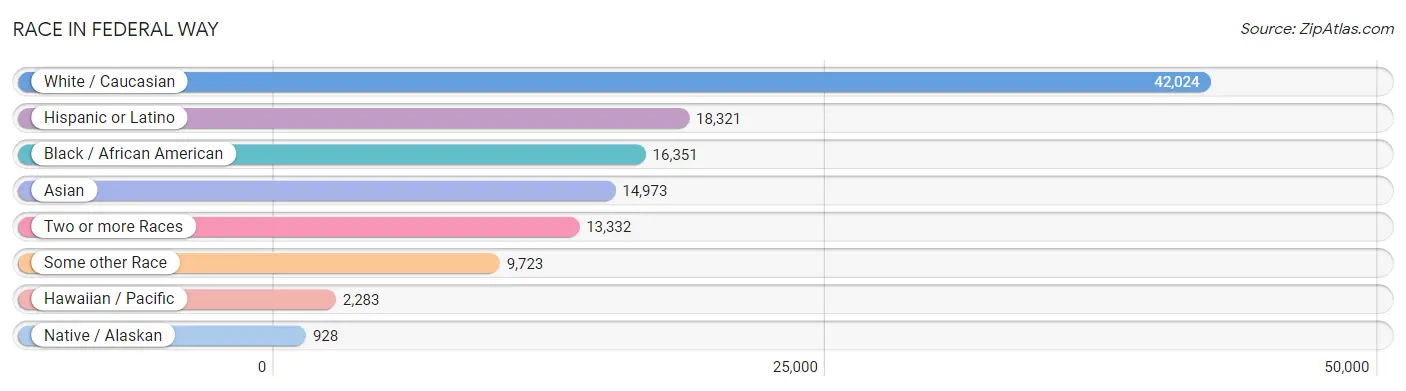
| Race | # Population | % Population |
| Asian | 14,973 | 15.0% |
| Black / African American | 16,351 | 16.4% |
| Hawaiian / Pacific | 2,283 | 2.3% |
| Hispanic or Latino | 18,321 | 18.4% |
| Native / Alaskan | 928 | 0.9% |
| White / Caucasian | 42,024 | 42.2% |
| Two or more Races | 13,332 | 13.4% |
| Some other Race | 9,723 | 9.8% |
| Total | 99,614 | 100.0% |
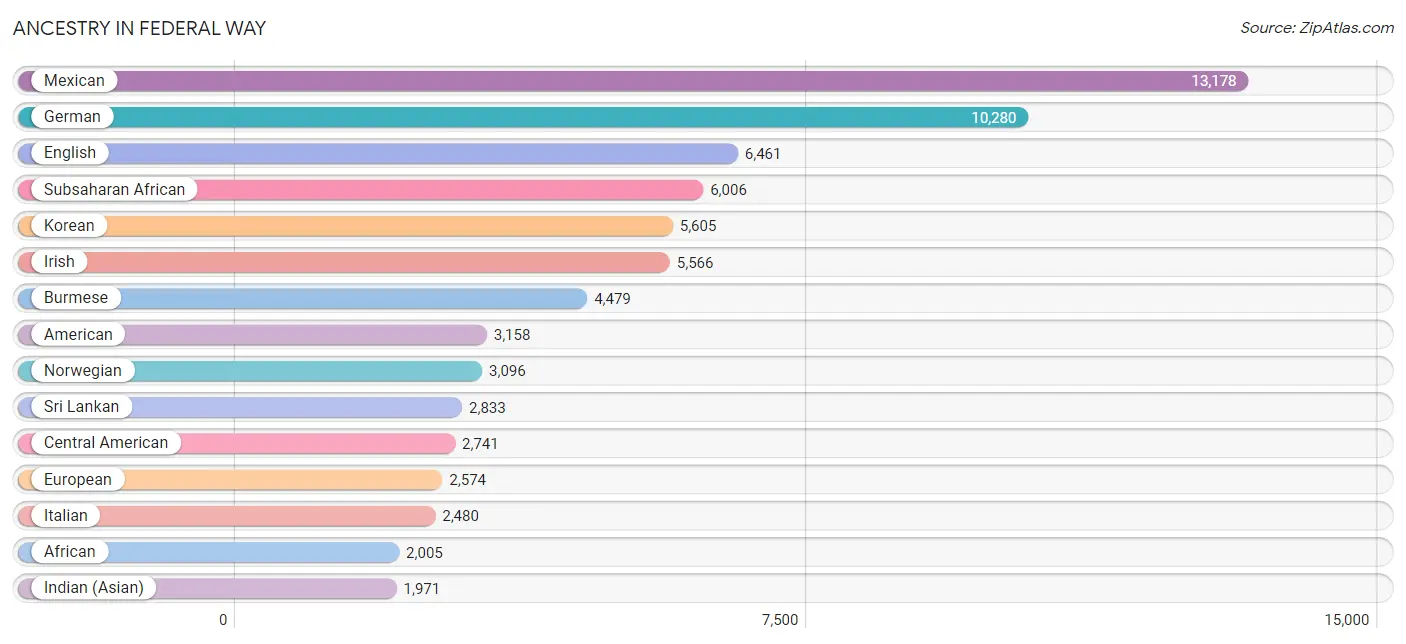
Ancestry in Federal Way
The most populous ancestries reported in Federal Way are Mexican (13,178 | 13.2%), German (10,280 | 10.3%), English (6,461 | 6.5%), Subsaharan African (6,006 | 6.0%), and Korean (5,605 | 5.6%), together accounting for 41.7% of all Federal Way residents.
| Ancestry | # Population | % Population |
| Afghan | 390 | 0.4% |
| African | 2,005 | 2.0% |
| Alaskan Athabascan | 7 | 0.0% |
| Aleut | 15 | 0.0% |
| American | 3,158 | 3.2% |
| Apache | 28 | 0.0% |
| Arab | 131 | 0.1% |
| Argentinean | 63 | 0.1% |
| Armenian | 255 | 0.3% |
| Assyrian / Chaldean / Syriac | 34 | 0.0% |
| Australian | 16 | 0.0% |
| Austrian | 172 | 0.2% |
| Bangladeshi | 100 | 0.1% |
| Barbadian | 45 | 0.1% |
| Basque | 32 | 0.0% |
| Belgian | 75 | 0.1% |
| Belizean | 10 | 0.0% |
| Bhutanese | 1,003 | 1.0% |
| Blackfeet | 36 | 0.0% |
| Bolivian | 31 | 0.0% |
| Brazilian | 116 | 0.1% |
| British | 621 | 0.6% |
| Bulgarian | 23 | 0.0% |
| Burmese | 4,479 | 4.5% |
| Cambodian | 214 | 0.2% |
| Canadian | 239 | 0.2% |
| Celtic | 37 | 0.0% |
| Central American | 2,741 | 2.8% |
| Central American Indian | 123 | 0.1% |
| Cherokee | 403 | 0.4% |
| Chickasaw | 37 | 0.0% |
| Chilean | 127 | 0.1% |
| Chinese | 14 | 0.0% |
| Chippewa | 155 | 0.2% |
| Choctaw | 157 | 0.2% |
| Colombian | 181 | 0.2% |
| Colville | 47 | 0.1% |
| Costa Rican | 50 | 0.1% |
| Creek | 19 | 0.0% |
| Croatian | 307 | 0.3% |
| Cuban | 56 | 0.1% |
| Czech | 95 | 0.1% |
| Czechoslovakian | 88 | 0.1% |
| Danish | 553 | 0.6% |
| Dominican | 148 | 0.2% |
| Dutch | 853 | 0.9% |
| Eastern European | 172 | 0.2% |
| Ecuadorian | 8 | 0.0% |
| English | 6,461 | 6.5% |
| Ethiopian | 459 | 0.5% |
| European | 2,574 | 2.6% |
| Fijian | 281 | 0.3% |
| Filipino | 110 | 0.1% |
| Finnish | 324 | 0.3% |
| French | 1,770 | 1.8% |
| French American Indian | 21 | 0.0% |
| French Canadian | 324 | 0.3% |
| German | 10,280 | 10.3% |
| German Russian | 8 | 0.0% |
| Ghanaian | 164 | 0.2% |
| Greek | 246 | 0.3% |
| Guamanian / Chamorro | 323 | 0.3% |
| Guatemalan | 752 | 0.7% |
| Guyanese | 48 | 0.1% |
| Haitian | 305 | 0.3% |
| Honduran | 746 | 0.7% |
| Hungarian | 262 | 0.3% |
| Icelander | 26 | 0.0% |
| Indian (Asian) | 1,971 | 2.0% |
| Indonesian | 36 | 0.0% |
| Iranian | 74 | 0.1% |
| Irish | 5,566 | 5.6% |
| Iroquois | 6 | 0.0% |
| Israeli | 13 | 0.0% |
| Italian | 2,480 | 2.5% |
| Jamaican | 136 | 0.1% |
| Japanese | 370 | 0.4% |
| Kenyan | 1,567 | 1.6% |
| Korean | 5,605 | 5.6% |
| Laotian | 44 | 0.0% |
| Latvian | 18 | 0.0% |
| Lebanese | 109 | 0.1% |
| Liberian | 169 | 0.2% |
| Lithuanian | 111 | 0.1% |
| Malaysian | 268 | 0.3% |
| Maltese | 18 | 0.0% |
| Mexican | 13,178 | 13.2% |
| Mexican American Indian | 188 | 0.2% |
| Native Hawaiian | 497 | 0.5% |
| Navajo | 48 | 0.1% |
| Nicaraguan | 56 | 0.1% |
| Nigerian | 484 | 0.5% |
| Northern European | 206 | 0.2% |
| Norwegian | 3,096 | 3.1% |
| Pakistani | 239 | 0.2% |
| Panamanian | 130 | 0.1% |
| Pennsylvania German | 20 | 0.0% |
| Peruvian | 126 | 0.1% |
| Polish | 1,207 | 1.2% |
| Portuguese | 237 | 0.2% |
| Puerto Rican | 636 | 0.6% |
| Puget Sound Salish | 284 | 0.3% |
| Romanian | 287 | 0.3% |
| Russian | 1,152 | 1.2% |
| Salvadoran | 1,007 | 1.0% |
| Samoan | 1,345 | 1.3% |
| Scandinavian | 411 | 0.4% |
| Scotch-Irish | 370 | 0.4% |
| Scottish | 1,058 | 1.1% |
| Seminole | 33 | 0.0% |
| Serbian | 92 | 0.1% |
| Sioux | 321 | 0.3% |
| Slavic | 300 | 0.3% |
| Slovak | 44 | 0.0% |
| Slovene | 14 | 0.0% |
| Somali | 230 | 0.2% |
| South African | 12 | 0.0% |
| South American | 891 | 0.9% |
| Spaniard | 179 | 0.2% |
| Spanish | 162 | 0.2% |
| Spanish American | 15 | 0.0% |
| Sri Lankan | 2,833 | 2.8% |
| Subsaharan African | 6,006 | 6.0% |
| Swedish | 1,689 | 1.7% |
| Swiss | 299 | 0.3% |
| Syrian | 22 | 0.0% |
| Thai | 577 | 0.6% |
| Tlingit-Haida | 219 | 0.2% |
| Tongan | 178 | 0.2% |
| Tsimshian | 16 | 0.0% |
| Turkish | 831 | 0.8% |
| Ugandan | 106 | 0.1% |
| Ukrainian | 1,738 | 1.7% |
| Venezuelan | 355 | 0.4% |
| Welsh | 410 | 0.4% |
| West Indian | 18 | 0.0% |
| Yugoslavian | 87 | 0.1% |
| Zimbabwean | 4 | 0.0% | View All 138 Rows |
Immigrants in Federal Way
The most numerous immigrant groups reported in Federal Way came from Asia (11,390 | 11.4%), Latin America (7,808 | 7.8%), Central America (6,380 | 6.4%), South Eastern Asia (4,916 | 4.9%), and Mexico (4,547 | 4.6%), together accounting for 35.2% of all Federal Way residents.
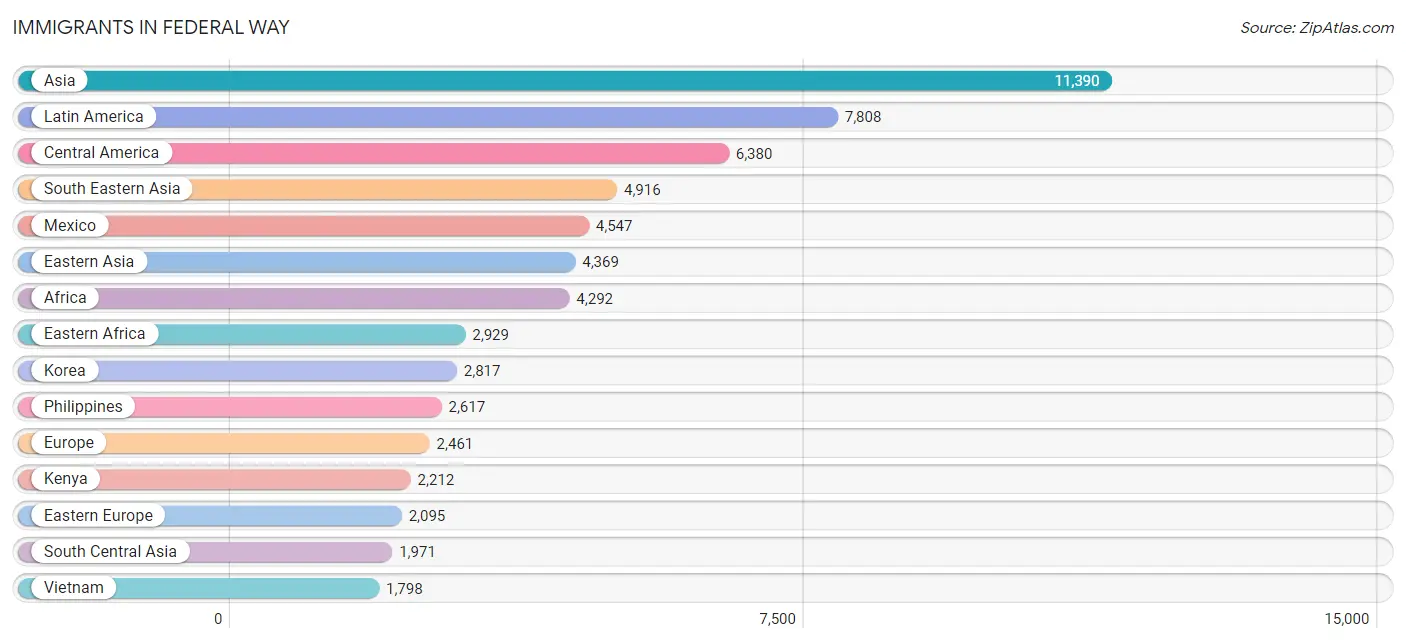
| Immigration Origin | # Population | % Population |
| Afghanistan | 711 | 0.7% |
| Africa | 4,292 | 4.3% |
| Argentina | 10 | 0.0% |
| Armenia | 44 | 0.0% |
| Asia | 11,390 | 11.4% |
| Australia | 30 | 0.0% |
| Austria | 16 | 0.0% |
| Belarus | 91 | 0.1% |
| Belgium | 37 | 0.0% |
| Belize | 14 | 0.0% |
| Bolivia | 30 | 0.0% |
| Bosnia and Herzegovina | 42 | 0.0% |
| Brazil | 196 | 0.2% |
| Cambodia | 160 | 0.2% |
| Canada | 354 | 0.4% |
| Caribbean | 551 | 0.5% |
| Central America | 6,380 | 6.4% |
| Chile | 83 | 0.1% |
| China | 1,300 | 1.3% |
| Colombia | 84 | 0.1% |
| Congo | 90 | 0.1% |
| Costa Rica | 106 | 0.1% |
| Cuba | 17 | 0.0% |
| Czechoslovakia | 6 | 0.0% |
| Denmark | 24 | 0.0% |
| Dominican Republic | 73 | 0.1% |
| Eastern Africa | 2,929 | 2.9% |
| Eastern Asia | 4,369 | 4.4% |
| Eastern Europe | 2,095 | 2.1% |
| Ecuador | 67 | 0.1% |
| El Salvador | 574 | 0.6% |
| England | 34 | 0.0% |
| Ethiopia | 460 | 0.5% |
| Europe | 2,461 | 2.5% |
| Fiji | 25 | 0.0% |
| Germany | 94 | 0.1% |
| Ghana | 220 | 0.2% |
| Guatemala | 470 | 0.5% |
| Guyana | 48 | 0.1% |
| Haiti | 398 | 0.4% |
| Honduras | 538 | 0.5% |
| Hong Kong | 331 | 0.3% |
| India | 389 | 0.4% |
| Indonesia | 68 | 0.1% |
| Iran | 56 | 0.1% |
| Ireland | 15 | 0.0% |
| Italy | 22 | 0.0% |
| Jamaica | 63 | 0.1% |
| Japan | 204 | 0.2% |
| Kazakhstan | 162 | 0.2% |
| Kenya | 2,212 | 2.2% |
| Korea | 2,817 | 2.8% |
| Laos | 96 | 0.1% |
| Latin America | 7,808 | 7.8% |
| Latvia | 39 | 0.0% |
| Liberia | 269 | 0.3% |
| Malaysia | 13 | 0.0% |
| Mexico | 4,547 | 4.6% |
| Micronesia | 431 | 0.4% |
| Middle Africa | 444 | 0.4% |
| Moldova | 272 | 0.3% |
| Morocco | 23 | 0.0% |
| Nicaragua | 66 | 0.1% |
| Nigeria | 234 | 0.2% |
| Northern Africa | 23 | 0.0% |
| Northern Europe | 179 | 0.2% |
| Oceania | 1,258 | 1.3% |
| Pakistan | 189 | 0.2% |
| Panama | 65 | 0.1% |
| Peru | 111 | 0.1% |
| Philippines | 2,617 | 2.6% |
| Poland | 84 | 0.1% |
| Romania | 27 | 0.0% |
| Russia | 537 | 0.5% |
| Saudi Arabia | 26 | 0.0% |
| Scotland | 21 | 0.0% |
| Serbia | 14 | 0.0% |
| Somalia | 146 | 0.2% |
| South Africa | 13 | 0.0% |
| South America | 877 | 0.9% |
| South Central Asia | 1,971 | 2.0% |
| South Eastern Asia | 4,916 | 4.9% |
| Southern Europe | 22 | 0.0% |
| Switzerland | 18 | 0.0% |
| Taiwan | 110 | 0.1% |
| Thailand | 128 | 0.1% |
| Turkey | 35 | 0.0% |
| Uganda | 94 | 0.1% |
| Ukraine | 966 | 1.0% |
| Uzbekistan | 464 | 0.5% |
| Venezuela | 228 | 0.2% |
| Vietnam | 1,798 | 1.8% |
| Western Africa | 796 | 0.8% |
| Western Asia | 134 | 0.1% |
| Western Europe | 165 | 0.2% |
| Zaire | 334 | 0.3% | View All 96 Rows |
Sex and Age in Federal Way
Sex and Age in Federal Way
The most populous age groups in Federal Way are 30 to 34 Years (4,445 | 8.8%) for men and 60 to 64 Years (3,906 | 8.0%) for women.
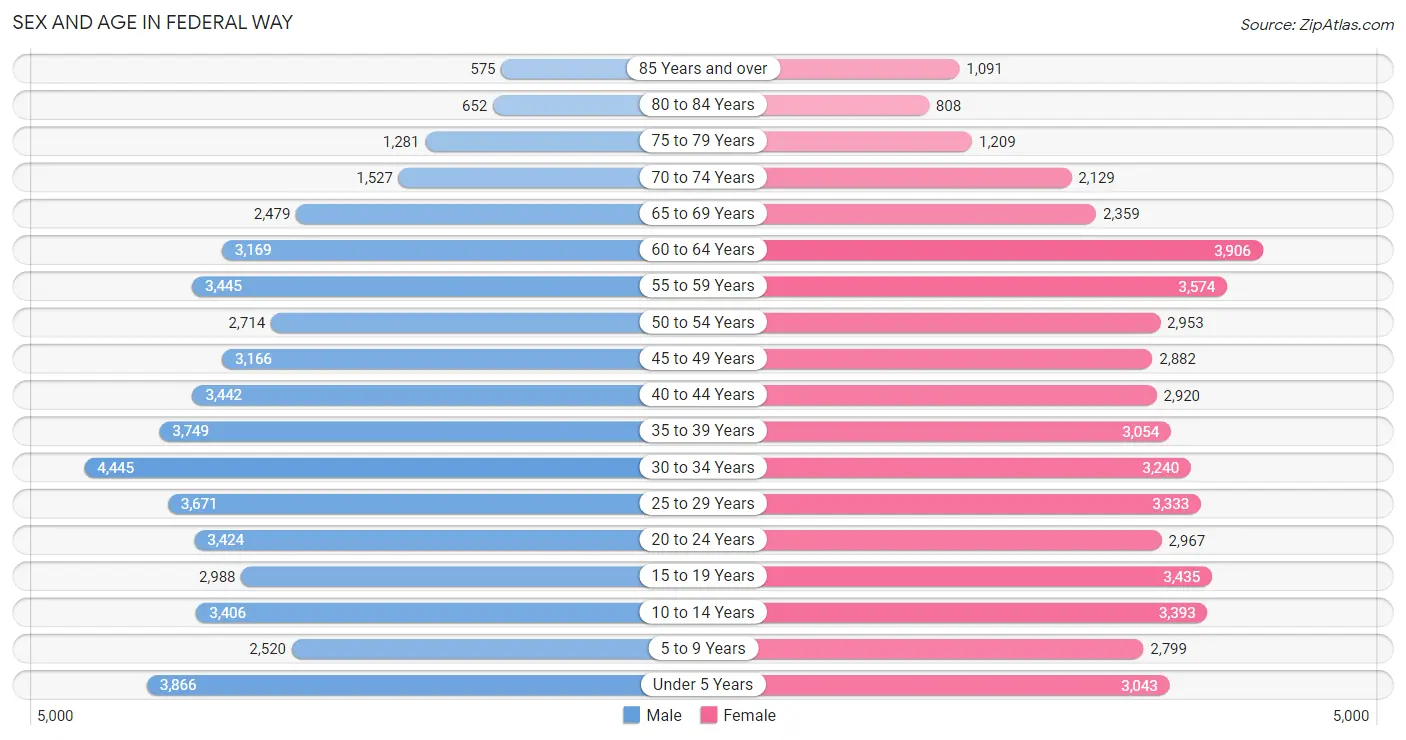
| Age Bracket | Male | Female |
| Under 5 Years | 3,866 (7.6%) | 3,043 (6.2%) |
| 5 to 9 Years | 2,520 (5.0%) | 2,799 (5.7%) |
| 10 to 14 Years | 3,406 (6.7%) | 3,393 (6.9%) |
| 15 to 19 Years | 2,988 (5.9%) | 3,435 (7.0%) |
| 20 to 24 Years | 3,424 (6.8%) | 2,967 (6.0%) |
| 25 to 29 Years | 3,671 (7.3%) | 3,333 (6.8%) |
| 30 to 34 Years | 4,445 (8.8%) | 3,240 (6.6%) |
| 35 to 39 Years | 3,749 (7.4%) | 3,054 (6.2%) |
| 40 to 44 Years | 3,442 (6.8%) | 2,920 (5.9%) |
| 45 to 49 Years | 3,166 (6.3%) | 2,882 (5.9%) |
| 50 to 54 Years | 2,714 (5.4%) | 2,953 (6.0%) |
| 55 to 59 Years | 3,445 (6.8%) | 3,574 (7.3%) |
| 60 to 64 Years | 3,169 (6.3%) | 3,906 (8.0%) |
| 65 to 69 Years | 2,479 (4.9%) | 2,359 (4.8%) |
| 70 to 74 Years | 1,527 (3.0%) | 2,129 (4.3%) |
| 75 to 79 Years | 1,281 (2.5%) | 1,209 (2.5%) |
| 80 to 84 Years | 652 (1.3%) | 808 (1.7%) |
| 85 Years and over | 575 (1.1%) | 1,091 (2.2%) |
| Total | 50,519 (100.0%) | 49,095 (100.0%) |
Families and Households in Federal Way
Median Family Size in Federal Way
The median family size in Federal Way is 3.29 persons per family, with single female/mother families (4,665 | 19.3%) accounting for the largest median family size of 3.36 persons per family. On the other hand, single male/father families (2,310 | 9.5%) represent the smallest median family size with 2.89 persons per family.
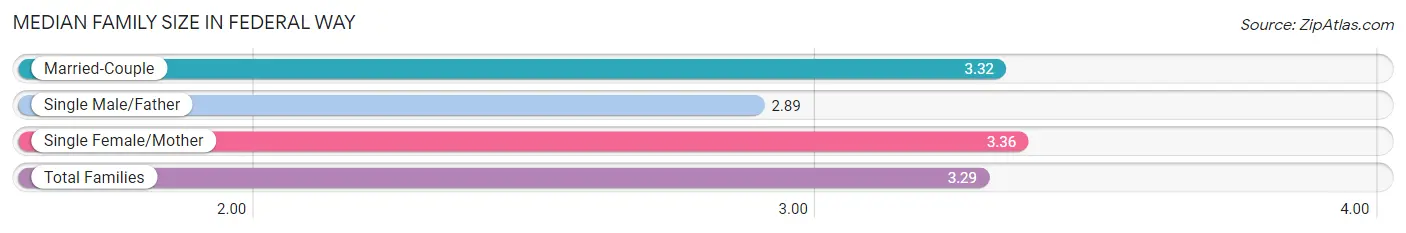
| Family Type | # Families | Family Size |
| Married-Couple | 17,255 (71.2%) | 3.32 |
| Single Male/Father | 2,310 (9.5%) | 2.89 |
| Single Female/Mother | 4,665 (19.3%) | 3.36 |
| Total Families | 24,230 (100.0%) | 3.29 |
Median Household Size in Federal Way
The median household size in Federal Way is 2.71 persons per household, with single female/mother households (4,665 | 12.8%) accounting for the largest median household size of 3.65 persons per household. non-family households (12,124 | 33.4%) represent the smallest median household size with 1.32 persons per household.
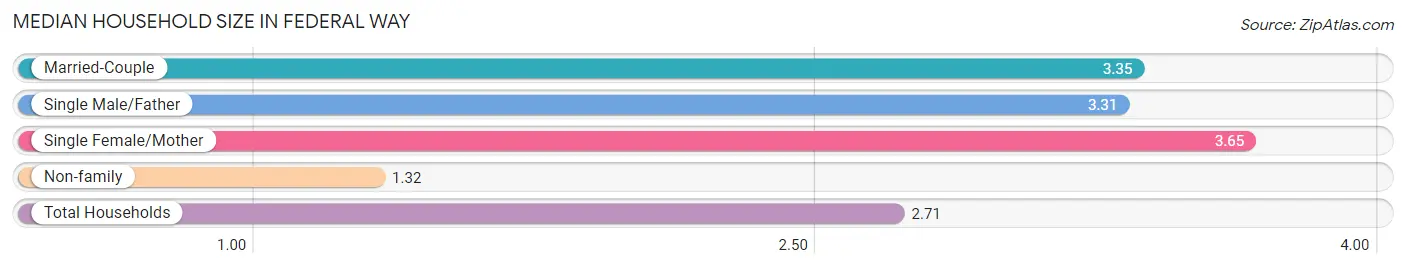
| Household Type | # Households | Household Size |
| Married-Couple | 17,255 (47.5%) | 3.35 |
| Single Male/Father | 2,310 (6.4%) | 3.31 |
| Single Female/Mother | 4,665 (12.8%) | 3.65 |
| Non-family | 12,124 (33.4%) | 1.32 |
| Total Households | 36,354 (100.0%) | 2.71 |
Household Size by Marriage Status in Federal Way
Out of a total of 36,354 households in Federal Way, 24,230 (66.6%) are family households, while 12,124 (33.4%) are nonfamily households. The most numerous type of family households are 2-person households, comprising 8,916, and the most common type of nonfamily households are 1-person households, comprising 9,525.
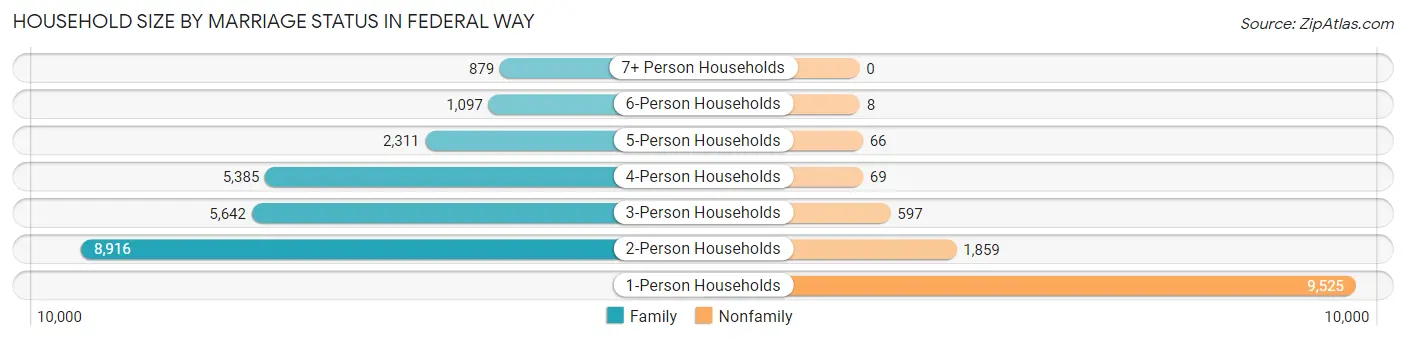
| Household Size | Family Households | Nonfamily Households |
| 1-Person Households | - | 9,525 (26.2%) |
| 2-Person Households | 8,916 (24.5%) | 1,859 (5.1%) |
| 3-Person Households | 5,642 (15.5%) | 597 (1.6%) |
| 4-Person Households | 5,385 (14.8%) | 69 (0.2%) |
| 5-Person Households | 2,311 (6.4%) | 66 (0.2%) |
| 6-Person Households | 1,097 (3.0%) | 8 (0.0%) |
| 7+ Person Households | 879 (2.4%) | 0 (0.0%) |
| Total | 24,230 (66.6%) | 12,124 (33.4%) |
Female Fertility in Federal Way
Fertility by Age in Federal Way
Average fertility rate in Federal Way is 58.0 births per 1,000 women. Women in the age bracket of 20 to 34 years have the highest fertility rate with 111.0 births per 1,000 women. Women in the age bracket of 20 to 34 years acount for 80.7% of all women with births.
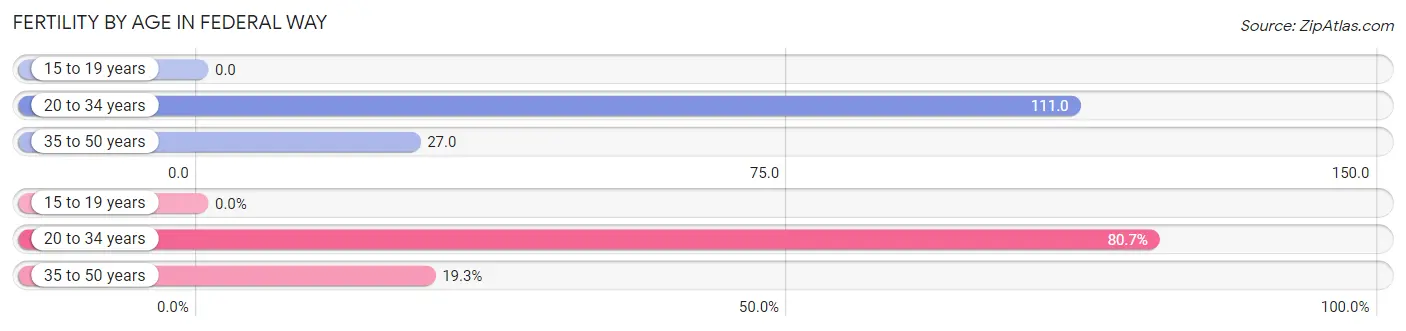
| Age Bracket | Women with Births | Births / 1,000 Women |
| 15 to 19 years | 0 (0.0%) | 0.0 |
| 20 to 34 years | 1,056 (80.7%) | 111.0 |
| 35 to 50 years | 252 (19.3%) | 27.0 |
| Total | 1,308 (100.0%) | 58.0 |
Fertility by Age by Marriage Status in Federal Way
69.5% of women with births (1,308) in Federal Way are married. The highest percentage of unmarried women with births falls into 20 to 34 years age bracket with 35.0% of them unmarried at the time of birth, while the lowest percentage of unmarried women with births belong to 35 to 50 years age bracket with 11.5% of them unmarried.
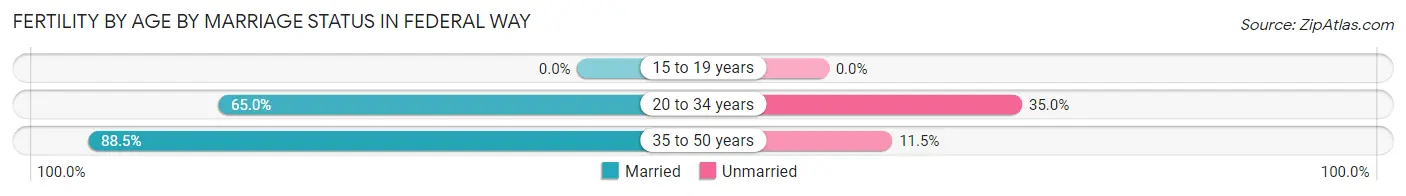
| Age Bracket | Married | Unmarried |
| 15 to 19 years | 0 (0.0%) | 0 (0.0%) |
| 20 to 34 years | 686 (65.0%) | 370 (35.0%) |
| 35 to 50 years | 223 (88.5%) | 29 (11.5%) |
| Total | 909 (69.5%) | 399 (30.5%) |
Fertility by Education in Federal Way
Average fertility rate in Federal Way is 58.0 births per 1,000 women. Women with the education attainment of bachelor's degree have the highest fertility rate of 97.0 births per 1,000 women, while women with the education attainment of less than high school have the lowest fertility at 31.0 births per 1,000 women. Women with the education attainment of bachelor's degree represent 29.9% of all women with births.
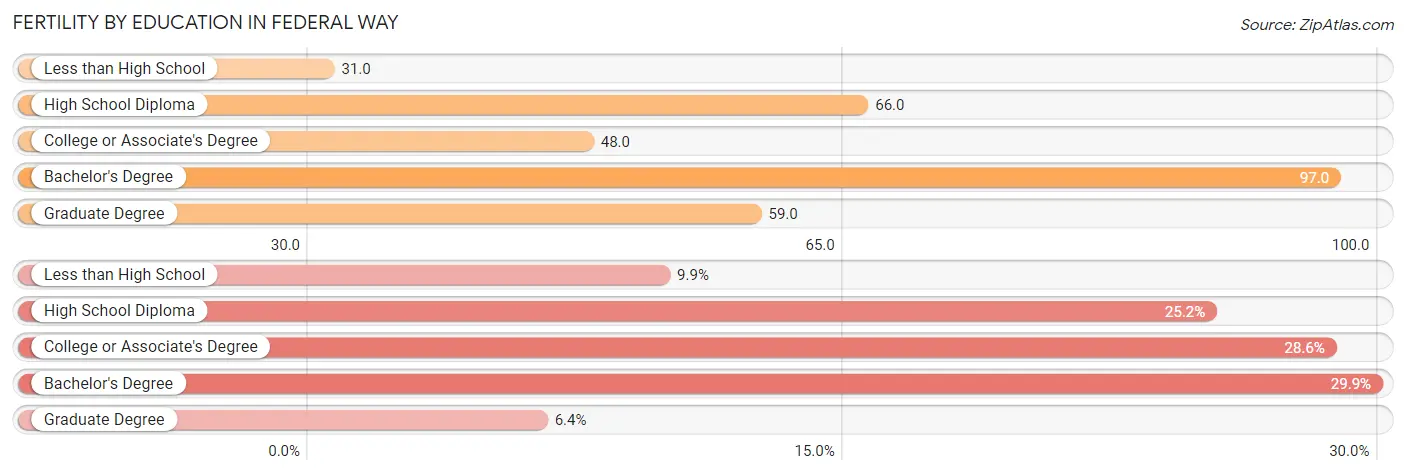
| Educational Attainment | Women with Births | Births / 1,000 Women |
| Less than High School | 129 (9.9%) | 31.0 |
| High School Diploma | 330 (25.2%) | 66.0 |
| College or Associate's Degree | 374 (28.6%) | 48.0 |
| Bachelor's Degree | 391 (29.9%) | 97.0 |
| Graduate Degree | 84 (6.4%) | 59.0 |
| Total | 1,308 (100.0%) | 58.0 |
Fertility by Education by Marriage Status in Federal Way
30.5% of women with births in Federal Way are unmarried. Women with the educational attainment of graduate degree are most likely to be married with 100.0% of them married at childbirth, while women with the educational attainment of less than high school are least likely to be married with 56.6% of them unmarried at childbirth.
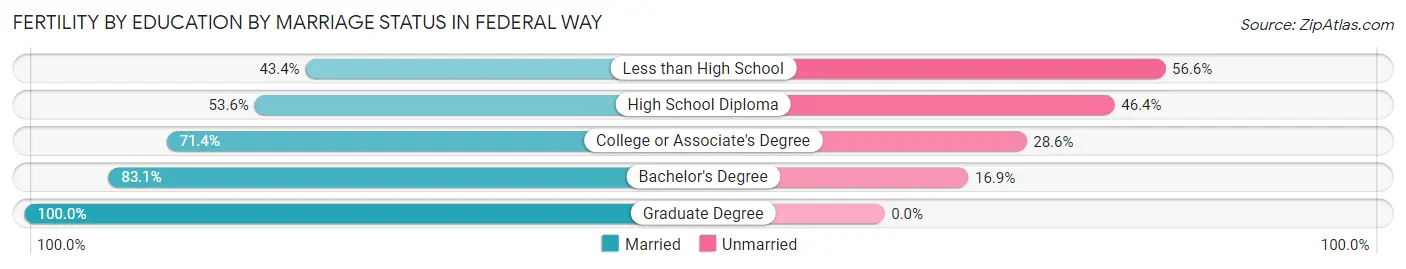
| Educational Attainment | Married | Unmarried |
| Less than High School | 56 (43.4%) | 73 (56.6%) |
| High School Diploma | 177 (53.6%) | 153 (46.4%) |
| College or Associate's Degree | 267 (71.4%) | 107 (28.6%) |
| Bachelor's Degree | 325 (83.1%) | 66 (16.9%) |
| Graduate Degree | 84 (100.0%) | 0 (0.0%) |
| Total | 909 (69.5%) | 399 (30.5%) |
Employment Characteristics in Federal Way
Employment by Class of Employer in Federal Way
Among the 47,884 employed individuals in Federal Way, private company employees (34,015 | 71.0%), not-for-profit organizations (3,688 | 7.7%), and local government employees (3,214 | 6.7%) make up the most common classes of employment.
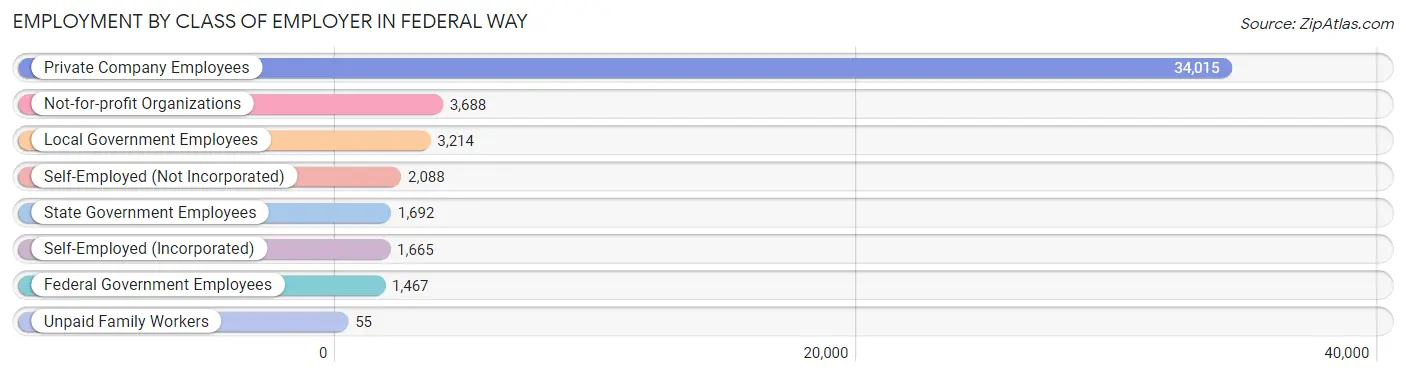
| Employer Class | # Employees | % Employees |
| Private Company Employees | 34,015 | 71.0% |
| Self-Employed (Incorporated) | 1,665 | 3.5% |
| Self-Employed (Not Incorporated) | 2,088 | 4.4% |
| Not-for-profit Organizations | 3,688 | 7.7% |
| Local Government Employees | 3,214 | 6.7% |
| State Government Employees | 1,692 | 3.5% |
| Federal Government Employees | 1,467 | 3.1% |
| Unpaid Family Workers | 55 | 0.1% |
| Total | 47,884 | 100.0% |
Employment Status by Age in Federal Way
According to the labor force statistics for Federal Way, out of the total population over 16 years of age (79,549), 65.7% or 52,264 individuals are in the labor force, with 5.5% or 2,875 of them unemployed. The age group with the highest labor force participation rate is 30 to 34 years, with 84.0% or 6,455 individuals in the labor force. Within the labor force, the 16 to 19 years age range has the highest percentage of unemployed individuals, with 12.5% or 257 of them being unemployed.
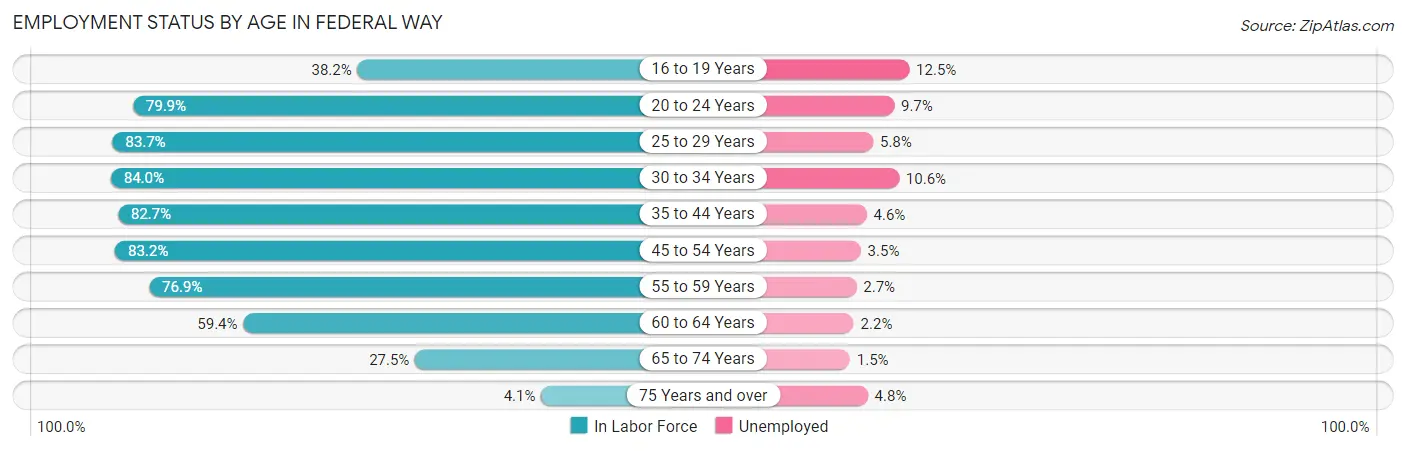
| Age Bracket | In Labor Force | Unemployed |
| 16 to 19 Years | 2,057 (38.2%) | 257 (12.5%) |
| 20 to 24 Years | 5,106 (79.9%) | 495 (9.7%) |
| 25 to 29 Years | 5,862 (83.7%) | 340 (5.8%) |
| 30 to 34 Years | 6,455 (84.0%) | 684 (10.6%) |
| 35 to 44 Years | 10,887 (82.7%) | 501 (4.6%) |
| 45 to 54 Years | 9,747 (83.2%) | 341 (3.5%) |
| 55 to 59 Years | 5,398 (76.9%) | 146 (2.7%) |
| 60 to 64 Years | 4,203 (59.4%) | 92 (2.2%) |
| 65 to 74 Years | 2,336 (27.5%) | 35 (1.5%) |
| 75 Years and over | 230 (4.1%) | 11 (4.8%) |
| Total | 52,264 (65.7%) | 2,875 (5.5%) |
Employment Status by Educational Attainment in Federal Way
According to labor force statistics for Federal Way, 79.3% of individuals (42,555) out of the total population between 25 and 64 years of age (53,663) are in the labor force, with 4.9% or 2,085 of them being unemployed. The group with the highest labor force participation rate are those with the educational attainment of bachelor's degree or higher, with 86.0% or 13,500 individuals in the labor force. Within the labor force, individuals with high school diploma education have the highest percentage of unemployment, with 6.1% or 689 of them being unemployed.
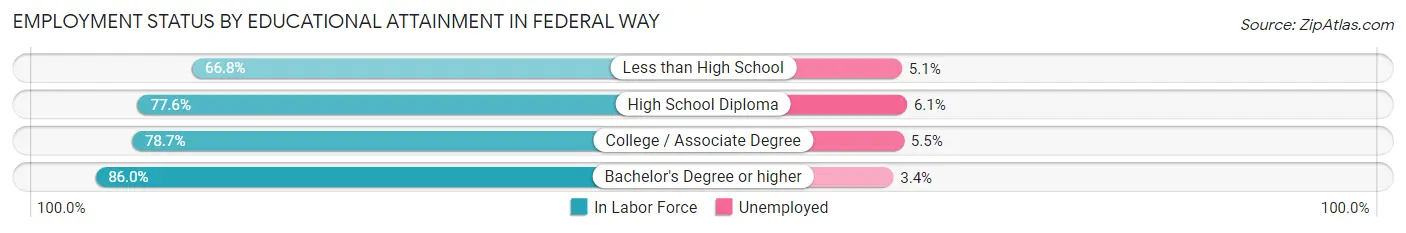
| Educational Attainment | In Labor Force | Unemployed |
| Less than High School | 3,675 (66.8%) | 281 (5.1%) |
| High School Diploma | 11,302 (77.6%) | 888 (6.1%) |
| College / Associate Degree | 14,086 (78.7%) | 984 (5.5%) |
| Bachelor's Degree or higher | 13,500 (86.0%) | 534 (3.4%) |
| Total | 42,555 (79.3%) | 2,629 (4.9%) |
Employment Occupations by Sex in Federal Way
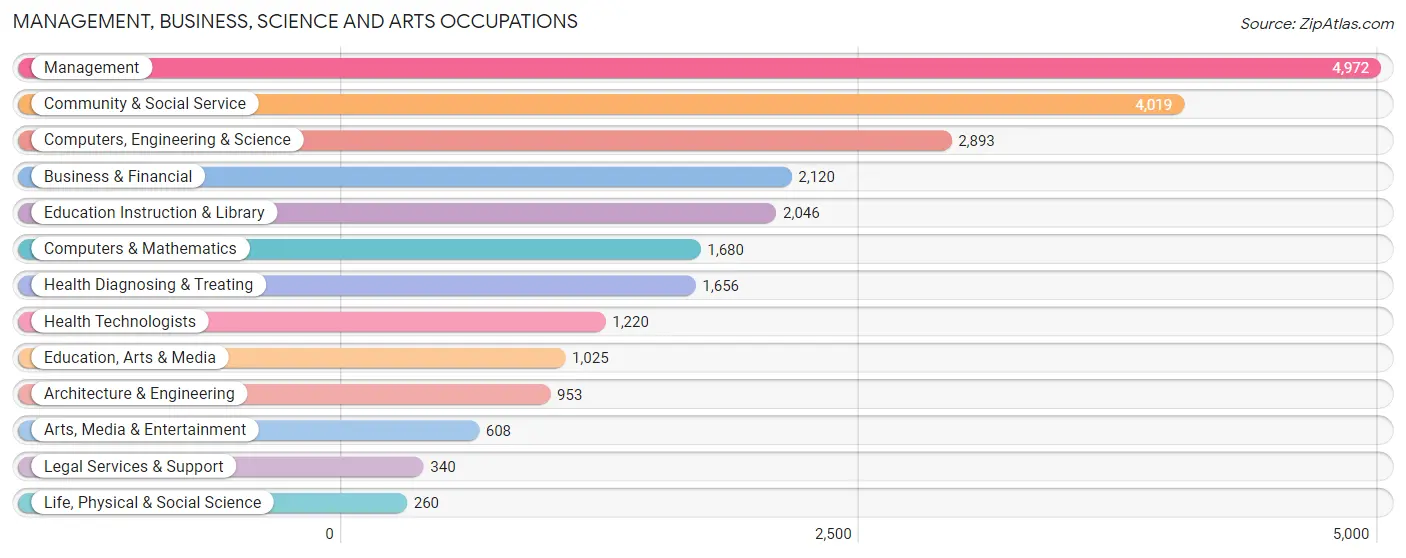
Management, Business, Science and Arts Occupations
The most common Management, Business, Science and Arts occupations in Federal Way are Management (4,972 | 10.1%), Community & Social Service (4,019 | 8.2%), Computers, Engineering & Science (2,893 | 5.9%), Business & Financial (2,120 | 4.3%), and Education Instruction & Library (2,046 | 4.2%).
Management, Business, Science and Arts Occupations by Sex
Within the Management, Business, Science and Arts occupations in Federal Way, the most male-oriented occupations are Architecture & Engineering (92.8%), Computers, Engineering & Science (81.3%), and Computers & Mathematics (80.2%), while the most female-oriented occupations are Education Instruction & Library (74.5%), Health Diagnosing & Treating (71.4%), and Education, Arts & Media (70.3%).
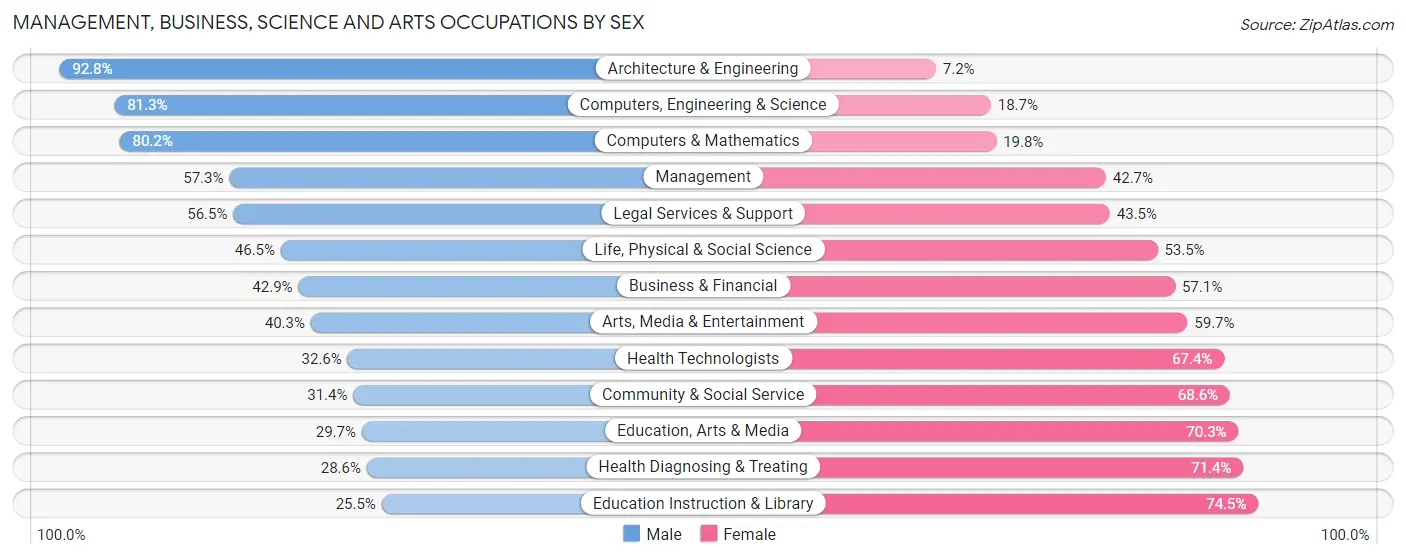
| Occupation | Male | Female |
| Management | 2,849 (57.3%) | 2,123 (42.7%) |
| Business & Financial | 909 (42.9%) | 1,211 (57.1%) |
| Computers, Engineering & Science | 2,352 (81.3%) | 541 (18.7%) |
| Computers & Mathematics | 1,347 (80.2%) | 333 (19.8%) |
| Architecture & Engineering | 884 (92.8%) | 69 (7.2%) |
| Life, Physical & Social Science | 121 (46.5%) | 139 (53.5%) |
| Community & Social Service | 1,263 (31.4%) | 2,756 (68.6%) |
| Education, Arts & Media | 304 (29.7%) | 721 (70.3%) |
| Legal Services & Support | 192 (56.5%) | 148 (43.5%) |
| Education Instruction & Library | 522 (25.5%) | 1,524 (74.5%) |
| Arts, Media & Entertainment | 245 (40.3%) | 363 (59.7%) |
| Health Diagnosing & Treating | 474 (28.6%) | 1,182 (71.4%) |
| Health Technologists | 398 (32.6%) | 822 (67.4%) |
| Total (Category) | 7,847 (50.1%) | 7,813 (49.9%) |
| Total (Overall) | 26,815 (54.5%) | 22,375 (45.5%) |
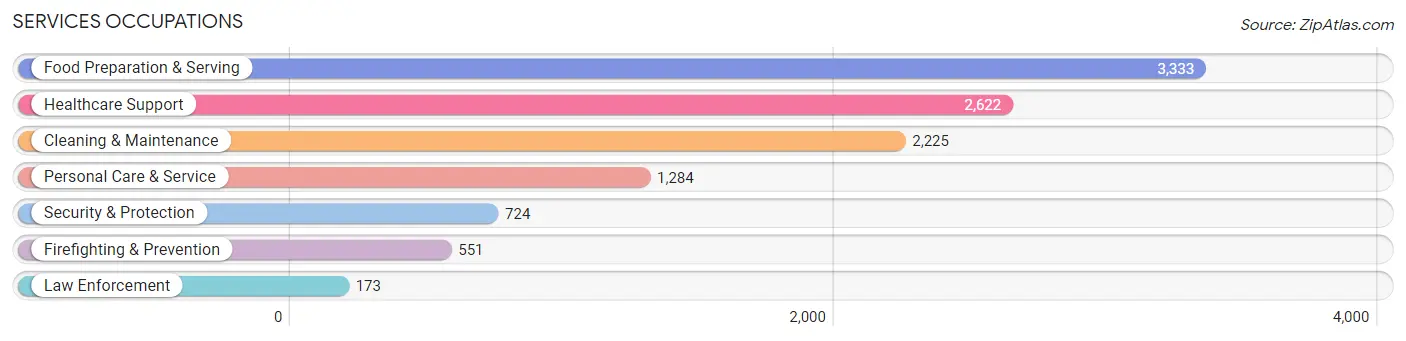
Services Occupations
The most common Services occupations in Federal Way are Food Preparation & Serving (3,333 | 6.8%), Healthcare Support (2,622 | 5.3%), Cleaning & Maintenance (2,225 | 4.5%), Personal Care & Service (1,284 | 2.6%), and Security & Protection (724 | 1.5%).
Services Occupations by Sex
Within the Services occupations in Federal Way, the most male-oriented occupations are Firefighting & Prevention (75.5%), Security & Protection (73.9%), and Law Enforcement (68.8%), while the most female-oriented occupations are Healthcare Support (82.0%), Personal Care & Service (78.9%), and Food Preparation & Serving (52.1%).
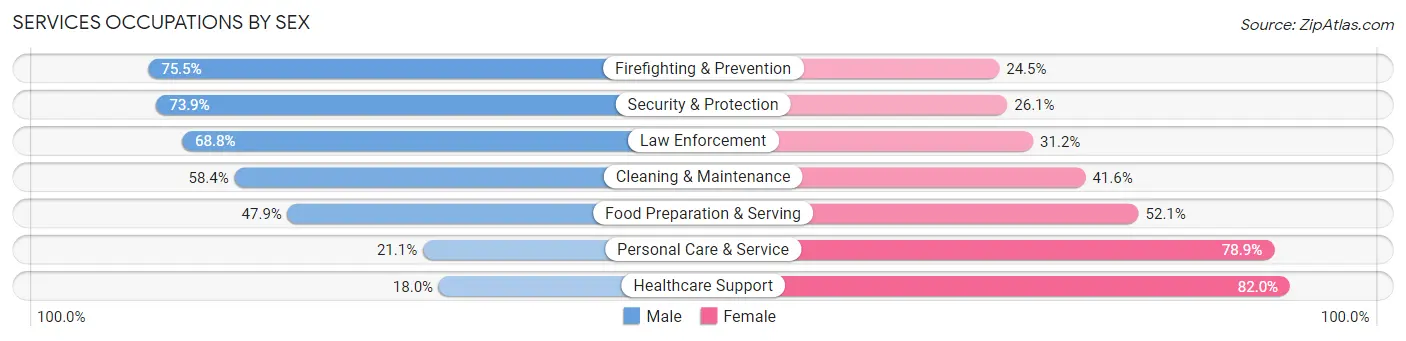
| Occupation | Male | Female |
| Healthcare Support | 471 (18.0%) | 2,151 (82.0%) |
| Security & Protection | 535 (73.9%) | 189 (26.1%) |
| Firefighting & Prevention | 416 (75.5%) | 135 (24.5%) |
| Law Enforcement | 119 (68.8%) | 54 (31.2%) |
| Food Preparation & Serving | 1,597 (47.9%) | 1,736 (52.1%) |
| Cleaning & Maintenance | 1,300 (58.4%) | 925 (41.6%) |
| Personal Care & Service | 271 (21.1%) | 1,013 (78.9%) |
| Total (Category) | 4,174 (41.0%) | 6,014 (59.0%) |
| Total (Overall) | 26,815 (54.5%) | 22,375 (45.5%) |
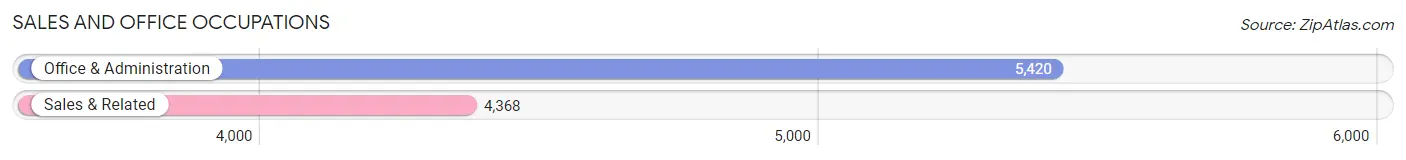
Sales and Office Occupations
The most common Sales and Office occupations in Federal Way are Office & Administration (5,420 | 11.0%), and Sales & Related (4,368 | 8.9%).
Sales and Office Occupations by Sex
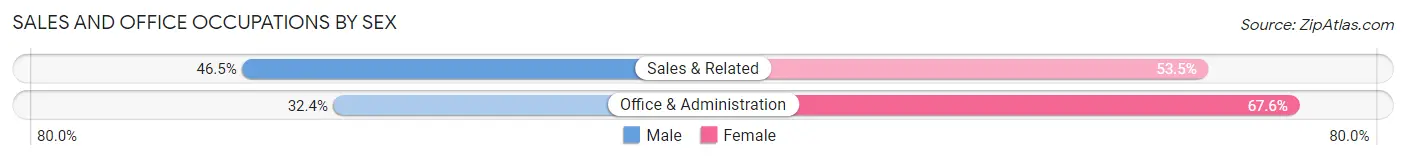
| Occupation | Male | Female |
| Sales & Related | 2,030 (46.5%) | 2,338 (53.5%) |
| Office & Administration | 1,758 (32.4%) | 3,662 (67.6%) |
| Total (Category) | 3,788 (38.7%) | 6,000 (61.3%) |
| Total (Overall) | 26,815 (54.5%) | 22,375 (45.5%) |
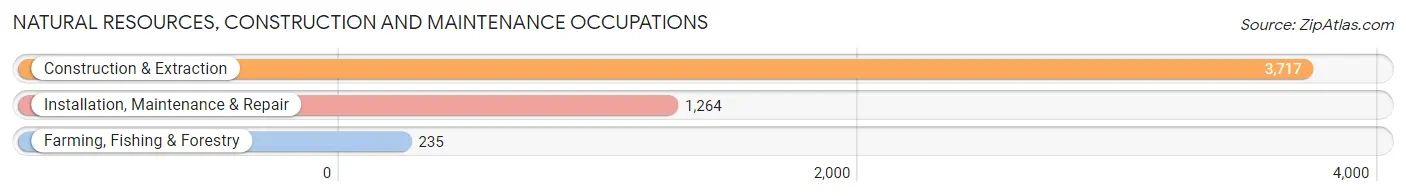
Natural Resources, Construction and Maintenance Occupations
The most common Natural Resources, Construction and Maintenance occupations in Federal Way are Construction & Extraction (3,717 | 7.6%), Installation, Maintenance & Repair (1,264 | 2.6%), and Farming, Fishing & Forestry (235 | 0.5%).
Natural Resources, Construction and Maintenance Occupations by Sex
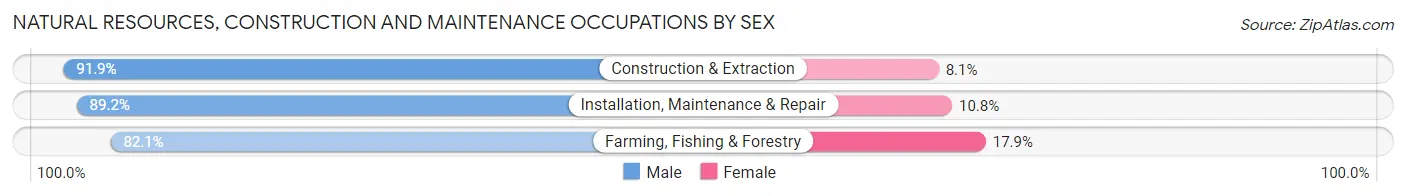
| Occupation | Male | Female |
| Farming, Fishing & Forestry | 193 (82.1%) | 42 (17.9%) |
| Construction & Extraction | 3,417 (91.9%) | 300 (8.1%) |
| Installation, Maintenance & Repair | 1,127 (89.2%) | 137 (10.8%) |
| Total (Category) | 4,737 (90.8%) | 479 (9.2%) |
| Total (Overall) | 26,815 (54.5%) | 22,375 (45.5%) |
Production, Transportation and Moving Occupations
The most common Production, Transportation and Moving occupations in Federal Way are Transportation (3,477 | 7.1%), Material Moving (2,492 | 5.1%), and Production (2,369 | 4.8%).
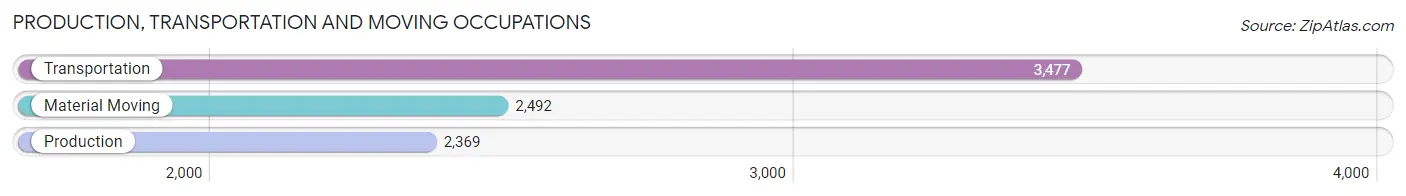
Production, Transportation and Moving Occupations by Sex
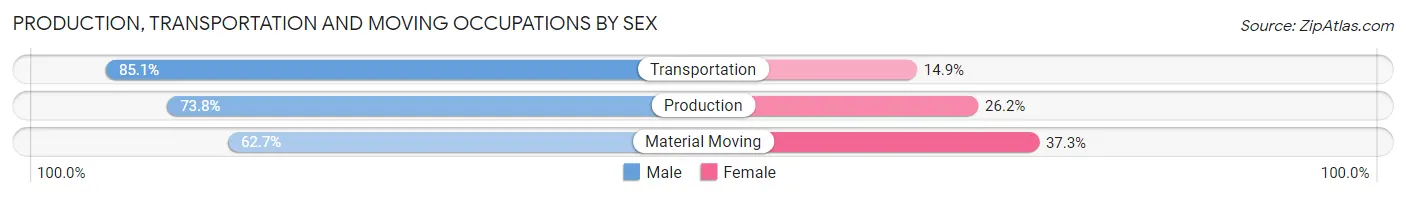
| Occupation | Male | Female |
| Production | 1,749 (73.8%) | 620 (26.2%) |
| Transportation | 2,958 (85.1%) | 519 (14.9%) |
| Material Moving | 1,562 (62.7%) | 930 (37.3%) |
| Total (Category) | 6,269 (75.2%) | 2,069 (24.8%) |
| Total (Overall) | 26,815 (54.5%) | 22,375 (45.5%) |
Employment Industries by Sex in Federal Way
Employment Industries in Federal Way
The major employment industries in Federal Way include Health Care & Social Assistance (6,783 | 13.8%), Retail Trade (5,728 | 11.6%), Manufacturing (5,189 | 10.5%), Construction (4,713 | 9.6%), and Transportation & Warehousing (4,523 | 9.2%).
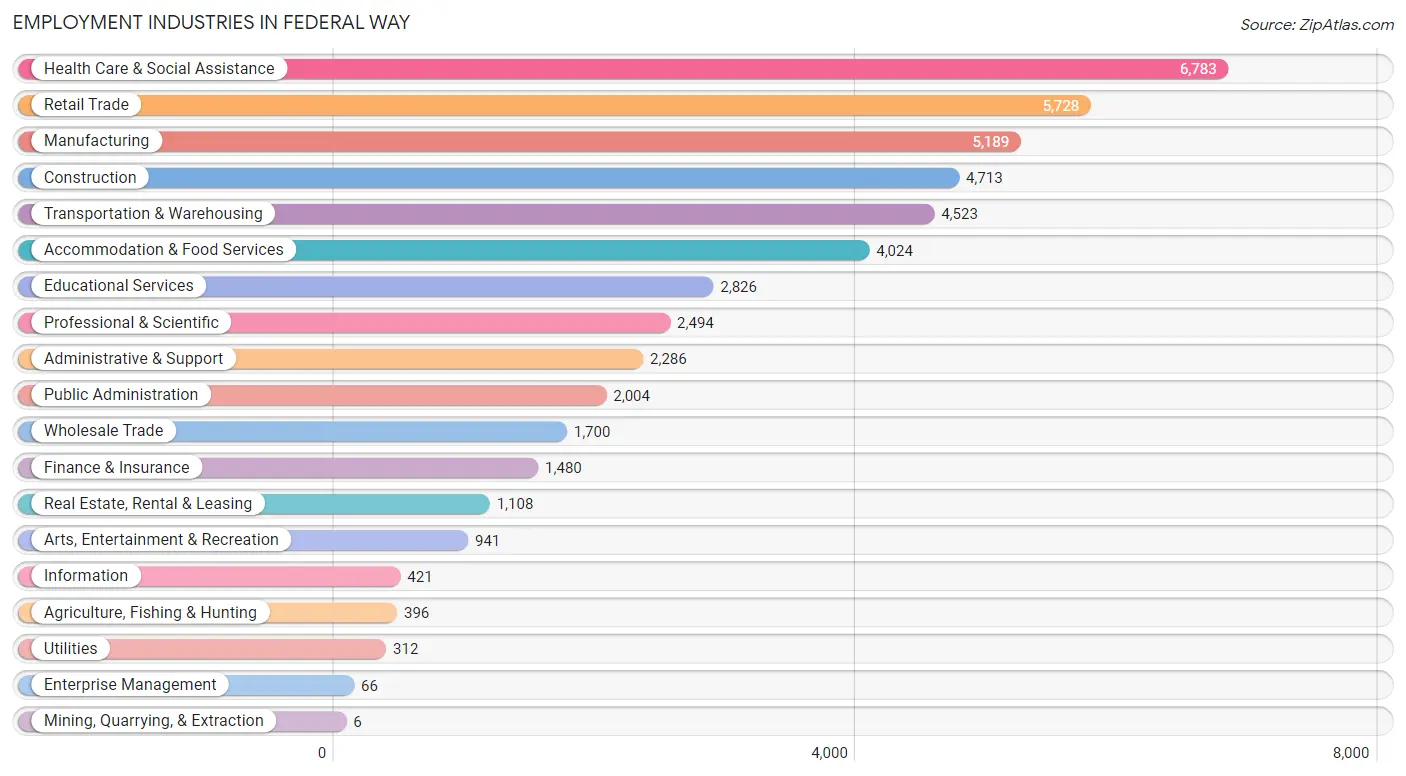
Employment Industries by Sex in Federal Way
The Federal Way industries that see more men than women are Construction (87.3%), Agriculture, Fishing & Hunting (84.9%), and Transportation & Warehousing (76.8%), whereas the industries that tend to have a higher number of women are Mining, Quarrying, & Extraction (100.0%), Enterprise Management (92.4%), and Finance & Insurance (76.2%).
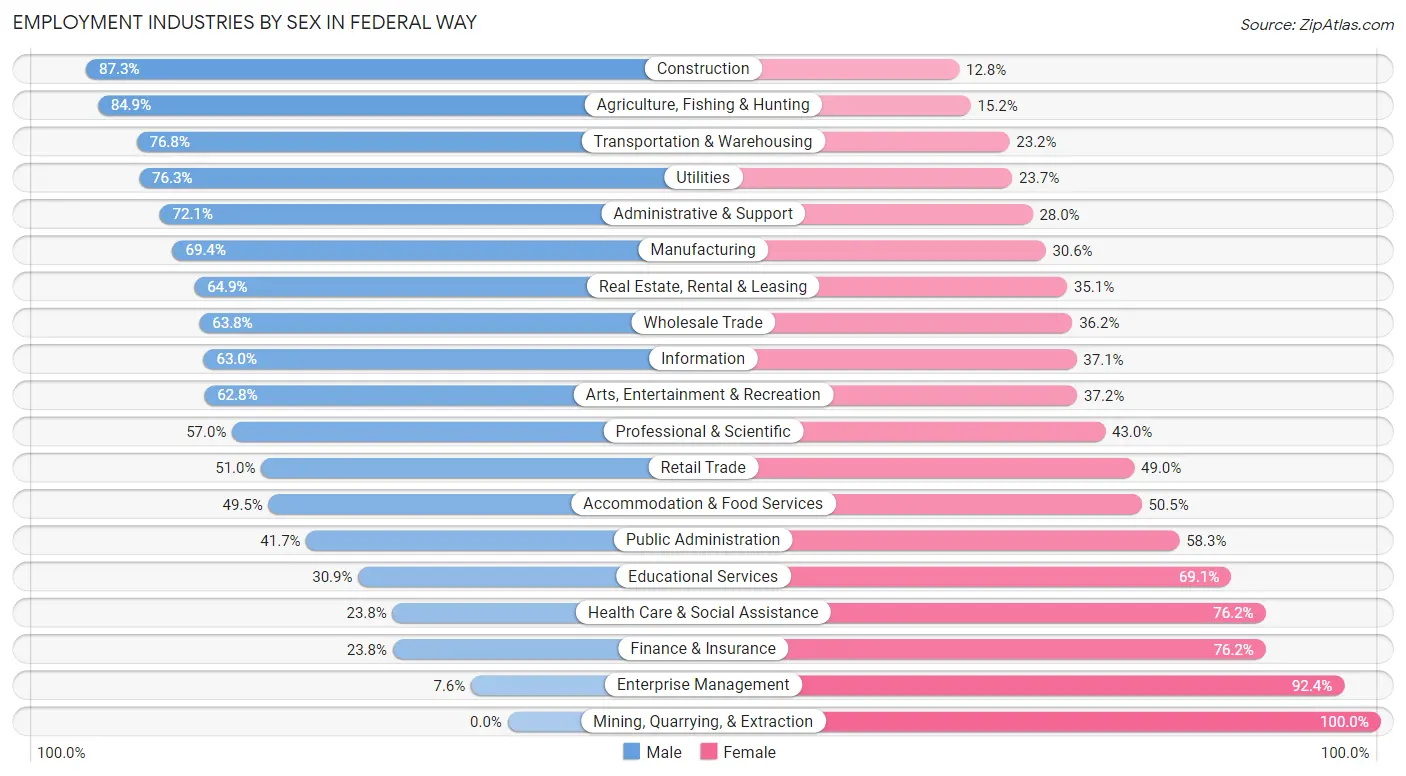
| Industry | Male | Female |
| Agriculture, Fishing & Hunting | 336 (84.9%) | 60 (15.1%) |
| Mining, Quarrying, & Extraction | 0 (0.0%) | 6 (100.0%) |
| Construction | 4,112 (87.3%) | 601 (12.8%) |
| Manufacturing | 3,599 (69.4%) | 1,590 (30.6%) |
| Wholesale Trade | 1,085 (63.8%) | 615 (36.2%) |
| Retail Trade | 2,922 (51.0%) | 2,806 (49.0%) |
| Transportation & Warehousing | 3,475 (76.8%) | 1,048 (23.2%) |
| Utilities | 238 (76.3%) | 74 (23.7%) |
| Information | 265 (62.9%) | 156 (37.0%) |
| Finance & Insurance | 352 (23.8%) | 1,128 (76.2%) |
| Real Estate, Rental & Leasing | 719 (64.9%) | 389 (35.1%) |
| Professional & Scientific | 1,422 (57.0%) | 1,072 (43.0%) |
| Enterprise Management | 5 (7.6%) | 61 (92.4%) |
| Administrative & Support | 1,647 (72.1%) | 639 (28.0%) |
| Educational Services | 874 (30.9%) | 1,952 (69.1%) |
| Health Care & Social Assistance | 1,617 (23.8%) | 5,166 (76.2%) |
| Arts, Entertainment & Recreation | 591 (62.8%) | 350 (37.2%) |
| Accommodation & Food Services | 1,991 (49.5%) | 2,033 (50.5%) |
| Public Administration | 835 (41.7%) | 1,169 (58.3%) |
| Total | 26,815 (54.5%) | 22,375 (45.5%) |
Education in Federal Way
School Enrollment in Federal Way
The most common levels of schooling among the 22,068 students in Federal Way are high school (5,478 | 24.8%), middle school (5,054 | 22.9%), and elementary school (4,264 | 19.3%).
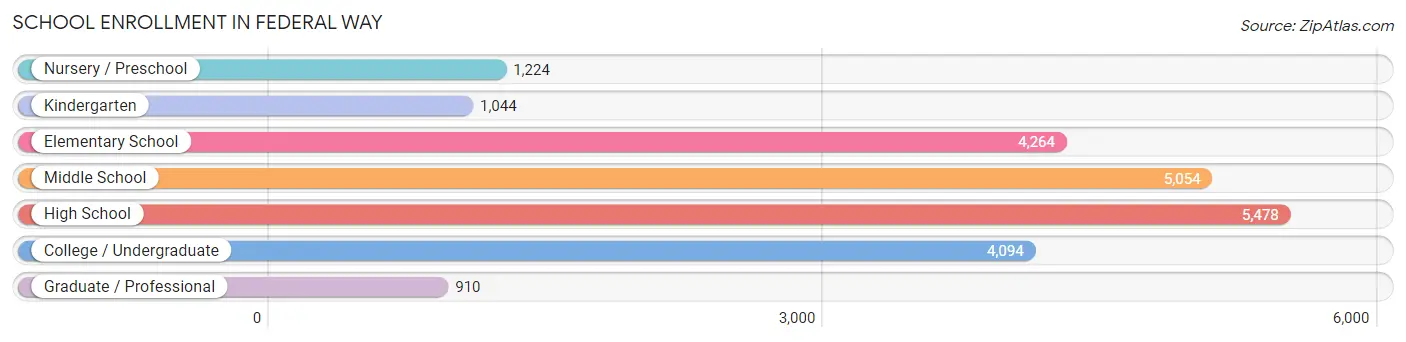
| School Level | # Students | % Students |
| Nursery / Preschool | 1,224 | 5.6% |
| Kindergarten | 1,044 | 4.7% |
| Elementary School | 4,264 | 19.3% |
| Middle School | 5,054 | 22.9% |
| High School | 5,478 | 24.8% |
| College / Undergraduate | 4,094 | 18.5% |
| Graduate / Professional | 910 | 4.1% |
| Total | 22,068 | 100.0% |
School Enrollment by Age by Funding Source in Federal Way
Out of a total of 22,068 students who are enrolled in schools in Federal Way, 3,178 (14.4%) attend a private institution, while the remaining 18,890 (85.6%) are enrolled in public schools. The age group of 3 to 4 year olds has the highest likelihood of being enrolled in private schools, with 301 (37.2% in the age bracket) enrolled. Conversely, the age group of 18 to 19 year olds has the lowest likelihood of being enrolled in a private school, with 1,531 (94.4% in the age bracket) attending a public institution.
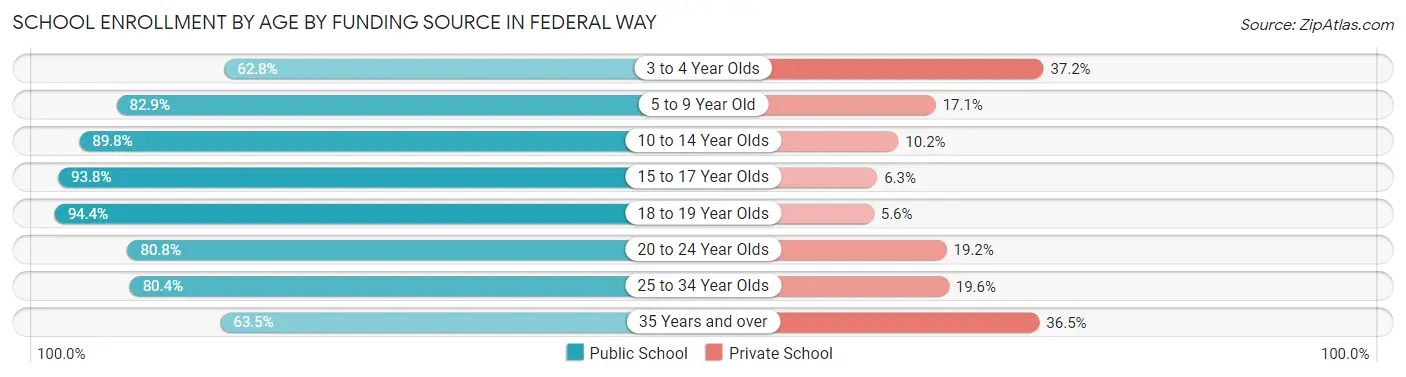
| Age Bracket | Public School | Private School |
| 3 to 4 Year Olds | 508 (62.8%) | 301 (37.2%) |
| 5 to 9 Year Old | 4,074 (82.9%) | 843 (17.1%) |
| 10 to 14 Year Olds | 5,970 (89.8%) | 678 (10.2%) |
| 15 to 17 Year Olds | 3,616 (93.8%) | 241 (6.2%) |
| 18 to 19 Year Olds | 1,531 (94.4%) | 91 (5.6%) |
| 20 to 24 Year Olds | 1,480 (80.8%) | 351 (19.2%) |
| 25 to 34 Year Olds | 949 (80.4%) | 231 (19.6%) |
| 35 Years and over | 765 (63.5%) | 439 (36.5%) |
| Total | 18,890 (85.6%) | 3,178 (14.4%) |
Educational Attainment by Field of Study in Federal Way
Business (3,940 | 17.8%), science & technology (2,265 | 10.2%), social sciences (2,219 | 10.0%), education (1,983 | 9.0%), and engineering (1,816 | 8.2%) are the most common fields of study among 22,092 individuals in Federal Way who have obtained a bachelor's degree or higher.
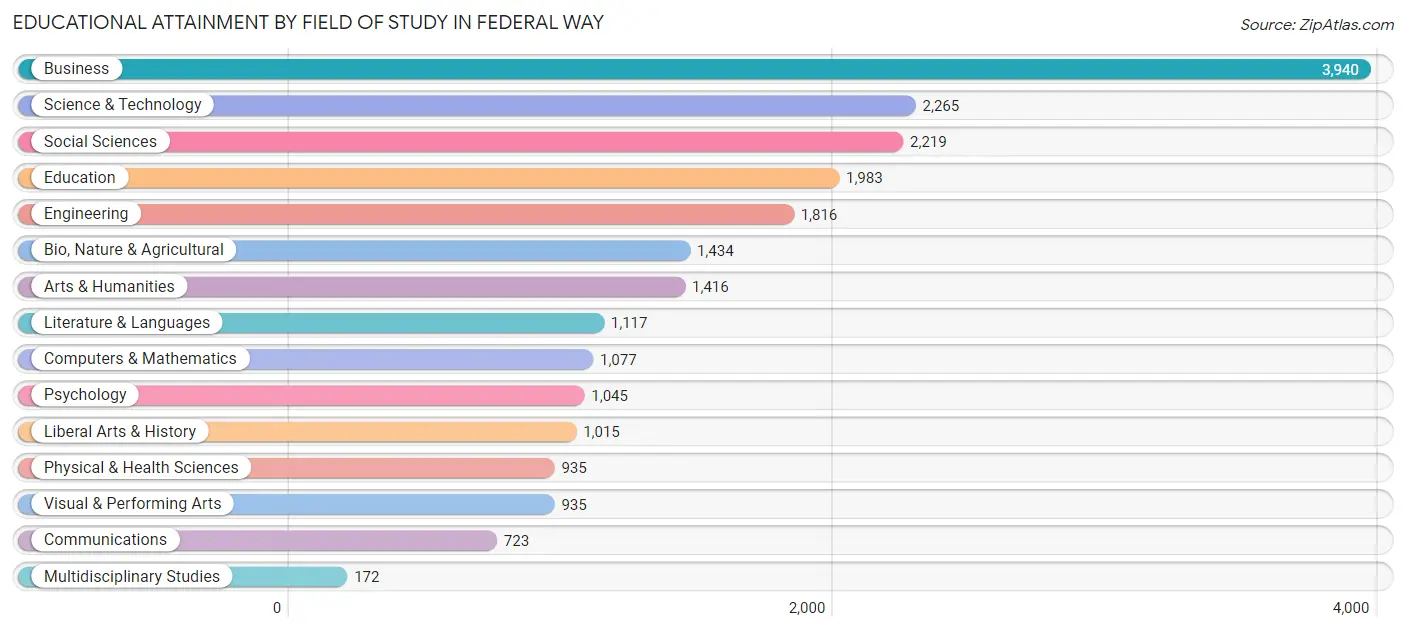
| Field of Study | # Graduates | % Graduates |
| Computers & Mathematics | 1,077 | 4.9% |
| Bio, Nature & Agricultural | 1,434 | 6.5% |
| Physical & Health Sciences | 935 | 4.2% |
| Psychology | 1,045 | 4.7% |
| Social Sciences | 2,219 | 10.0% |
| Engineering | 1,816 | 8.2% |
| Multidisciplinary Studies | 172 | 0.8% |
| Science & Technology | 2,265 | 10.2% |
| Business | 3,940 | 17.8% |
| Education | 1,983 | 9.0% |
| Literature & Languages | 1,117 | 5.1% |
| Liberal Arts & History | 1,015 | 4.6% |
| Visual & Performing Arts | 935 | 4.2% |
| Communications | 723 | 3.3% |
| Arts & Humanities | 1,416 | 6.4% |
| Total | 22,092 | 100.0% |
Transportation & Commute in Federal Way
Vehicle Availability by Sex in Federal Way
The most prevalent vehicle ownership categories in Federal Way are males with 2 vehicles (9,551, accounting for 36.4%) and females with 2 vehicles (7,593, making up 44.3%).
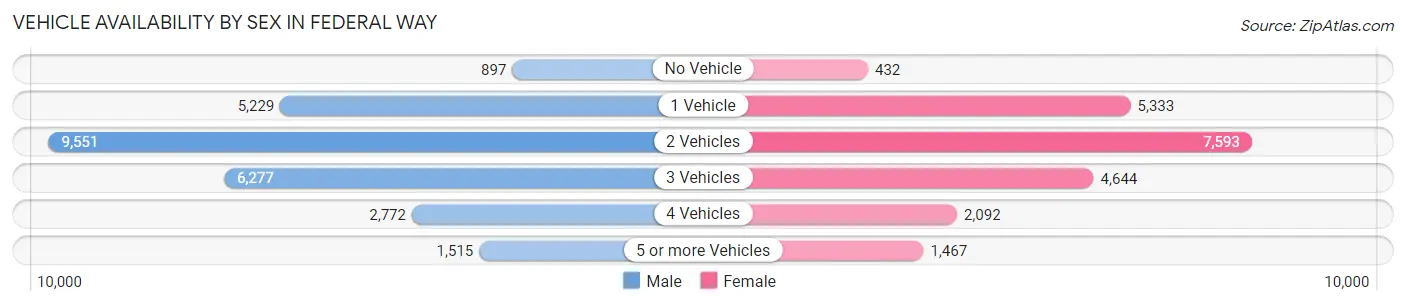
| Vehicles Available | Male | Female |
| No Vehicle | 897 (3.4%) | 432 (2.0%) |
| 1 Vehicle | 5,229 (19.9%) | 5,333 (24.7%) |
| 2 Vehicles | 9,551 (36.4%) | 7,593 (35.2%) |
| 3 Vehicles | 6,277 (23.9%) | 4,644 (21.5%) |
| 4 Vehicles | 2,772 (10.6%) | 2,092 (9.7%) |
| 5 or more Vehicles | 1,515 (5.8%) | 1,467 (6.8%) |
| Total | 26,241 (100.0%) | 21,561 (100.0%) |
Commute Time in Federal Way
The most frequently occuring commute durations in Federal Way are 30 to 34 minutes (6,972 commuters, 16.3%), 60 to 89 minutes (5,807 commuters, 13.6%), and 20 to 24 minutes (5,330 commuters, 12.5%).
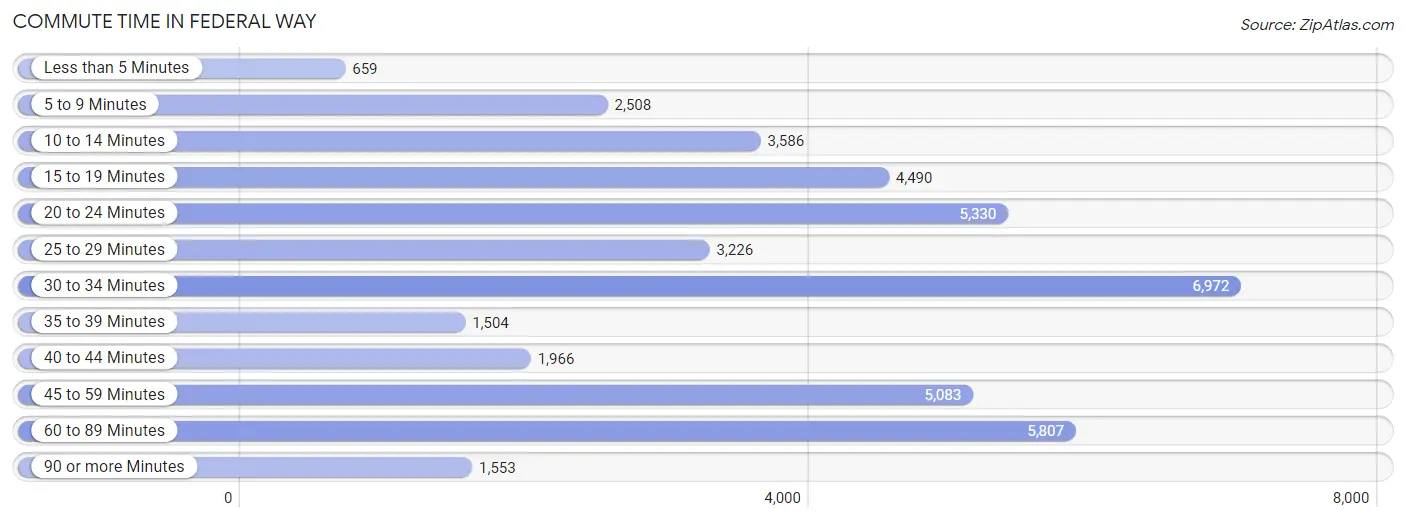
| Commute Time | # Commuters | % Commuters |
| Less than 5 Minutes | 659 | 1.5% |
| 5 to 9 Minutes | 2,508 | 5.9% |
| 10 to 14 Minutes | 3,586 | 8.4% |
| 15 to 19 Minutes | 4,490 | 10.5% |
| 20 to 24 Minutes | 5,330 | 12.5% |
| 25 to 29 Minutes | 3,226 | 7.6% |
| 30 to 34 Minutes | 6,972 | 16.3% |
| 35 to 39 Minutes | 1,504 | 3.5% |
| 40 to 44 Minutes | 1,966 | 4.6% |
| 45 to 59 Minutes | 5,083 | 11.9% |
| 60 to 89 Minutes | 5,807 | 13.6% |
| 90 or more Minutes | 1,553 | 3.6% |
Commute Time by Sex in Federal Way
The most common commute times in Federal Way are 30 to 34 minutes (4,260 commuters, 17.7%) for males and 30 to 34 minutes (2,712 commuters, 14.6%) for females.
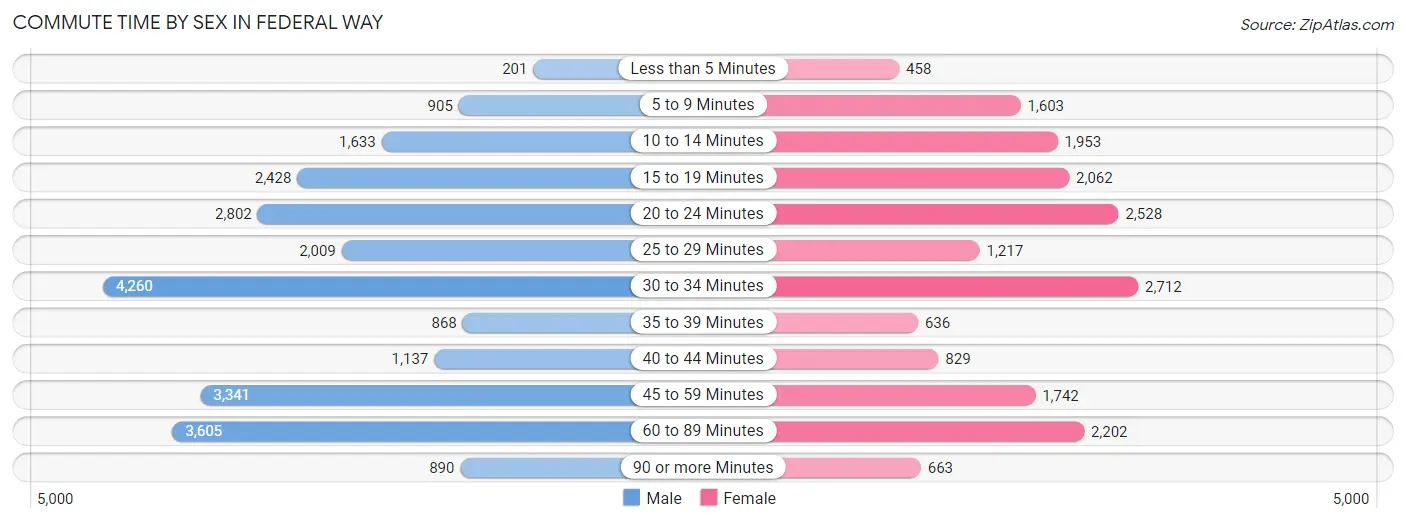
| Commute Time | Male | Female |
| Less than 5 Minutes | 201 (0.8%) | 458 (2.5%) |
| 5 to 9 Minutes | 905 (3.8%) | 1,603 (8.6%) |
| 10 to 14 Minutes | 1,633 (6.8%) | 1,953 (10.5%) |
| 15 to 19 Minutes | 2,428 (10.1%) | 2,062 (11.1%) |
| 20 to 24 Minutes | 2,802 (11.6%) | 2,528 (13.6%) |
| 25 to 29 Minutes | 2,009 (8.3%) | 1,217 (6.5%) |
| 30 to 34 Minutes | 4,260 (17.7%) | 2,712 (14.6%) |
| 35 to 39 Minutes | 868 (3.6%) | 636 (3.4%) |
| 40 to 44 Minutes | 1,137 (4.7%) | 829 (4.5%) |
| 45 to 59 Minutes | 3,341 (13.9%) | 1,742 (9.4%) |
| 60 to 89 Minutes | 3,605 (15.0%) | 2,202 (11.8%) |
| 90 or more Minutes | 890 (3.7%) | 663 (3.6%) |
Time of Departure to Work by Sex in Federal Way
The most frequent times of departure to work in Federal Way are 12:00 AM to 4:59 AM (2,757, 11.5%) for males and 7:00 AM to 7:29 AM (2,440, 13.1%) for females.
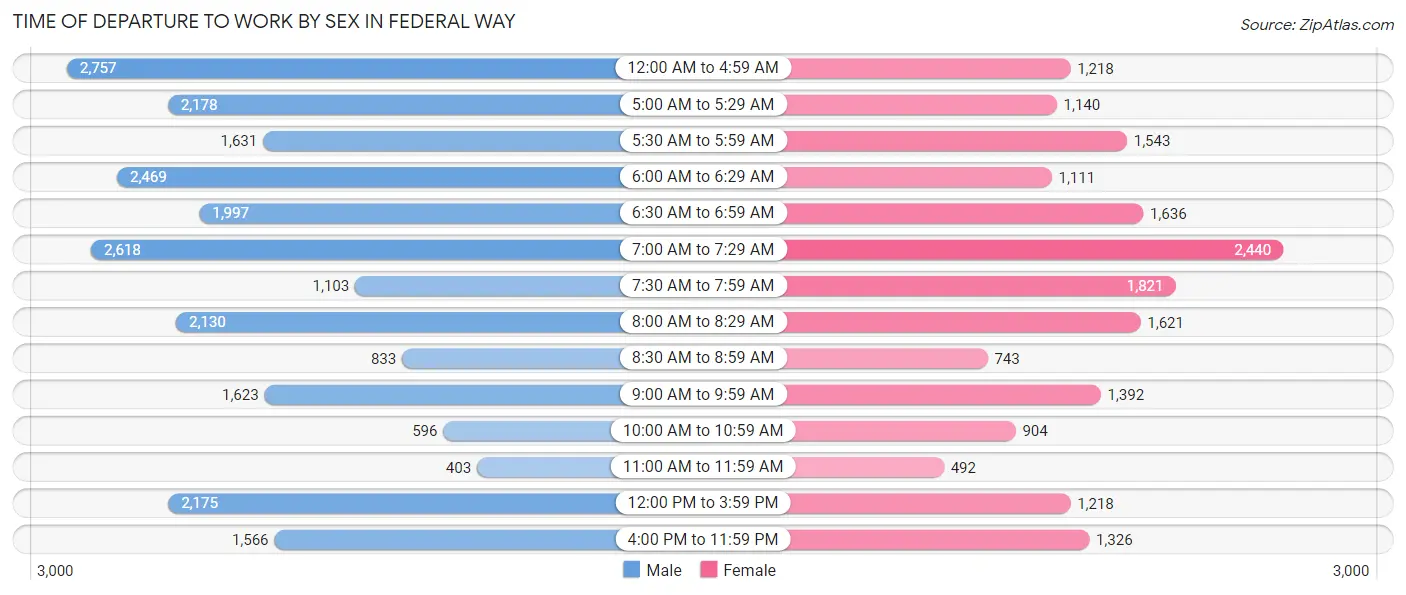
| Time of Departure | Male | Female |
| 12:00 AM to 4:59 AM | 2,757 (11.5%) | 1,218 (6.6%) |
| 5:00 AM to 5:29 AM | 2,178 (9.0%) | 1,140 (6.1%) |
| 5:30 AM to 5:59 AM | 1,631 (6.8%) | 1,543 (8.3%) |
| 6:00 AM to 6:29 AM | 2,469 (10.2%) | 1,111 (6.0%) |
| 6:30 AM to 6:59 AM | 1,997 (8.3%) | 1,636 (8.8%) |
| 7:00 AM to 7:29 AM | 2,618 (10.9%) | 2,440 (13.1%) |
| 7:30 AM to 7:59 AM | 1,103 (4.6%) | 1,821 (9.8%) |
| 8:00 AM to 8:29 AM | 2,130 (8.8%) | 1,621 (8.7%) |
| 8:30 AM to 8:59 AM | 833 (3.5%) | 743 (4.0%) |
| 9:00 AM to 9:59 AM | 1,623 (6.7%) | 1,392 (7.5%) |
| 10:00 AM to 10:59 AM | 596 (2.5%) | 904 (4.9%) |
| 11:00 AM to 11:59 AM | 403 (1.7%) | 492 (2.6%) |
| 12:00 PM to 3:59 PM | 2,175 (9.0%) | 1,218 (6.6%) |
| 4:00 PM to 11:59 PM | 1,566 (6.5%) | 1,326 (7.1%) |
| Total | 24,079 (100.0%) | 18,605 (100.0%) |
Housing Occupancy in Federal Way
Occupancy by Ownership in Federal Way
Of the total 36,354 dwellings in Federal Way, owner-occupied units account for 20,138 (55.4%), while renter-occupied units make up 16,216 (44.6%).
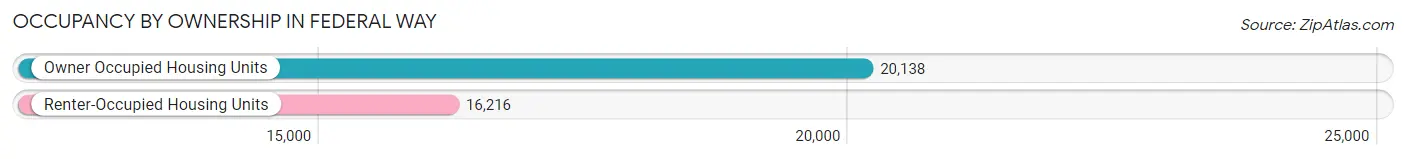
| Occupancy | # Housing Units | % Housing Units |
| Owner Occupied Housing Units | 20,138 | 55.4% |
| Renter-Occupied Housing Units | 16,216 | 44.6% |
| Total Occupied Housing Units | 36,354 | 100.0% |
Occupancy by Household Size in Federal Way
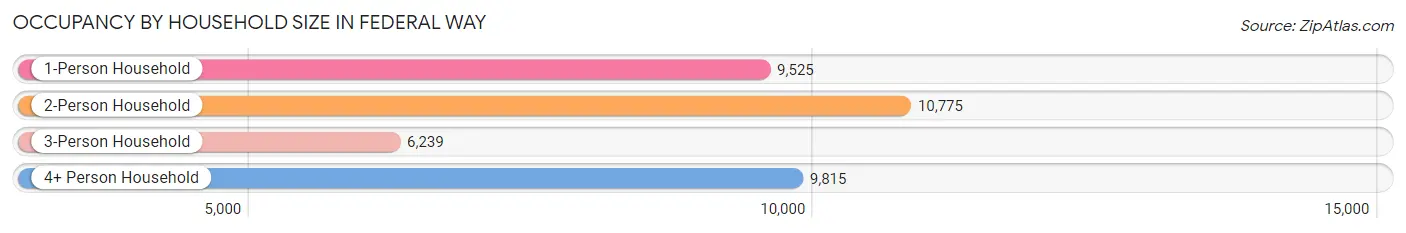
| Household Size | # Housing Units | % Housing Units |
| 1-Person Household | 9,525 | 26.2% |
| 2-Person Household | 10,775 | 29.6% |
| 3-Person Household | 6,239 | 17.2% |
| 4+ Person Household | 9,815 | 27.0% |
| Total Housing Units | 36,354 | 100.0% |
Occupancy by Ownership by Household Size in Federal Way
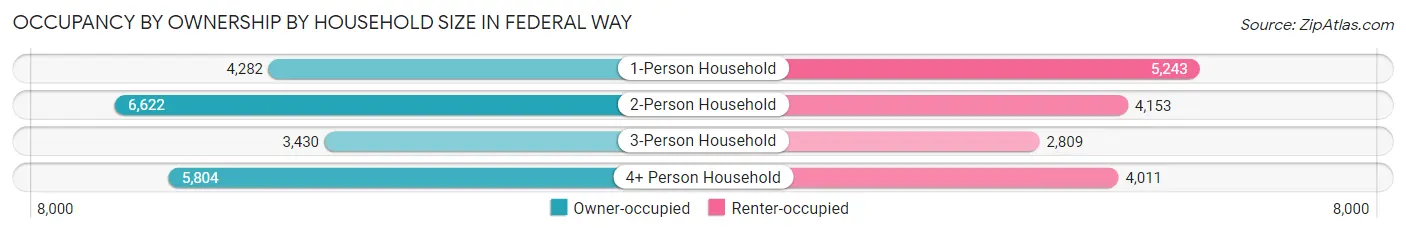
| Household Size | Owner-occupied | Renter-occupied |
| 1-Person Household | 4,282 (45.0%) | 5,243 (55.0%) |
| 2-Person Household | 6,622 (61.5%) | 4,153 (38.5%) |
| 3-Person Household | 3,430 (55.0%) | 2,809 (45.0%) |
| 4+ Person Household | 5,804 (59.1%) | 4,011 (40.9%) |
| Total Housing Units | 20,138 (55.4%) | 16,216 (44.6%) |
Occupancy by Educational Attainment in Federal Way
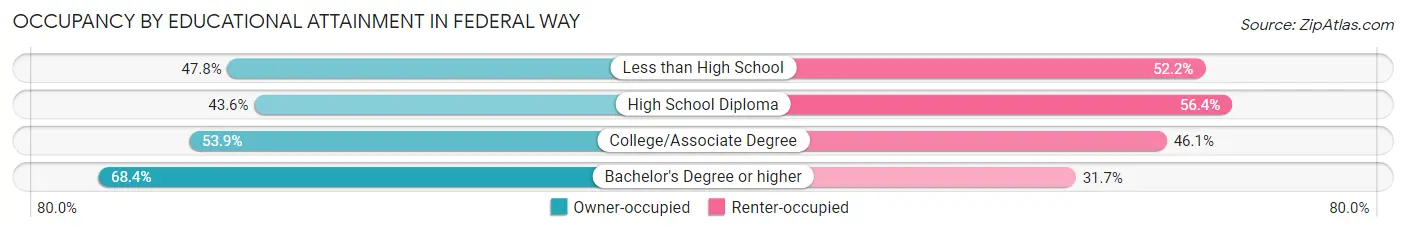
| Household Size | Owner-occupied | Renter-occupied |
| Less than High School | 1,396 (47.8%) | 1,523 (52.2%) |
| High School Diploma | 3,803 (43.6%) | 4,928 (56.4%) |
| College/Associate Degree | 7,268 (53.9%) | 6,213 (46.1%) |
| Bachelor's Degree or higher | 7,671 (68.3%) | 3,552 (31.7%) |
Occupancy by Age of Householder in Federal Way
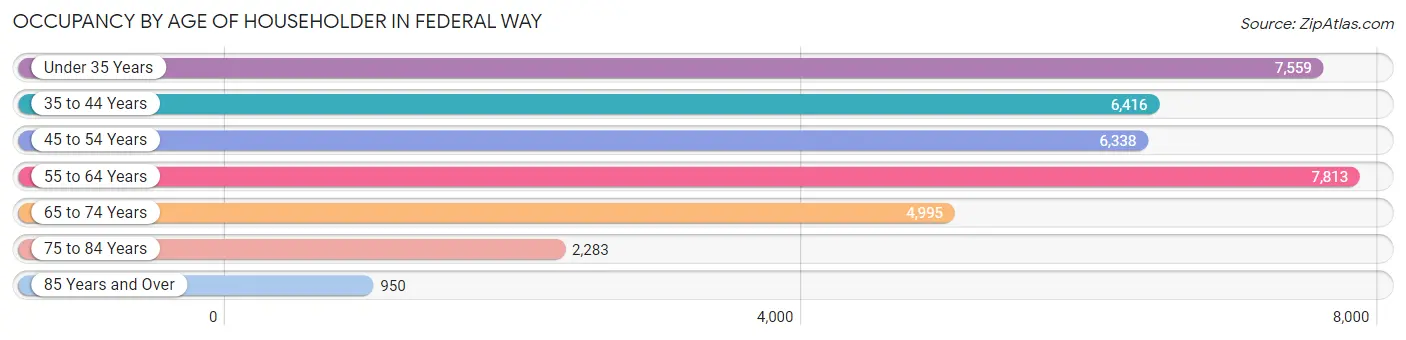
| Age Bracket | # Households | % Households |
| Under 35 Years | 7,559 | 20.8% |
| 35 to 44 Years | 6,416 | 17.6% |
| 45 to 54 Years | 6,338 | 17.4% |
| 55 to 64 Years | 7,813 | 21.5% |
| 65 to 74 Years | 4,995 | 13.7% |
| 75 to 84 Years | 2,283 | 6.3% |
| 85 Years and Over | 950 | 2.6% |
| Total | 36,354 | 100.0% |
Housing Finances in Federal Way
Median Income by Occupancy in Federal Way
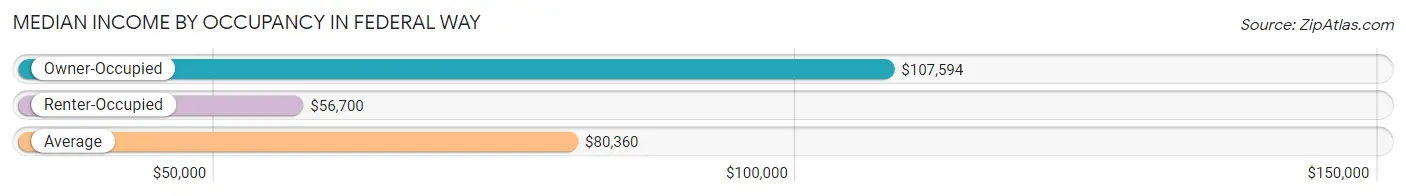
| Occupancy Type | # Households | Median Income |
| Owner-Occupied | 20,138 (55.4%) | $107,594 |
| Renter-Occupied | 16,216 (44.6%) | $56,700 |
| Average | 36,354 (100.0%) | $80,360 |
Occupancy by Householder Income Bracket in Federal Way
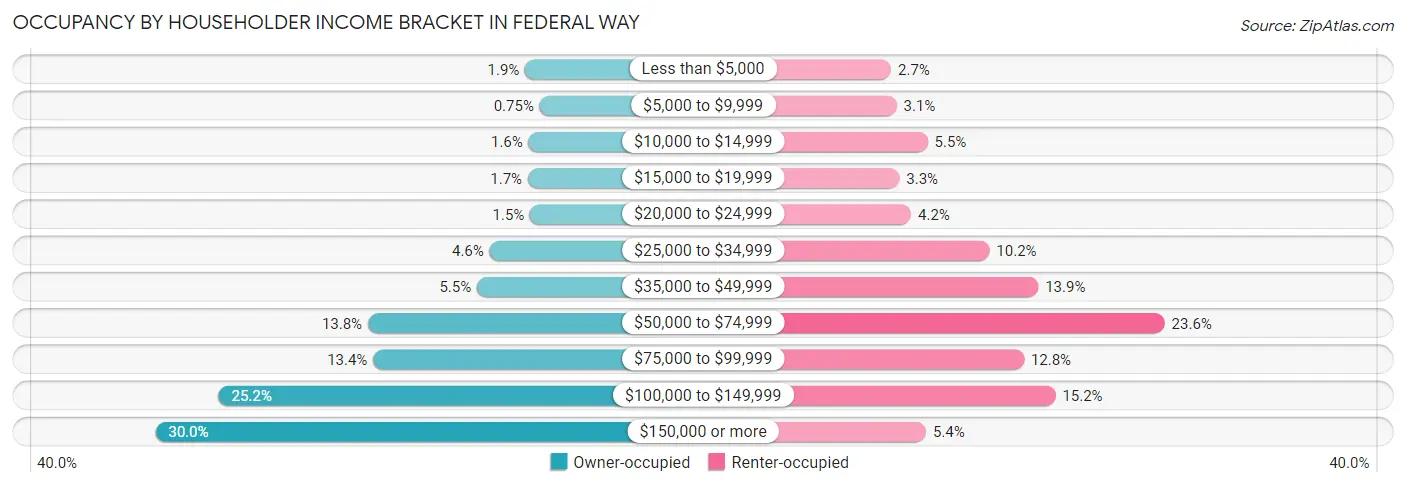
| Income Bracket | Owner-occupied | Renter-occupied |
| Less than $5,000 | 375 (1.9%) | 439 (2.7%) |
| $5,000 to $9,999 | 151 (0.7%) | 508 (3.1%) |
| $10,000 to $14,999 | 323 (1.6%) | 890 (5.5%) |
| $15,000 to $19,999 | 333 (1.7%) | 542 (3.3%) |
| $20,000 to $24,999 | 298 (1.5%) | 686 (4.2%) |
| $25,000 to $34,999 | 921 (4.6%) | 1,654 (10.2%) |
| $35,000 to $49,999 | 1,114 (5.5%) | 2,257 (13.9%) |
| $50,000 to $74,999 | 2,788 (13.8%) | 3,819 (23.5%) |
| $75,000 to $99,999 | 2,707 (13.4%) | 2,080 (12.8%) |
| $100,000 to $149,999 | 5,079 (25.2%) | 2,470 (15.2%) |
| $150,000 or more | 6,049 (30.0%) | 871 (5.4%) |
| Total | 20,138 (100.0%) | 16,216 (100.0%) |
Monthly Housing Cost Tiers in Federal Way
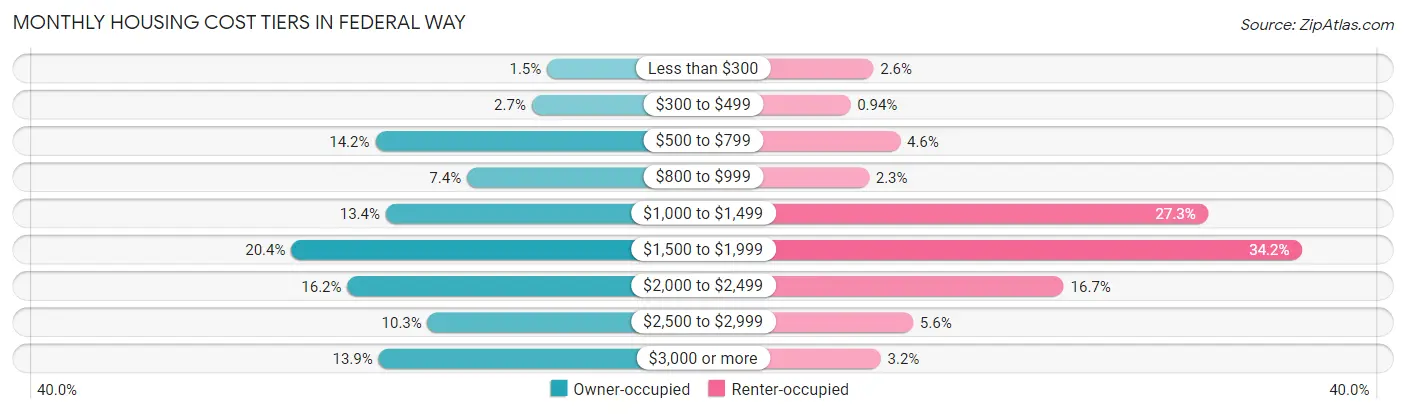
| Monthly Cost | Owner-occupied | Renter-occupied |
| Less than $300 | 307 (1.5%) | 428 (2.6%) |
| $300 to $499 | 533 (2.6%) | 152 (0.9%) |
| $500 to $799 | 2,853 (14.2%) | 747 (4.6%) |
| $800 to $999 | 1,494 (7.4%) | 375 (2.3%) |
| $1,000 to $1,499 | 2,698 (13.4%) | 4,421 (27.3%) |
| $1,500 to $1,999 | 4,100 (20.4%) | 5,539 (34.2%) |
| $2,000 to $2,499 | 3,269 (16.2%) | 2,702 (16.7%) |
| $2,500 to $2,999 | 2,079 (10.3%) | 902 (5.6%) |
| $3,000 or more | 2,805 (13.9%) | 516 (3.2%) |
| Total | 20,138 (100.0%) | 16,216 (100.0%) |
Physical Housing Characteristics in Federal Way
Housing Structures in Federal Way
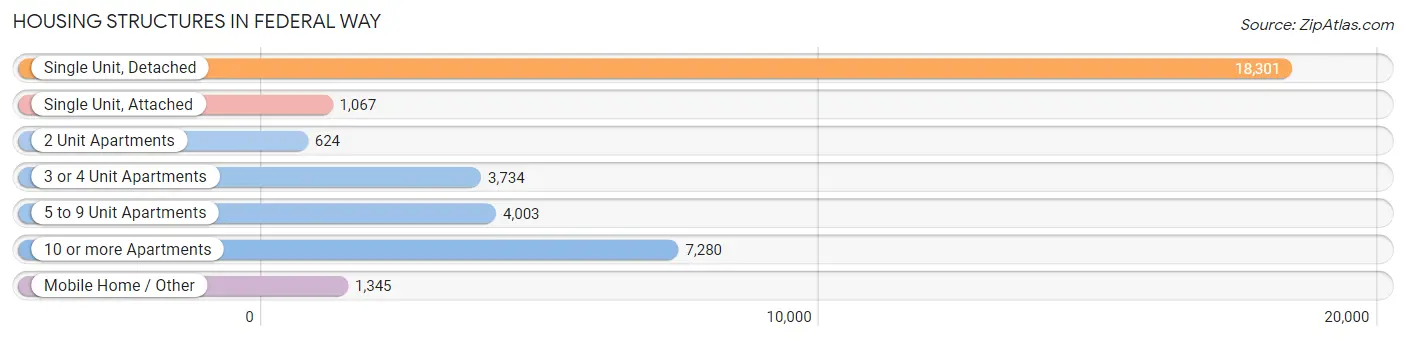
| Structure Type | # Housing Units | % Housing Units |
| Single Unit, Detached | 18,301 | 50.3% |
| Single Unit, Attached | 1,067 | 2.9% |
| 2 Unit Apartments | 624 | 1.7% |
| 3 or 4 Unit Apartments | 3,734 | 10.3% |
| 5 to 9 Unit Apartments | 4,003 | 11.0% |
| 10 or more Apartments | 7,280 | 20.0% |
| Mobile Home / Other | 1,345 | 3.7% |
| Total | 36,354 | 100.0% |
Housing Structures by Occupancy in Federal Way
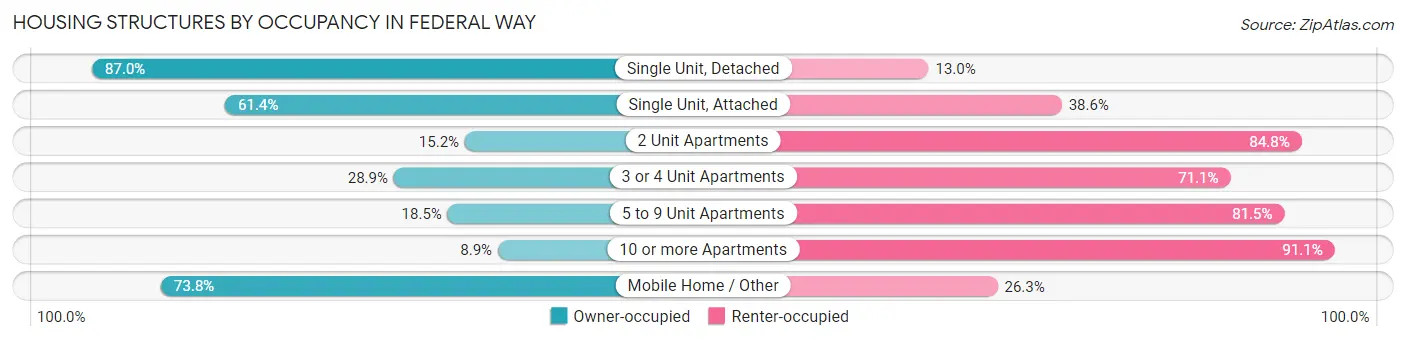
| Structure Type | Owner-occupied | Renter-occupied |
| Single Unit, Detached | 15,928 (87.0%) | 2,373 (13.0%) |
| Single Unit, Attached | 655 (61.4%) | 412 (38.6%) |
| 2 Unit Apartments | 95 (15.2%) | 529 (84.8%) |
| 3 or 4 Unit Apartments | 1,080 (28.9%) | 2,654 (71.1%) |
| 5 to 9 Unit Apartments | 742 (18.5%) | 3,261 (81.5%) |
| 10 or more Apartments | 646 (8.9%) | 6,634 (91.1%) |
| Mobile Home / Other | 992 (73.8%) | 353 (26.3%) |
| Total | 20,138 (55.4%) | 16,216 (44.6%) |
Housing Structures by Number of Rooms in Federal Way
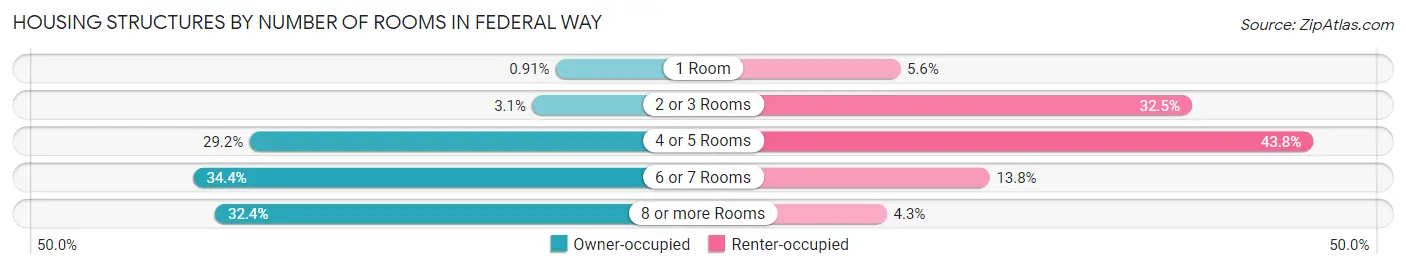
| Number of Rooms | Owner-occupied | Renter-occupied |
| 1 Room | 184 (0.9%) | 902 (5.6%) |
| 2 or 3 Rooms | 622 (3.1%) | 5,276 (32.5%) |
| 4 or 5 Rooms | 5,888 (29.2%) | 7,095 (43.8%) |
| 6 or 7 Rooms | 6,924 (34.4%) | 2,243 (13.8%) |
| 8 or more Rooms | 6,520 (32.4%) | 700 (4.3%) |
| Total | 20,138 (100.0%) | 16,216 (100.0%) |
Housing Structure by Heating Type in Federal Way
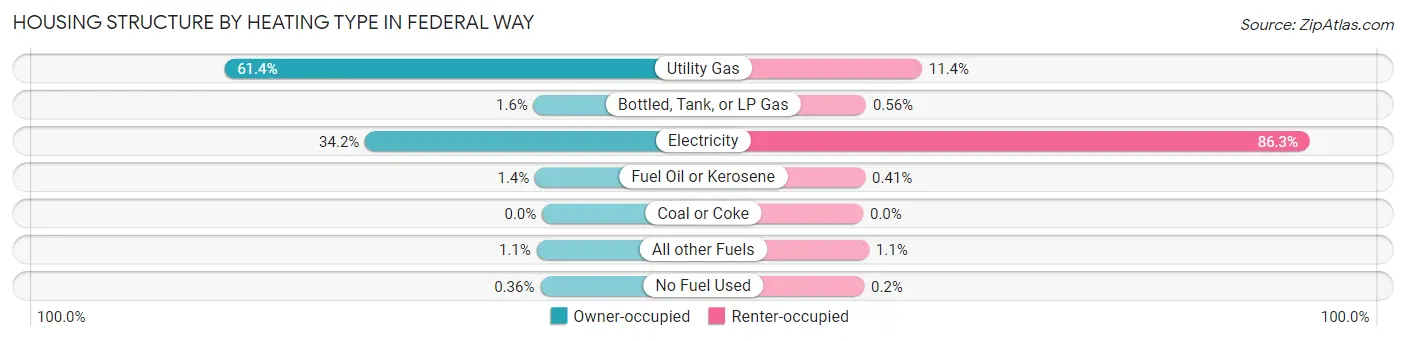
| Heating Type | Owner-occupied | Renter-occupied |
| Utility Gas | 12,369 (61.4%) | 1,844 (11.4%) |
| Bottled, Tank, or LP Gas | 326 (1.6%) | 91 (0.6%) |
| Electricity | 6,886 (34.2%) | 13,999 (86.3%) |
| Fuel Oil or Kerosene | 272 (1.3%) | 67 (0.4%) |
| Coal or Coke | 0 (0.0%) | 0 (0.0%) |
| All other Fuels | 213 (1.1%) | 183 (1.1%) |
| No Fuel Used | 72 (0.4%) | 32 (0.2%) |
| Total | 20,138 (100.0%) | 16,216 (100.0%) |
Household Vehicle Usage in Federal Way
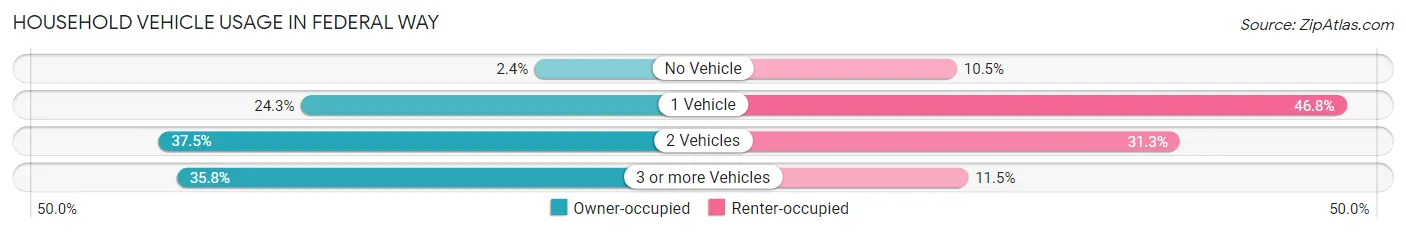
| Vehicles per Household | Owner-occupied | Renter-occupied |
| No Vehicle | 492 (2.4%) | 1,694 (10.4%) |
| 1 Vehicle | 4,886 (24.3%) | 7,589 (46.8%) |
| 2 Vehicles | 7,551 (37.5%) | 5,067 (31.2%) |
| 3 or more Vehicles | 7,209 (35.8%) | 1,866 (11.5%) |
| Total | 20,138 (100.0%) | 16,216 (100.0%) |
Real Estate & Mortgages in Federal Way
Real Estate and Mortgage Overview in Federal Way
| Characteristic | Without Mortgage | With Mortgage |
| Housing Units | 6,292 | 13,846 |
| Median Property Value | $445,000 | $459,100 |
| Median Household Income | $80,685 | $4,604 |
| Monthly Housing Costs | $760 | $2,790 |
| Real Estate Taxes | $4,376 | $447 |
Property Value by Mortgage Status in Federal Way
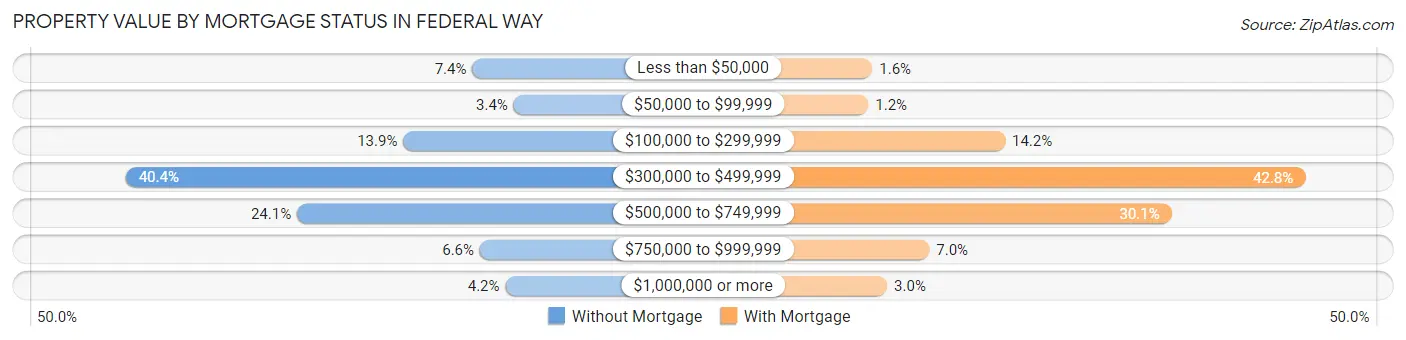
| Property Value | Without Mortgage | With Mortgage |
| Less than $50,000 | 463 (7.4%) | 221 (1.6%) |
| $50,000 to $99,999 | 215 (3.4%) | 169 (1.2%) |
| $100,000 to $299,999 | 877 (13.9%) | 1,971 (14.2%) |
| $300,000 to $499,999 | 2,540 (40.4%) | 5,929 (42.8%) |
| $500,000 to $749,999 | 1,514 (24.1%) | 4,166 (30.1%) |
| $750,000 to $999,999 | 418 (6.6%) | 973 (7.0%) |
| $1,000,000 or more | 265 (4.2%) | 417 (3.0%) |
| Total | 6,292 (100.0%) | 13,846 (100.0%) |
Household Income by Mortgage Status in Federal Way
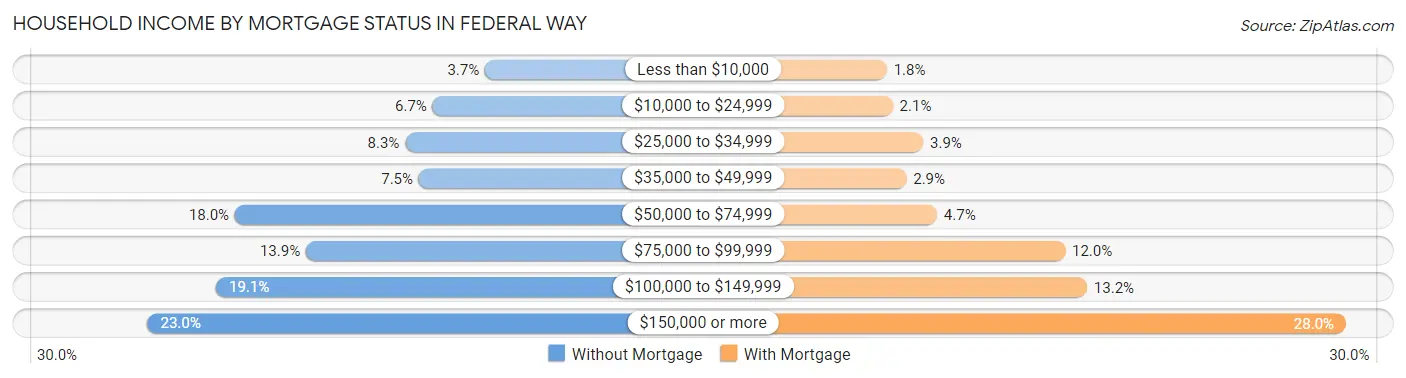
| Household Income | Without Mortgage | With Mortgage |
| Less than $10,000 | 232 (3.7%) | 247 (1.8%) |
| $10,000 to $24,999 | 420 (6.7%) | 294 (2.1%) |
| $25,000 to $34,999 | 519 (8.3%) | 534 (3.9%) |
| $35,000 to $49,999 | 470 (7.5%) | 402 (2.9%) |
| $50,000 to $74,999 | 1,131 (18.0%) | 644 (4.6%) |
| $75,000 to $99,999 | 876 (13.9%) | 1,657 (12.0%) |
| $100,000 to $149,999 | 1,199 (19.1%) | 1,831 (13.2%) |
| $150,000 or more | 1,445 (23.0%) | 3,880 (28.0%) |
| Total | 6,292 (100.0%) | 13,846 (100.0%) |
Property Value to Household Income Ratio in Federal Way
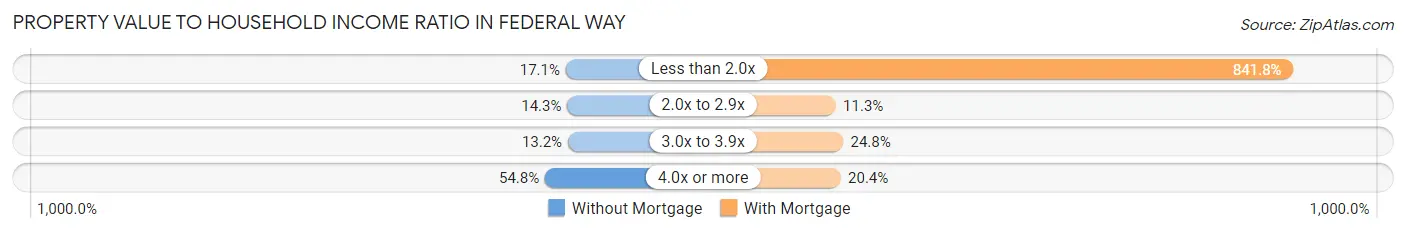
| Value-to-Income Ratio | Without Mortgage | With Mortgage |
| Less than 2.0x | 1,077 (17.1%) | 116,550 (841.8%) |
| 2.0x to 2.9x | 902 (14.3%) | 1,565 (11.3%) |
| 3.0x to 3.9x | 831 (13.2%) | 3,434 (24.8%) |
| 4.0x or more | 3,446 (54.8%) | 2,819 (20.4%) |
| Total | 6,292 (100.0%) | 13,846 (100.0%) |
Real Estate Taxes by Mortgage Status in Federal Way
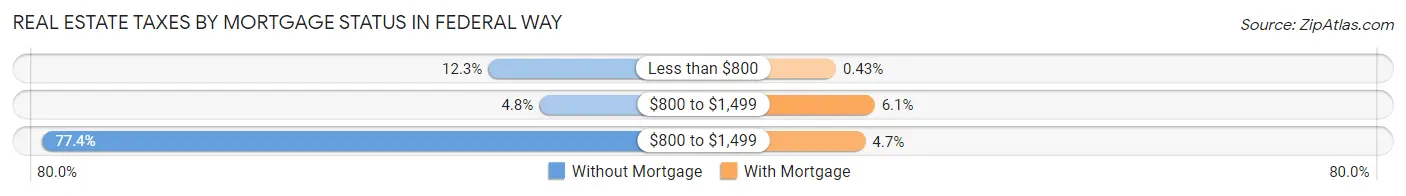
| Property Taxes | Without Mortgage | With Mortgage |
| Less than $800 | 772 (12.3%) | 59 (0.4%) |
| $800 to $1,499 | 304 (4.8%) | 843 (6.1%) |
| $800 to $1,499 | 4,870 (77.4%) | 655 (4.7%) |
| Total | 6,292 (100.0%) | 13,846 (100.0%) |
Health & Disability in Federal Way
Health Insurance Coverage by Age in Federal Way
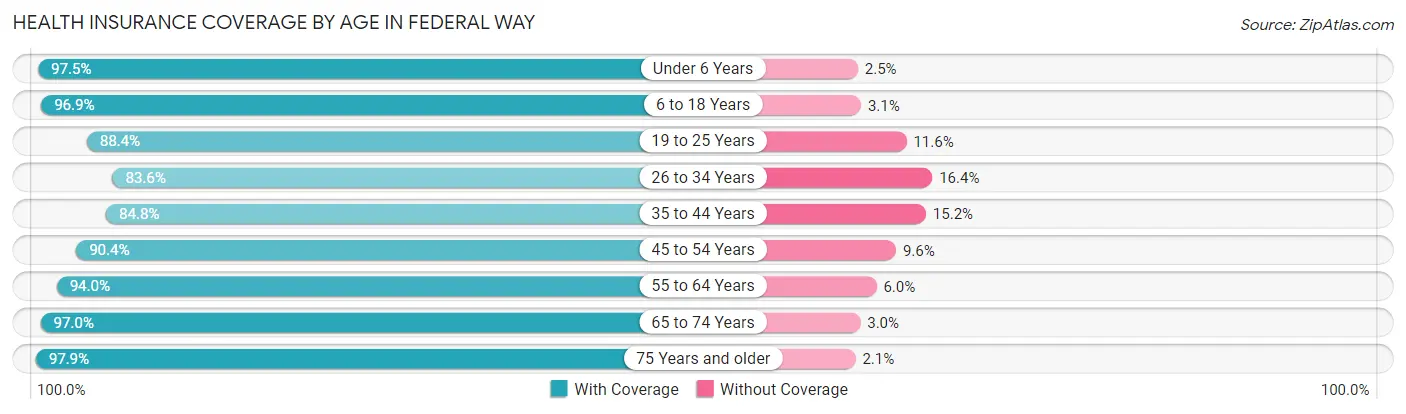
| Age Bracket | With Coverage | Without Coverage |
| Under 6 Years | 8,041 (97.5%) | 209 (2.5%) |
| 6 to 18 Years | 15,553 (96.9%) | 499 (3.1%) |
| 19 to 25 Years | 7,910 (88.4%) | 1,038 (11.6%) |
| 26 to 34 Years | 10,967 (83.6%) | 2,151 (16.4%) |
| 35 to 44 Years | 11,104 (84.8%) | 1,994 (15.2%) |
| 45 to 54 Years | 10,579 (90.4%) | 1,128 (9.6%) |
| 55 to 64 Years | 13,218 (94.0%) | 843 (6.0%) |
| 65 to 74 Years | 8,151 (97.0%) | 250 (3.0%) |
| 75 Years and older | 5,117 (97.9%) | 109 (2.1%) |
| Total | 90,640 (91.7%) | 8,221 (8.3%) |
Health Insurance Coverage by Citizenship Status in Federal Way
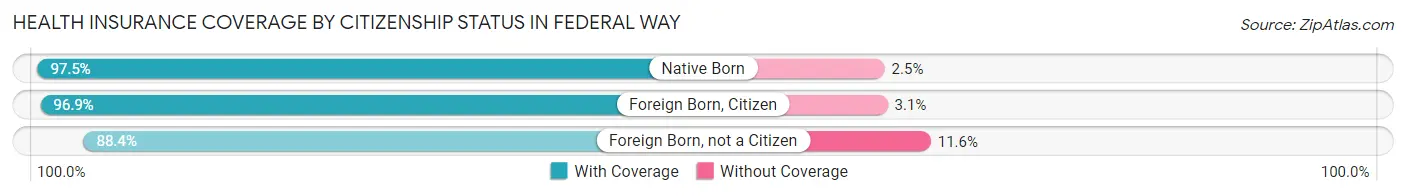
| Citizenship Status | With Coverage | Without Coverage |
| Native Born | 8,041 (97.5%) | 209 (2.5%) |
| Foreign Born, Citizen | 15,553 (96.9%) | 499 (3.1%) |
| Foreign Born, not a Citizen | 7,910 (88.4%) | 1,038 (11.6%) |
Health Insurance Coverage by Household Income in Federal Way
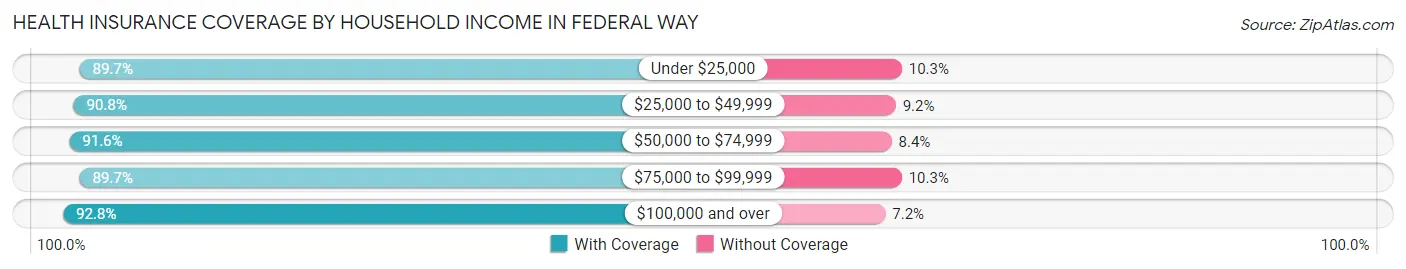
| Household Income | With Coverage | Without Coverage |
| Under $25,000 | 7,793 (89.7%) | 895 (10.3%) |
| $25,000 to $49,999 | 11,692 (90.8%) | 1,181 (9.2%) |
| $50,000 to $74,999 | 15,489 (91.6%) | 1,419 (8.4%) |
| $75,000 to $99,999 | 11,527 (89.7%) | 1,322 (10.3%) |
| $100,000 and over | 43,656 (92.8%) | 3,397 (7.2%) |
Public vs Private Health Insurance Coverage by Age in Federal Way
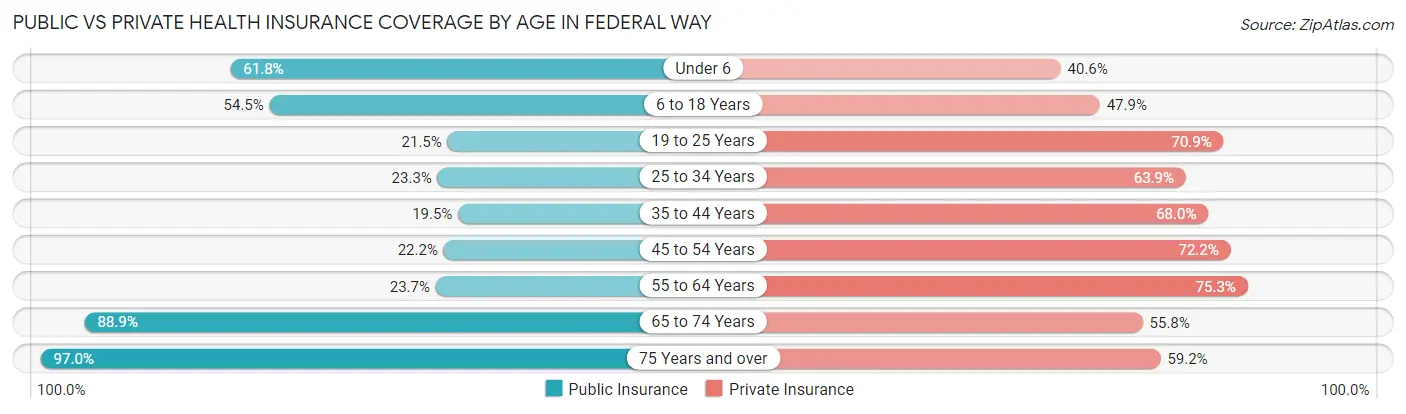
| Age Bracket | Public Insurance | Private Insurance |
| Under 6 | 5,098 (61.8%) | 3,351 (40.6%) |
| 6 to 18 Years | 8,753 (54.5%) | 7,685 (47.9%) |
| 19 to 25 Years | 1,922 (21.5%) | 6,340 (70.9%) |
| 25 to 34 Years | 3,060 (23.3%) | 8,376 (63.8%) |
| 35 to 44 Years | 2,557 (19.5%) | 8,908 (68.0%) |
| 45 to 54 Years | 2,599 (22.2%) | 8,447 (72.2%) |
| 55 to 64 Years | 3,330 (23.7%) | 10,592 (75.3%) |
| 65 to 74 Years | 7,467 (88.9%) | 4,690 (55.8%) |
| 75 Years and over | 5,070 (97.0%) | 3,091 (59.2%) |
| Total | 39,856 (40.3%) | 61,480 (62.2%) |
Disability Status by Sex by Age in Federal Way
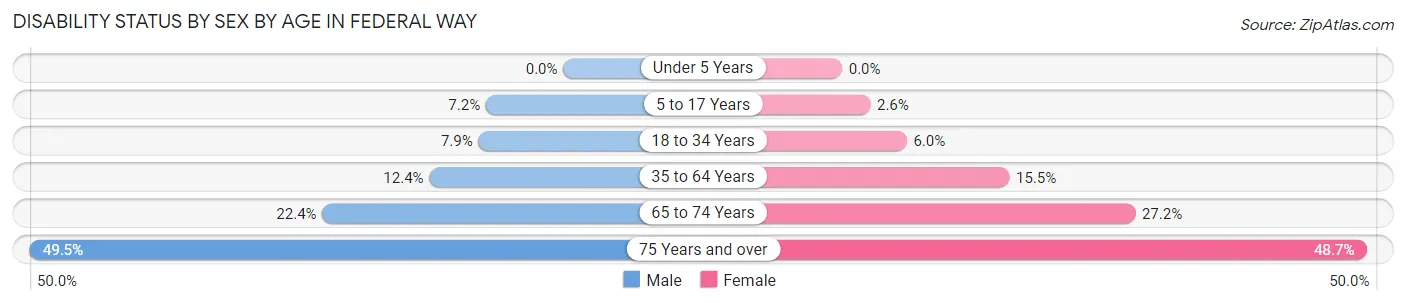
| Age Bracket | Male | Female |
| Under 5 Years | 0 (0.0%) | 0 (0.0%) |
| 5 to 17 Years | 561 (7.2%) | 216 (2.6%) |
| 18 to 34 Years | 989 (7.9%) | 650 (6.0%) |
| 35 to 64 Years | 2,437 (12.4%) | 2,990 (15.5%) |
| 65 to 74 Years | 886 (22.4%) | 1,208 (27.2%) |
| 75 Years and over | 1,155 (49.5%) | 1,408 (48.7%) |
Disability Class by Sex by Age in Federal Way
Disability Class: Hearing Difficulty
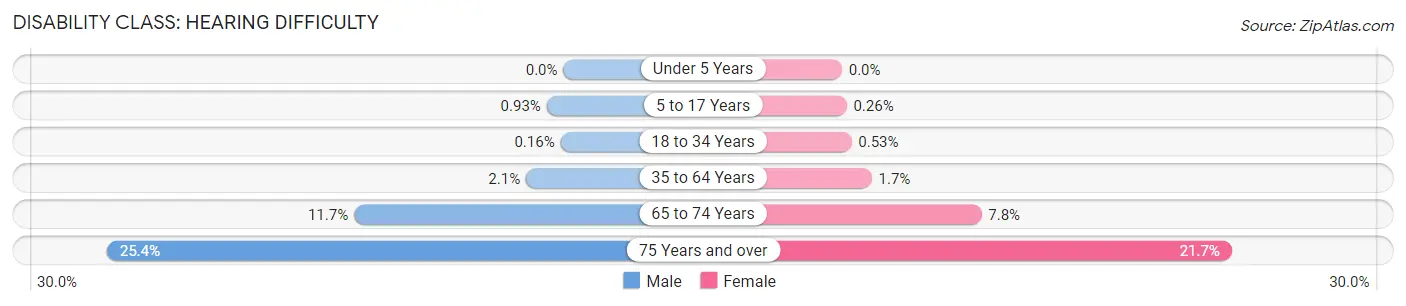
| Age Bracket | Male | Female |
| Under 5 Years | 0 (0.0%) | 0 (0.0%) |
| 5 to 17 Years | 73 (0.9%) | 21 (0.3%) |
| 18 to 34 Years | 20 (0.2%) | 57 (0.5%) |
| 35 to 64 Years | 407 (2.1%) | 319 (1.7%) |
| 65 to 74 Years | 462 (11.7%) | 345 (7.8%) |
| 75 Years and over | 593 (25.4%) | 628 (21.7%) |
Disability Class: Vision Difficulty
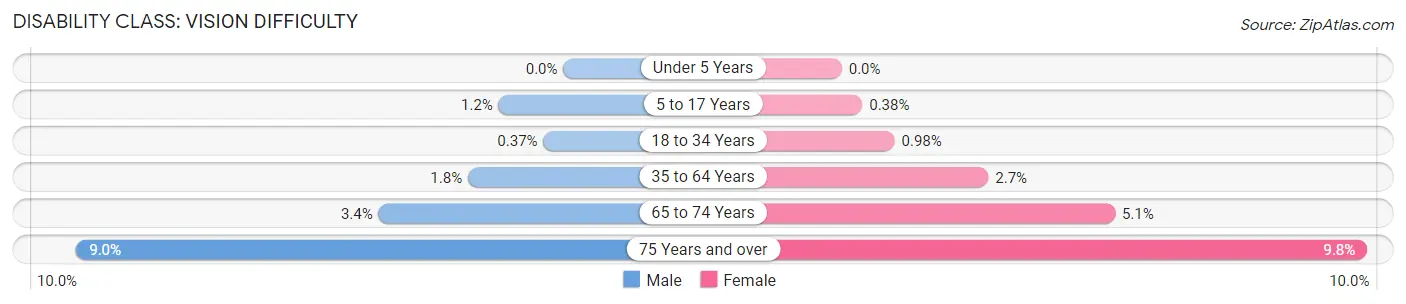
| Age Bracket | Male | Female |
| Under 5 Years | 0 (0.0%) | 0 (0.0%) |
| 5 to 17 Years | 94 (1.2%) | 31 (0.4%) |
| 18 to 34 Years | 46 (0.4%) | 106 (1.0%) |
| 35 to 64 Years | 348 (1.8%) | 523 (2.7%) |
| 65 to 74 Years | 136 (3.4%) | 225 (5.1%) |
| 75 Years and over | 211 (9.0%) | 282 (9.8%) |
Disability Class: Cognitive Difficulty
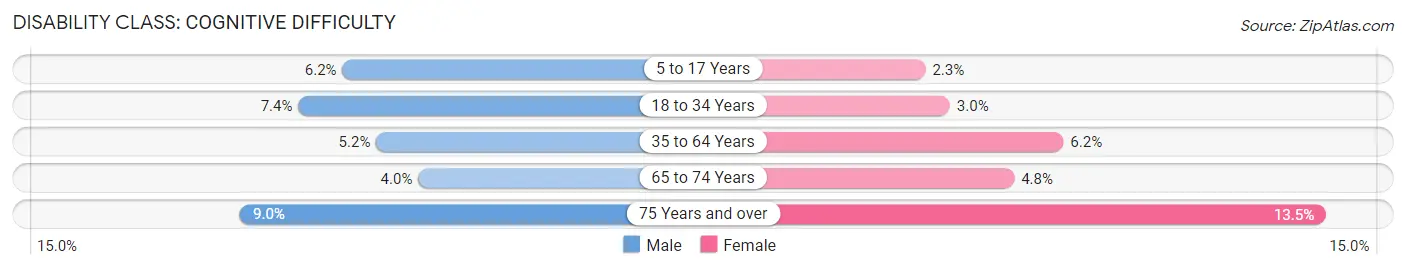
| Age Bracket | Male | Female |
| 5 to 17 Years | 481 (6.1%) | 192 (2.3%) |
| 18 to 34 Years | 927 (7.4%) | 326 (3.0%) |
| 35 to 64 Years | 1,022 (5.2%) | 1,187 (6.2%) |
| 65 to 74 Years | 160 (4.0%) | 213 (4.8%) |
| 75 Years and over | 210 (9.0%) | 390 (13.5%) |
Disability Class: Ambulatory Difficulty
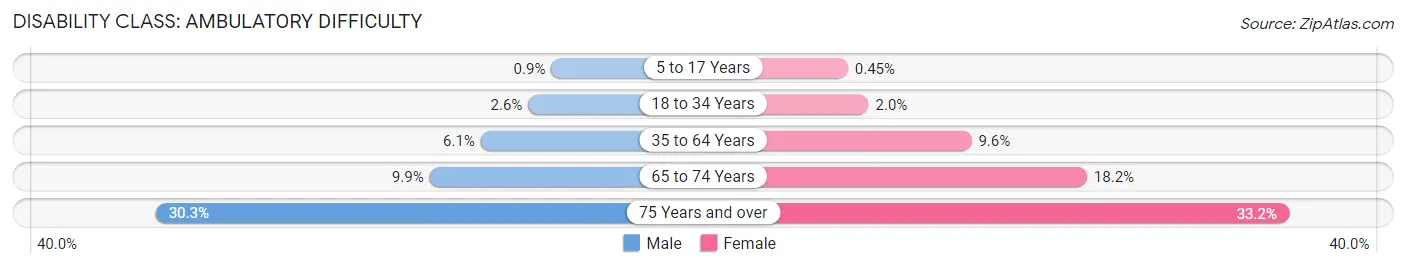
| Age Bracket | Male | Female |
| 5 to 17 Years | 70 (0.9%) | 37 (0.4%) |
| 18 to 34 Years | 328 (2.6%) | 216 (2.0%) |
| 35 to 64 Years | 1,205 (6.1%) | 1,855 (9.6%) |
| 65 to 74 Years | 394 (9.9%) | 808 (18.2%) |
| 75 Years and over | 706 (30.3%) | 960 (33.2%) |
Disability Class: Self-Care Difficulty
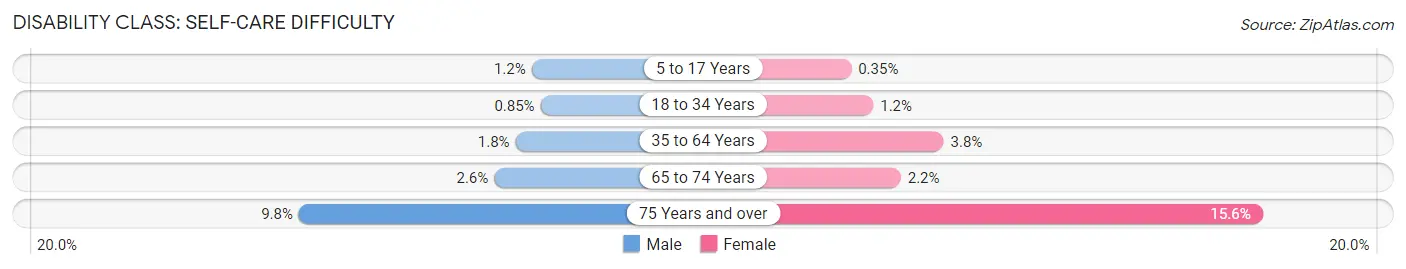
| Age Bracket | Male | Female |
| 5 to 17 Years | 92 (1.2%) | 29 (0.4%) |
| 18 to 34 Years | 107 (0.9%) | 127 (1.2%) |
| 35 to 64 Years | 350 (1.8%) | 727 (3.8%) |
| 65 to 74 Years | 102 (2.6%) | 97 (2.2%) |
| 75 Years and over | 229 (9.8%) | 452 (15.6%) |
Technology Access in Federal Way
Computing Device Access in Federal Way
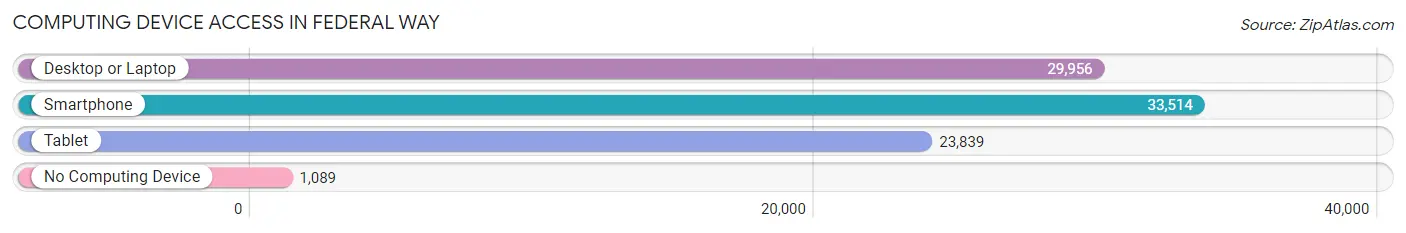
| Device Type | # Households | % Households |
| Desktop or Laptop | 29,956 | 82.4% |
| Smartphone | 33,514 | 92.2% |
| Tablet | 23,839 | 65.6% |
| No Computing Device | 1,089 | 3.0% |
| Total | 36,354 | 100.0% |
Internet Access in Federal Way
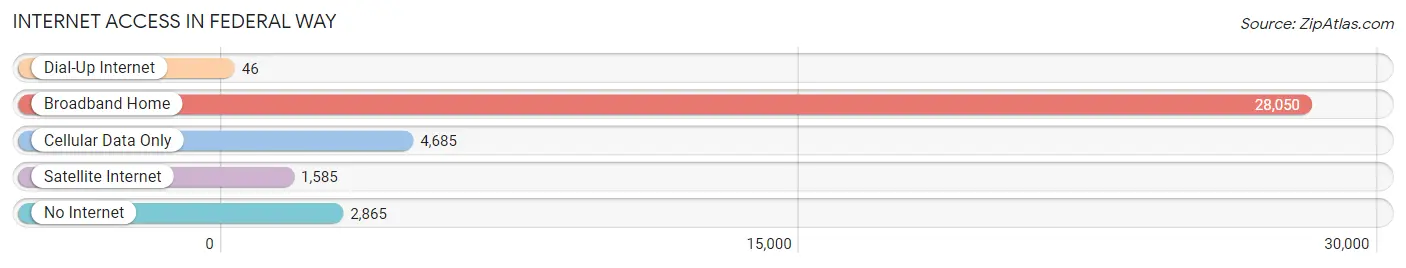
| Internet Type | # Households | % Households |
| Dial-Up Internet | 46 | 0.1% |
| Broadband Home | 28,050 | 77.2% |
| Cellular Data Only | 4,685 | 12.9% |
| Satellite Internet | 1,585 | 4.4% |
| No Internet | 2,865 | 7.9% |
| Total | 36,354 | 100.0% |
Federal Way Summary
History
The area now known as Federal Way, Washington was originally inhabited by the Muckleshoot and Nisqually Native American tribes. The first European settlers arrived in the area in the late 1800s, and the area was officially incorporated as a city in 1990.
The city of Federal Way was named after the Federal Highway Act of 1925, which provided funding for the construction of a highway connecting Seattle and Tacoma. The highway, now known as Pacific Highway South, was completed in 1927 and provided a direct route between the two cities.
The city of Federal Way was officially incorporated in 1990, and has since grown to become the ninth largest city in Washington State. The city is located in King County, and is bordered by the cities of Tacoma, Auburn, Des Moines, and Kent.
Geography
Federal Way is located in the Puget Sound region of Washington State, approximately 20 miles south of Seattle and 30 miles north of Tacoma. The city is situated on the western shore of Puget Sound, and is bordered by the cities of Tacoma, Auburn, Des Moines, and Kent.
The city has a total area of 21.6 square miles, of which 20.7 square miles is land and 0.9 square miles is water. The city is located at an elevation of approximately 200 feet above sea level.
The city is located in a temperate climate zone, with mild winters and warm summers. The average annual temperature is approximately 54 degrees Fahrenheit, with an average high of 68 degrees Fahrenheit in the summer and an average low of 40 degrees Fahrenheit in the winter.
Economy
The economy of Federal Way is largely based on the service industry, with the largest employers in the city being the Federal Way Public Schools, Weyerhaeuser, and the City of Federal Way. Other major employers in the city include the Boeing Company, St. Francis Hospital, and the Highline Medical Center.
The city also has a thriving retail sector, with the largest shopping mall in the city being the Commons at Federal Way. The mall is home to over 100 stores and restaurants, and is the largest shopping center in the Puget Sound region.
Demographics
As of the 2010 census, the population of Federal Way was 89,306, with a population density of 4,200 people per square mile. The racial makeup of the city was 57.2% White, 16.3% Asian, 11.2% African American, 0.7% Native American, 0.3% Pacific Islander, and 13.5% from other races.
The median household income in Federal Way was $60,945, and the median family income was $68,945. The per capita income in the city was $27,845. Approximately 17.2% of the population was below the poverty line.
The largest age group in Federal Way was 25-44, making up 33.2% of the population. The second largest age group was 45-64, making up 28.2% of the population. The median age in the city was 36.7 years.
Common Questions
What is Per Capita Income in Federal Way?
Per Capita income in Federal Way is $37,674.
What is the Median Family Income in Federal Way?
Median Family Income in Federal Way is $93,141.
What is the Median Household income in Federal Way?
Median Household Income in Federal Way is $80,360.
What is Income or Wage Gap in Federal Way?
Income or Wage Gap in Federal Way is 26.5%.
Women in Federal Way earn 73.5 cents for every dollar earned by a man.
What is Family Income Deficit in Federal Way?
Family Income Deficit in Federal Way is $11,153.
Families that are below poverty line in Federal Way earn $11,153 less on average than the poverty threshold level.
What is Inequality or Gini Index in Federal Way?
Inequality or Gini Index in Federal Way is 0.42.
What is the Total Population of Federal Way?
Total Population of Federal Way is 99,614.
What is the Total Male Population of Federal Way?
Total Male Population of Federal Way is 50,519.
What is the Total Female Population of Federal Way?
Total Female Population of Federal Way is 49,095.
What is the Ratio of Males per 100 Females in Federal Way?
There are 102.90 Males per 100 Females in Federal Way.
What is the Ratio of Females per 100 Males in Federal Way?
There are 97.18 Females per 100 Males in Federal Way.
What is the Median Population Age in Federal Way?
Median Population Age in Federal Way is 37.4 Years.
What is the Average Family Size in Federal Way
Average Family Size in Federal Way is 3.3 People.
What is the Average Household Size in Federal Way
Average Household Size in Federal Way is 2.7 People.
How Large is the Labor Force in Federal Way?
There are 52,264 People in the Labor Forcein in Federal Way.
What is the Percentage of People in the Labor Force in Federal Way?
65.7% of People are in the Labor Force in Federal Way.
What is the Unemployment Rate in Federal Way?
Unemployment Rate in Federal Way is 5.5%.