Lacey, WA Map & Demographics
Lacey Map
Lacey Overview
$37,663
PER CAPITA INCOME
$100,392
AVG FAMILY INCOME
$79,874
AVG HOUSEHOLD INCOME
15.1%
WAGE / INCOME GAP [ % ]
84.9¢/ $1
WAGE / INCOME GAP [ $ ]
$12,344
FAMILY INCOME DEFICIT
0.38
INEQUALITY / GINI INDEX
56,263
TOTAL POPULATION
27,681
MALE POPULATION
28,582
FEMALE POPULATION
96.85
MALES / 100 FEMALES
103.25
FEMALES / 100 MALES
36.5
MEDIAN AGE
3.0
AVG FAMILY SIZE
2.5
AVG HOUSEHOLD SIZE
28,264
LABOR FORCE [ PEOPLE ]
62.5%
PERCENT IN LABOR FORCE
5.4%
UNEMPLOYMENT RATE
Lacey Zip Codes
Lacey Area Codes
Income in Lacey
Income Overview in Lacey
Per Capita Income in Lacey is $37,663, while median incomes of families and households are $100,392 and $79,874 respectively.
| Characteristic | Number | Measure |
| Per Capita Income | 56,263 | $37,663 |
| Median Family Income | 14,346 | $100,392 |
| Mean Family Income | 14,346 | $106,787 |
| Median Household Income | 22,256 | $79,874 |
| Mean Household Income | 22,256 | $94,038 |
| Income Deficit | 14,346 | $12,344 |
| Wage / Income Gap (%) | 56,263 | 15.13% |
| Wage / Income Gap ($) | 56,263 | 84.87¢ per $1 |
| Gini / Inequality Index | 56,263 | 0.38 |
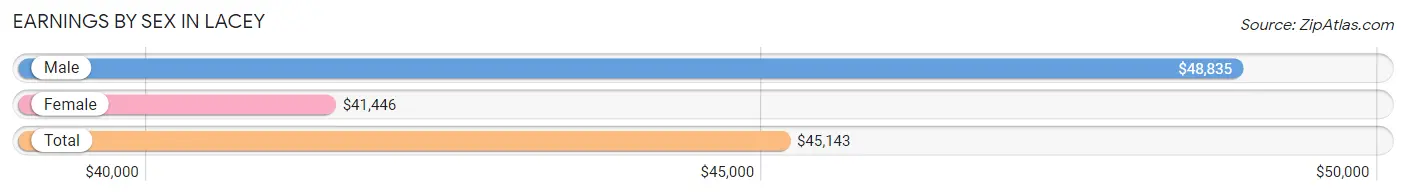
Earnings by Sex in Lacey
Average Earnings in Lacey are $45,143, $48,835 for men and $41,446 for women, a difference of 15.1%.
| Sex | Number | Average Earnings |
| Male | 14,954 (51.4%) | $48,835 |
| Female | 14,142 (48.6%) | $41,446 |
| Total | 29,096 (100.0%) | $45,143 |
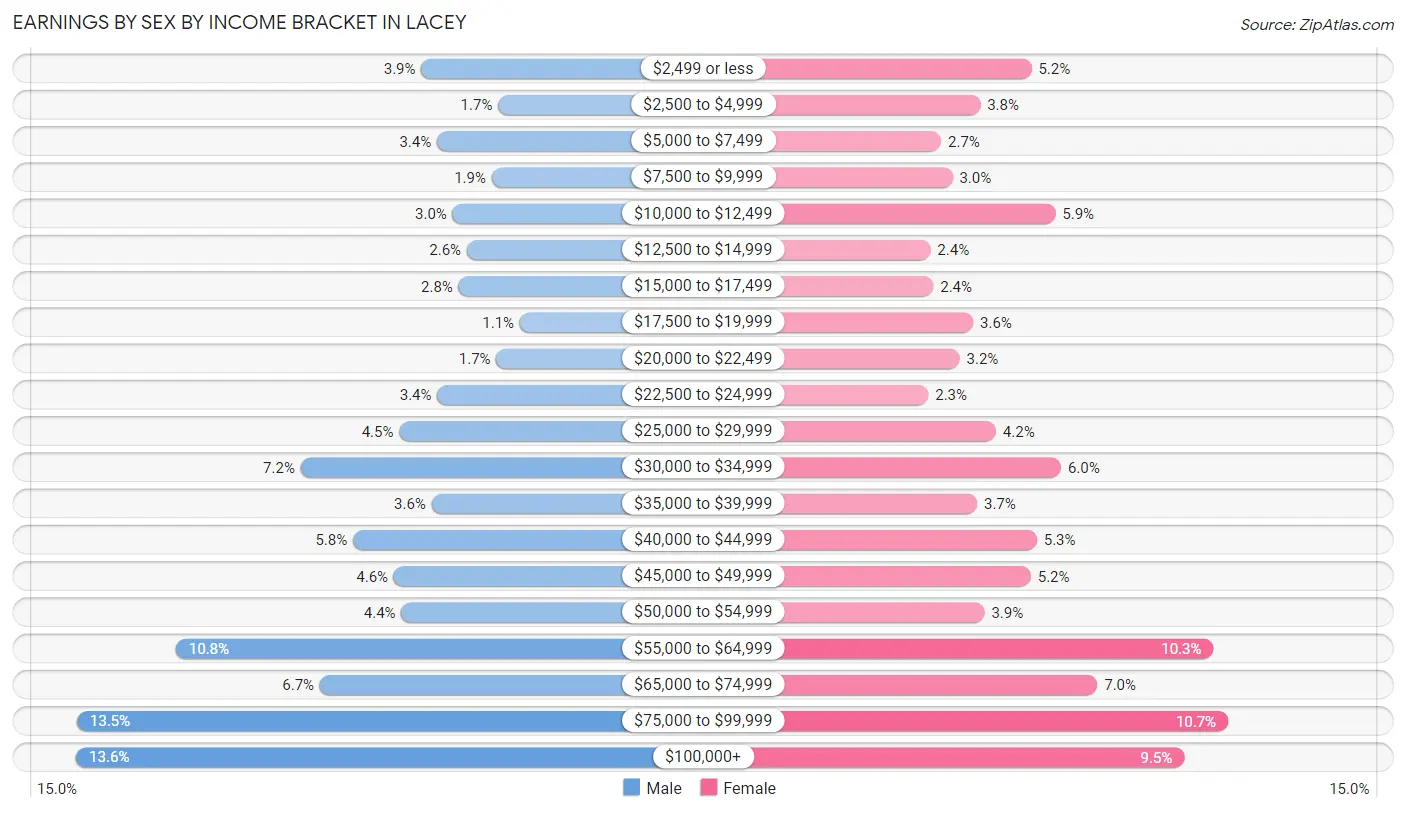
Earnings by Sex by Income Bracket in Lacey
The most common earnings brackets in Lacey are $100,000+ for men (2,027 | 13.6%) and $75,000 to $99,999 for women (1,514 | 10.7%).
| Income | Male | Female |
| $2,499 or less | 576 (3.8%) | 734 (5.2%) |
| $2,500 to $4,999 | 253 (1.7%) | 530 (3.7%) |
| $5,000 to $7,499 | 510 (3.4%) | 375 (2.6%) |
| $7,500 to $9,999 | 279 (1.9%) | 420 (3.0%) |
| $10,000 to $12,499 | 444 (3.0%) | 829 (5.9%) |
| $12,500 to $14,999 | 384 (2.6%) | 332 (2.4%) |
| $15,000 to $17,499 | 419 (2.8%) | 344 (2.4%) |
| $17,500 to $19,999 | 162 (1.1%) | 502 (3.5%) |
| $20,000 to $22,499 | 260 (1.7%) | 449 (3.2%) |
| $22,500 to $24,999 | 508 (3.4%) | 324 (2.3%) |
| $25,000 to $29,999 | 669 (4.5%) | 593 (4.2%) |
| $30,000 to $34,999 | 1,083 (7.2%) | 852 (6.0%) |
| $35,000 to $39,999 | 533 (3.6%) | 518 (3.7%) |
| $40,000 to $44,999 | 863 (5.8%) | 755 (5.3%) |
| $45,000 to $49,999 | 691 (4.6%) | 731 (5.2%) |
| $50,000 to $54,999 | 660 (4.4%) | 548 (3.9%) |
| $55,000 to $64,999 | 1,608 (10.7%) | 1,457 (10.3%) |
| $65,000 to $74,999 | 1,002 (6.7%) | 995 (7.0%) |
| $75,000 to $99,999 | 2,023 (13.5%) | 1,514 (10.7%) |
| $100,000+ | 2,027 (13.6%) | 1,340 (9.5%) |
| Total | 14,954 (100.0%) | 14,142 (100.0%) |
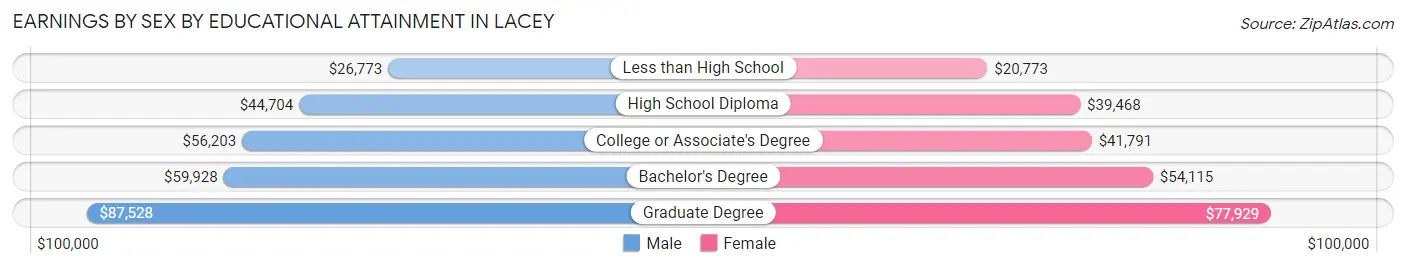
Earnings by Sex by Educational Attainment in Lacey
Average earnings in Lacey are $56,181 for men and $47,182 for women, a difference of 16.0%. Men with an educational attainment of graduate degree enjoy the highest average annual earnings of $87,528, while those with less than high school education earn the least with $26,773. Women with an educational attainment of graduate degree earn the most with the average annual earnings of $77,929, while those with less than high school education have the smallest earnings of $20,773.
| Educational Attainment | Male Income | Female Income |
| Less than High School | $26,773 | $20,773 |
| High School Diploma | $44,704 | $39,468 |
| College or Associate's Degree | $56,203 | $41,791 |
| Bachelor's Degree | $59,928 | $54,115 |
| Graduate Degree | $87,528 | $77,929 |
| Total | $56,181 | $47,182 |
Family Income in Lacey
Family Income Brackets in Lacey
According to the Lacey family income data, there are 4,160 families falling into the $100,000 to $149,999 income range, which is the most common income bracket and makes up 29.0% of all families. Conversely, the $10,000 to $14,999 income bracket is the least frequent group with only 72 families (0.5%) belonging to this category.
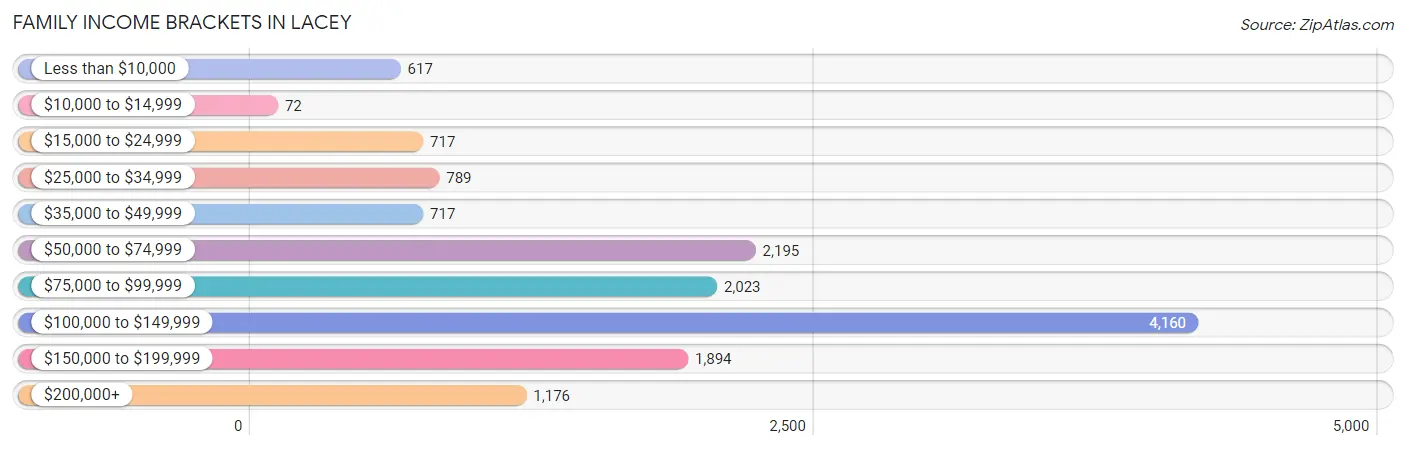
| Income Bracket | # Families | % Families |
| Less than $10,000 | 617 | 4.3% |
| $10,000 to $14,999 | 72 | 0.5% |
| $15,000 to $24,999 | 717 | 5.0% |
| $25,000 to $34,999 | 789 | 5.5% |
| $35,000 to $49,999 | 717 | 5.0% |
| $50,000 to $74,999 | 2,195 | 15.3% |
| $75,000 to $99,999 | 2,023 | 14.1% |
| $100,000 to $149,999 | 4,160 | 29.0% |
| $150,000 to $199,999 | 1,894 | 13.2% |
| $200,000+ | 1,176 | 8.2% |
Family Income by Famaliy Size in Lacey
7+ person families (136 | 0.9%) account for the highest median family income in Lacey with $170,729 per family, while 2-person families (6,951 | 48.4%) have the highest median income of $48,158 per family member.
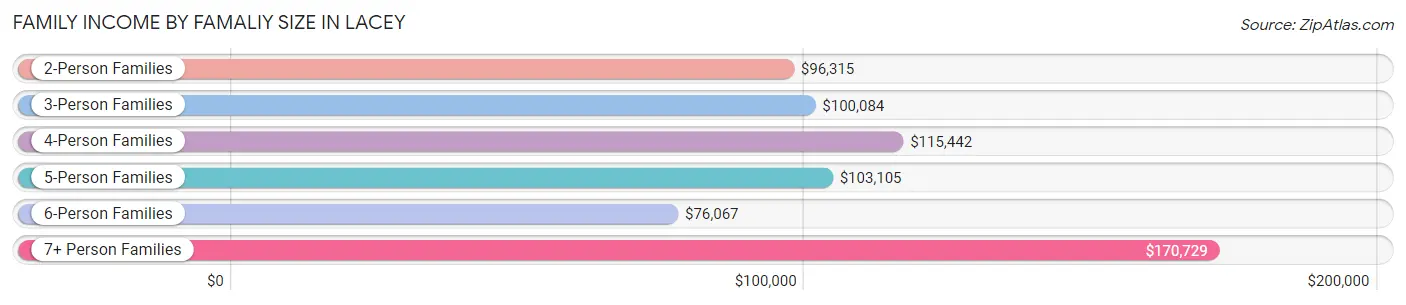
| Income Bracket | # Families | Median Income |
| 2-Person Families | 6,951 (48.4%) | $96,315 |
| 3-Person Families | 3,565 (24.8%) | $100,084 |
| 4-Person Families | 2,314 (16.1%) | $115,442 |
| 5-Person Families | 807 (5.6%) | $103,105 |
| 6-Person Families | 573 (4.0%) | $76,067 |
| 7+ Person Families | 136 (0.9%) | $170,729 |
| Total | 14,346 (100.0%) | $100,392 |
Family Income by Number of Earners in Lacey
The median family income in Lacey is $100,392, with families comprising 3+ earners (1,410) having the highest median family income of $129,167, while families with no earners (2,348) have the lowest median family income of $64,750, accounting for 9.8% and 16.4% of families, respectively.
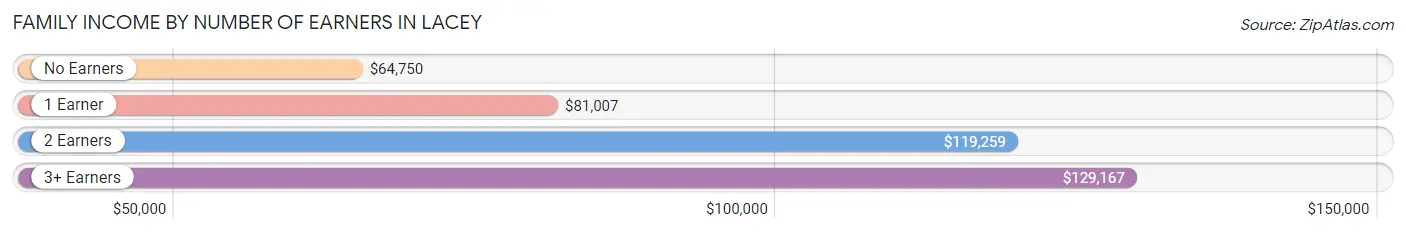
| Number of Earners | # Families | Median Income |
| No Earners | 2,348 (16.4%) | $64,750 |
| 1 Earner | 5,189 (36.2%) | $81,007 |
| 2 Earners | 5,399 (37.6%) | $119,259 |
| 3+ Earners | 1,410 (9.8%) | $129,167 |
| Total | 14,346 (100.0%) | $100,392 |
Household Income in Lacey
Household Income Brackets in Lacey
With 4,963 households falling in the category, the $100,000 to $149,999 income range is the most frequent in Lacey, accounting for 22.3% of all households. In contrast, only 245 households (1.1%) fall into the $10,000 to $14,999 income bracket, making it the least populous group.
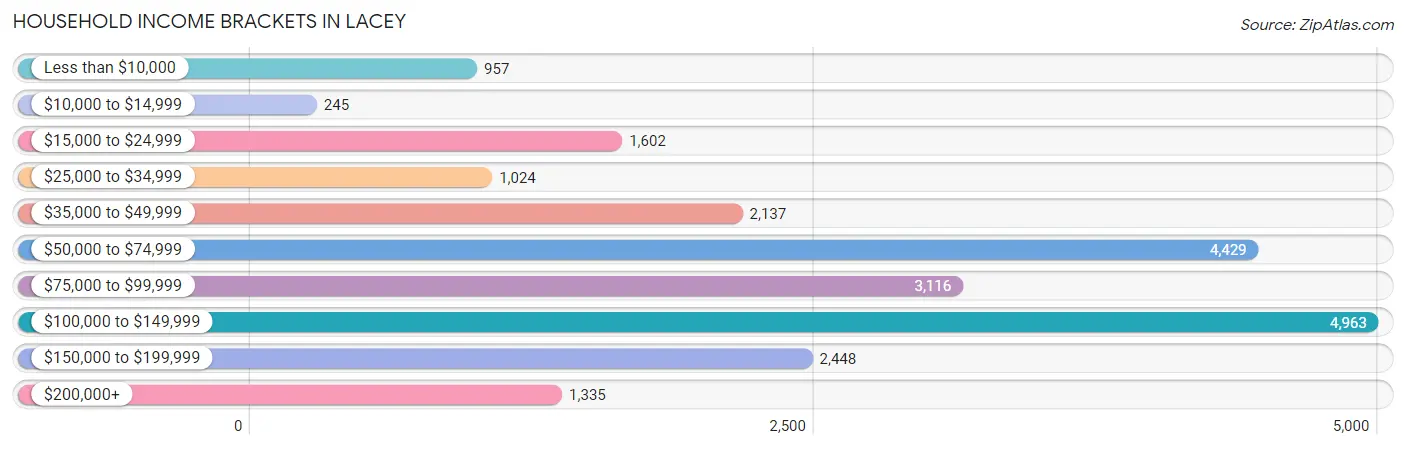
| Income Bracket | # Households | % Households |
| Less than $10,000 | 957 | 4.3% |
| $10,000 to $14,999 | 245 | 1.1% |
| $15,000 to $24,999 | 1,602 | 7.2% |
| $25,000 to $34,999 | 1,024 | 4.6% |
| $35,000 to $49,999 | 2,137 | 9.6% |
| $50,000 to $74,999 | 4,429 | 19.9% |
| $75,000 to $99,999 | 3,116 | 14.0% |
| $100,000 to $149,999 | 4,963 | 22.3% |
| $150,000 to $199,999 | 2,448 | 11.0% |
| $200,000+ | 1,335 | 6.0% |
Household Income by Householder Age in Lacey
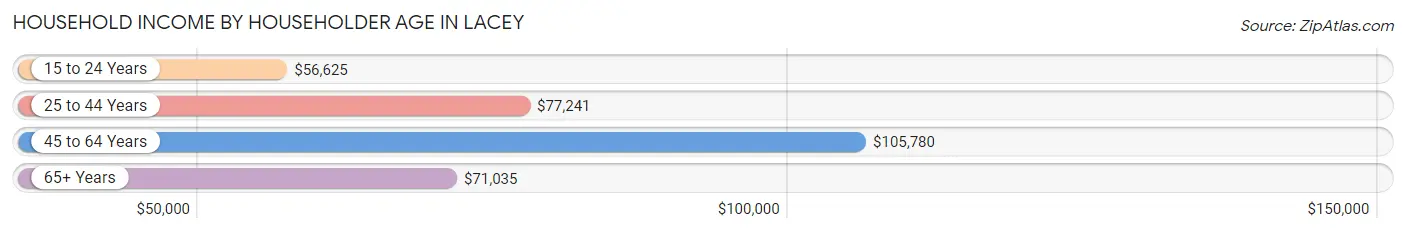
The median household income in Lacey is $79,874, with the highest median household income of $105,780 found in the 45 to 64 years age bracket for the primary householder. A total of 6,486 households (29.1%) fall into this category. Meanwhile, the 15 to 24 years age bracket for the primary householder has the lowest median household income of $56,625, with 1,072 households (4.8%) in this group.
| Income Bracket | # Households | Median Income |
| 15 to 24 Years | 1,072 (4.8%) | $56,625 |
| 25 to 44 Years | 8,707 (39.1%) | $77,241 |
| 45 to 64 Years | 6,486 (29.1%) | $105,780 |
| 65+ Years | 5,991 (26.9%) | $71,035 |
| Total | 22,256 (100.0%) | $79,874 |
Poverty in Lacey
Income Below Poverty by Sex and Age in Lacey
With 9.4% poverty level for males and 12.3% for females among the residents of Lacey, 12 to 14 year old males and 5 year old females are the most vulnerable to poverty, with 262 males (20.6%) and 87 females (35.8%) in their respective age groups living below the poverty level.
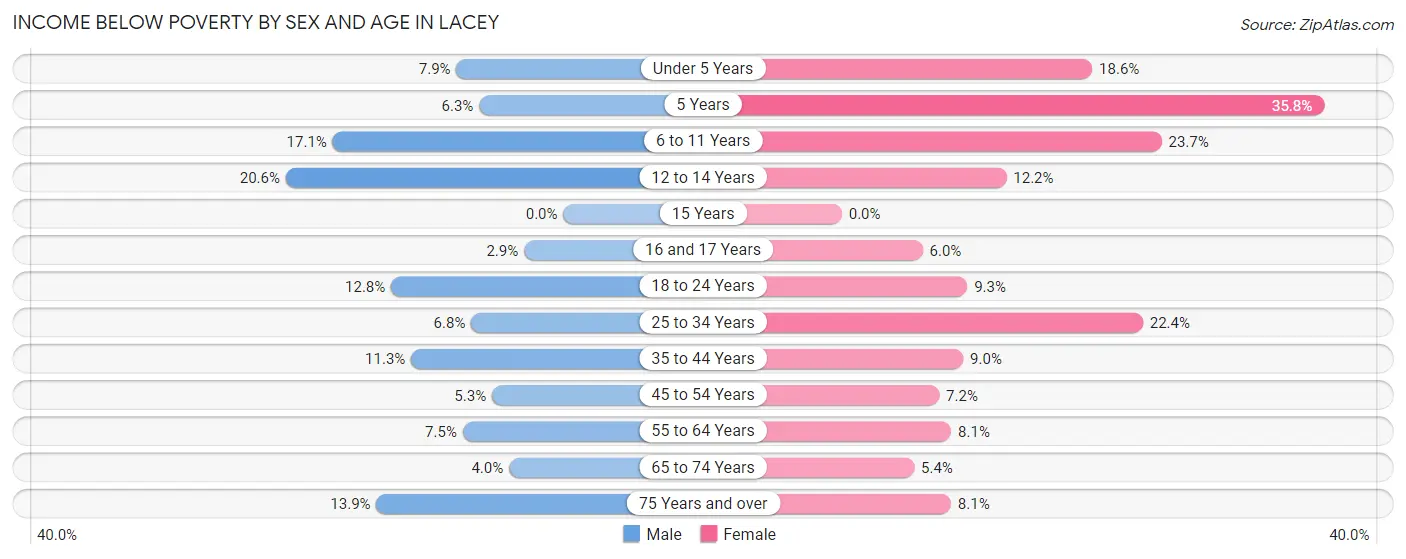
| Age Bracket | Male | Female |
| Under 5 Years | 171 (7.9%) | 229 (18.6%) |
| 5 Years | 24 (6.2%) | 87 (35.8%) |
| 6 to 11 Years | 354 (17.1%) | 512 (23.7%) |
| 12 to 14 Years | 262 (20.6%) | 109 (12.2%) |
| 15 Years | 0 (0.0%) | 0 (0.0%) |
| 16 and 17 Years | 18 (2.9%) | 27 (6.0%) |
| 18 to 24 Years | 317 (12.8%) | 225 (9.3%) |
| 25 to 34 Years | 325 (6.8%) | 1,088 (22.4%) |
| 35 to 44 Years | 416 (11.3%) | 342 (9.0%) |
| 45 to 54 Years | 144 (5.3%) | 225 (7.2%) |
| 55 to 64 Years | 215 (7.5%) | 246 (8.1%) |
| 65 to 74 Years | 104 (4.0%) | 162 (5.4%) |
| 75 Years and over | 205 (13.9%) | 207 (8.1%) |
| Total | 2,555 (9.4%) | 3,459 (12.3%) |
Income Above Poverty by Sex and Age in Lacey
According to the poverty statistics in Lacey, males aged 15 years and females aged 15 years are the age groups that are most secure financially, with 100.0% of males and 100.0% of females in these age groups living above the poverty line.
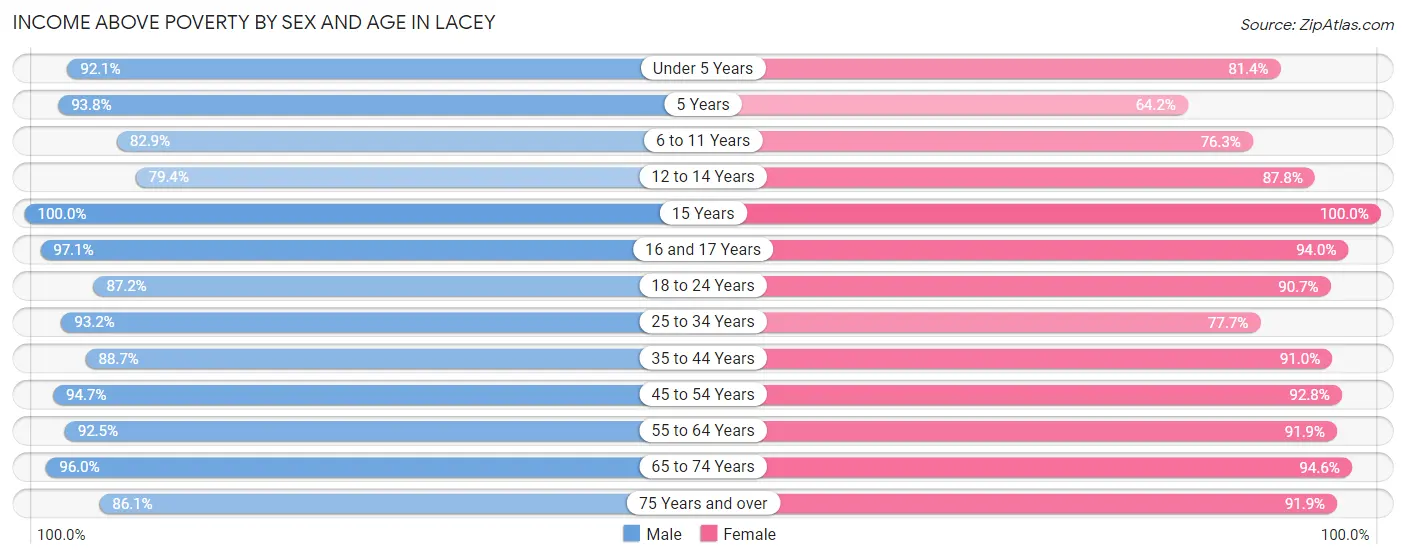
| Age Bracket | Male | Female |
| Under 5 Years | 1,984 (92.1%) | 1,003 (81.4%) |
| 5 Years | 360 (93.8%) | 156 (64.2%) |
| 6 to 11 Years | 1,712 (82.9%) | 1,645 (76.3%) |
| 12 to 14 Years | 1,009 (79.4%) | 783 (87.8%) |
| 15 Years | 202 (100.0%) | 264 (100.0%) |
| 16 and 17 Years | 599 (97.1%) | 423 (94.0%) |
| 18 to 24 Years | 2,162 (87.2%) | 2,193 (90.7%) |
| 25 to 34 Years | 4,423 (93.2%) | 3,780 (77.6%) |
| 35 to 44 Years | 3,264 (88.7%) | 3,452 (91.0%) |
| 45 to 54 Years | 2,573 (94.7%) | 2,887 (92.8%) |
| 55 to 64 Years | 2,664 (92.5%) | 2,782 (91.9%) |
| 65 to 74 Years | 2,478 (96.0%) | 2,852 (94.6%) |
| 75 Years and over | 1,272 (86.1%) | 2,349 (91.9%) |
| Total | 24,702 (90.6%) | 24,569 (87.7%) |
Income Below Poverty Among Married-Couple Families in Lacey
The poverty statistics for married-couple families in Lacey show that 5.0% or 522 of the total 10,375 families live below the poverty line. Families with 3 or 4 children have the highest poverty rate of 12.1%, comprising of 87 families. On the other hand, families with 5 or more children have the lowest poverty rate of 0.0%, which includes 0 families.
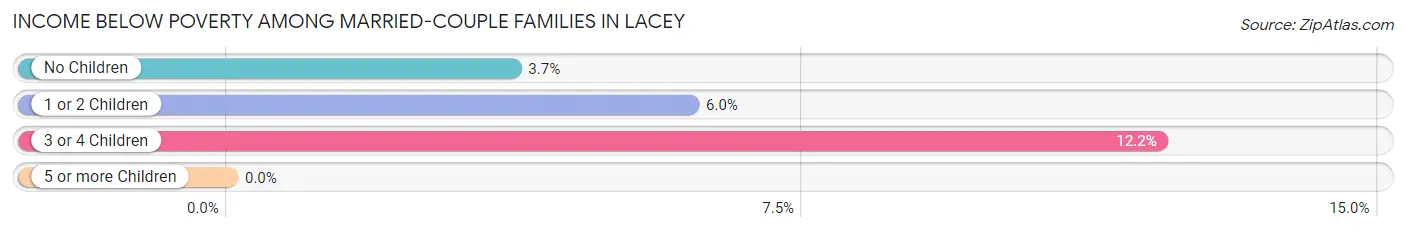
| Children | Above Poverty | Below Poverty |
| No Children | 6,017 (96.3%) | 231 (3.7%) |
| 1 or 2 Children | 3,182 (94.0%) | 204 (6.0%) |
| 3 or 4 Children | 629 (87.8%) | 87 (12.1%) |
| 5 or more Children | 25 (100.0%) | 0 (0.0%) |
| Total | 9,853 (95.0%) | 522 (5.0%) |
Income Below Poverty Among Single-Parent Households in Lacey
According to the poverty data in Lacey, 12.6% or 144 single-father households and 20.0% or 565 single-mother households are living below the poverty line. Among single-father households, those with 1 or 2 children have the highest poverty rate, with 144 households (24.8%) experiencing poverty. Likewise, among single-mother households, those with 3 or 4 children have the highest poverty rate, with 237 households (74.1%) falling below the poverty line.
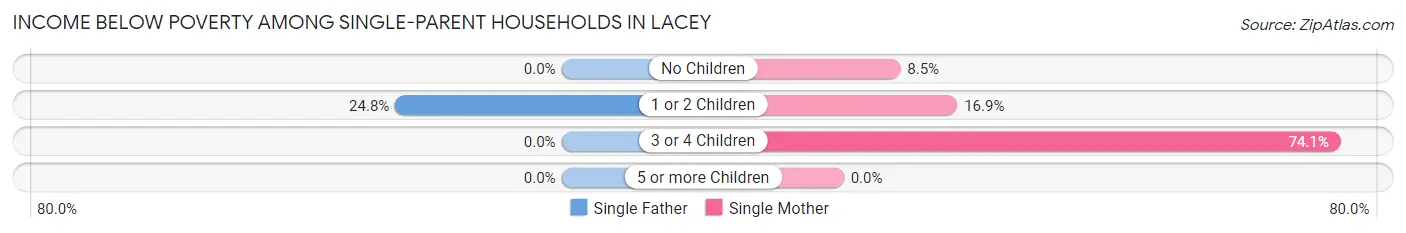
| Children | Single Father | Single Mother |
| No Children | 0 (0.0%) | 93 (8.5%) |
| 1 or 2 Children | 144 (24.8%) | 235 (16.9%) |
| 3 or 4 Children | 0 (0.0%) | 237 (74.1%) |
| 5 or more Children | 0 (0.0%) | 0 (0.0%) |
| Total | 144 (12.6%) | 565 (20.0%) |
Income Below Poverty Among Married-Couple vs Single-Parent Households in Lacey
The poverty data for Lacey shows that 522 of the married-couple family households (5.0%) and 709 of the single-parent households (17.8%) are living below the poverty level. Within the married-couple family households, those with 3 or 4 children have the highest poverty rate, with 87 households (12.1%) falling below the poverty line. Among the single-parent households, those with 3 or 4 children have the highest poverty rate, with 237 household (51.4%) living below poverty.
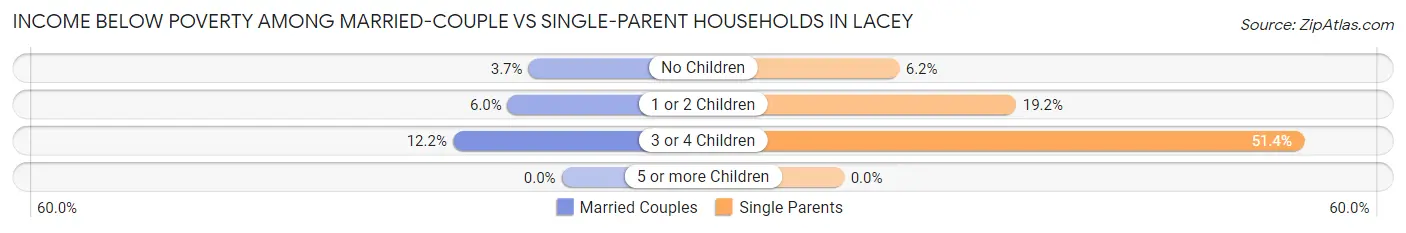
| Children | Married-Couple Families | Single-Parent Households |
| No Children | 231 (3.7%) | 93 (6.2%) |
| 1 or 2 Children | 204 (6.0%) | 379 (19.2%) |
| 3 or 4 Children | 87 (12.1%) | 237 (51.4%) |
| 5 or more Children | 0 (0.0%) | 0 (0.0%) |
| Total | 522 (5.0%) | 709 (17.8%) |
Race in Lacey
The most populous races in Lacey are White / Caucasian (38,441 | 68.3%), Hispanic or Latino (6,844 | 12.2%), and Two or more Races (6,586 | 11.7%).
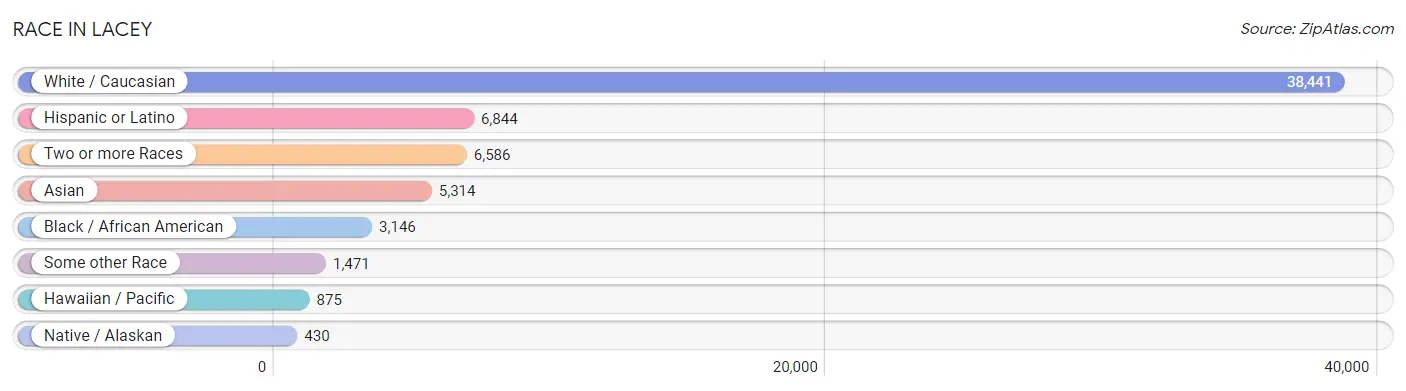
| Race | # Population | % Population |
| Asian | 5,314 | 9.4% |
| Black / African American | 3,146 | 5.6% |
| Hawaiian / Pacific | 875 | 1.6% |
| Hispanic or Latino | 6,844 | 12.2% |
| Native / Alaskan | 430 | 0.8% |
| White / Caucasian | 38,441 | 68.3% |
| Two or more Races | 6,586 | 11.7% |
| Some other Race | 1,471 | 2.6% |
| Total | 56,263 | 100.0% |
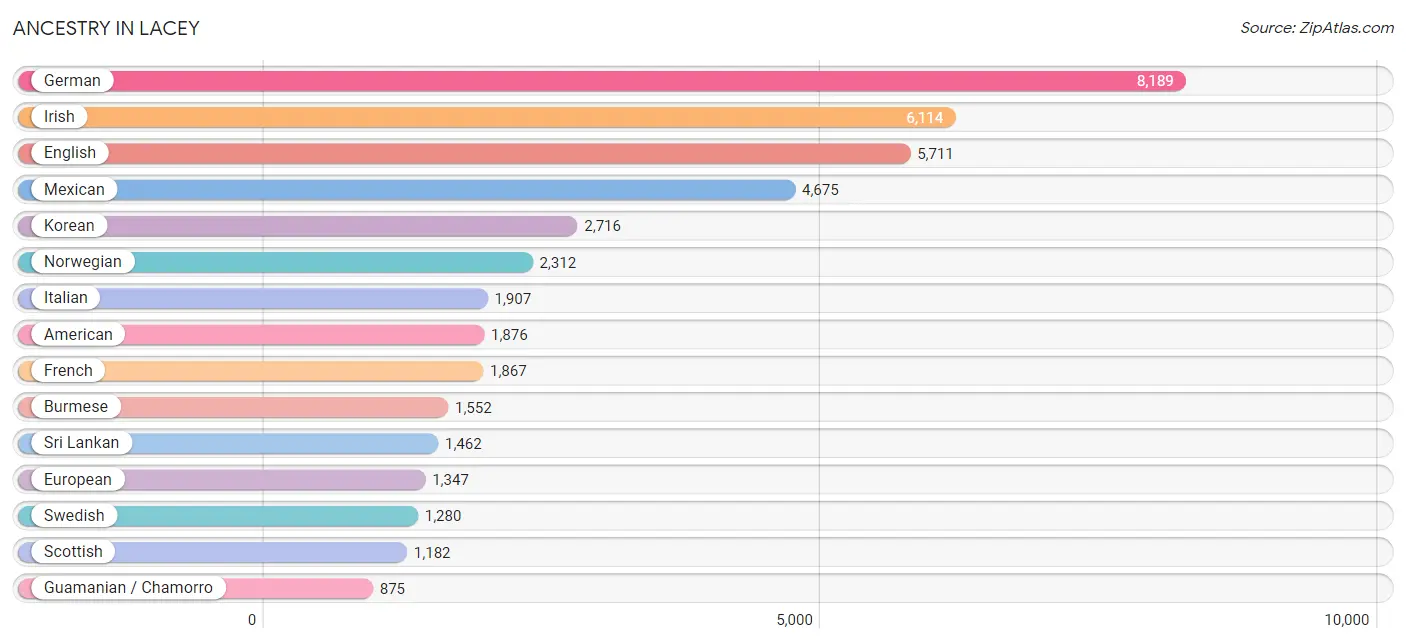
Ancestry in Lacey
The most populous ancestries reported in Lacey are German (8,189 | 14.5%), Irish (6,114 | 10.9%), English (5,711 | 10.2%), Mexican (4,675 | 8.3%), and Korean (2,716 | 4.8%), together accounting for 48.7% of all Lacey residents.
| Ancestry | # Population | % Population |
| Afghan | 58 | 0.1% |
| African | 368 | 0.6% |
| Alaska Native | 3 | 0.0% |
| Alaskan Athabascan | 72 | 0.1% |
| Albanian | 48 | 0.1% |
| Aleut | 11 | 0.0% |
| American | 1,876 | 3.3% |
| Arab | 234 | 0.4% |
| Armenian | 1 | 0.0% |
| Assyrian / Chaldean / Syriac | 4 | 0.0% |
| Australian | 16 | 0.0% |
| Austrian | 257 | 0.5% |
| Basque | 5 | 0.0% |
| Belgian | 11 | 0.0% |
| Bhutanese | 386 | 0.7% |
| Blackfeet | 56 | 0.1% |
| Bolivian | 33 | 0.1% |
| Brazilian | 161 | 0.3% |
| British | 683 | 1.2% |
| Burmese | 1,552 | 2.8% |
| Canadian | 114 | 0.2% |
| Celtic | 9 | 0.0% |
| Central American | 383 | 0.7% |
| Cherokee | 180 | 0.3% |
| Chippewa | 38 | 0.1% |
| Choctaw | 13 | 0.0% |
| Colombian | 132 | 0.2% |
| Cree | 50 | 0.1% |
| Creek | 8 | 0.0% |
| Cuban | 39 | 0.1% |
| Czech | 187 | 0.3% |
| Czechoslovakian | 46 | 0.1% |
| Danish | 236 | 0.4% |
| Dominican | 91 | 0.2% |
| Dutch | 739 | 1.3% |
| Eastern European | 183 | 0.3% |
| English | 5,711 | 10.2% |
| European | 1,347 | 2.4% |
| Fijian | 4 | 0.0% |
| Filipino | 17 | 0.0% |
| Finnish | 336 | 0.6% |
| French | 1,867 | 3.3% |
| French American Indian | 13 | 0.0% |
| French Canadian | 327 | 0.6% |
| German | 8,189 | 14.5% |
| German Russian | 45 | 0.1% |
| Greek | 302 | 0.5% |
| Guamanian / Chamorro | 875 | 1.6% |
| Guatemalan | 29 | 0.1% |
| Guyanese | 25 | 0.0% |
| Honduran | 41 | 0.1% |
| Hungarian | 176 | 0.3% |
| Icelander | 9 | 0.0% |
| Indian (Asian) | 563 | 1.0% |
| Inupiat | 11 | 0.0% |
| Irish | 6,114 | 10.9% |
| Iroquois | 25 | 0.0% |
| Italian | 1,907 | 3.4% |
| Jamaican | 72 | 0.1% |
| Japanese | 411 | 0.7% |
| Kenyan | 27 | 0.1% |
| Korean | 2,716 | 4.8% |
| Lebanese | 41 | 0.1% |
| Lithuanian | 106 | 0.2% |
| Luxembourger | 16 | 0.0% |
| Malaysian | 9 | 0.0% |
| Marshallese | 4 | 0.0% |
| Mexican | 4,675 | 8.3% |
| Moroccan | 47 | 0.1% |
| Native Hawaiian | 363 | 0.6% |
| Navajo | 21 | 0.0% |
| Nigerian | 51 | 0.1% |
| Northern European | 337 | 0.6% |
| Norwegian | 2,312 | 4.1% |
| Okinawan | 190 | 0.3% |
| Pakistani | 182 | 0.3% |
| Panamanian | 60 | 0.1% |
| Pennsylvania German | 50 | 0.1% |
| Peruvian | 4 | 0.0% |
| Polish | 825 | 1.5% |
| Portuguese | 162 | 0.3% |
| Puerto Rican | 680 | 1.2% |
| Puget Sound Salish | 195 | 0.4% |
| Romanian | 26 | 0.1% |
| Russian | 367 | 0.6% |
| Salvadoran | 253 | 0.4% |
| Samoan | 314 | 0.6% |
| Scandinavian | 597 | 1.1% |
| Scotch-Irish | 651 | 1.2% |
| Scottish | 1,182 | 2.1% |
| Sioux | 99 | 0.2% |
| Slavic | 15 | 0.0% |
| Slovak | 76 | 0.1% |
| South American | 275 | 0.5% |
| Spaniard | 416 | 0.7% |
| Spanish | 172 | 0.3% |
| Sri Lankan | 1,462 | 2.6% |
| Subsaharan African | 469 | 0.8% |
| Sudanese | 11 | 0.0% |
| Swedish | 1,280 | 2.3% |
| Swiss | 94 | 0.2% |
| Thai | 127 | 0.2% |
| Trinidadian and Tobagonian | 64 | 0.1% |
| Ukrainian | 48 | 0.1% |
| Uruguayan | 11 | 0.0% |
| Venezuelan | 95 | 0.2% |
| Welsh | 207 | 0.4% |
| West Indian | 87 | 0.2% | View All 108 Rows |
Immigrants in Lacey
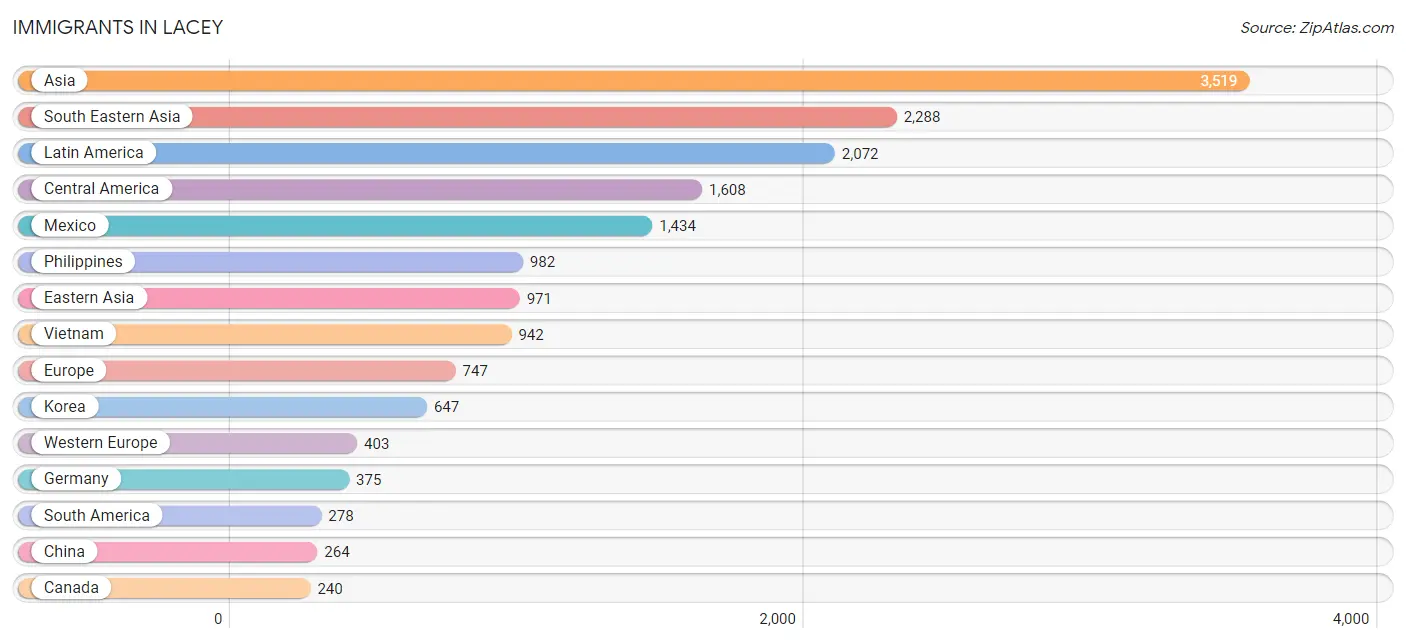
The most numerous immigrant groups reported in Lacey came from Asia (3,519 | 6.2%), South Eastern Asia (2,288 | 4.1%), Latin America (2,072 | 3.7%), Central America (1,608 | 2.9%), and Mexico (1,434 | 2.5%), together accounting for 19.4% of all Lacey residents.
| Immigration Origin | # Population | % Population |
| Afghanistan | 48 | 0.1% |
| Africa | 225 | 0.4% |
| Asia | 3,519 | 6.2% |
| Bolivia | 17 | 0.0% |
| Brazil | 181 | 0.3% |
| Cambodia | 99 | 0.2% |
| Canada | 240 | 0.4% |
| Caribbean | 186 | 0.3% |
| Central America | 1,608 | 2.9% |
| China | 264 | 0.5% |
| Colombia | 11 | 0.0% |
| Cuba | 31 | 0.1% |
| Eastern Africa | 42 | 0.1% |
| Eastern Asia | 971 | 1.7% |
| Eastern Europe | 206 | 0.4% |
| El Salvador | 104 | 0.2% |
| England | 15 | 0.0% |
| Europe | 747 | 1.3% |
| France | 28 | 0.1% |
| Germany | 375 | 0.7% |
| Ghana | 144 | 0.3% |
| Guatemala | 29 | 0.1% |
| Haiti | 43 | 0.1% |
| Honduras | 41 | 0.1% |
| Hungary | 18 | 0.0% |
| India | 79 | 0.1% |
| Ireland | 13 | 0.0% |
| Italy | 18 | 0.0% |
| Jamaica | 18 | 0.0% |
| Japan | 60 | 0.1% |
| Kenya | 42 | 0.1% |
| Korea | 647 | 1.1% |
| Laos | 9 | 0.0% |
| Latin America | 2,072 | 3.7% |
| Mexico | 1,434 | 2.5% |
| Moldova | 2 | 0.0% |
| Nepal | 45 | 0.1% |
| Northern Africa | 19 | 0.0% |
| Northern Europe | 76 | 0.1% |
| Oceania | 143 | 0.3% |
| Peru | 2 | 0.0% |
| Philippines | 982 | 1.8% |
| Poland | 90 | 0.2% |
| Romania | 58 | 0.1% |
| Russia | 16 | 0.0% |
| Saudi Arabia | 88 | 0.2% |
| Scotland | 31 | 0.1% |
| Singapore | 88 | 0.2% |
| South Africa | 8 | 0.0% |
| South America | 278 | 0.5% |
| South Central Asia | 172 | 0.3% |
| South Eastern Asia | 2,288 | 4.1% |
| Southern Europe | 62 | 0.1% |
| Spain | 44 | 0.1% |
| Sudan | 19 | 0.0% |
| Sweden | 17 | 0.0% |
| Taiwan | 17 | 0.0% |
| Thailand | 168 | 0.3% |
| Trinidad and Tobago | 94 | 0.2% |
| Ukraine | 22 | 0.0% |
| Uruguay | 11 | 0.0% |
| Venezuela | 56 | 0.1% |
| Vietnam | 942 | 1.7% |
| Western Africa | 156 | 0.3% |
| Western Asia | 88 | 0.2% |
| Western Europe | 403 | 0.7% | View All 66 Rows |
Sex and Age in Lacey
Sex and Age in Lacey
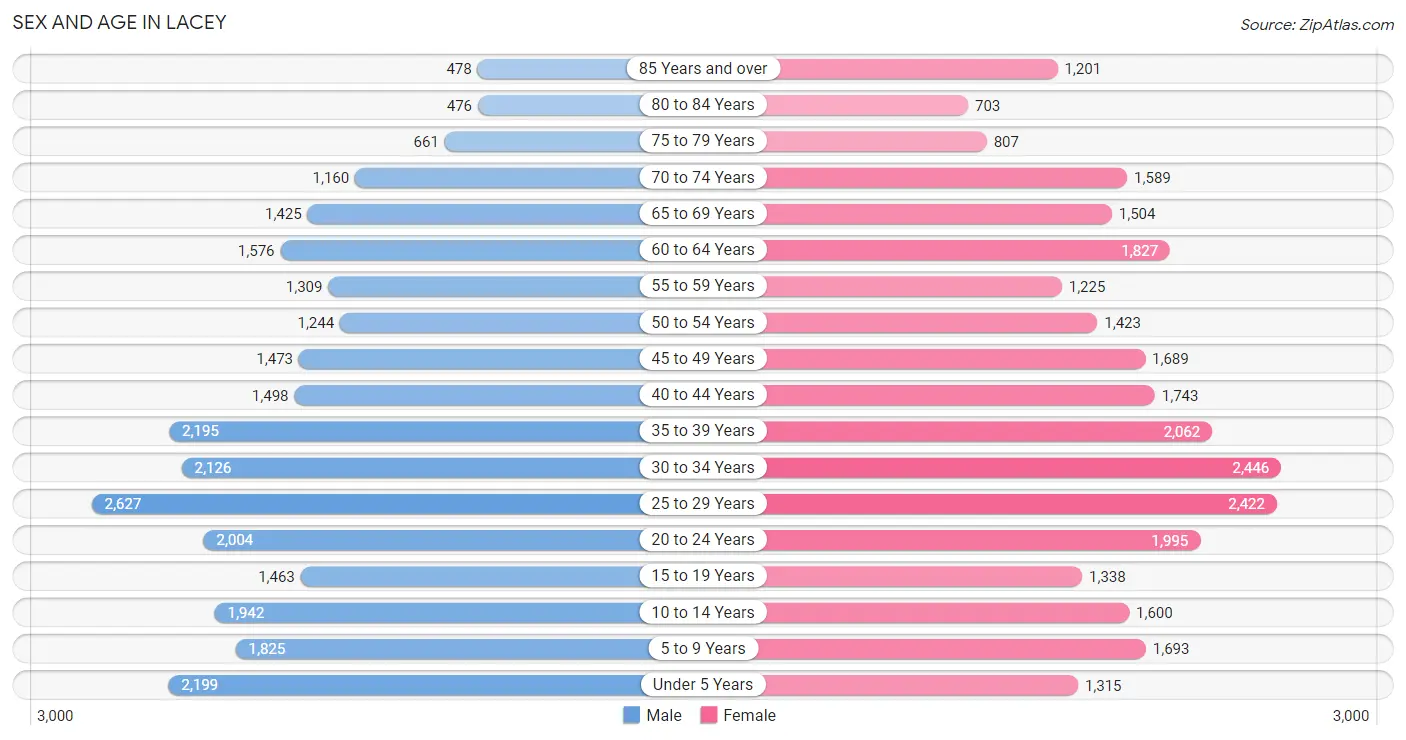
The most populous age groups in Lacey are 25 to 29 Years (2,627 | 9.5%) for men and 30 to 34 Years (2,446 | 8.6%) for women.
| Age Bracket | Male | Female |
| Under 5 Years | 2,199 (7.9%) | 1,315 (4.6%) |
| 5 to 9 Years | 1,825 (6.6%) | 1,693 (5.9%) |
| 10 to 14 Years | 1,942 (7.0%) | 1,600 (5.6%) |
| 15 to 19 Years | 1,463 (5.3%) | 1,338 (4.7%) |
| 20 to 24 Years | 2,004 (7.2%) | 1,995 (7.0%) |
| 25 to 29 Years | 2,627 (9.5%) | 2,422 (8.5%) |
| 30 to 34 Years | 2,126 (7.7%) | 2,446 (8.6%) |
| 35 to 39 Years | 2,195 (7.9%) | 2,062 (7.2%) |
| 40 to 44 Years | 1,498 (5.4%) | 1,743 (6.1%) |
| 45 to 49 Years | 1,473 (5.3%) | 1,689 (5.9%) |
| 50 to 54 Years | 1,244 (4.5%) | 1,423 (5.0%) |
| 55 to 59 Years | 1,309 (4.7%) | 1,225 (4.3%) |
| 60 to 64 Years | 1,576 (5.7%) | 1,827 (6.4%) |
| 65 to 69 Years | 1,425 (5.1%) | 1,504 (5.3%) |
| 70 to 74 Years | 1,160 (4.2%) | 1,589 (5.6%) |
| 75 to 79 Years | 661 (2.4%) | 807 (2.8%) |
| 80 to 84 Years | 476 (1.7%) | 703 (2.5%) |
| 85 Years and over | 478 (1.7%) | 1,201 (4.2%) |
| Total | 27,681 (100.0%) | 28,582 (100.0%) |
Families and Households in Lacey
Median Family Size in Lacey
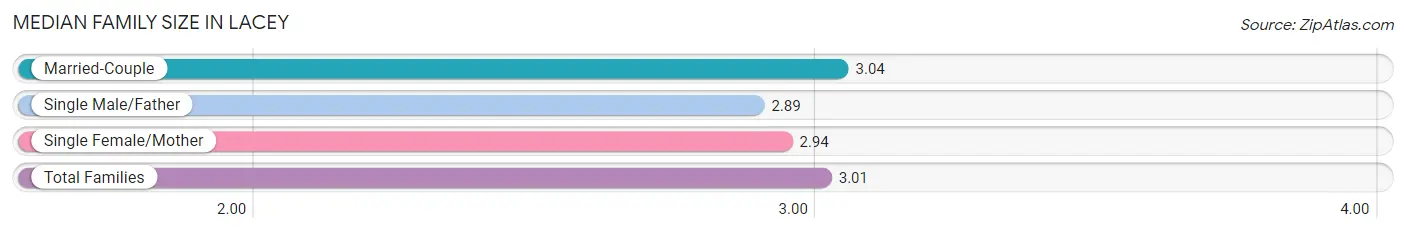
The median family size in Lacey is 3.01 persons per family, with married-couple families (10,375 | 72.3%) accounting for the largest median family size of 3.04 persons per family. On the other hand, single male/father families (1,143 | 8.0%) represent the smallest median family size with 2.89 persons per family.
| Family Type | # Families | Family Size |
| Married-Couple | 10,375 (72.3%) | 3.04 |
| Single Male/Father | 1,143 (8.0%) | 2.89 |
| Single Female/Mother | 2,828 (19.7%) | 2.94 |
| Total Families | 14,346 (100.0%) | 3.01 |
Median Household Size in Lacey
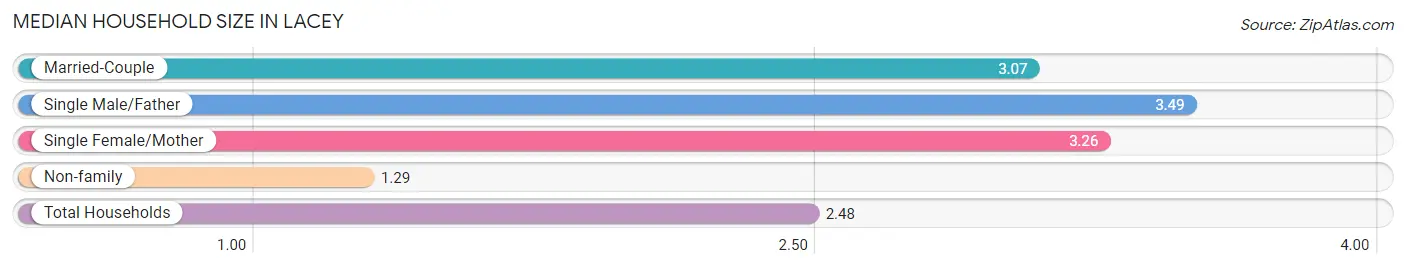
The median household size in Lacey is 2.48 persons per household, with single male/father households (1,143 | 5.1%) accounting for the largest median household size of 3.49 persons per household. non-family households (7,910 | 35.5%) represent the smallest median household size with 1.29 persons per household.
| Household Type | # Households | Household Size |
| Married-Couple | 10,375 (46.6%) | 3.07 |
| Single Male/Father | 1,143 (5.1%) | 3.49 |
| Single Female/Mother | 2,828 (12.7%) | 3.26 |
| Non-family | 7,910 (35.5%) | 1.29 |
| Total Households | 22,256 (100.0%) | 2.48 |
Household Size by Marriage Status in Lacey
Out of a total of 22,256 households in Lacey, 14,346 (64.5%) are family households, while 7,910 (35.5%) are nonfamily households. The most numerous type of family households are 2-person households, comprising 6,389, and the most common type of nonfamily households are 1-person households, comprising 6,245.
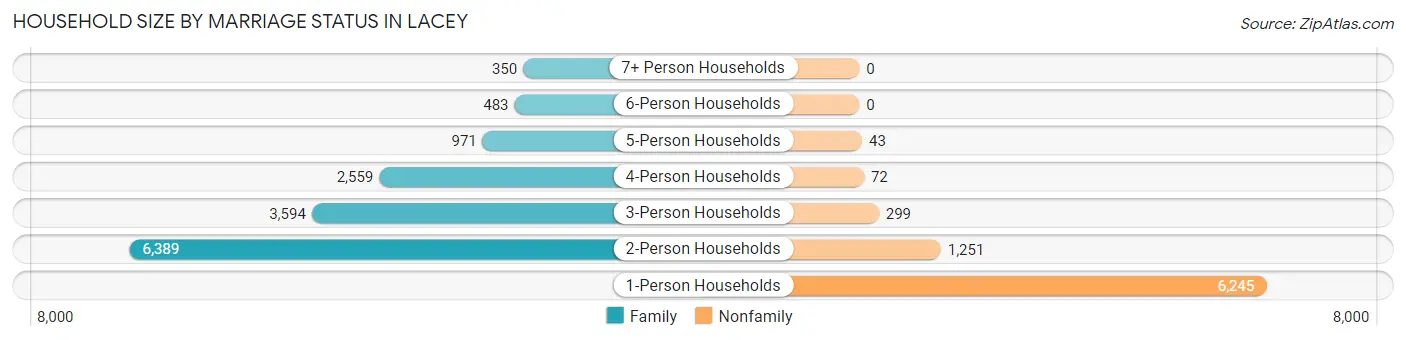
| Household Size | Family Households | Nonfamily Households |
| 1-Person Households | - | 6,245 (28.1%) |
| 2-Person Households | 6,389 (28.7%) | 1,251 (5.6%) |
| 3-Person Households | 3,594 (16.2%) | 299 (1.3%) |
| 4-Person Households | 2,559 (11.5%) | 72 (0.3%) |
| 5-Person Households | 971 (4.4%) | 43 (0.2%) |
| 6-Person Households | 483 (2.2%) | 0 (0.0%) |
| 7+ Person Households | 350 (1.6%) | 0 (0.0%) |
| Total | 14,346 (64.5%) | 7,910 (35.5%) |
Female Fertility in Lacey
Fertility by Age in Lacey
Average fertility rate in Lacey is 31.0 births per 1,000 women. Women in the age bracket of 20 to 34 years have the highest fertility rate with 59.0 births per 1,000 women. Women in the age bracket of 20 to 34 years acount for 92.2% of all women with births.
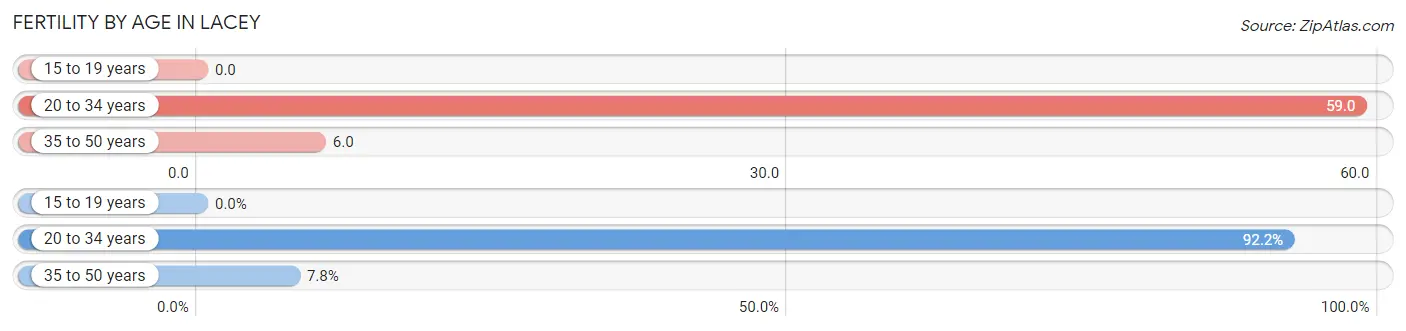
| Age Bracket | Women with Births | Births / 1,000 Women |
| 15 to 19 years | 0 (0.0%) | 0.0 |
| 20 to 34 years | 402 (92.2%) | 59.0 |
| 35 to 50 years | 34 (7.8%) | 6.0 |
| Total | 436 (100.0%) | 31.0 |
Fertility by Age by Marriage Status in Lacey
56.0% of women with births (436) in Lacey are married. The highest percentage of unmarried women with births falls into 20 to 34 years age bracket with 47.8% of them unmarried at the time of birth, while the lowest percentage of unmarried women with births belong to 35 to 50 years age bracket with 0.0% of them unmarried.
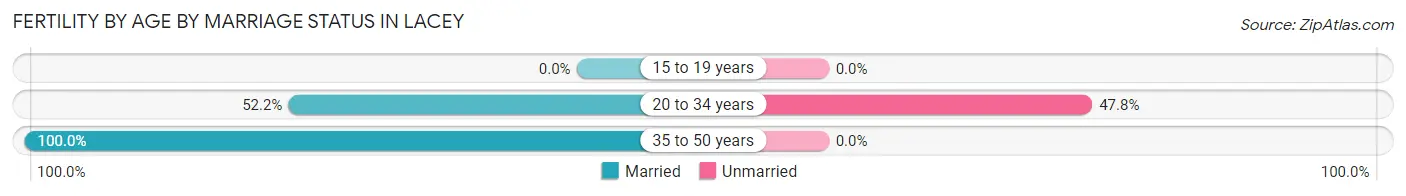
| Age Bracket | Married | Unmarried |
| 15 to 19 years | 0 (0.0%) | 0 (0.0%) |
| 20 to 34 years | 210 (52.2%) | 192 (47.8%) |
| 35 to 50 years | 34 (100.0%) | 0 (0.0%) |
| Total | 244 (56.0%) | 192 (44.0%) |
Fertility by Education in Lacey
Average fertility rate in Lacey is 31.0 births per 1,000 women. Women with the education attainment of high school diploma have the highest fertility rate of 64.0 births per 1,000 women, while women with the education attainment of college or associate's degree have the lowest fertility at 20.0 births per 1,000 women. Women with the education attainment of high school diploma represent 38.1% of all women with births.
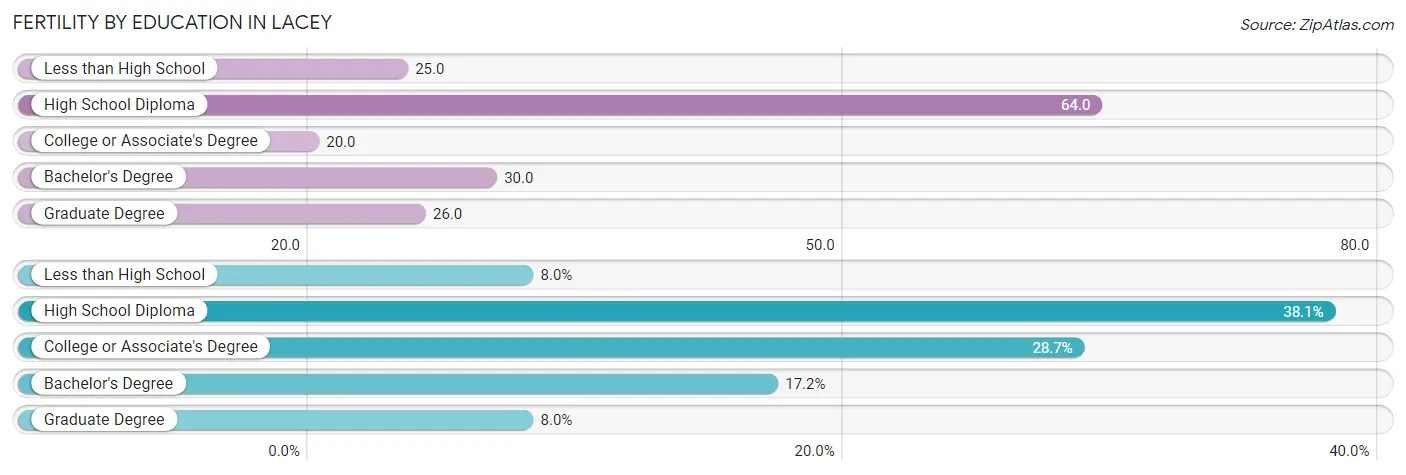
| Educational Attainment | Women with Births | Births / 1,000 Women |
| Less than High School | 35 (8.0%) | 25.0 |
| High School Diploma | 166 (38.1%) | 64.0 |
| College or Associate's Degree | 125 (28.7%) | 20.0 |
| Bachelor's Degree | 75 (17.2%) | 30.0 |
| Graduate Degree | 35 (8.0%) | 26.0 |
| Total | 436 (100.0%) | 31.0 |
Fertility by Education by Marriage Status in Lacey
44.0% of women with births in Lacey are unmarried. Women with the educational attainment of graduate degree are most likely to be married with 100.0% of them married at childbirth, while women with the educational attainment of less than high school are least likely to be married with 100.0% of them unmarried at childbirth.
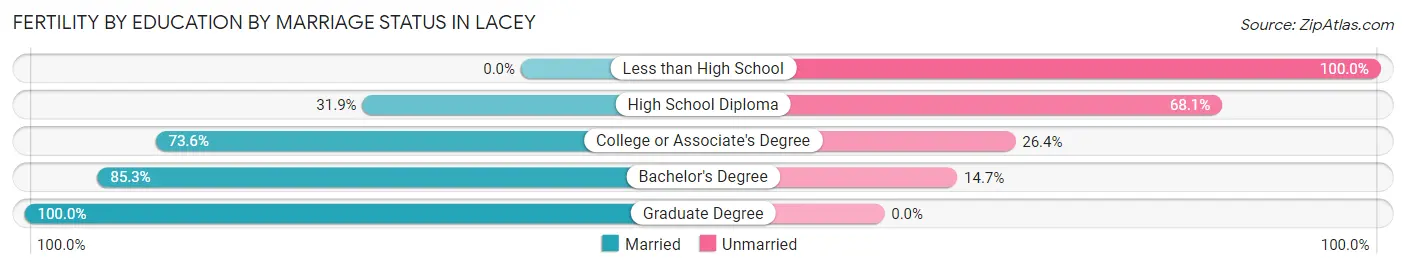
| Educational Attainment | Married | Unmarried |
| Less than High School | 0 (0.0%) | 35 (100.0%) |
| High School Diploma | 53 (31.9%) | 113 (68.1%) |
| College or Associate's Degree | 92 (73.6%) | 33 (26.4%) |
| Bachelor's Degree | 64 (85.3%) | 11 (14.7%) |
| Graduate Degree | 35 (100.0%) | 0 (0.0%) |
| Total | 244 (56.0%) | 192 (44.0%) |
Employment Characteristics in Lacey
Employment by Class of Employer in Lacey
Among the 26,049 employed individuals in Lacey, private company employees (14,091 | 54.1%), federal government employees (3,634 | 14.0%), and state government employees (3,378 | 13.0%) make up the most common classes of employment.
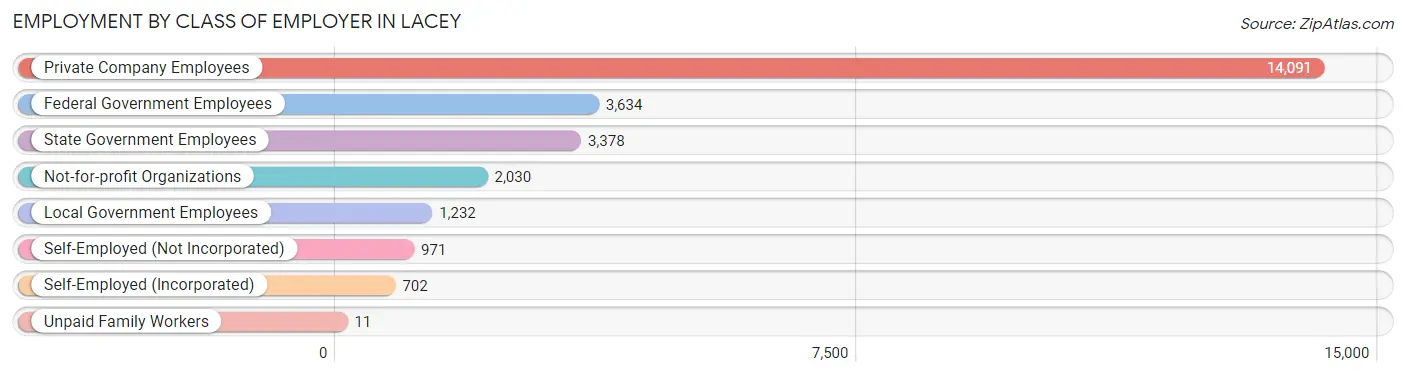
| Employer Class | # Employees | % Employees |
| Private Company Employees | 14,091 | 54.1% |
| Self-Employed (Incorporated) | 702 | 2.7% |
| Self-Employed (Not Incorporated) | 971 | 3.7% |
| Not-for-profit Organizations | 2,030 | 7.8% |
| Local Government Employees | 1,232 | 4.7% |
| State Government Employees | 3,378 | 13.0% |
| Federal Government Employees | 3,634 | 14.0% |
| Unpaid Family Workers | 11 | 0.0% |
| Total | 26,049 | 100.0% |
Employment Status by Age in Lacey
According to the labor force statistics for Lacey, out of the total population over 16 years of age (45,223), 62.5% or 28,264 individuals are in the labor force, with 5.4% or 1,526 of them unemployed. The age group with the highest labor force participation rate is 25 to 29 years, with 87.4% or 4,413 individuals in the labor force. Within the labor force, the 20 to 24 years age range has the highest percentage of unemployed individuals, with 13.4% or 461 of them being unemployed.
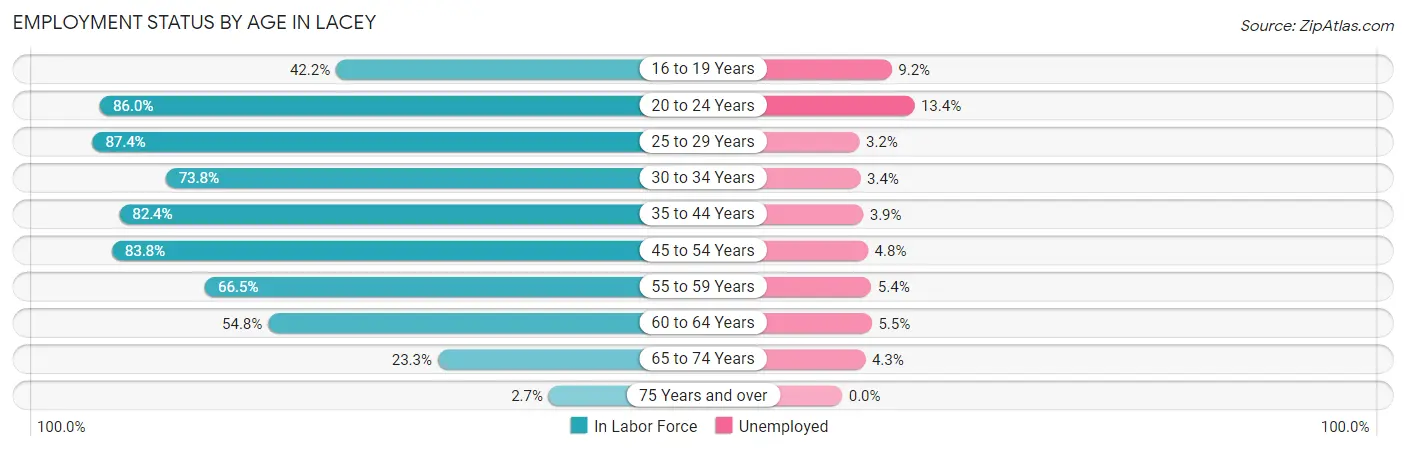
| Age Bracket | In Labor Force | Unemployed |
| 16 to 19 Years | 985 (42.2%) | 91 (9.2%) |
| 20 to 24 Years | 3,439 (86.0%) | 461 (13.4%) |
| 25 to 29 Years | 4,413 (87.4%) | 141 (3.2%) |
| 30 to 34 Years | 3,374 (73.8%) | 115 (3.4%) |
| 35 to 44 Years | 6,178 (82.4%) | 241 (3.9%) |
| 45 to 54 Years | 4,885 (83.8%) | 234 (4.8%) |
| 55 to 59 Years | 1,685 (66.5%) | 91 (5.4%) |
| 60 to 64 Years | 1,865 (54.8%) | 103 (5.5%) |
| 65 to 74 Years | 1,323 (23.3%) | 57 (4.3%) |
| 75 Years and over | 117 (2.7%) | 0 (0.0%) |
| Total | 28,264 (62.5%) | 1,526 (5.4%) |
Employment Status by Educational Attainment in Lacey
According to labor force statistics for Lacey, 77.6% of individuals (22,415) out of the total population between 25 and 64 years of age (28,885) are in the labor force, with 4.2% or 941 of them being unemployed. The group with the highest labor force participation rate are those with the educational attainment of bachelor's degree or higher, with 86.1% or 7,733 individuals in the labor force. Within the labor force, individuals with college / associate degree education have the highest percentage of unemployment, with 4.9% or 465 of them being unemployed.
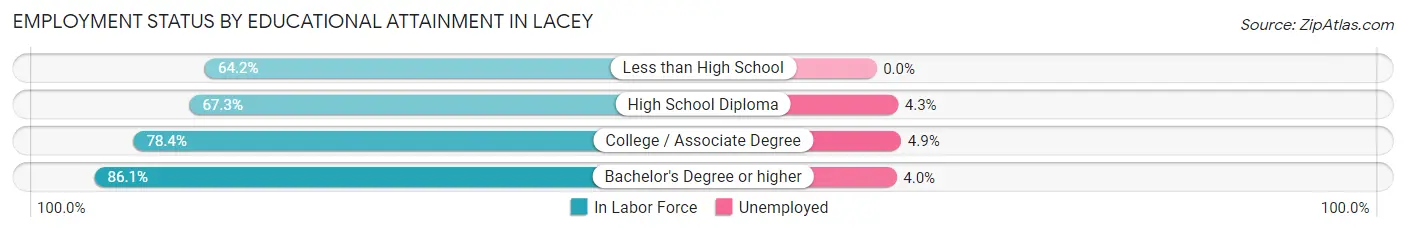
| Educational Attainment | In Labor Force | Unemployed |
| Less than High School | 1,206 (64.2%) | 0 (0.0%) |
| High School Diploma | 3,991 (67.3%) | 255 (4.3%) |
| College / Associate Degree | 9,482 (78.4%) | 593 (4.9%) |
| Bachelor's Degree or higher | 7,733 (86.1%) | 359 (4.0%) |
| Total | 22,415 (77.6%) | 1,213 (4.2%) |
Employment Occupations by Sex in Lacey
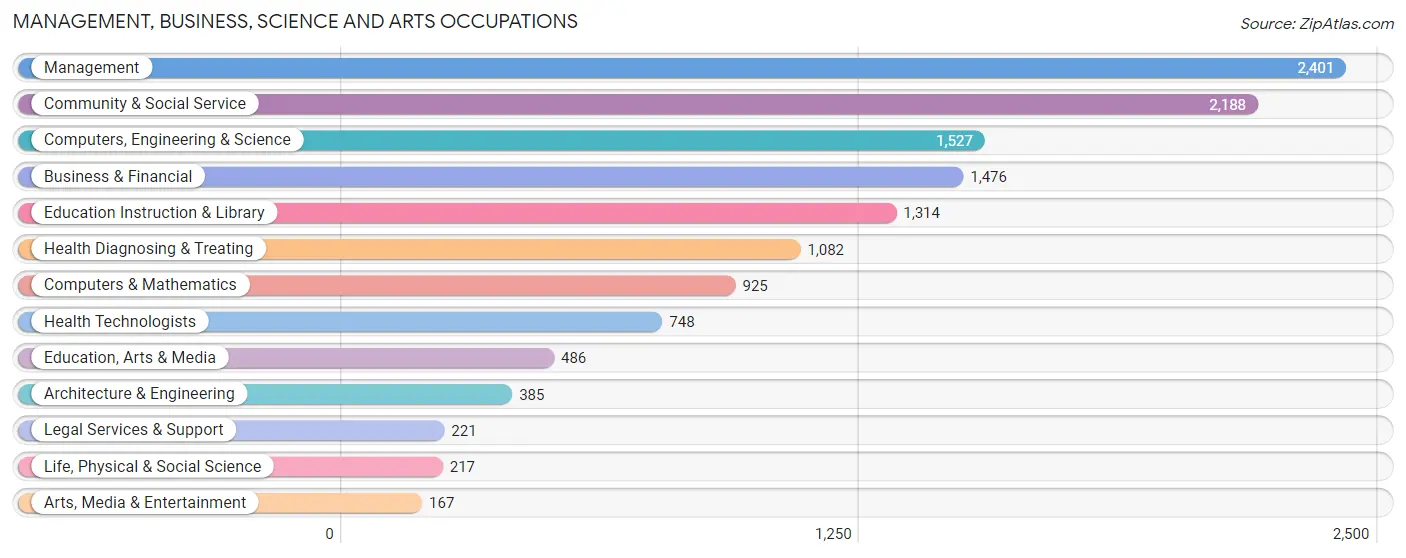
Management, Business, Science and Arts Occupations
The most common Management, Business, Science and Arts occupations in Lacey are Management (2,401 | 9.7%), Community & Social Service (2,188 | 8.9%), Computers, Engineering & Science (1,527 | 6.2%), Business & Financial (1,476 | 6.0%), and Education Instruction & Library (1,314 | 5.3%).
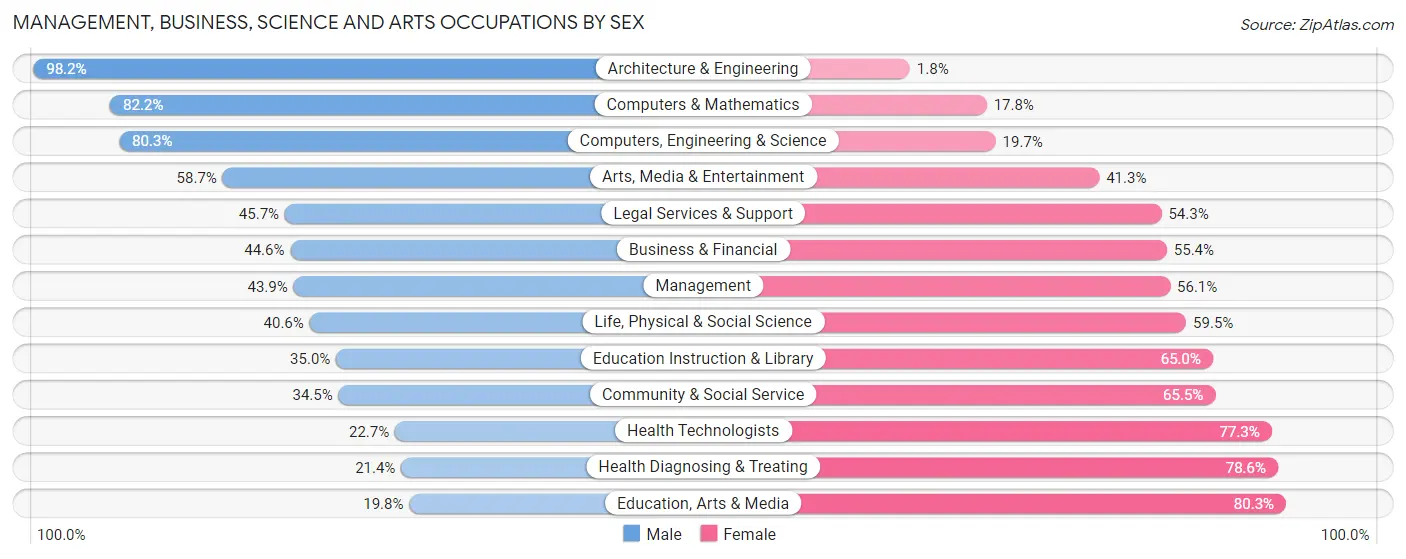
Management, Business, Science and Arts Occupations by Sex
Within the Management, Business, Science and Arts occupations in Lacey, the most male-oriented occupations are Architecture & Engineering (98.2%), Computers & Mathematics (82.2%), and Computers, Engineering & Science (80.3%), while the most female-oriented occupations are Education, Arts & Media (80.2%), Health Diagnosing & Treating (78.6%), and Health Technologists (77.3%).
| Occupation | Male | Female |
| Management | 1,054 (43.9%) | 1,347 (56.1%) |
| Business & Financial | 658 (44.6%) | 818 (55.4%) |
| Computers, Engineering & Science | 1,226 (80.3%) | 301 (19.7%) |
| Computers & Mathematics | 760 (82.2%) | 165 (17.8%) |
| Architecture & Engineering | 378 (98.2%) | 7 (1.8%) |
| Life, Physical & Social Science | 88 (40.6%) | 129 (59.5%) |
| Community & Social Service | 755 (34.5%) | 1,433 (65.5%) |
| Education, Arts & Media | 96 (19.8%) | 390 (80.2%) |
| Legal Services & Support | 101 (45.7%) | 120 (54.3%) |
| Education Instruction & Library | 460 (35.0%) | 854 (65.0%) |
| Arts, Media & Entertainment | 98 (58.7%) | 69 (41.3%) |
| Health Diagnosing & Treating | 232 (21.4%) | 850 (78.6%) |
| Health Technologists | 170 (22.7%) | 578 (77.3%) |
| Total (Category) | 3,925 (45.3%) | 4,749 (54.7%) |
| Total (Overall) | 12,087 (49.0%) | 12,593 (51.0%) |
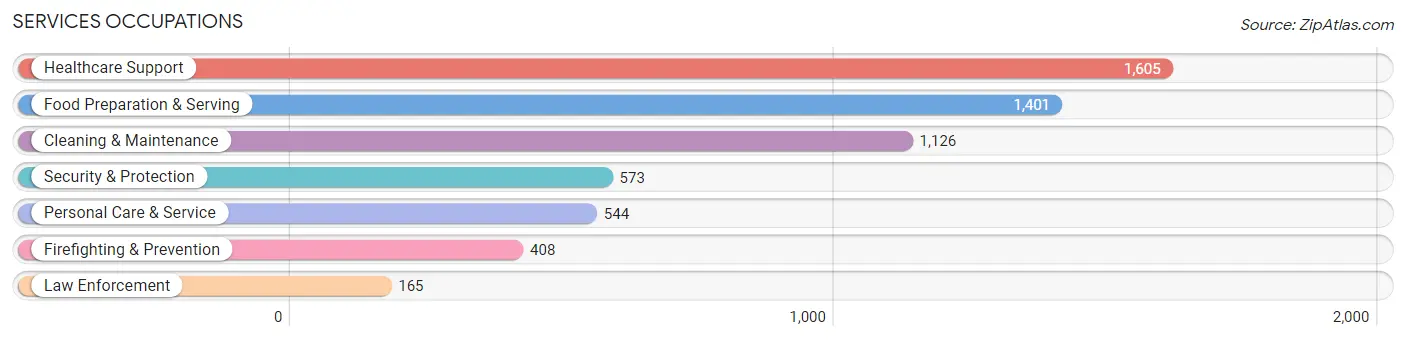
Services Occupations
The most common Services occupations in Lacey are Healthcare Support (1,605 | 6.5%), Food Preparation & Serving (1,401 | 5.7%), Cleaning & Maintenance (1,126 | 4.6%), Security & Protection (573 | 2.3%), and Personal Care & Service (544 | 2.2%).
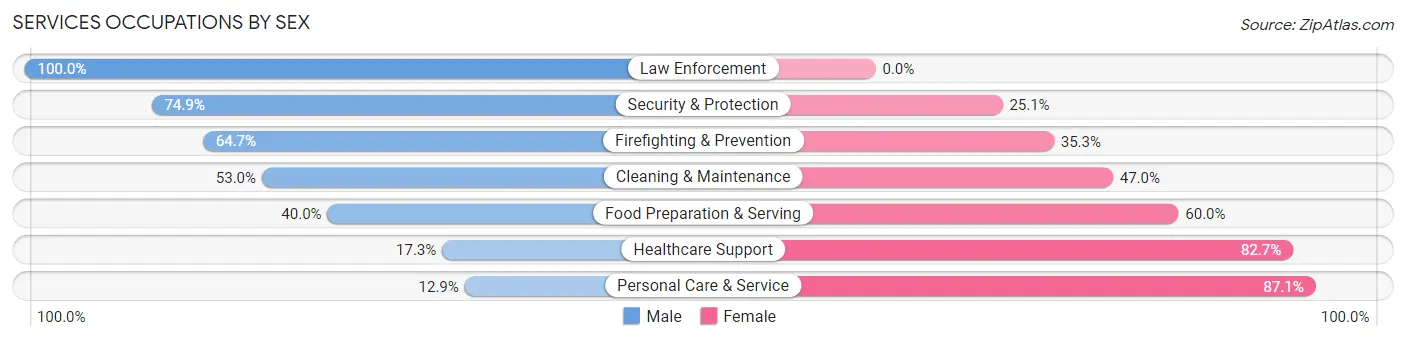
Services Occupations by Sex
Within the Services occupations in Lacey, the most male-oriented occupations are Law Enforcement (100.0%), Security & Protection (74.9%), and Firefighting & Prevention (64.7%), while the most female-oriented occupations are Personal Care & Service (87.1%), Healthcare Support (82.7%), and Food Preparation & Serving (60.0%).
| Occupation | Male | Female |
| Healthcare Support | 278 (17.3%) | 1,327 (82.7%) |
| Security & Protection | 429 (74.9%) | 144 (25.1%) |
| Firefighting & Prevention | 264 (64.7%) | 144 (35.3%) |
| Law Enforcement | 165 (100.0%) | 0 (0.0%) |
| Food Preparation & Serving | 561 (40.0%) | 840 (60.0%) |
| Cleaning & Maintenance | 597 (53.0%) | 529 (47.0%) |
| Personal Care & Service | 70 (12.9%) | 474 (87.1%) |
| Total (Category) | 1,935 (36.9%) | 3,314 (63.1%) |
| Total (Overall) | 12,087 (49.0%) | 12,593 (51.0%) |
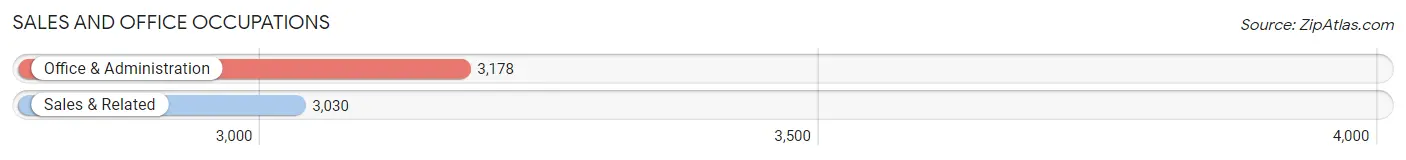
Sales and Office Occupations
The most common Sales and Office occupations in Lacey are Office & Administration (3,178 | 12.9%), and Sales & Related (3,030 | 12.3%).
Sales and Office Occupations by Sex
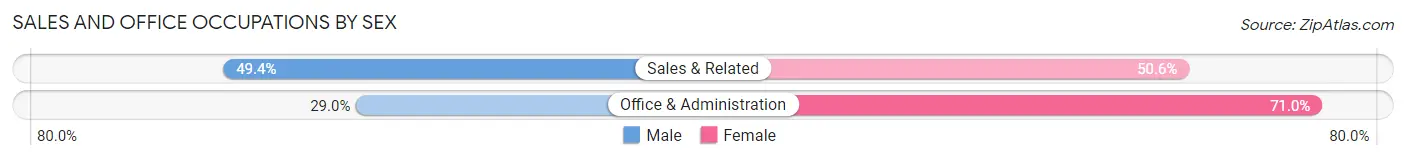
| Occupation | Male | Female |
| Sales & Related | 1,498 (49.4%) | 1,532 (50.6%) |
| Office & Administration | 921 (29.0%) | 2,257 (71.0%) |
| Total (Category) | 2,419 (39.0%) | 3,789 (61.0%) |
| Total (Overall) | 12,087 (49.0%) | 12,593 (51.0%) |
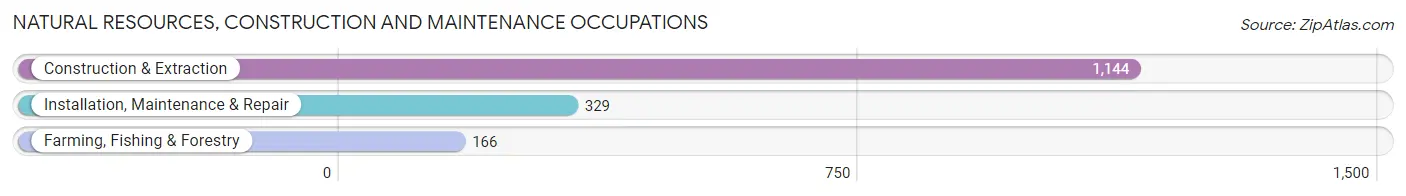
Natural Resources, Construction and Maintenance Occupations
The most common Natural Resources, Construction and Maintenance occupations in Lacey are Construction & Extraction (1,144 | 4.6%), Installation, Maintenance & Repair (329 | 1.3%), and Farming, Fishing & Forestry (166 | 0.7%).
Natural Resources, Construction and Maintenance Occupations by Sex
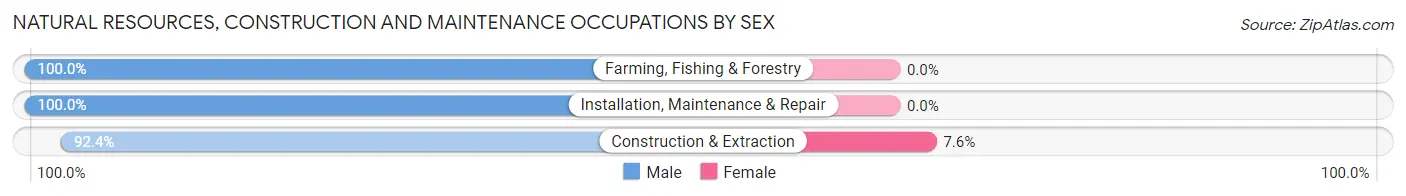
| Occupation | Male | Female |
| Farming, Fishing & Forestry | 166 (100.0%) | 0 (0.0%) |
| Construction & Extraction | 1,057 (92.4%) | 87 (7.6%) |
| Installation, Maintenance & Repair | 329 (100.0%) | 0 (0.0%) |
| Total (Category) | 1,552 (94.7%) | 87 (5.3%) |
| Total (Overall) | 12,087 (49.0%) | 12,593 (51.0%) |
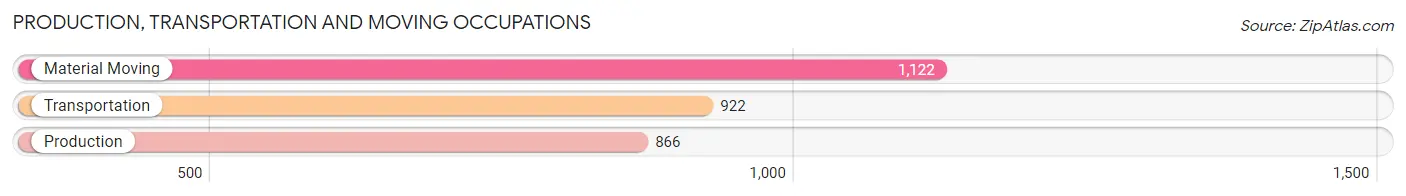
Production, Transportation and Moving Occupations
The most common Production, Transportation and Moving occupations in Lacey are Material Moving (1,122 | 4.5%), Transportation (922 | 3.7%), and Production (866 | 3.5%).
Production, Transportation and Moving Occupations by Sex
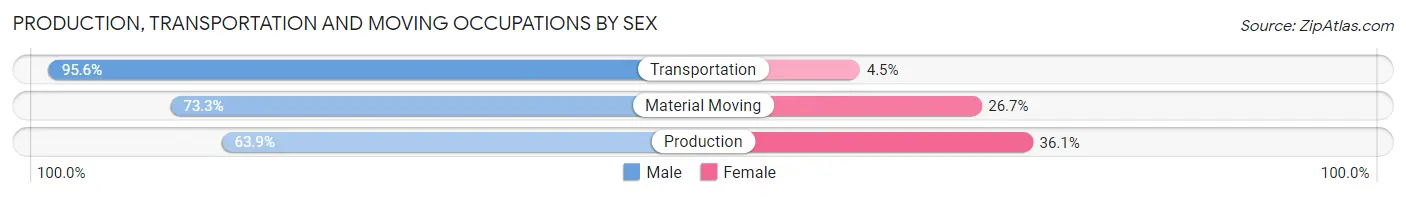
| Occupation | Male | Female |
| Production | 553 (63.9%) | 313 (36.1%) |
| Transportation | 881 (95.6%) | 41 (4.4%) |
| Material Moving | 822 (73.3%) | 300 (26.7%) |
| Total (Category) | 2,256 (77.5%) | 654 (22.5%) |
| Total (Overall) | 12,087 (49.0%) | 12,593 (51.0%) |
Employment Industries by Sex in Lacey
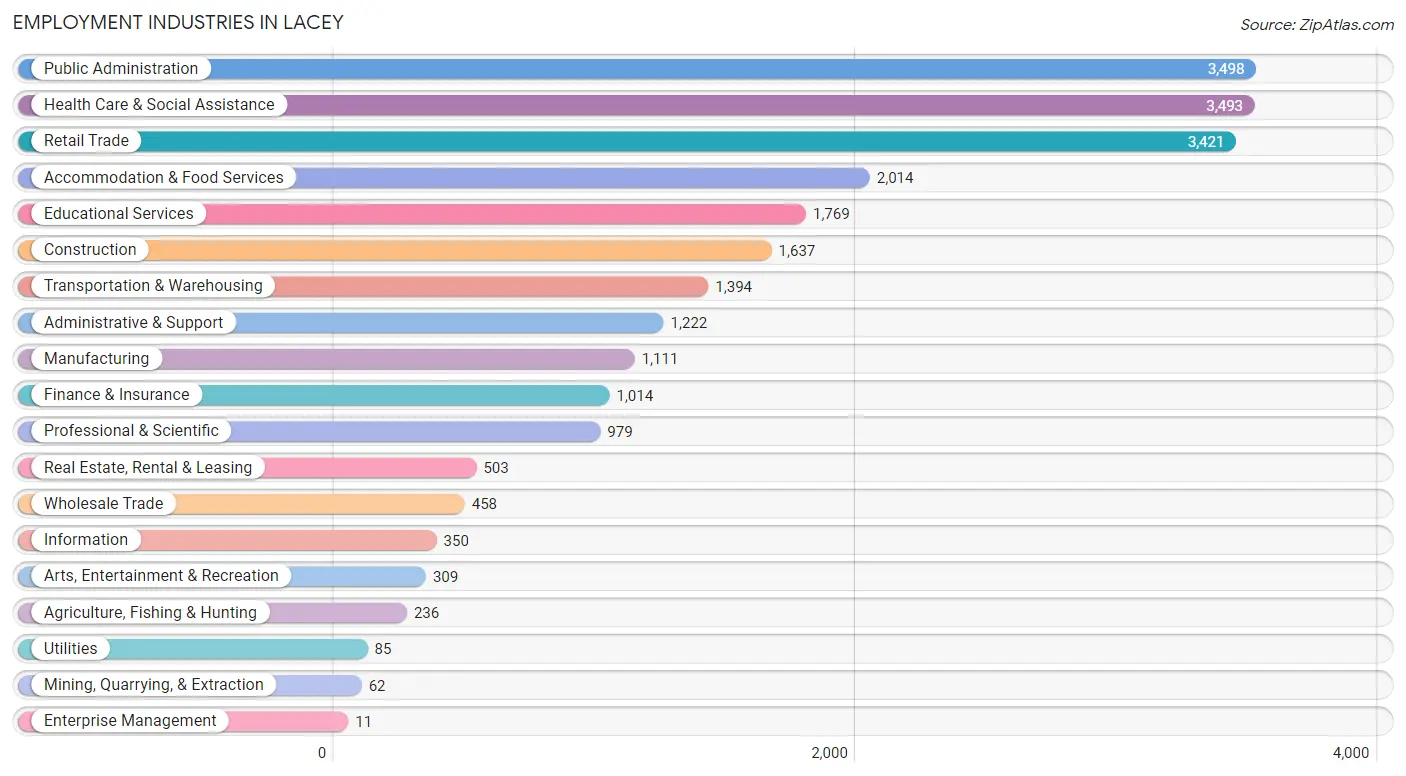
Employment Industries in Lacey
The major employment industries in Lacey include Public Administration (3,498 | 14.2%), Health Care & Social Assistance (3,493 | 14.1%), Retail Trade (3,421 | 13.9%), Accommodation & Food Services (2,014 | 8.2%), and Educational Services (1,769 | 7.2%).
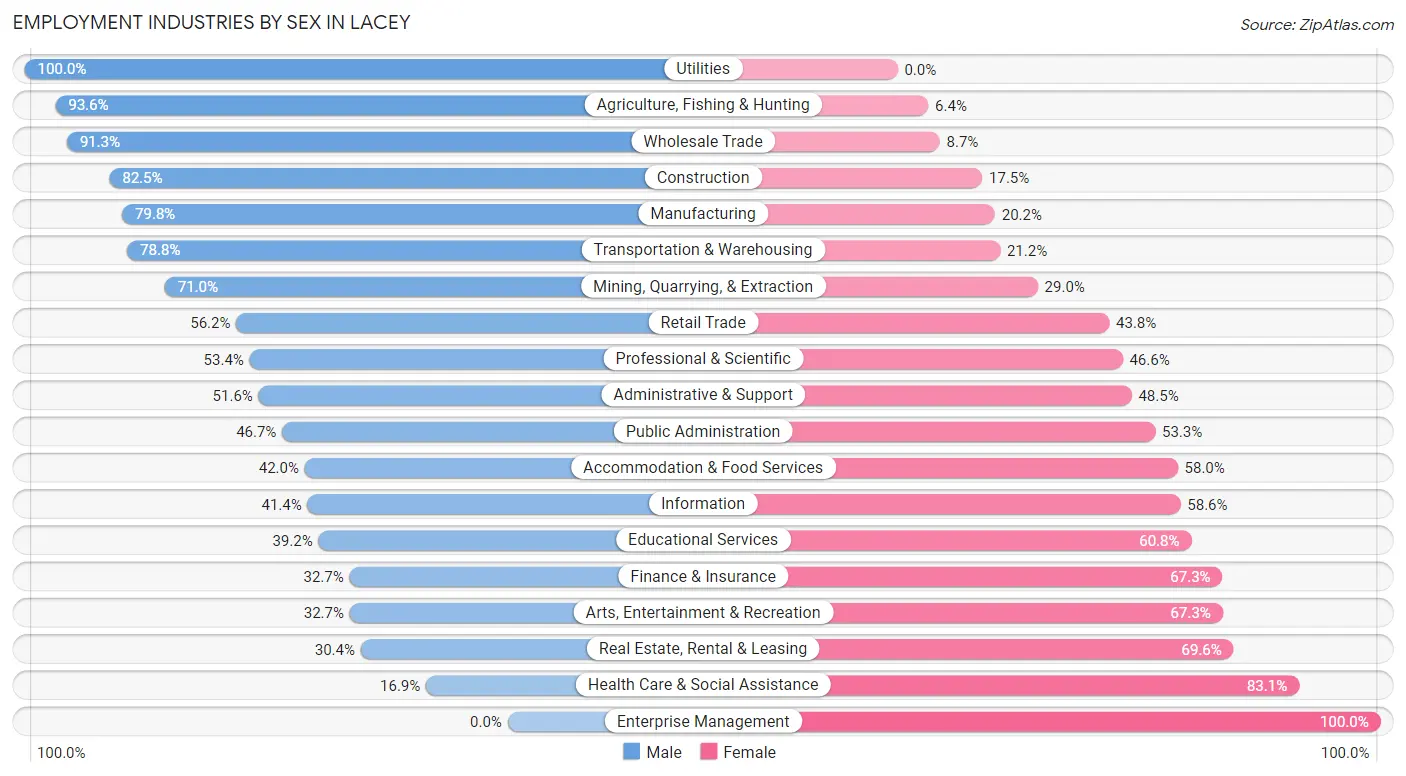
Employment Industries by Sex in Lacey
The Lacey industries that see more men than women are Utilities (100.0%), Agriculture, Fishing & Hunting (93.6%), and Wholesale Trade (91.3%), whereas the industries that tend to have a higher number of women are Enterprise Management (100.0%), Health Care & Social Assistance (83.1%), and Real Estate, Rental & Leasing (69.6%).
| Industry | Male | Female |
| Agriculture, Fishing & Hunting | 221 (93.6%) | 15 (6.4%) |
| Mining, Quarrying, & Extraction | 44 (71.0%) | 18 (29.0%) |
| Construction | 1,350 (82.5%) | 287 (17.5%) |
| Manufacturing | 887 (79.8%) | 224 (20.2%) |
| Wholesale Trade | 418 (91.3%) | 40 (8.7%) |
| Retail Trade | 1,922 (56.2%) | 1,499 (43.8%) |
| Transportation & Warehousing | 1,098 (78.8%) | 296 (21.2%) |
| Utilities | 85 (100.0%) | 0 (0.0%) |
| Information | 145 (41.4%) | 205 (58.6%) |
| Finance & Insurance | 332 (32.7%) | 682 (67.3%) |
| Real Estate, Rental & Leasing | 153 (30.4%) | 350 (69.6%) |
| Professional & Scientific | 523 (53.4%) | 456 (46.6%) |
| Enterprise Management | 0 (0.0%) | 11 (100.0%) |
| Administrative & Support | 630 (51.5%) | 592 (48.4%) |
| Educational Services | 693 (39.2%) | 1,076 (60.8%) |
| Health Care & Social Assistance | 590 (16.9%) | 2,903 (83.1%) |
| Arts, Entertainment & Recreation | 101 (32.7%) | 208 (67.3%) |
| Accommodation & Food Services | 846 (42.0%) | 1,168 (58.0%) |
| Public Administration | 1,633 (46.7%) | 1,865 (53.3%) |
| Total | 12,087 (49.0%) | 12,593 (51.0%) |
Education in Lacey
School Enrollment in Lacey
The most common levels of schooling among the 12,791 students in Lacey are college / undergraduate (3,484 | 27.2%), middle school (2,736 | 21.4%), and elementary school (2,393 | 18.7%).
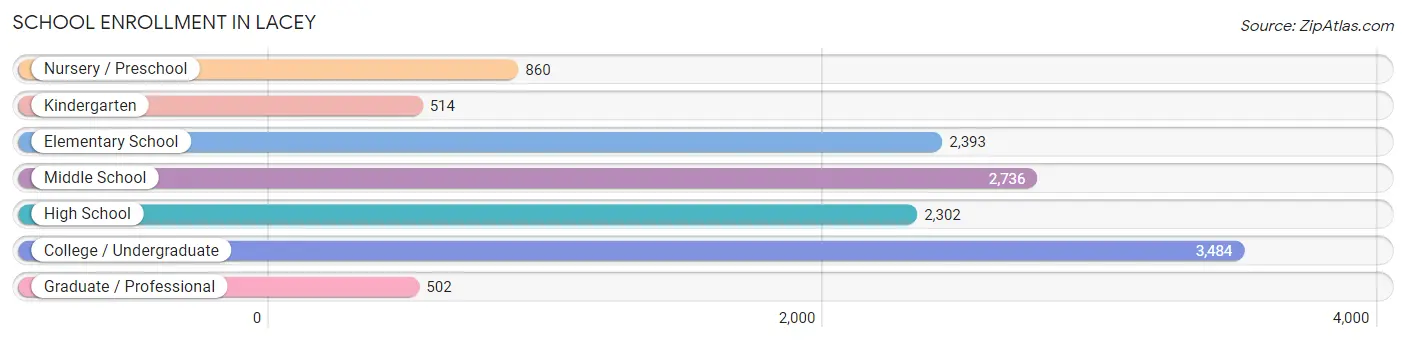
| School Level | # Students | % Students |
| Nursery / Preschool | 860 | 6.7% |
| Kindergarten | 514 | 4.0% |
| Elementary School | 2,393 | 18.7% |
| Middle School | 2,736 | 21.4% |
| High School | 2,302 | 18.0% |
| College / Undergraduate | 3,484 | 27.2% |
| Graduate / Professional | 502 | 3.9% |
| Total | 12,791 | 100.0% |
School Enrollment by Age by Funding Source in Lacey
Out of a total of 12,791 students who are enrolled in schools in Lacey, 2,712 (21.2%) attend a private institution, while the remaining 10,079 (78.8%) are enrolled in public schools. The age group of 3 to 4 year olds has the highest likelihood of being enrolled in private schools, with 411 (64.2% in the age bracket) enrolled. Conversely, the age group of 10 to 14 year olds has the lowest likelihood of being enrolled in a private school, with 3,174 (92.5% in the age bracket) attending a public institution.
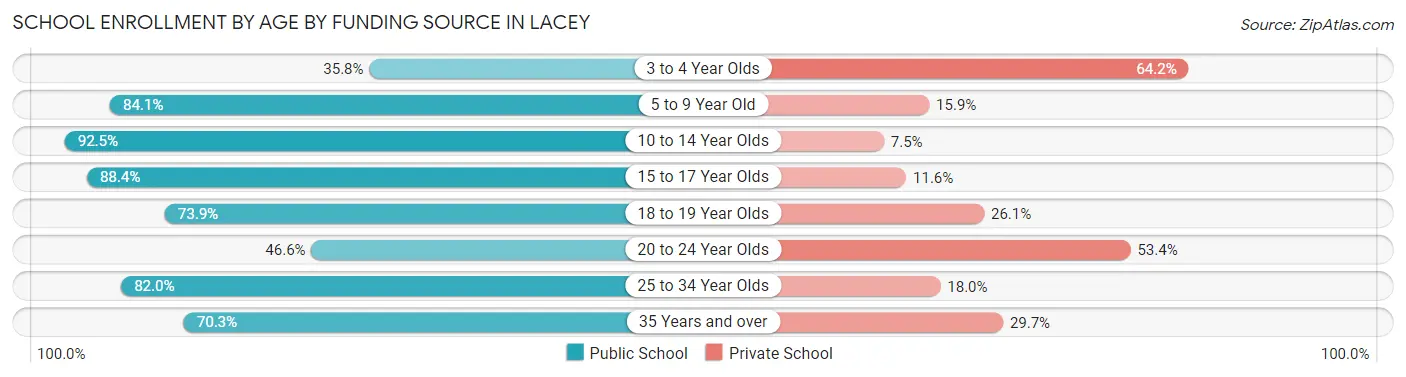
| Age Bracket | Public School | Private School |
| 3 to 4 Year Olds | 229 (35.8%) | 411 (64.2%) |
| 5 to 9 Year Old | 2,492 (84.1%) | 472 (15.9%) |
| 10 to 14 Year Olds | 3,174 (92.5%) | 257 (7.5%) |
| 15 to 17 Year Olds | 1,330 (88.4%) | 175 (11.6%) |
| 18 to 19 Year Olds | 534 (73.9%) | 189 (26.1%) |
| 20 to 24 Year Olds | 579 (46.6%) | 664 (53.4%) |
| 25 to 34 Year Olds | 956 (82.0%) | 210 (18.0%) |
| 35 Years and over | 787 (70.3%) | 332 (29.7%) |
| Total | 10,079 (78.8%) | 2,712 (21.2%) |
Educational Attainment by Field of Study in Lacey
Business (2,082 | 15.0%), education (1,304 | 9.4%), science & technology (1,216 | 8.8%), liberal arts & history (1,172 | 8.5%), and social sciences (1,157 | 8.3%) are the most common fields of study among 13,872 individuals in Lacey who have obtained a bachelor's degree or higher.
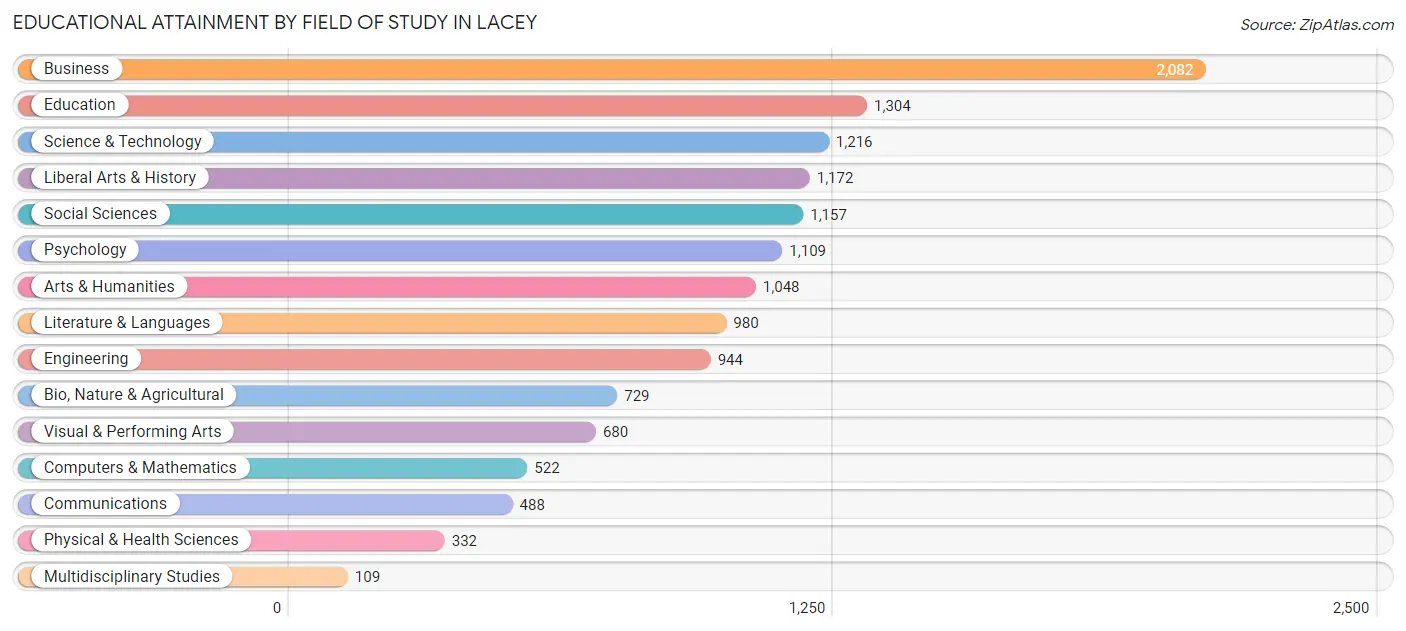
| Field of Study | # Graduates | % Graduates |
| Computers & Mathematics | 522 | 3.8% |
| Bio, Nature & Agricultural | 729 | 5.3% |
| Physical & Health Sciences | 332 | 2.4% |
| Psychology | 1,109 | 8.0% |
| Social Sciences | 1,157 | 8.3% |
| Engineering | 944 | 6.8% |
| Multidisciplinary Studies | 109 | 0.8% |
| Science & Technology | 1,216 | 8.8% |
| Business | 2,082 | 15.0% |
| Education | 1,304 | 9.4% |
| Literature & Languages | 980 | 7.1% |
| Liberal Arts & History | 1,172 | 8.5% |
| Visual & Performing Arts | 680 | 4.9% |
| Communications | 488 | 3.5% |
| Arts & Humanities | 1,048 | 7.5% |
| Total | 13,872 | 100.0% |
Transportation & Commute in Lacey
Vehicle Availability by Sex in Lacey
The most prevalent vehicle ownership categories in Lacey are males with 2 vehicles (5,510, accounting for 40.9%) and females with 2 vehicles (5,378, making up 44.6%).
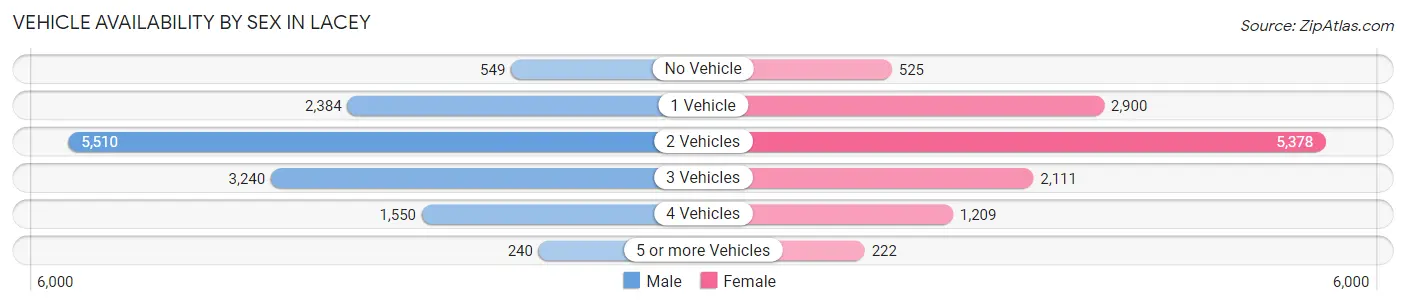
| Vehicles Available | Male | Female |
| No Vehicle | 549 (4.1%) | 525 (4.3%) |
| 1 Vehicle | 2,384 (17.7%) | 2,900 (23.5%) |
| 2 Vehicles | 5,510 (40.9%) | 5,378 (43.6%) |
| 3 Vehicles | 3,240 (24.0%) | 2,111 (17.1%) |
| 4 Vehicles | 1,550 (11.5%) | 1,209 (9.8%) |
| 5 or more Vehicles | 240 (1.8%) | 222 (1.8%) |
| Total | 13,473 (100.0%) | 12,345 (100.0%) |
Commute Time in Lacey
The most frequently occuring commute durations in Lacey are 20 to 24 minutes (4,616 commuters, 20.1%), 15 to 19 minutes (4,011 commuters, 17.5%), and 30 to 34 minutes (2,610 commuters, 11.4%).
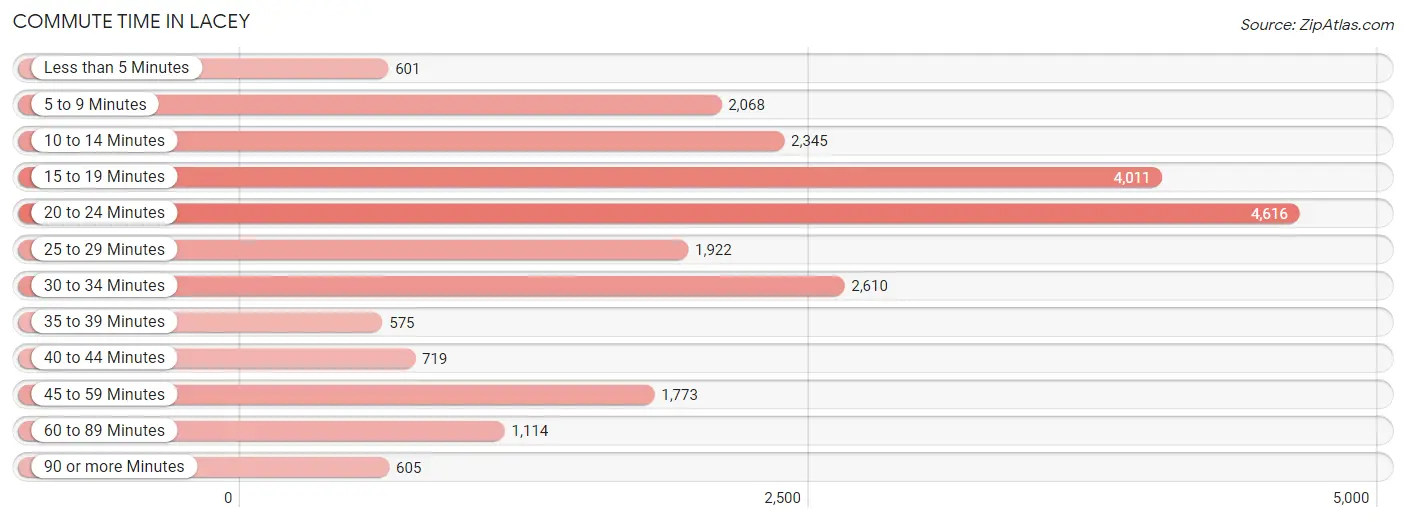
| Commute Time | # Commuters | % Commuters |
| Less than 5 Minutes | 601 | 2.6% |
| 5 to 9 Minutes | 2,068 | 9.0% |
| 10 to 14 Minutes | 2,345 | 10.2% |
| 15 to 19 Minutes | 4,011 | 17.5% |
| 20 to 24 Minutes | 4,616 | 20.1% |
| 25 to 29 Minutes | 1,922 | 8.4% |
| 30 to 34 Minutes | 2,610 | 11.4% |
| 35 to 39 Minutes | 575 | 2.5% |
| 40 to 44 Minutes | 719 | 3.1% |
| 45 to 59 Minutes | 1,773 | 7.7% |
| 60 to 89 Minutes | 1,114 | 4.9% |
| 90 or more Minutes | 605 | 2.6% |
Commute Time by Sex in Lacey
The most common commute times in Lacey are 20 to 24 minutes (2,446 commuters, 20.1%) for males and 15 to 19 minutes (2,246 commuters, 20.8%) for females.
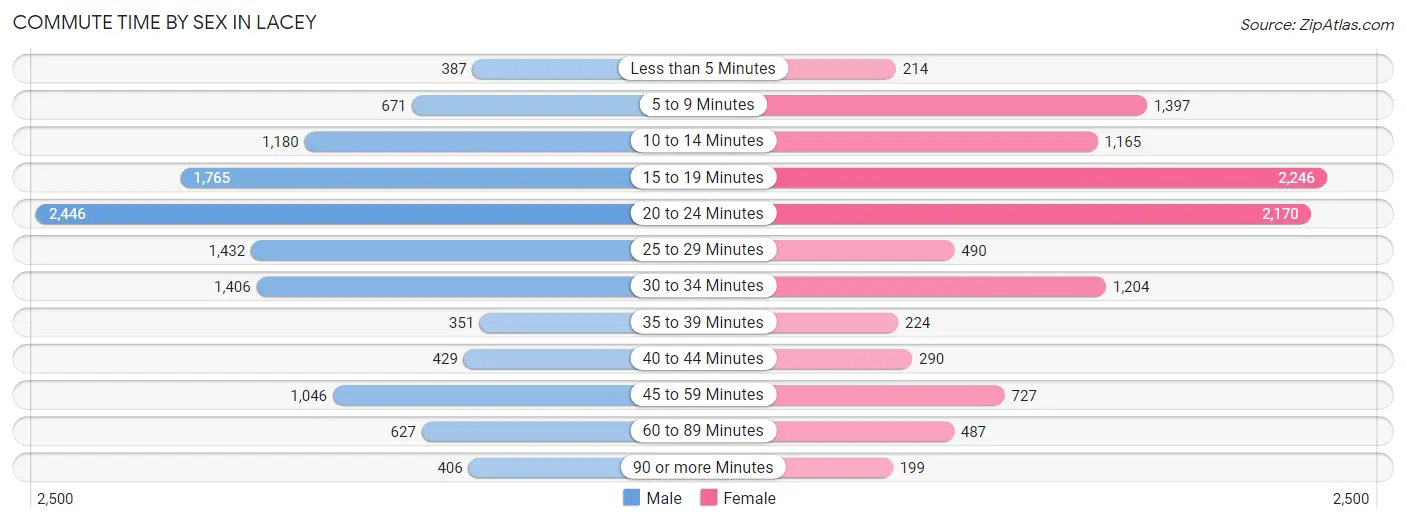
| Commute Time | Male | Female |
| Less than 5 Minutes | 387 (3.2%) | 214 (2.0%) |
| 5 to 9 Minutes | 671 (5.5%) | 1,397 (12.9%) |
| 10 to 14 Minutes | 1,180 (9.7%) | 1,165 (10.8%) |
| 15 to 19 Minutes | 1,765 (14.5%) | 2,246 (20.8%) |
| 20 to 24 Minutes | 2,446 (20.1%) | 2,170 (20.1%) |
| 25 to 29 Minutes | 1,432 (11.8%) | 490 (4.5%) |
| 30 to 34 Minutes | 1,406 (11.6%) | 1,204 (11.1%) |
| 35 to 39 Minutes | 351 (2.9%) | 224 (2.1%) |
| 40 to 44 Minutes | 429 (3.5%) | 290 (2.7%) |
| 45 to 59 Minutes | 1,046 (8.6%) | 727 (6.7%) |
| 60 to 89 Minutes | 627 (5.2%) | 487 (4.5%) |
| 90 or more Minutes | 406 (3.3%) | 199 (1.8%) |
Time of Departure to Work by Sex in Lacey
The most frequent times of departure to work in Lacey are 7:00 AM to 7:29 AM (1,699, 14.0%) for males and 7:00 AM to 7:29 AM (1,736, 16.1%) for females.
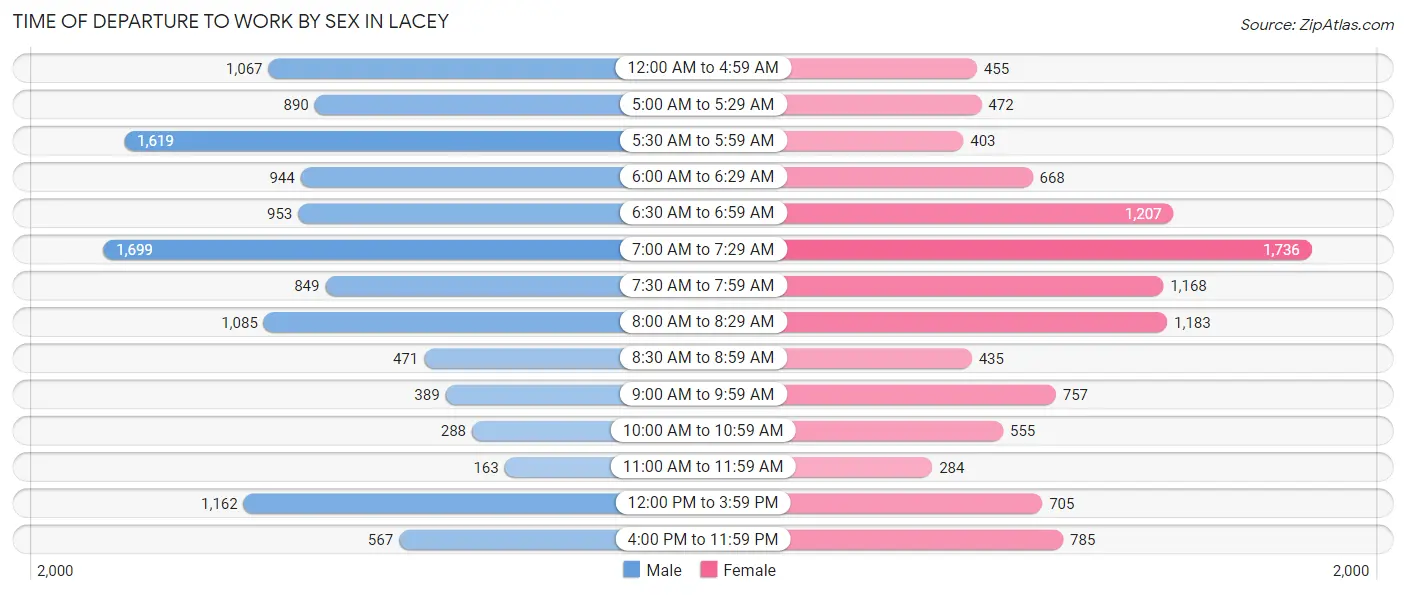
| Time of Departure | Male | Female |
| 12:00 AM to 4:59 AM | 1,067 (8.8%) | 455 (4.2%) |
| 5:00 AM to 5:29 AM | 890 (7.3%) | 472 (4.4%) |
| 5:30 AM to 5:59 AM | 1,619 (13.3%) | 403 (3.7%) |
| 6:00 AM to 6:29 AM | 944 (7.8%) | 668 (6.2%) |
| 6:30 AM to 6:59 AM | 953 (7.9%) | 1,207 (11.2%) |
| 7:00 AM to 7:29 AM | 1,699 (14.0%) | 1,736 (16.1%) |
| 7:30 AM to 7:59 AM | 849 (7.0%) | 1,168 (10.8%) |
| 8:00 AM to 8:29 AM | 1,085 (8.9%) | 1,183 (10.9%) |
| 8:30 AM to 8:59 AM | 471 (3.9%) | 435 (4.0%) |
| 9:00 AM to 9:59 AM | 389 (3.2%) | 757 (7.0%) |
| 10:00 AM to 10:59 AM | 288 (2.4%) | 555 (5.1%) |
| 11:00 AM to 11:59 AM | 163 (1.3%) | 284 (2.6%) |
| 12:00 PM to 3:59 PM | 1,162 (9.6%) | 705 (6.5%) |
| 4:00 PM to 11:59 PM | 567 (4.7%) | 785 (7.3%) |
| Total | 12,146 (100.0%) | 10,813 (100.0%) |
Housing Occupancy in Lacey
Occupancy by Ownership in Lacey
Of the total 22,256 dwellings in Lacey, owner-occupied units account for 12,881 (57.9%), while renter-occupied units make up 9,375 (42.1%).
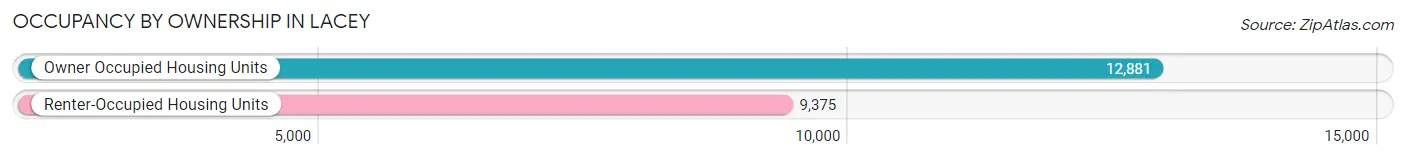
| Occupancy | # Housing Units | % Housing Units |
| Owner Occupied Housing Units | 12,881 | 57.9% |
| Renter-Occupied Housing Units | 9,375 | 42.1% |
| Total Occupied Housing Units | 22,256 | 100.0% |
Occupancy by Household Size in Lacey
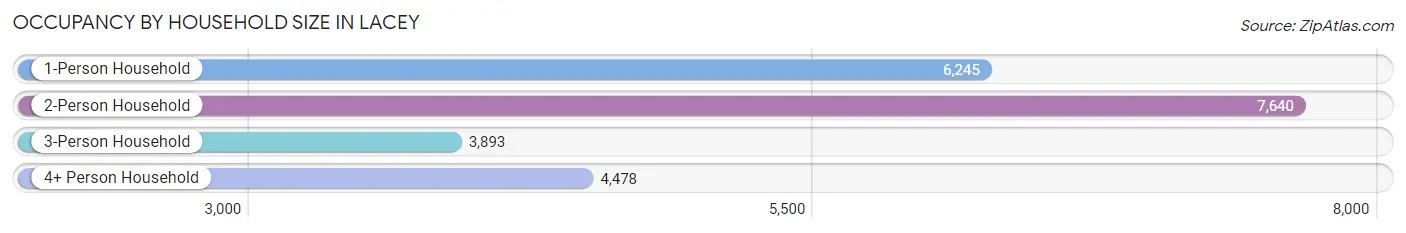
| Household Size | # Housing Units | % Housing Units |
| 1-Person Household | 6,245 | 28.1% |
| 2-Person Household | 7,640 | 34.3% |
| 3-Person Household | 3,893 | 17.5% |
| 4+ Person Household | 4,478 | 20.1% |
| Total Housing Units | 22,256 | 100.0% |
Occupancy by Ownership by Household Size in Lacey
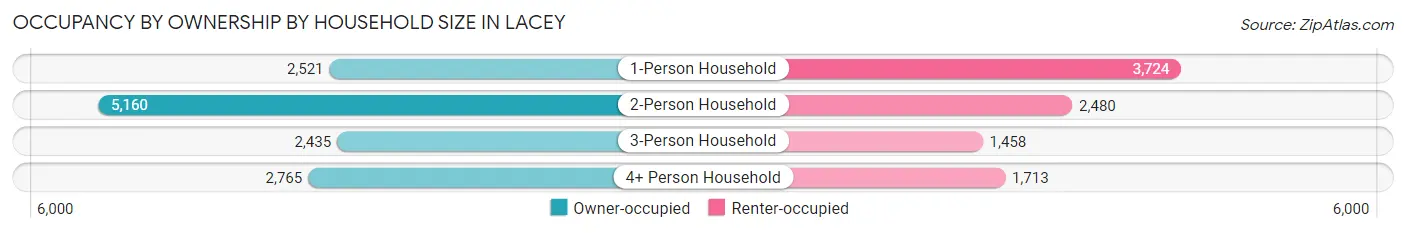
| Household Size | Owner-occupied | Renter-occupied |
| 1-Person Household | 2,521 (40.4%) | 3,724 (59.6%) |
| 2-Person Household | 5,160 (67.5%) | 2,480 (32.5%) |
| 3-Person Household | 2,435 (62.5%) | 1,458 (37.4%) |
| 4+ Person Household | 2,765 (61.8%) | 1,713 (38.3%) |
| Total Housing Units | 12,881 (57.9%) | 9,375 (42.1%) |
Occupancy by Educational Attainment in Lacey
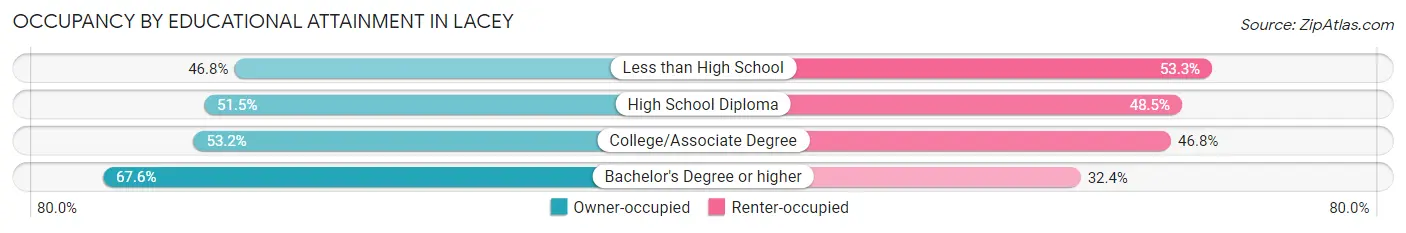
| Household Size | Owner-occupied | Renter-occupied |
| Less than High School | 395 (46.8%) | 450 (53.2%) |
| High School Diploma | 1,935 (51.5%) | 1,820 (48.5%) |
| College/Associate Degree | 5,106 (53.2%) | 4,490 (46.8%) |
| Bachelor's Degree or higher | 5,445 (67.6%) | 2,615 (32.4%) |
Occupancy by Age of Householder in Lacey
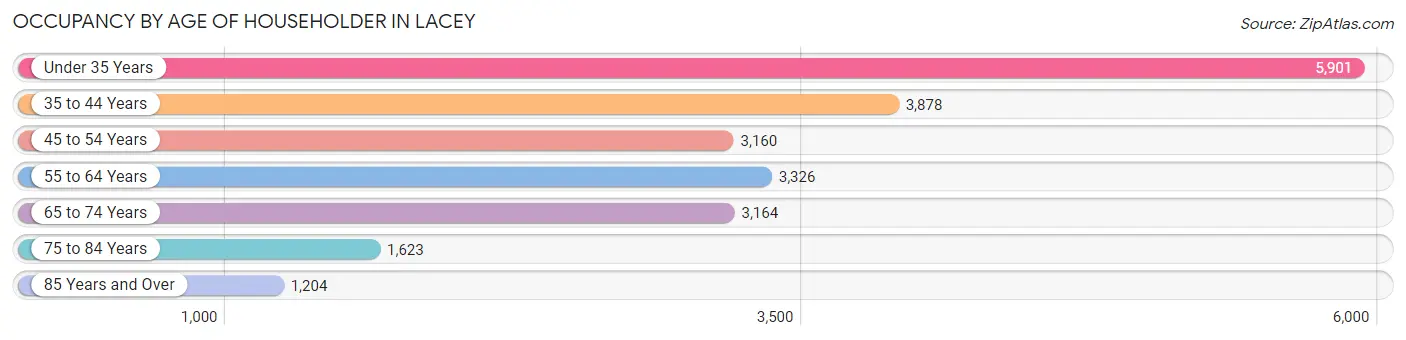
| Age Bracket | # Households | % Households |
| Under 35 Years | 5,901 | 26.5% |
| 35 to 44 Years | 3,878 | 17.4% |
| 45 to 54 Years | 3,160 | 14.2% |
| 55 to 64 Years | 3,326 | 14.9% |
| 65 to 74 Years | 3,164 | 14.2% |
| 75 to 84 Years | 1,623 | 7.3% |
| 85 Years and Over | 1,204 | 5.4% |
| Total | 22,256 | 100.0% |
Housing Finances in Lacey
Median Income by Occupancy in Lacey
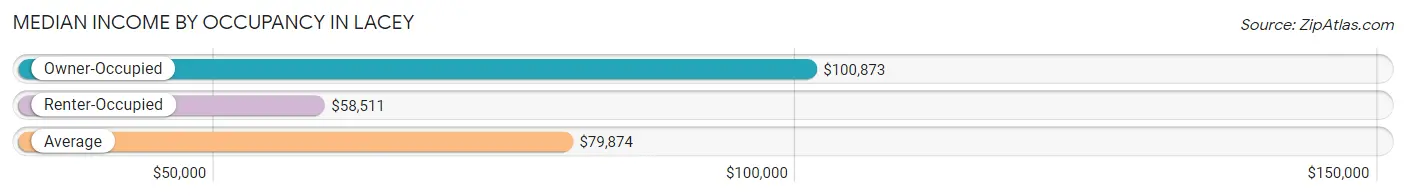
| Occupancy Type | # Households | Median Income |
| Owner-Occupied | 12,881 (57.9%) | $100,873 |
| Renter-Occupied | 9,375 (42.1%) | $58,511 |
| Average | 22,256 (100.0%) | $79,874 |
Occupancy by Householder Income Bracket in Lacey
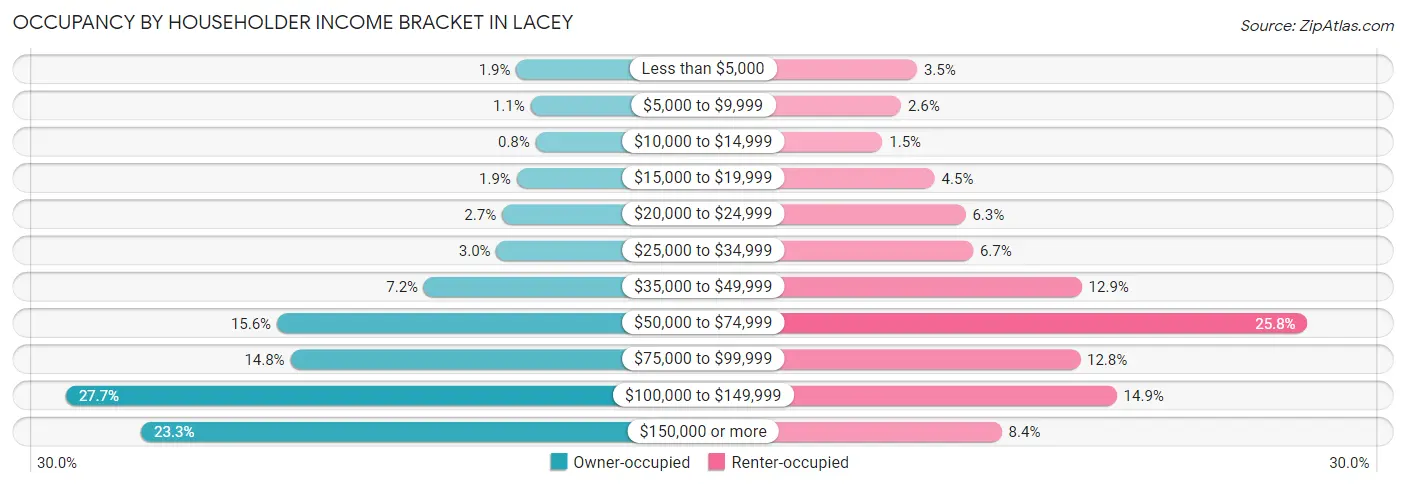
| Income Bracket | Owner-occupied | Renter-occupied |
| Less than $5,000 | 245 (1.9%) | 329 (3.5%) |
| $5,000 to $9,999 | 141 (1.1%) | 244 (2.6%) |
| $10,000 to $14,999 | 103 (0.8%) | 143 (1.5%) |
| $15,000 to $19,999 | 242 (1.9%) | 424 (4.5%) |
| $20,000 to $24,999 | 350 (2.7%) | 589 (6.3%) |
| $25,000 to $34,999 | 391 (3.0%) | 629 (6.7%) |
| $35,000 to $49,999 | 925 (7.2%) | 1,211 (12.9%) |
| $50,000 to $74,999 | 2,007 (15.6%) | 2,421 (25.8%) |
| $75,000 to $99,999 | 1,908 (14.8%) | 1,203 (12.8%) |
| $100,000 to $149,999 | 3,562 (27.7%) | 1,399 (14.9%) |
| $150,000 or more | 3,007 (23.3%) | 783 (8.4%) |
| Total | 12,881 (100.0%) | 9,375 (100.0%) |
Monthly Housing Cost Tiers in Lacey
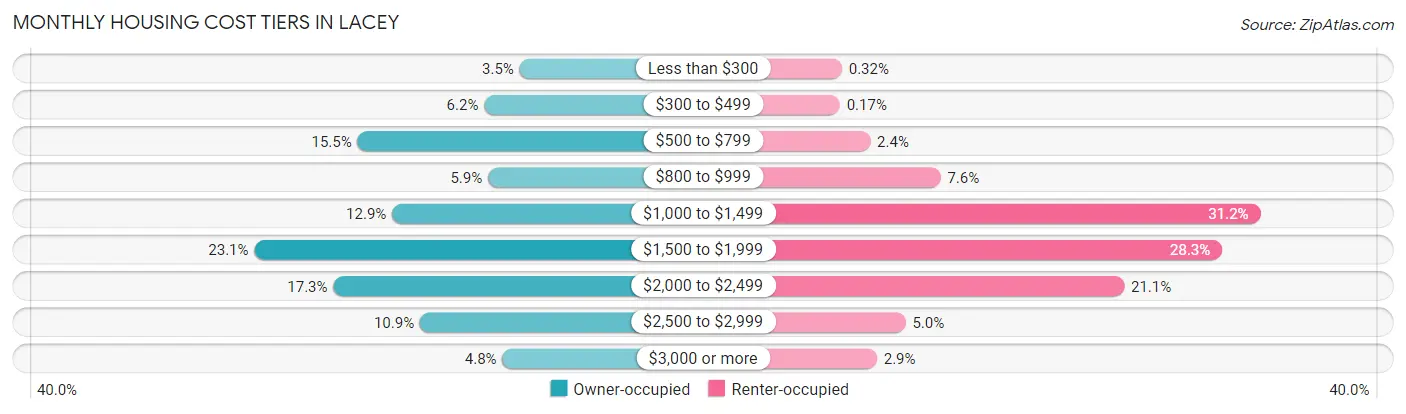
| Monthly Cost | Owner-occupied | Renter-occupied |
| Less than $300 | 456 (3.5%) | 30 (0.3%) |
| $300 to $499 | 792 (6.1%) | 16 (0.2%) |
| $500 to $799 | 1,994 (15.5%) | 226 (2.4%) |
| $800 to $999 | 756 (5.9%) | 712 (7.6%) |
| $1,000 to $1,499 | 1,666 (12.9%) | 2,920 (31.1%) |
| $1,500 to $1,999 | 2,973 (23.1%) | 2,656 (28.3%) |
| $2,000 to $2,499 | 2,223 (17.3%) | 1,979 (21.1%) |
| $2,500 to $2,999 | 1,401 (10.9%) | 470 (5.0%) |
| $3,000 or more | 620 (4.8%) | 272 (2.9%) |
| Total | 12,881 (100.0%) | 9,375 (100.0%) |
Physical Housing Characteristics in Lacey
Housing Structures in Lacey
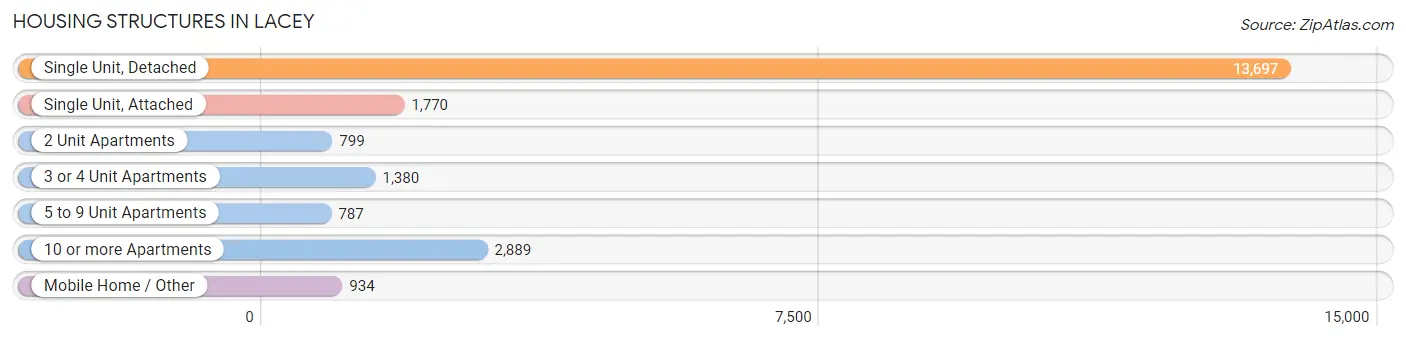
| Structure Type | # Housing Units | % Housing Units |
| Single Unit, Detached | 13,697 | 61.5% |
| Single Unit, Attached | 1,770 | 8.0% |
| 2 Unit Apartments | 799 | 3.6% |
| 3 or 4 Unit Apartments | 1,380 | 6.2% |
| 5 to 9 Unit Apartments | 787 | 3.5% |
| 10 or more Apartments | 2,889 | 13.0% |
| Mobile Home / Other | 934 | 4.2% |
| Total | 22,256 | 100.0% |
Housing Structures by Occupancy in Lacey
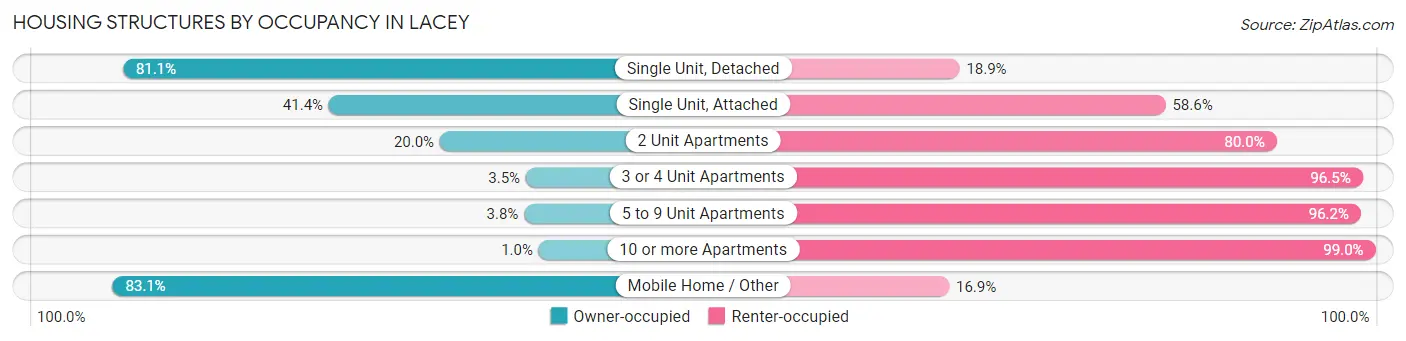
| Structure Type | Owner-occupied | Renter-occupied |
| Single Unit, Detached | 11,105 (81.1%) | 2,592 (18.9%) |
| Single Unit, Attached | 733 (41.4%) | 1,037 (58.6%) |
| 2 Unit Apartments | 160 (20.0%) | 639 (80.0%) |
| 3 or 4 Unit Apartments | 48 (3.5%) | 1,332 (96.5%) |
| 5 to 9 Unit Apartments | 30 (3.8%) | 757 (96.2%) |
| 10 or more Apartments | 29 (1.0%) | 2,860 (99.0%) |
| Mobile Home / Other | 776 (83.1%) | 158 (16.9%) |
| Total | 12,881 (57.9%) | 9,375 (42.1%) |
Housing Structures by Number of Rooms in Lacey
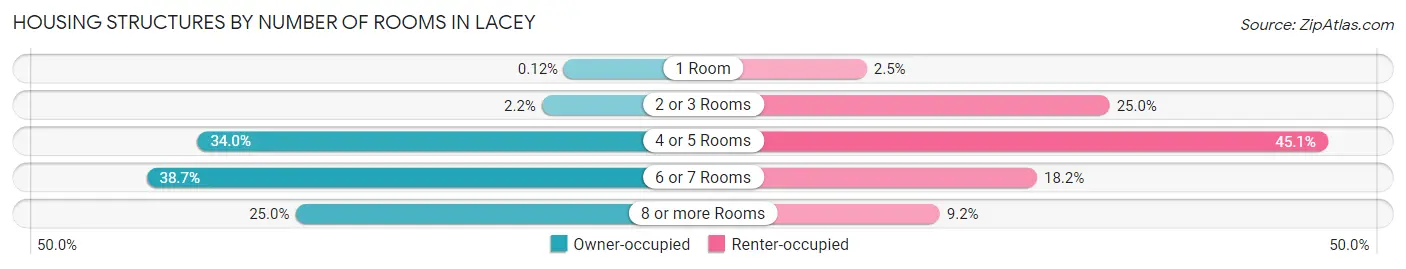
| Number of Rooms | Owner-occupied | Renter-occupied |
| 1 Room | 16 (0.1%) | 233 (2.5%) |
| 2 or 3 Rooms | 281 (2.2%) | 2,339 (24.9%) |
| 4 or 5 Rooms | 4,381 (34.0%) | 4,228 (45.1%) |
| 6 or 7 Rooms | 4,987 (38.7%) | 1,709 (18.2%) |
| 8 or more Rooms | 3,216 (25.0%) | 866 (9.2%) |
| Total | 12,881 (100.0%) | 9,375 (100.0%) |
Housing Structure by Heating Type in Lacey
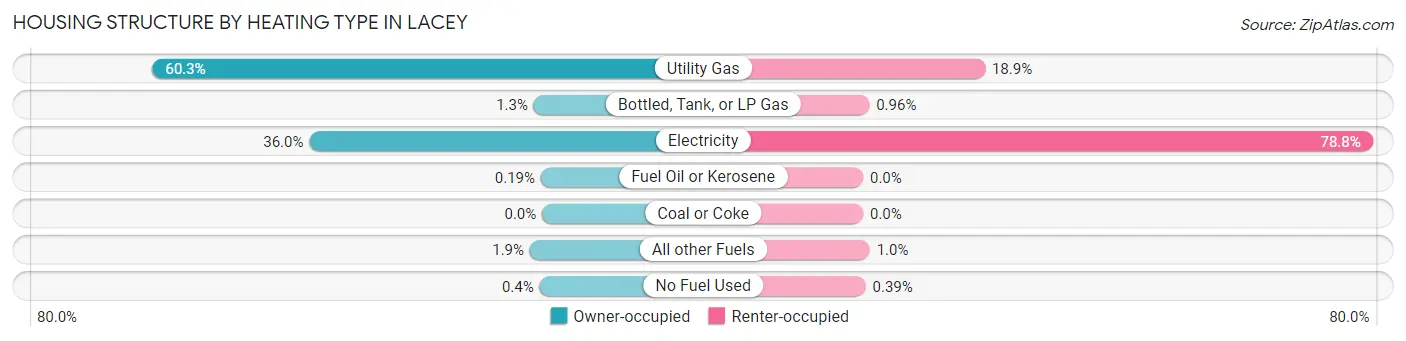
| Heating Type | Owner-occupied | Renter-occupied |
| Utility Gas | 7,761 (60.3%) | 1,767 (18.9%) |
| Bottled, Tank, or LP Gas | 165 (1.3%) | 90 (1.0%) |
| Electricity | 4,636 (36.0%) | 7,384 (78.8%) |
| Fuel Oil or Kerosene | 24 (0.2%) | 0 (0.0%) |
| Coal or Coke | 0 (0.0%) | 0 (0.0%) |
| All other Fuels | 244 (1.9%) | 97 (1.0%) |
| No Fuel Used | 51 (0.4%) | 37 (0.4%) |
| Total | 12,881 (100.0%) | 9,375 (100.0%) |
Household Vehicle Usage in Lacey
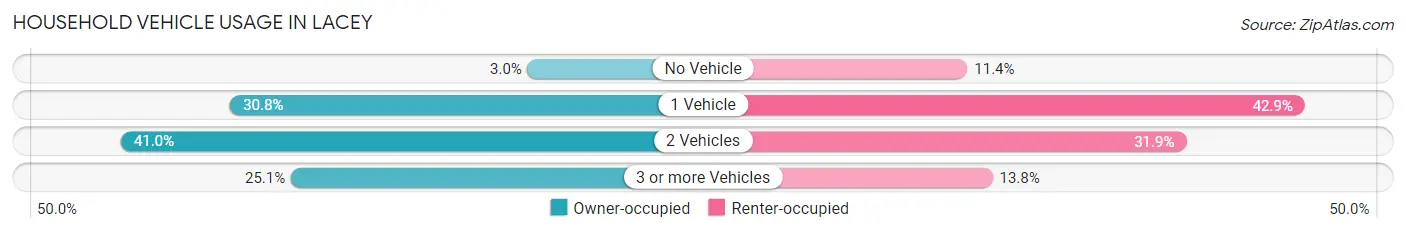
| Vehicles per Household | Owner-occupied | Renter-occupied |
| No Vehicle | 392 (3.0%) | 1,072 (11.4%) |
| 1 Vehicle | 3,969 (30.8%) | 4,024 (42.9%) |
| 2 Vehicles | 5,283 (41.0%) | 2,987 (31.9%) |
| 3 or more Vehicles | 3,237 (25.1%) | 1,292 (13.8%) |
| Total | 12,881 (100.0%) | 9,375 (100.0%) |
Real Estate & Mortgages in Lacey
Real Estate and Mortgage Overview in Lacey
| Characteristic | Without Mortgage | With Mortgage |
| Housing Units | 4,007 | 8,874 |
| Median Property Value | $343,300 | $390,500 |
| Median Household Income | $78,664 | $2,321 |
| Monthly Housing Costs | $641 | $620 |
| Real Estate Taxes | $3,037 | $214 |
Property Value by Mortgage Status in Lacey
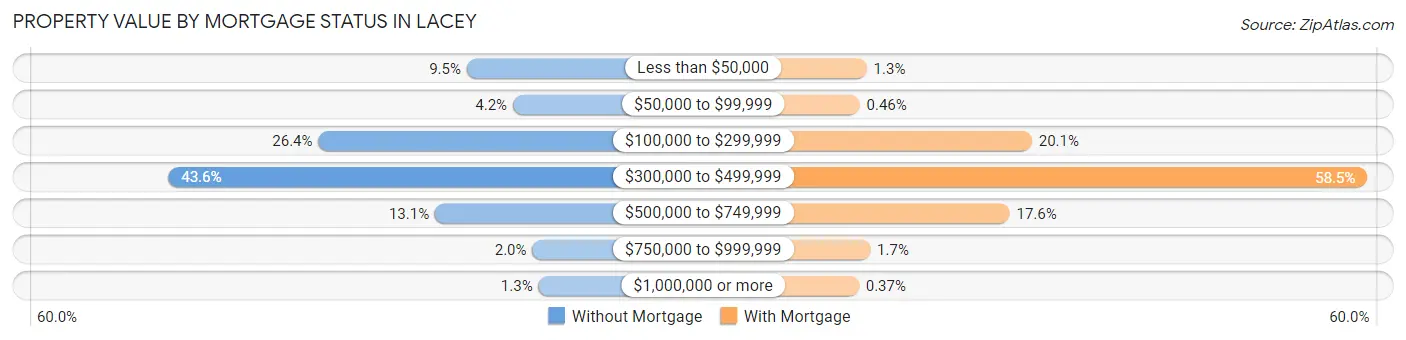
| Property Value | Without Mortgage | With Mortgage |
| Less than $50,000 | 379 (9.5%) | 113 (1.3%) |
| $50,000 to $99,999 | 168 (4.2%) | 41 (0.5%) |
| $100,000 to $299,999 | 1,059 (26.4%) | 1,787 (20.1%) |
| $300,000 to $499,999 | 1,746 (43.6%) | 5,190 (58.5%) |
| $500,000 to $749,999 | 525 (13.1%) | 1,562 (17.6%) |
| $750,000 to $999,999 | 79 (2.0%) | 148 (1.7%) |
| $1,000,000 or more | 51 (1.3%) | 33 (0.4%) |
| Total | 4,007 (100.0%) | 8,874 (100.0%) |
Household Income by Mortgage Status in Lacey
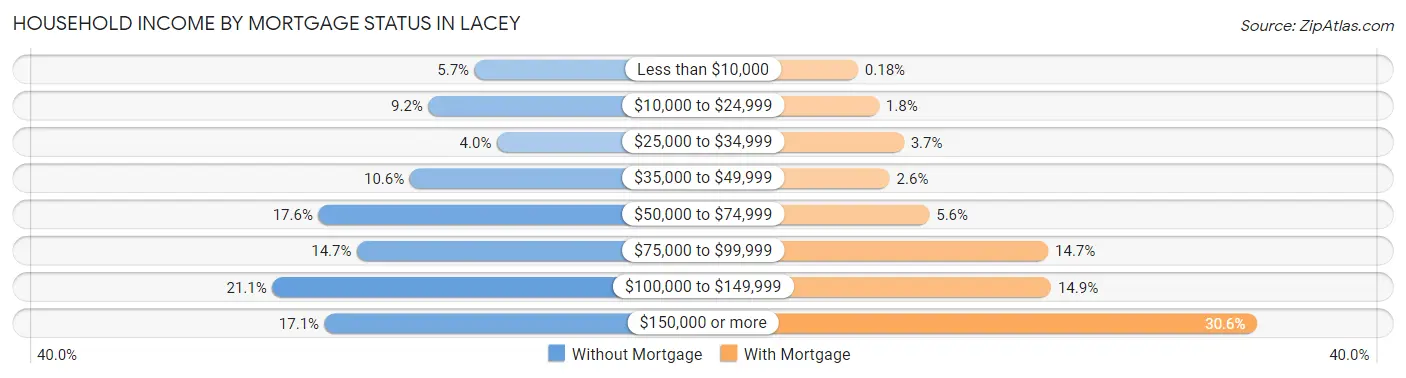
| Household Income | Without Mortgage | With Mortgage |
| Less than $10,000 | 228 (5.7%) | 16 (0.2%) |
| $10,000 to $24,999 | 369 (9.2%) | 158 (1.8%) |
| $25,000 to $34,999 | 160 (4.0%) | 326 (3.7%) |
| $35,000 to $49,999 | 426 (10.6%) | 231 (2.6%) |
| $50,000 to $74,999 | 705 (17.6%) | 499 (5.6%) |
| $75,000 to $99,999 | 587 (14.6%) | 1,302 (14.7%) |
| $100,000 to $149,999 | 846 (21.1%) | 1,321 (14.9%) |
| $150,000 or more | 686 (17.1%) | 2,716 (30.6%) |
| Total | 4,007 (100.0%) | 8,874 (100.0%) |
Property Value to Household Income Ratio in Lacey
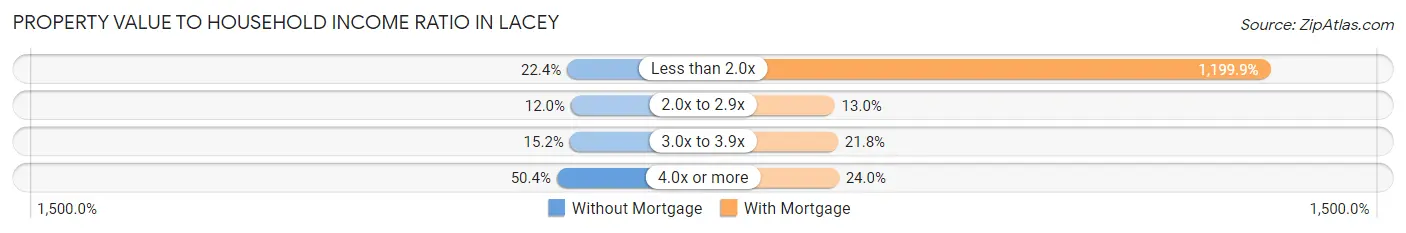
| Value-to-Income Ratio | Without Mortgage | With Mortgage |
| Less than 2.0x | 896 (22.4%) | 106,483 (1,199.9%) |
| 2.0x to 2.9x | 479 (11.9%) | 1,150 (13.0%) |
| 3.0x to 3.9x | 608 (15.2%) | 1,934 (21.8%) |
| 4.0x or more | 2,019 (50.4%) | 2,130 (24.0%) |
| Total | 4,007 (100.0%) | 8,874 (100.0%) |
Real Estate Taxes by Mortgage Status in Lacey
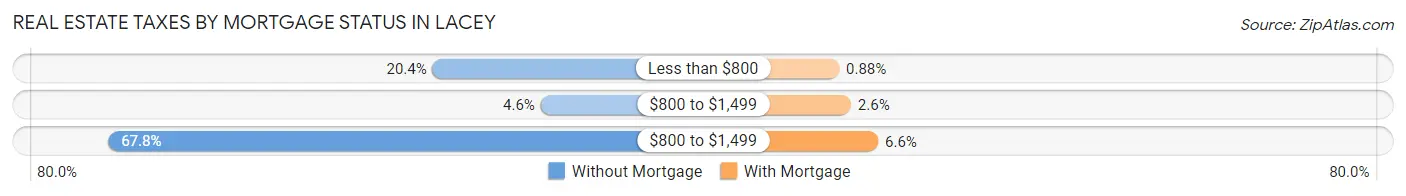
| Property Taxes | Without Mortgage | With Mortgage |
| Less than $800 | 817 (20.4%) | 78 (0.9%) |
| $800 to $1,499 | 184 (4.6%) | 232 (2.6%) |
| $800 to $1,499 | 2,716 (67.8%) | 584 (6.6%) |
| Total | 4,007 (100.0%) | 8,874 (100.0%) |
Health & Disability in Lacey
Health Insurance Coverage by Age in Lacey
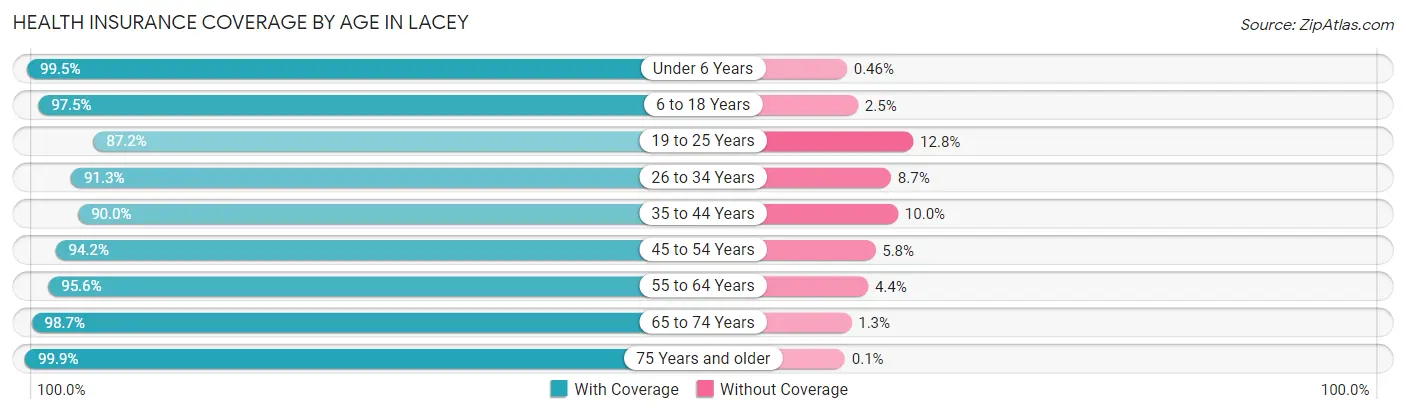
| Age Bracket | With Coverage | Without Coverage |
| Under 6 Years | 4,122 (99.5%) | 19 (0.5%) |
| 6 to 18 Years | 8,353 (97.5%) | 218 (2.5%) |
| 19 to 25 Years | 4,404 (87.2%) | 649 (12.8%) |
| 26 to 34 Years | 7,036 (91.3%) | 670 (8.7%) |
| 35 to 44 Years | 6,294 (90.0%) | 699 (10.0%) |
| 45 to 54 Years | 5,348 (94.2%) | 328 (5.8%) |
| 55 to 64 Years | 5,646 (95.6%) | 261 (4.4%) |
| 65 to 74 Years | 5,523 (98.7%) | 73 (1.3%) |
| 75 Years and older | 4,029 (99.9%) | 4 (0.1%) |
| Total | 50,755 (94.6%) | 2,921 (5.4%) |
Health Insurance Coverage by Citizenship Status in Lacey
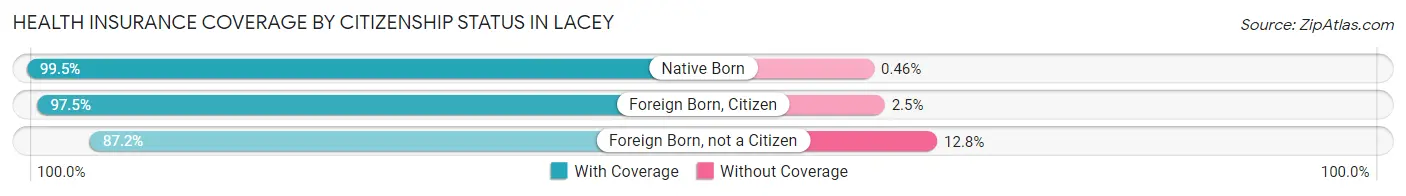
| Citizenship Status | With Coverage | Without Coverage |
| Native Born | 4,122 (99.5%) | 19 (0.5%) |
| Foreign Born, Citizen | 8,353 (97.5%) | 218 (2.5%) |
| Foreign Born, not a Citizen | 4,404 (87.2%) | 649 (12.8%) |
Health Insurance Coverage by Household Income in Lacey
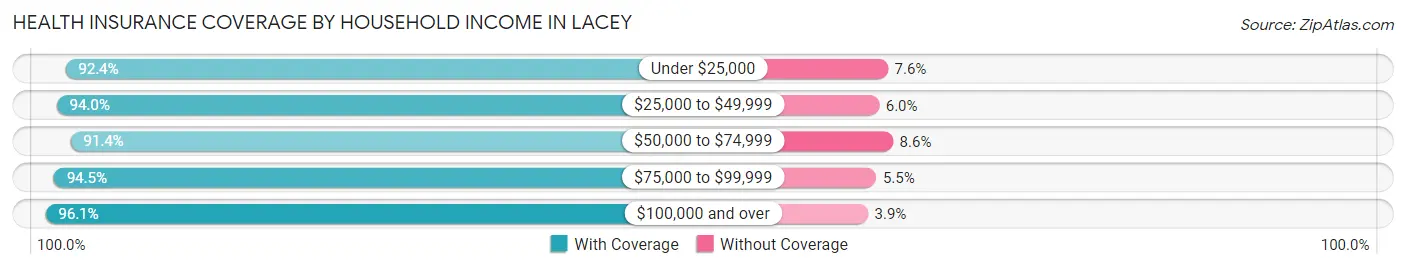
| Household Income | With Coverage | Without Coverage |
| Under $25,000 | 4,754 (92.4%) | 393 (7.6%) |
| $25,000 to $49,999 | 5,103 (94.0%) | 325 (6.0%) |
| $50,000 to $74,999 | 8,214 (91.4%) | 772 (8.6%) |
| $75,000 to $99,999 | 7,149 (94.5%) | 414 (5.5%) |
| $100,000 and over | 24,883 (96.1%) | 1,007 (3.9%) |
Public vs Private Health Insurance Coverage by Age in Lacey
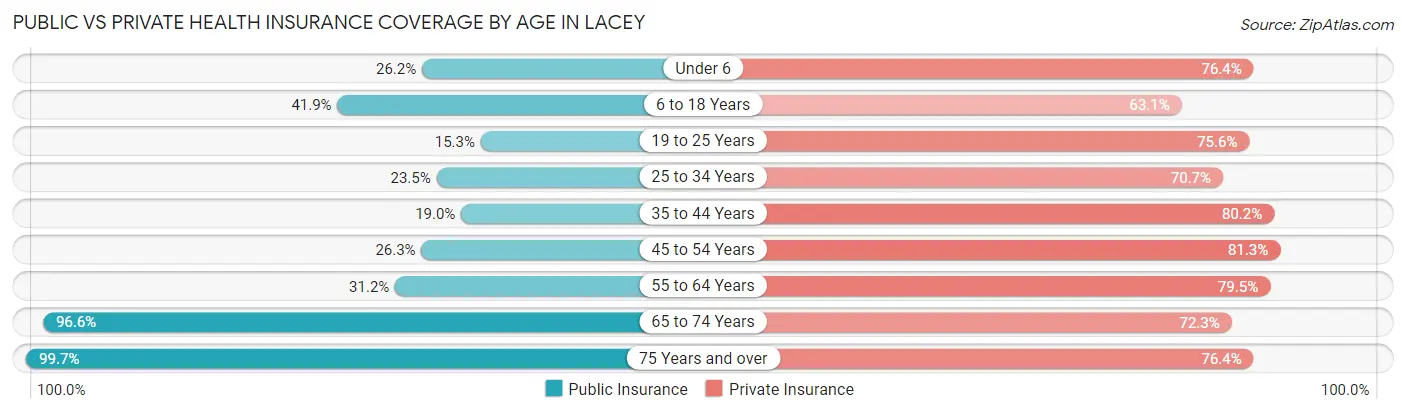
| Age Bracket | Public Insurance | Private Insurance |
| Under 6 | 1,086 (26.2%) | 3,165 (76.4%) |
| 6 to 18 Years | 3,594 (41.9%) | 5,404 (63.0%) |
| 19 to 25 Years | 774 (15.3%) | 3,821 (75.6%) |
| 25 to 34 Years | 1,813 (23.5%) | 5,450 (70.7%) |
| 35 to 44 Years | 1,326 (19.0%) | 5,610 (80.2%) |
| 45 to 54 Years | 1,495 (26.3%) | 4,617 (81.3%) |
| 55 to 64 Years | 1,844 (31.2%) | 4,694 (79.5%) |
| 65 to 74 Years | 5,405 (96.6%) | 4,048 (72.3%) |
| 75 Years and over | 4,021 (99.7%) | 3,082 (76.4%) |
| Total | 21,358 (39.8%) | 39,891 (74.3%) |
Disability Status by Sex by Age in Lacey
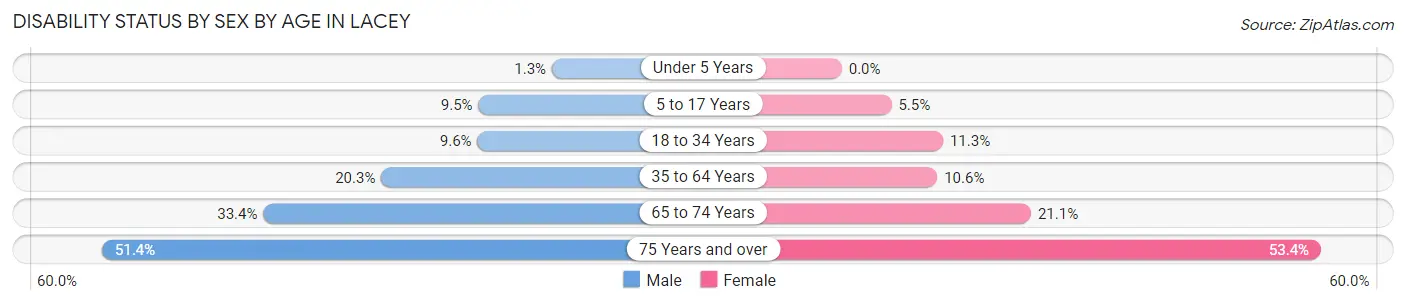
| Age Bracket | Male | Female |
| Under 5 Years | 28 (1.3%) | 0 (0.0%) |
| 5 to 17 Years | 434 (9.5%) | 222 (5.5%) |
| 18 to 34 Years | 594 (9.6%) | 806 (11.3%) |
| 35 to 64 Years | 1,772 (20.3%) | 1,046 (10.6%) |
| 65 to 74 Years | 863 (33.4%) | 635 (21.1%) |
| 75 Years and over | 759 (51.4%) | 1,364 (53.4%) |
Disability Class by Sex by Age in Lacey
Disability Class: Hearing Difficulty
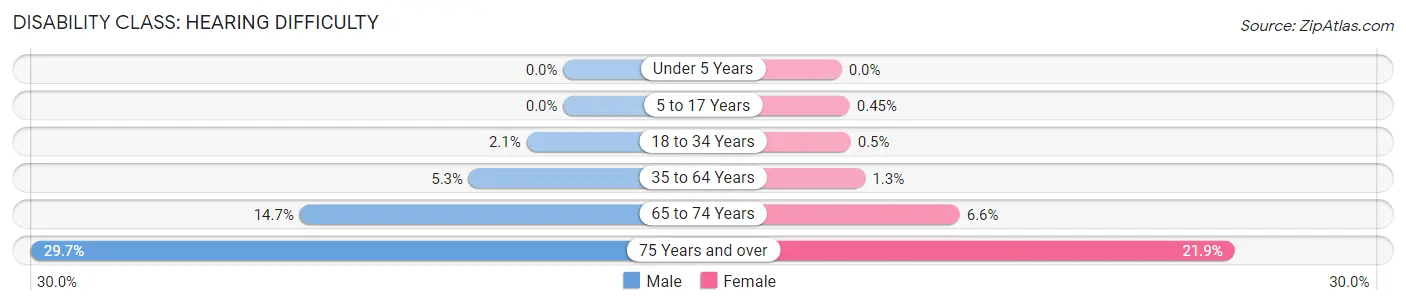
| Age Bracket | Male | Female |
| Under 5 Years | 0 (0.0%) | 0 (0.0%) |
| 5 to 17 Years | 0 (0.0%) | 18 (0.4%) |
| 18 to 34 Years | 127 (2.1%) | 36 (0.5%) |
| 35 to 64 Years | 460 (5.3%) | 130 (1.3%) |
| 65 to 74 Years | 379 (14.7%) | 198 (6.6%) |
| 75 Years and over | 438 (29.6%) | 559 (21.9%) |
Disability Class: Vision Difficulty
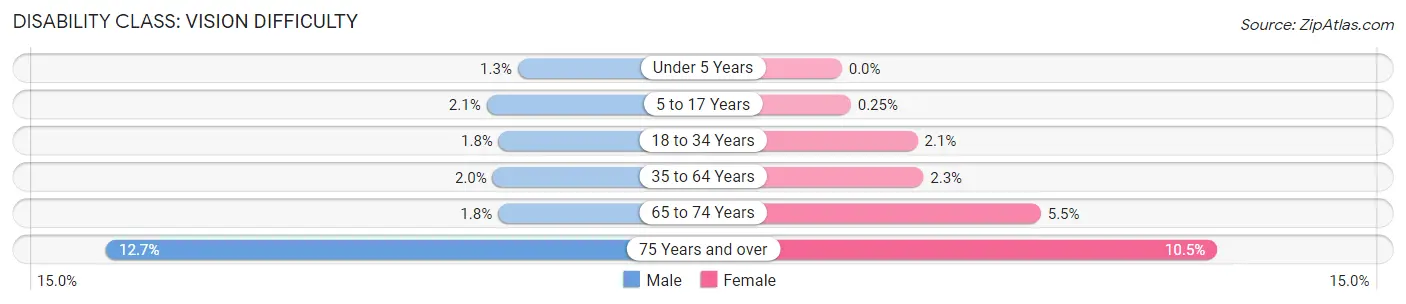
| Age Bracket | Male | Female |
| Under 5 Years | 28 (1.3%) | 0 (0.0%) |
| 5 to 17 Years | 98 (2.1%) | 10 (0.3%) |
| 18 to 34 Years | 112 (1.8%) | 151 (2.1%) |
| 35 to 64 Years | 172 (2.0%) | 223 (2.3%) |
| 65 to 74 Years | 47 (1.8%) | 167 (5.5%) |
| 75 Years and over | 188 (12.7%) | 267 (10.4%) |
Disability Class: Cognitive Difficulty
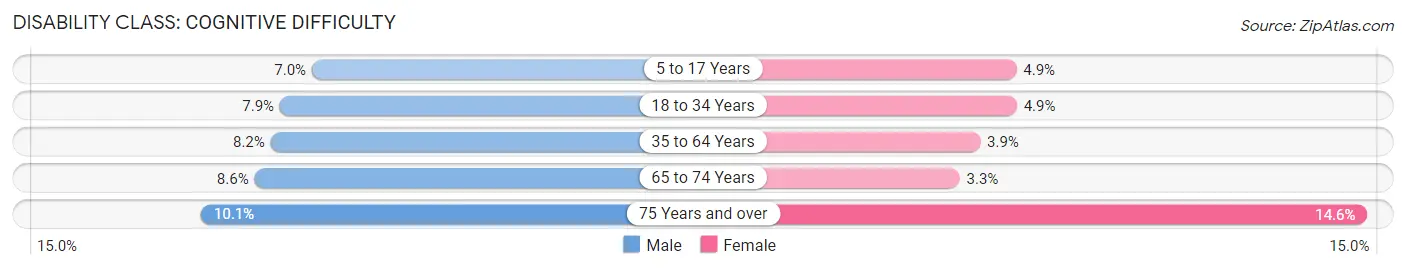
| Age Bracket | Male | Female |
| 5 to 17 Years | 321 (7.0%) | 195 (4.9%) |
| 18 to 34 Years | 490 (7.9%) | 348 (4.9%) |
| 35 to 64 Years | 712 (8.2%) | 379 (3.8%) |
| 65 to 74 Years | 222 (8.6%) | 99 (3.3%) |
| 75 Years and over | 149 (10.1%) | 374 (14.6%) |
Disability Class: Ambulatory Difficulty
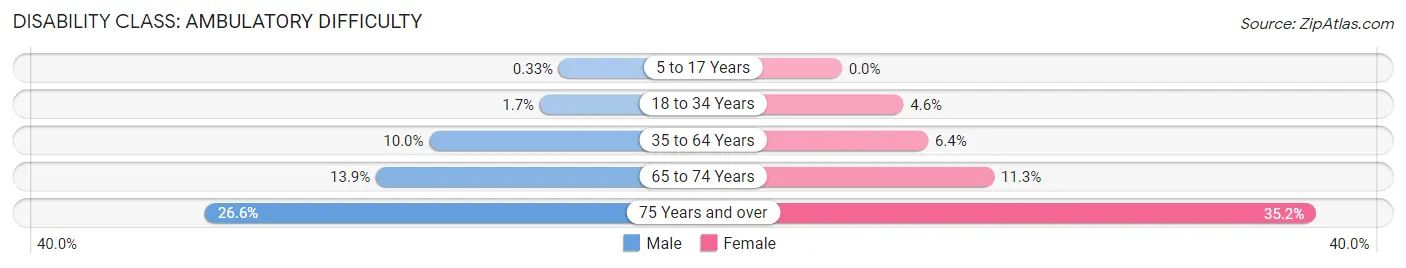
| Age Bracket | Male | Female |
| 5 to 17 Years | 15 (0.3%) | 0 (0.0%) |
| 18 to 34 Years | 108 (1.7%) | 327 (4.6%) |
| 35 to 64 Years | 869 (10.0%) | 630 (6.4%) |
| 65 to 74 Years | 359 (13.9%) | 341 (11.3%) |
| 75 Years and over | 393 (26.6%) | 900 (35.2%) |
Disability Class: Self-Care Difficulty
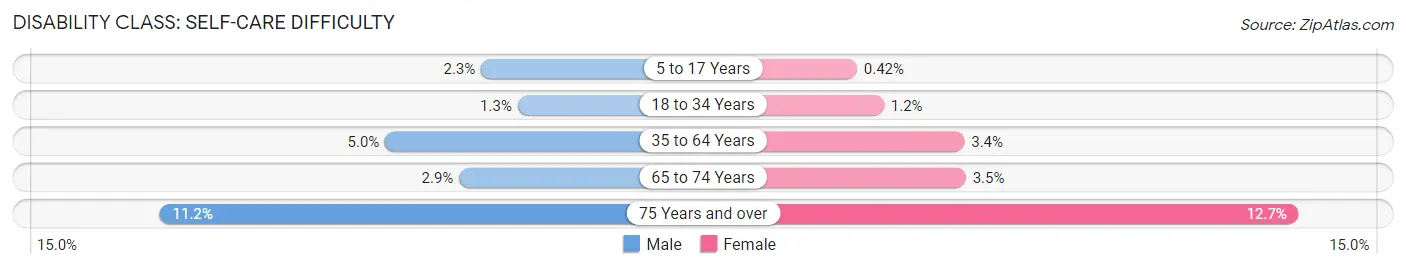
| Age Bracket | Male | Female |
| 5 to 17 Years | 105 (2.3%) | 17 (0.4%) |
| 18 to 34 Years | 79 (1.3%) | 84 (1.2%) |
| 35 to 64 Years | 433 (5.0%) | 335 (3.4%) |
| 65 to 74 Years | 75 (2.9%) | 104 (3.5%) |
| 75 Years and over | 166 (11.2%) | 325 (12.7%) |
Technology Access in Lacey
Computing Device Access in Lacey
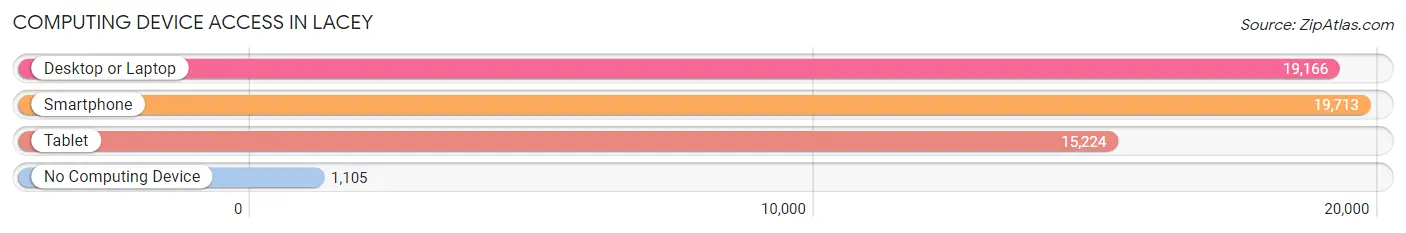
| Device Type | # Households | % Households |
| Desktop or Laptop | 19,166 | 86.1% |
| Smartphone | 19,713 | 88.6% |
| Tablet | 15,224 | 68.4% |
| No Computing Device | 1,105 | 5.0% |
| Total | 22,256 | 100.0% |
Internet Access in Lacey
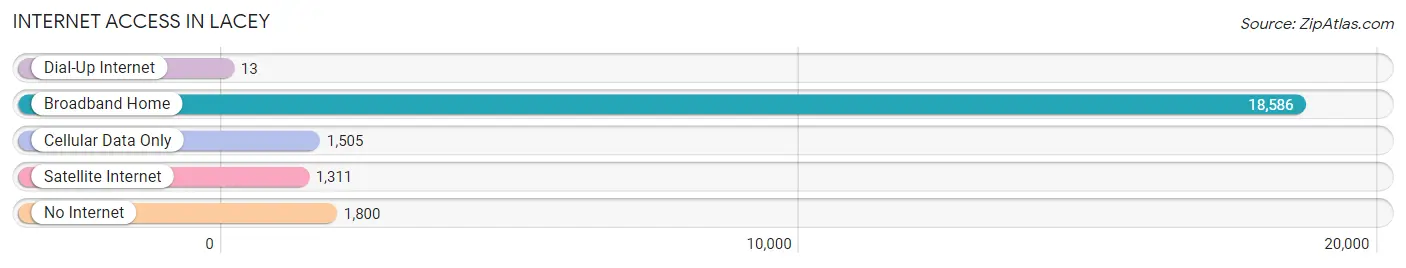
| Internet Type | # Households | % Households |
| Dial-Up Internet | 13 | 0.1% |
| Broadband Home | 18,586 | 83.5% |
| Cellular Data Only | 1,505 | 6.8% |
| Satellite Internet | 1,311 | 5.9% |
| No Internet | 1,800 | 8.1% |
| Total | 22,256 | 100.0% |
Lacey Summary
Lacey is a city located in Thurston County, Washington, United States. It is situated in the southern portion of the Puget Sound region, approximately 10 miles (16 km) northeast of Olympia, the state capital. As of the 2010 census, the population of Lacey was 42,393, making it the sixth-largest city in Washington.
History
The area that is now Lacey was originally inhabited by the Nisqually people, who were part of the Coast Salish culture. The first European settlers arrived in the area in the 1850s, and the area was officially incorporated as a city in 1966.
The city was named after O.C. Lacey, a local landowner who donated land for the construction of a school in the area. The city was originally a small farming community, but it has grown rapidly in recent years due to its proximity to Olympia and Joint Base Lewis-McChord.
Geography
Lacey is located in the southern portion of the Puget Sound region, approximately 10 miles (16 km) northeast of Olympia. It is situated on the western shore of Puget Sound, and is bordered by the cities of Olympia, Tumwater, and Yelm. The city covers an area of 16.3 square miles (42.2 km2), and has a total elevation of 246 feet (75 m).
The city is located in a temperate climate zone, with mild winters and warm summers. The average annual temperature is 52.2 °F (11.2 °C), and the average annual precipitation is 37.2 inches (94.5 cm).
Economy
Lacey is home to a variety of businesses, including retail stores, restaurants, and professional services. The city is also home to several large employers, including the state government, Joint Base Lewis-McChord, and Providence St. Peter Hospital.
The city's economy is largely driven by the retail and service sectors, which account for nearly half of the city's total employment. Other major industries include healthcare, government, and manufacturing.
Demographics
As of the 2010 census, the population of Lacey was 42,393, with a population density of 2,611 people per square mile (1,006/km2). The median age of the population was 36.7 years, and the median household income was $60,945.
The racial makeup of the city was 79.2% White, 8.2% Hispanic or Latino, 6.3% Asian, 4.2% African American, and 2.1% Native American. The city is also home to a large number of immigrants, with nearly 10% of the population being foreign-born.
Conclusion
Lacey is a city located in Thurston County, Washington, United States. It is situated in the southern portion of the Puget Sound region, approximately 10 miles (16 km) northeast of Olympia, the state capital. As of the 2010 census, the population of Lacey was 42,393, making it the sixth-largest city in Washington. The city was originally a small farming community, but it has grown rapidly in recent years due to its proximity to Olympia and Joint Base Lewis-McChord. The city's economy is largely driven by the retail and service sectors, and the population is largely composed of White, Hispanic or Latino, Asian, African American, and Native American residents.
Common Questions
What is Per Capita Income in Lacey?
Per Capita income in Lacey is $37,663.
What is the Median Family Income in Lacey?
Median Family Income in Lacey is $100,392.
What is the Median Household income in Lacey?
Median Household Income in Lacey is $79,874.
What is Income or Wage Gap in Lacey?
Income or Wage Gap in Lacey is 15.1%.
Women in Lacey earn 84.9 cents for every dollar earned by a man.
What is Family Income Deficit in Lacey?
Family Income Deficit in Lacey is $12,344.
Families that are below poverty line in Lacey earn $12,344 less on average than the poverty threshold level.
What is Inequality or Gini Index in Lacey?
Inequality or Gini Index in Lacey is 0.38.
What is the Total Population of Lacey?
Total Population of Lacey is 56,263.
What is the Total Male Population of Lacey?
Total Male Population of Lacey is 27,681.
What is the Total Female Population of Lacey?
Total Female Population of Lacey is 28,582.
What is the Ratio of Males per 100 Females in Lacey?
There are 96.85 Males per 100 Females in Lacey.
What is the Ratio of Females per 100 Males in Lacey?
There are 103.25 Females per 100 Males in Lacey.
What is the Median Population Age in Lacey?
Median Population Age in Lacey is 36.5 Years.
What is the Average Family Size in Lacey
Average Family Size in Lacey is 3.0 People.
What is the Average Household Size in Lacey
Average Household Size in Lacey is 2.5 People.
How Large is the Labor Force in Lacey?
There are 28,264 People in the Labor Forcein in Lacey.
What is the Percentage of People in the Labor Force in Lacey?
62.5% of People are in the Labor Force in Lacey.
What is the Unemployment Rate in Lacey?
Unemployment Rate in Lacey is 5.4%.