Barclay, NJ Map & Demographics
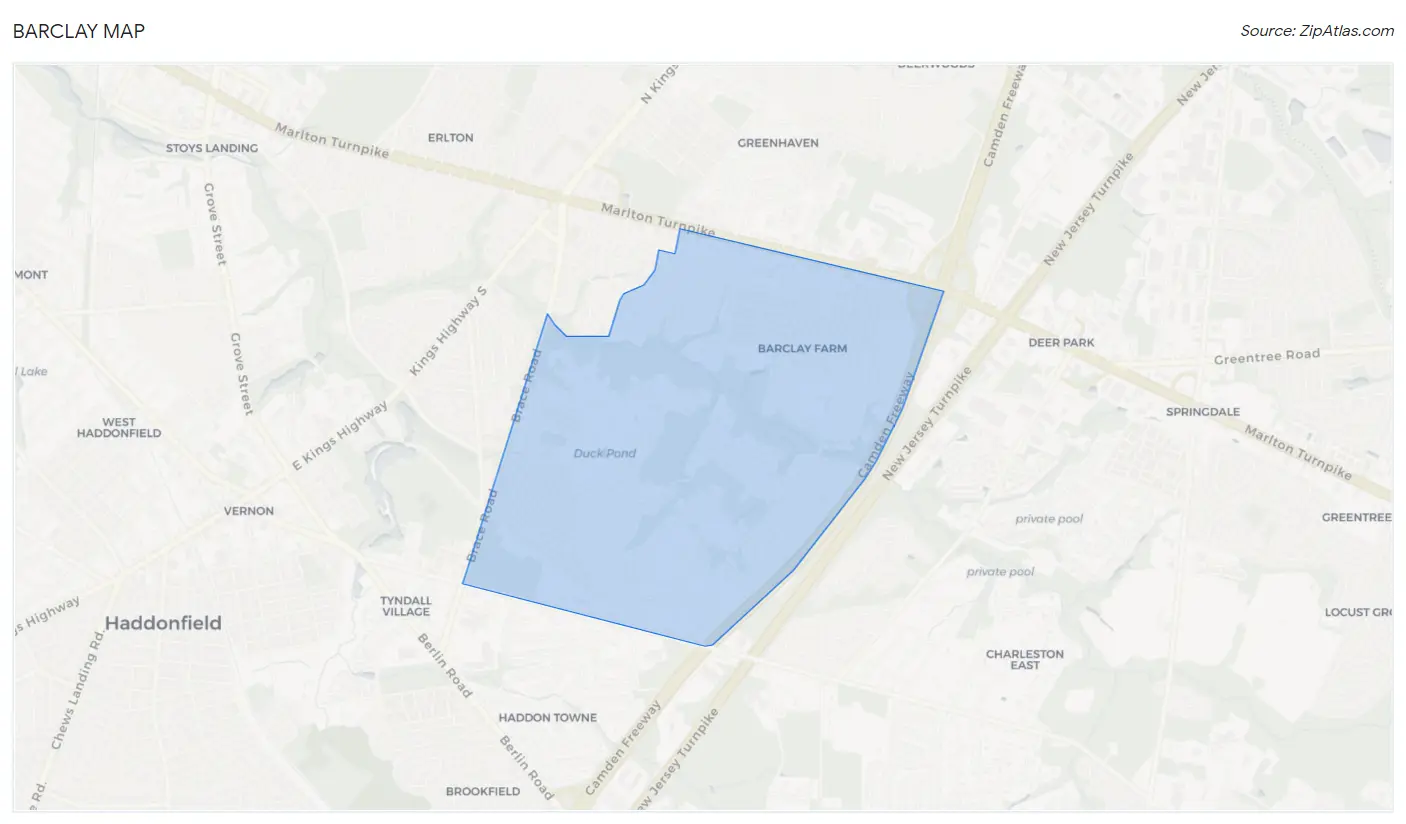
Barclay Map
Barclay Overview
$70,040
PER CAPITA INCOME
$175,600
AVG FAMILY INCOME
$156,696
AVG HOUSEHOLD INCOME
61.4%
WAGE / INCOME GAP [ % ]
38.6¢/ $1
WAGE / INCOME GAP [ $ ]
0.40
INEQUALITY / GINI INDEX
4,504
TOTAL POPULATION
2,085
MALE POPULATION
2,419
FEMALE POPULATION
86.19
MALES / 100 FEMALES
116.02
FEMALES / 100 MALES
44.1
MEDIAN AGE
3.2
AVG FAMILY SIZE
2.8
AVG HOUSEHOLD SIZE
2,370
LABOR FORCE [ PEOPLE ]
66.6%
PERCENT IN LABOR FORCE
3.4%
UNEMPLOYMENT RATE
Income in Barclay
Income Overview in Barclay
Per Capita Income in Barclay is $70,040, while median incomes of families and households are $175,600 and $156,696 respectively.
| Characteristic | Number | Measure |
| Per Capita Income | 4,504 | $70,040 |
| Median Family Income | 1,304 | $175,600 |
| Mean Family Income | 1,304 | $216,907 |
| Median Household Income | 1,624 | $156,696 |
| Mean Household Income | 1,624 | $193,013 |
| Income Deficit | 1,304 | $0 |
| Wage / Income Gap (%) | 4,504 | 61.42% |
| Wage / Income Gap ($) | 4,504 | 38.58¢ per $1 |
| Gini / Inequality Index | 4,504 | 0.40 |
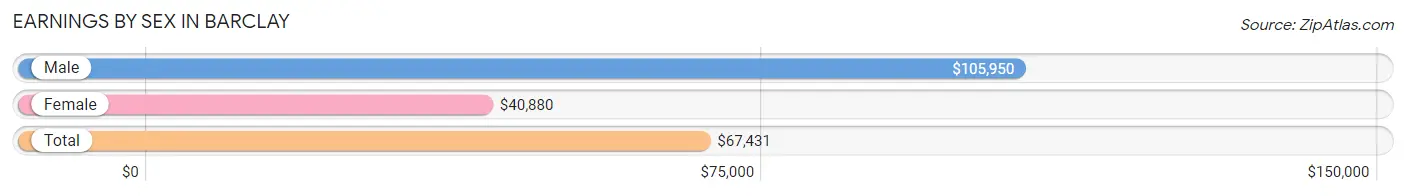
Earnings by Sex in Barclay
Average Earnings in Barclay are $67,431, $105,950 for men and $40,880 for women, a difference of 61.4%.
| Sex | Number | Average Earnings |
| Male | 1,207 (47.9%) | $105,950 |
| Female | 1,315 (52.1%) | $40,880 |
| Total | 2,522 (100.0%) | $67,431 |
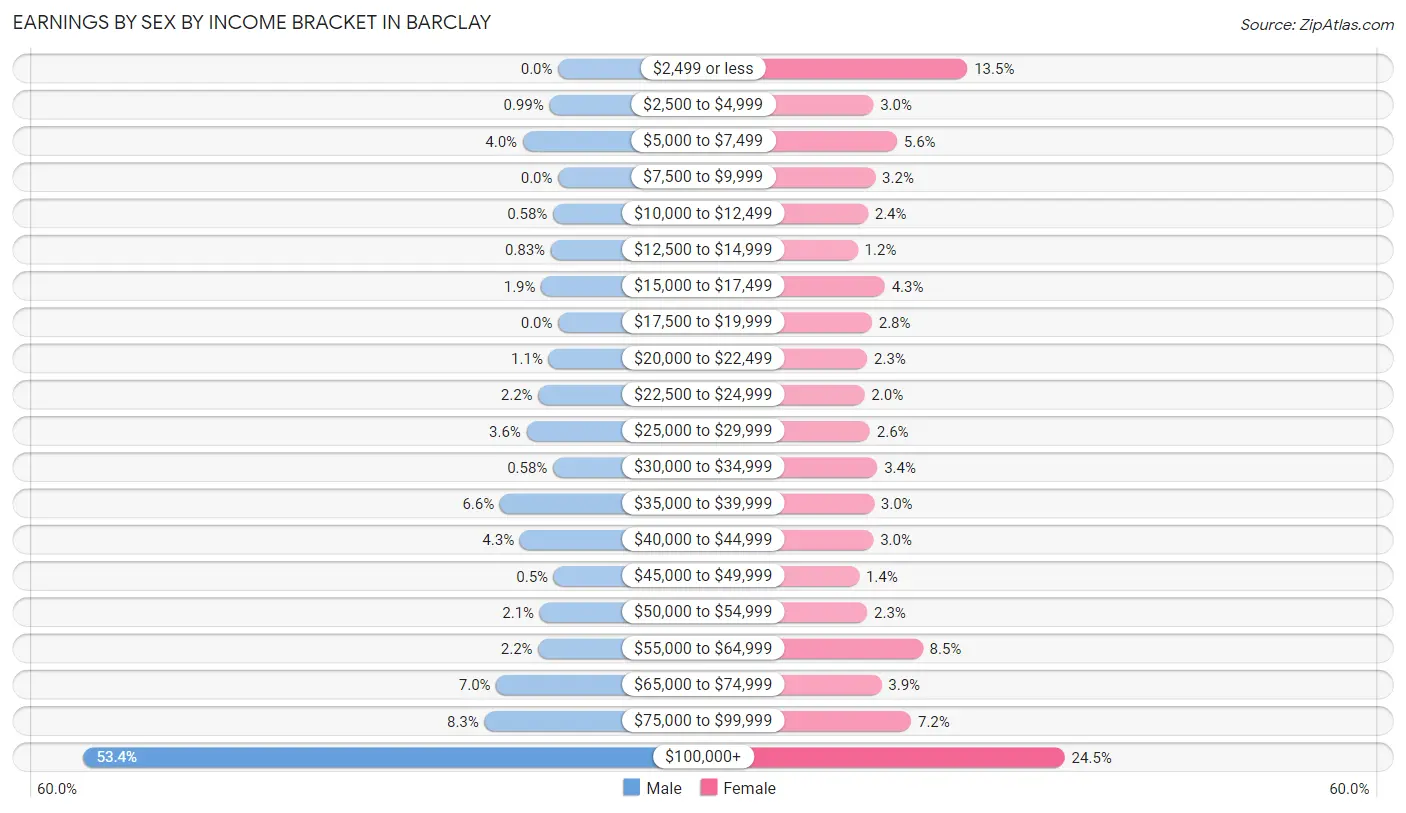
Earnings by Sex by Income Bracket in Barclay
The most common earnings brackets in Barclay are $100,000+ for men (644 | 53.4%) and $100,000+ for women (322 | 24.5%).
| Income | Male | Female |
| $2,499 or less | 0 (0.0%) | 178 (13.5%) |
| $2,500 to $4,999 | 12 (1.0%) | 39 (3.0%) |
| $5,000 to $7,499 | 48 (4.0%) | 74 (5.6%) |
| $7,500 to $9,999 | 0 (0.0%) | 42 (3.2%) |
| $10,000 to $12,499 | 7 (0.6%) | 31 (2.4%) |
| $12,500 to $14,999 | 10 (0.8%) | 16 (1.2%) |
| $15,000 to $17,499 | 23 (1.9%) | 56 (4.3%) |
| $17,500 to $19,999 | 0 (0.0%) | 37 (2.8%) |
| $20,000 to $22,499 | 13 (1.1%) | 30 (2.3%) |
| $22,500 to $24,999 | 27 (2.2%) | 26 (2.0%) |
| $25,000 to $29,999 | 43 (3.6%) | 34 (2.6%) |
| $30,000 to $34,999 | 7 (0.6%) | 45 (3.4%) |
| $35,000 to $39,999 | 79 (6.6%) | 40 (3.0%) |
| $40,000 to $44,999 | 52 (4.3%) | 39 (3.0%) |
| $45,000 to $49,999 | 6 (0.5%) | 18 (1.4%) |
| $50,000 to $54,999 | 25 (2.1%) | 30 (2.3%) |
| $55,000 to $64,999 | 27 (2.2%) | 112 (8.5%) |
| $65,000 to $74,999 | 84 (7.0%) | 51 (3.9%) |
| $75,000 to $99,999 | 100 (8.3%) | 95 (7.2%) |
| $100,000+ | 644 (53.4%) | 322 (24.5%) |
| Total | 1,207 (100.0%) | 1,315 (100.0%) |
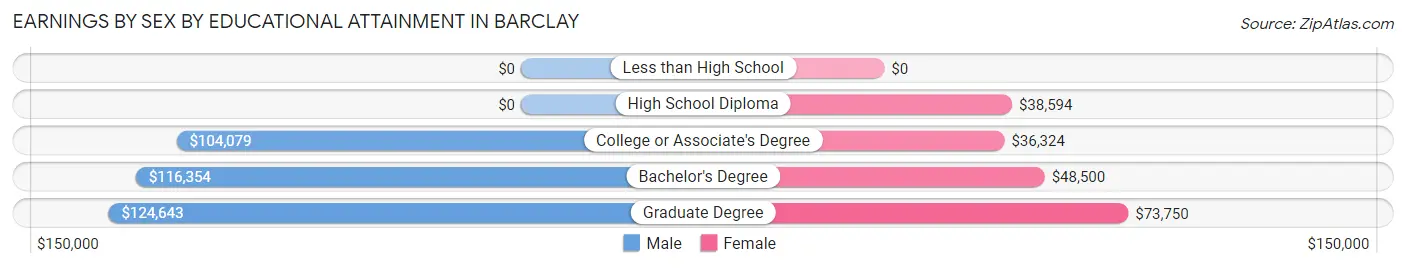
Earnings by Sex by Educational Attainment in Barclay
Average earnings in Barclay are $111,875 for men and $57,260 for women, a difference of 48.8%. Men with an educational attainment of graduate degree enjoy the highest average annual earnings of $124,643, while those with college or associate's degree education earn the least with $104,079. Women with an educational attainment of graduate degree earn the most with the average annual earnings of $73,750, while those with college or associate's degree education have the smallest earnings of $36,324.
| Educational Attainment | Male Income | Female Income |
| Less than High School | - | - |
| High School Diploma | - | - |
| College or Associate's Degree | $104,079 | $36,324 |
| Bachelor's Degree | $116,354 | $48,500 |
| Graduate Degree | $124,643 | $73,750 |
| Total | $111,875 | $57,260 |
Family Income in Barclay
Family Income Brackets in Barclay
According to the Barclay family income data, there are 576 families falling into the $200,000+ income range, which is the most common income bracket and makes up 44.2% of all families.
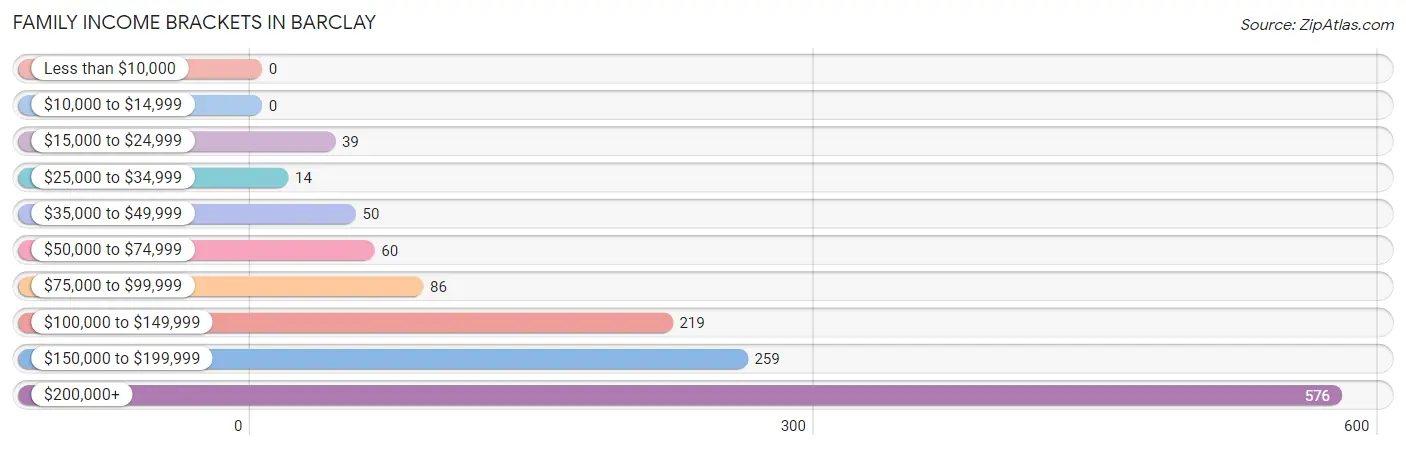
| Income Bracket | # Families | % Families |
| Less than $10,000 | 0 | 0.0% |
| $10,000 to $14,999 | 0 | 0.0% |
| $15,000 to $24,999 | 39 | 3.0% |
| $25,000 to $34,999 | 14 | 1.1% |
| $35,000 to $49,999 | 50 | 3.8% |
| $50,000 to $74,999 | 60 | 4.6% |
| $75,000 to $99,999 | 86 | 6.6% |
| $100,000 to $149,999 | 219 | 16.8% |
| $150,000 to $199,999 | 259 | 19.9% |
| $200,000+ | 576 | 44.2% |
Family Income by Famaliy Size in Barclay
6-person families (28 | 2.1%) account for the highest median family income in Barclay with $250,001 per family, while 2-person families (556 | 42.6%) have the highest median income of $86,562 per family member.
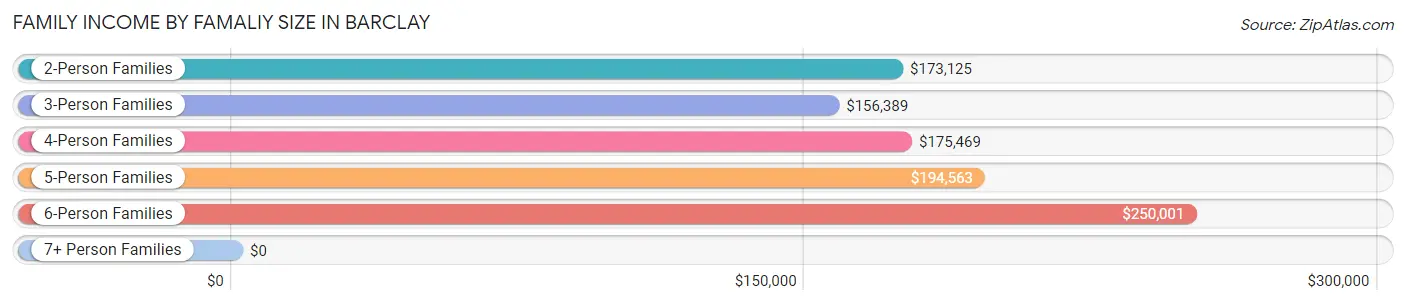
| Income Bracket | # Families | Median Income |
| 2-Person Families | 556 (42.6%) | $173,125 |
| 3-Person Families | 254 (19.5%) | $156,389 |
| 4-Person Families | 329 (25.2%) | $175,469 |
| 5-Person Families | 131 (10.1%) | $194,563 |
| 6-Person Families | 28 (2.1%) | $250,001 |
| 7+ Person Families | 6 (0.5%) | $0 |
| Total | 1,304 (100.0%) | $175,600 |
Family Income by Number of Earners in Barclay
The median family income in Barclay is $175,600, with families comprising 3+ earners (196) having the highest median family income of $250,001, while families with no earners (175) have the lowest median family income of $78,938, accounting for 15.0% and 13.4% of families, respectively.
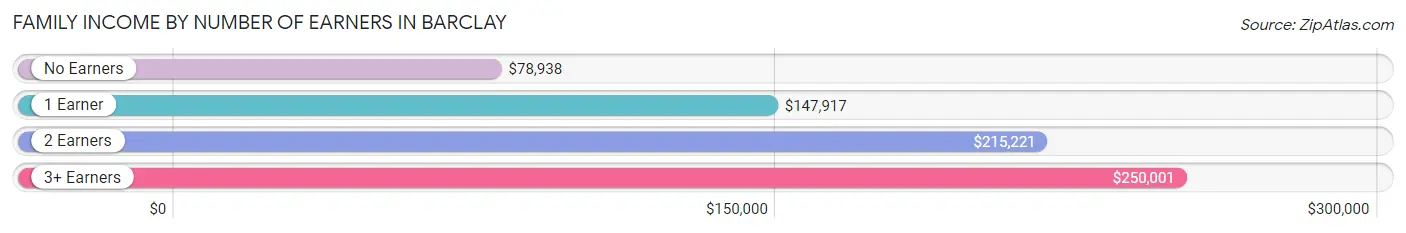
| Number of Earners | # Families | Median Income |
| No Earners | 175 (13.4%) | $78,938 |
| 1 Earner | 318 (24.4%) | $147,917 |
| 2 Earners | 615 (47.2%) | $215,221 |
| 3+ Earners | 196 (15.0%) | $250,001 |
| Total | 1,304 (100.0%) | $175,600 |
Household Income in Barclay
Household Income Brackets in Barclay
With 599 households falling in the category, the $200,000+ income range is the most frequent in Barclay, accounting for 36.9% of all households. In contrast, only 3 households (0.2%) fall into the $10,000 to $14,999 income bracket, making it the least populous group.
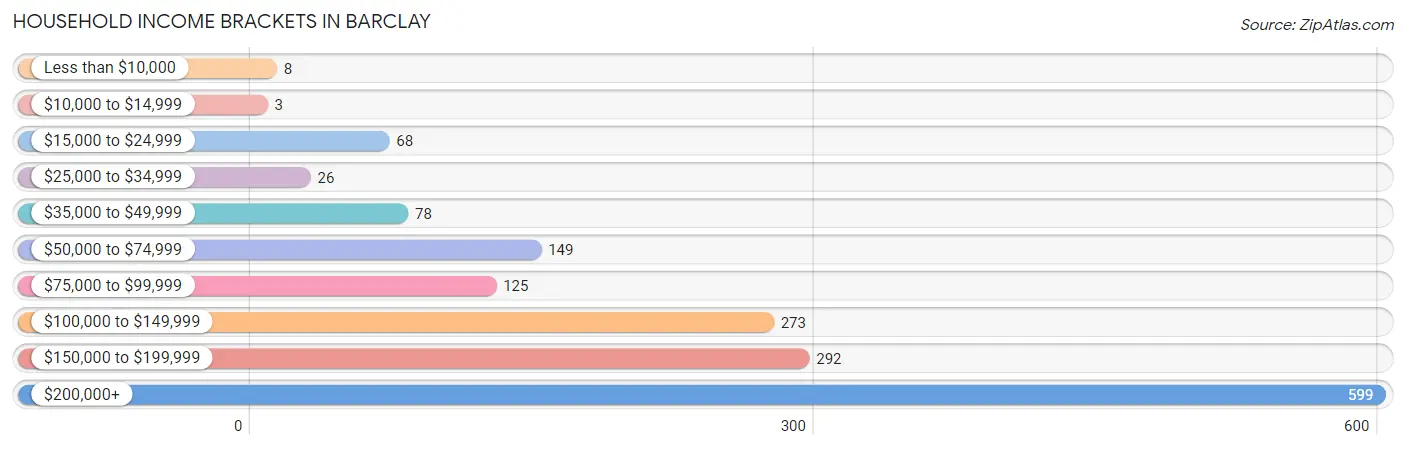
| Income Bracket | # Households | % Households |
| Less than $10,000 | 8 | 0.5% |
| $10,000 to $14,999 | 3 | 0.2% |
| $15,000 to $24,999 | 68 | 4.2% |
| $25,000 to $34,999 | 26 | 1.6% |
| $35,000 to $49,999 | 78 | 4.8% |
| $50,000 to $74,999 | 149 | 9.2% |
| $75,000 to $99,999 | 125 | 7.7% |
| $100,000 to $149,999 | 273 | 16.8% |
| $150,000 to $199,999 | 292 | 18.0% |
| $200,000+ | 599 | 36.9% |
Household Income by Householder Age in Barclay
The median household income in Barclay is $156,696, with the highest median household income of $188,125 found in the 25 to 44 years age bracket for the primary householder. A total of 390 households (24.0%) fall into this category.
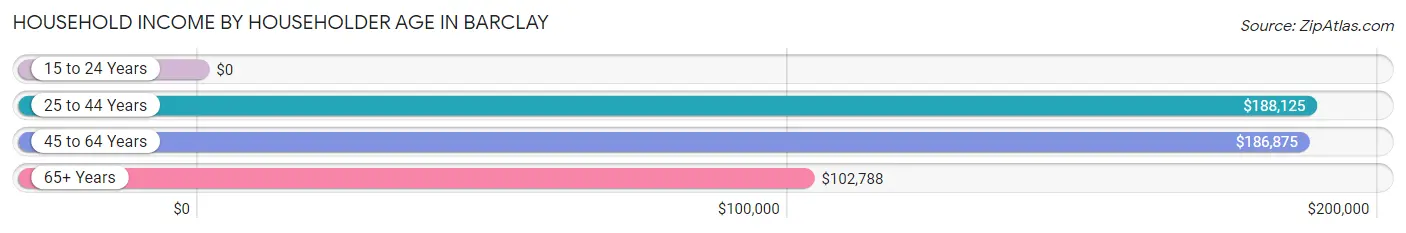
| Income Bracket | # Households | Median Income |
| 15 to 24 Years | 0 (0.0%) | $0 |
| 25 to 44 Years | 390 (24.0%) | $188,125 |
| 45 to 64 Years | 637 (39.2%) | $186,875 |
| 65+ Years | 597 (36.8%) | $102,788 |
| Total | 1,624 (100.0%) | $156,696 |
Poverty in Barclay
Income Below Poverty by Sex and Age in Barclay
With 0.5% poverty level for males and 6.1% for females among the residents of Barclay, 25 to 34 year old males and 12 to 14 year old females are the most vulnerable to poverty, with 6 males (3.0%) and 26 females (52.0%) in their respective age groups living below the poverty level.
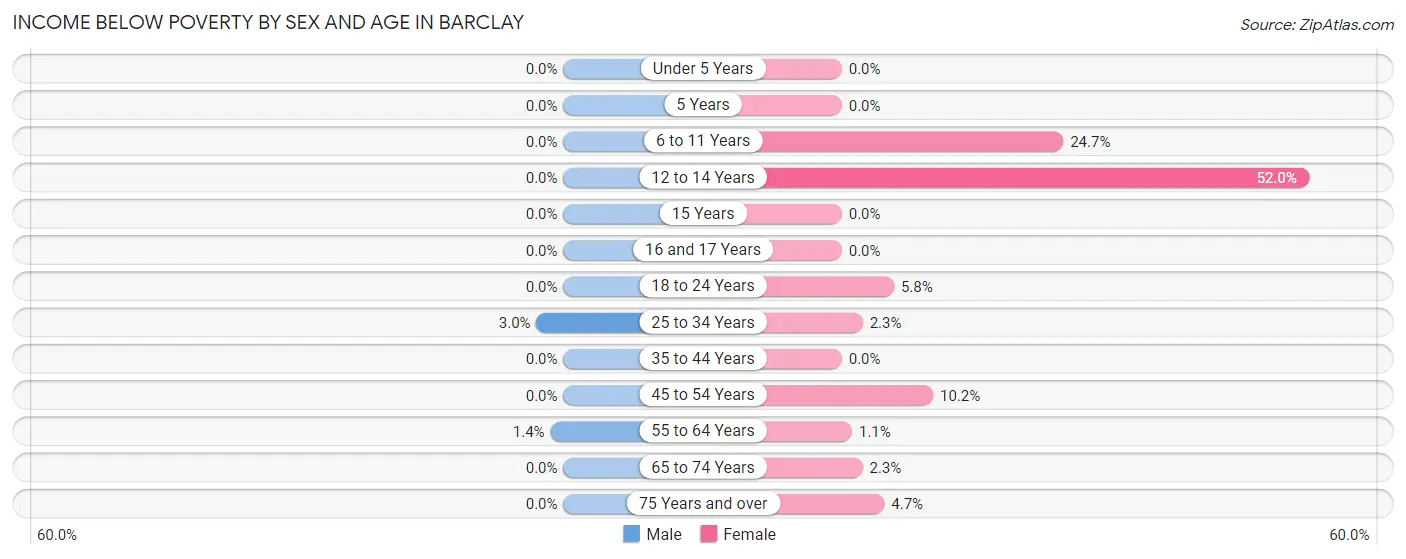
| Age Bracket | Male | Female |
| Under 5 Years | 0 (0.0%) | 0 (0.0%) |
| 5 Years | 0 (0.0%) | 0 (0.0%) |
| 6 to 11 Years | 0 (0.0%) | 54 (24.7%) |
| 12 to 14 Years | 0 (0.0%) | 26 (52.0%) |
| 15 Years | 0 (0.0%) | 0 (0.0%) |
| 16 and 17 Years | 0 (0.0%) | 0 (0.0%) |
| 18 to 24 Years | 0 (0.0%) | 10 (5.8%) |
| 25 to 34 Years | 6 (3.0%) | 5 (2.3%) |
| 35 to 44 Years | 0 (0.0%) | 0 (0.0%) |
| 45 to 54 Years | 0 (0.0%) | 30 (10.2%) |
| 55 to 64 Years | 5 (1.4%) | 4 (1.1%) |
| 65 to 74 Years | 0 (0.0%) | 7 (2.3%) |
| 75 Years and over | 0 (0.0%) | 12 (4.7%) |
| Total | 11 (0.5%) | 148 (6.1%) |
Income Above Poverty by Sex and Age in Barclay
According to the poverty statistics in Barclay, males aged under 5 years and females aged under 5 years are the age groups that are most secure financially, with 100.0% of males and 100.0% of females in these age groups living above the poverty line.
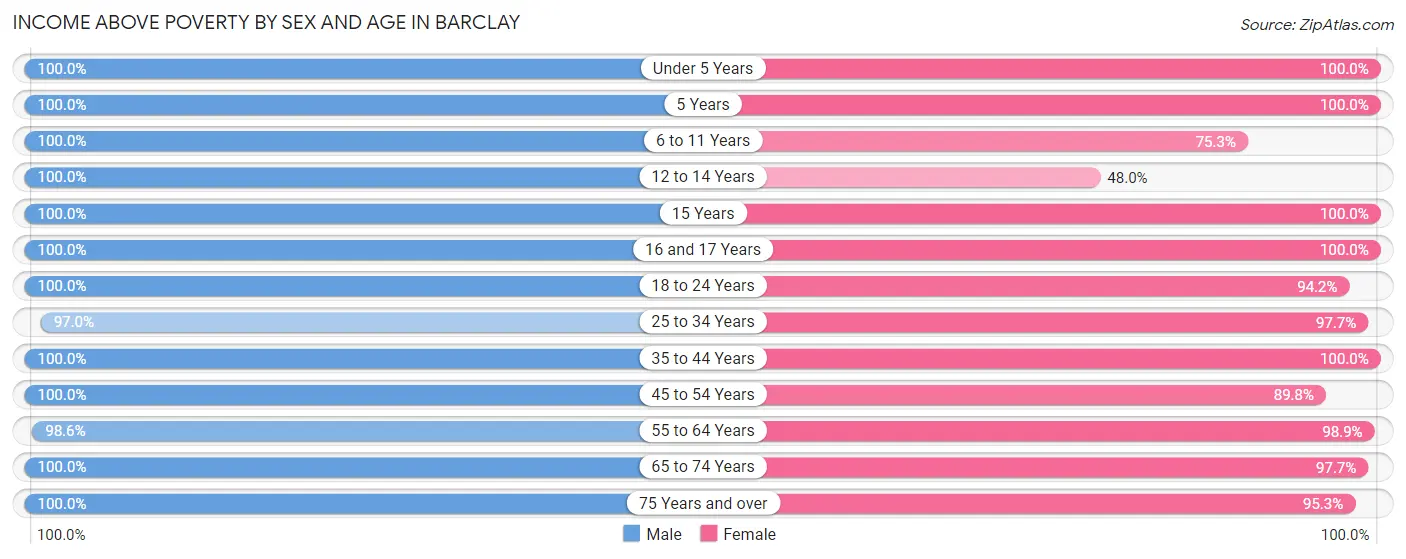
| Age Bracket | Male | Female |
| Under 5 Years | 214 (100.0%) | 98 (100.0%) |
| 5 Years | 9 (100.0%) | 53 (100.0%) |
| 6 to 11 Years | 171 (100.0%) | 165 (75.3%) |
| 12 to 14 Years | 89 (100.0%) | 24 (48.0%) |
| 15 Years | 24 (100.0%) | 19 (100.0%) |
| 16 and 17 Years | 11 (100.0%) | 42 (100.0%) |
| 18 to 24 Years | 69 (100.0%) | 162 (94.2%) |
| 25 to 34 Years | 194 (97.0%) | 210 (97.7%) |
| 35 to 44 Years | 281 (100.0%) | 348 (100.0%) |
| 45 to 54 Years | 216 (100.0%) | 265 (89.8%) |
| 55 to 64 Years | 343 (98.6%) | 348 (98.9%) |
| 65 to 74 Years | 266 (100.0%) | 296 (97.7%) |
| 75 Years and over | 187 (100.0%) | 241 (95.3%) |
| Total | 2,074 (99.5%) | 2,271 (93.9%) |
Income Below Poverty Among Married-Couple Families in Barclay
The poverty statistics for married-couple families in Barclay show that 0.4% or 5 of the total 1,196 families live below the poverty line. Families with no children have the highest poverty rate of 0.7%, comprising of 5 families. On the other hand, families with 1 or 2 children have the lowest poverty rate of 0.0%, which includes 0 families.
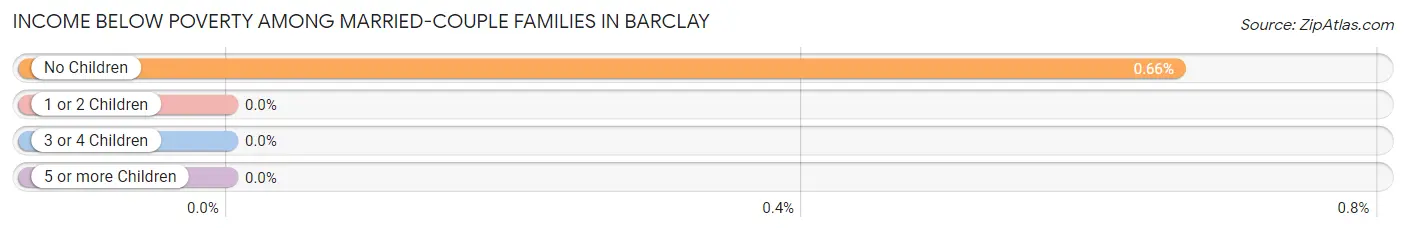
| Children | Above Poverty | Below Poverty |
| No Children | 752 (99.3%) | 5 (0.7%) |
| 1 or 2 Children | 339 (100.0%) | 0 (0.0%) |
| 3 or 4 Children | 100 (100.0%) | 0 (0.0%) |
| 5 or more Children | 0 (0.0%) | 0 (0.0%) |
| Total | 1,191 (99.6%) | 5 (0.4%) |
Income Below Poverty Among Single-Parent Households in Barclay
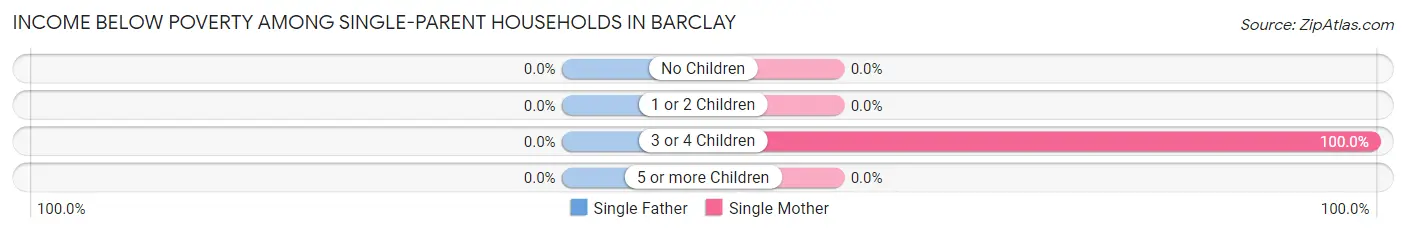
| Children | Single Father | Single Mother |
| No Children | 0 (0.0%) | 0 (0.0%) |
| 1 or 2 Children | 0 (0.0%) | 0 (0.0%) |
| 3 or 4 Children | 0 (0.0%) | 26 (100.0%) |
| 5 or more Children | 0 (0.0%) | 0 (0.0%) |
| Total | 0 (0.0%) | 26 (25.5%) |
Income Below Poverty Among Married-Couple vs Single-Parent Households in Barclay
The poverty data for Barclay shows that 5 of the married-couple family households (0.4%) and 26 of the single-parent households (24.1%) are living below the poverty level. Within the married-couple family households, those with no children have the highest poverty rate, with 5 households (0.7%) falling below the poverty line. Among the single-parent households, those with 3 or 4 children have the highest poverty rate, with 26 household (100.0%) living below poverty.
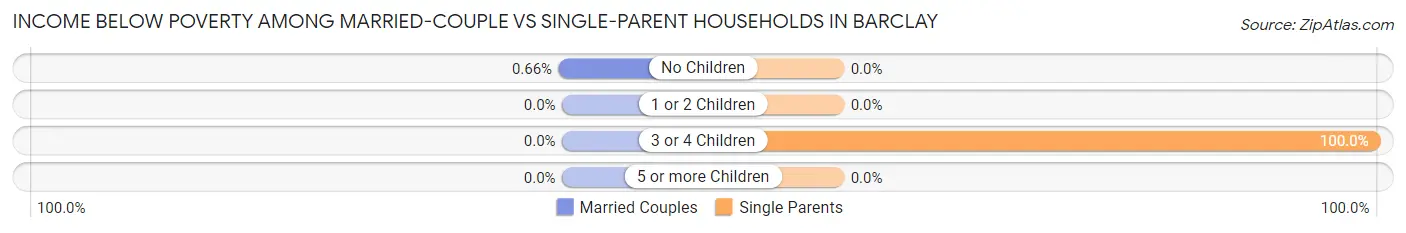
| Children | Married-Couple Families | Single-Parent Households |
| No Children | 5 (0.7%) | 0 (0.0%) |
| 1 or 2 Children | 0 (0.0%) | 0 (0.0%) |
| 3 or 4 Children | 0 (0.0%) | 26 (100.0%) |
| 5 or more Children | 0 (0.0%) | 0 (0.0%) |
| Total | 5 (0.4%) | 26 (24.1%) |
Race in Barclay
The most populous races in Barclay are White / Caucasian (3,993 | 88.6%), Two or more Races (287 | 6.4%), and Hispanic or Latino (186 | 4.1%).
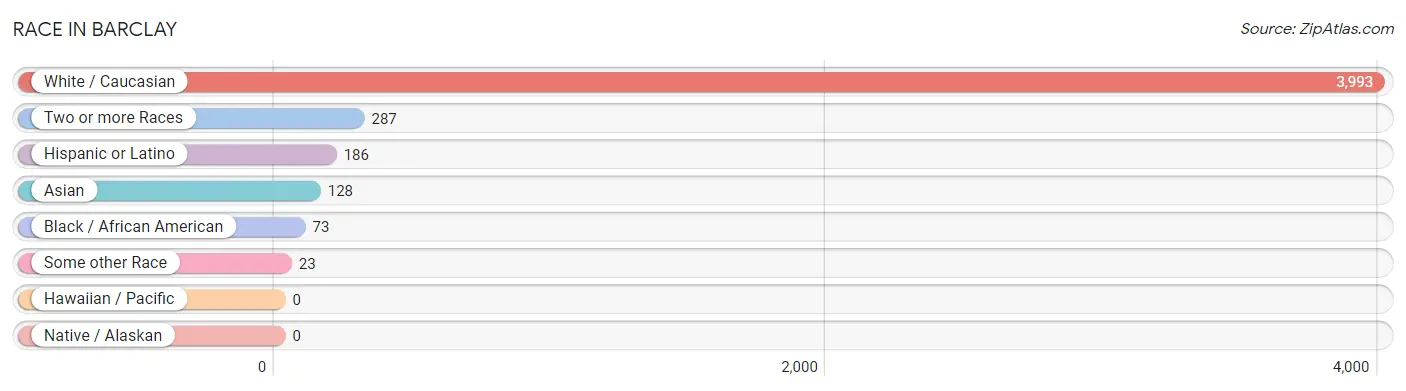
| Race | # Population | % Population |
| Asian | 128 | 2.8% |
| Black / African American | 73 | 1.6% |
| Hawaiian / Pacific | 0 | 0.0% |
| Hispanic or Latino | 186 | 4.1% |
| Native / Alaskan | 0 | 0.0% |
| White / Caucasian | 3,993 | 88.6% |
| Two or more Races | 287 | 6.4% |
| Some other Race | 23 | 0.5% |
| Total | 4,504 | 100.0% |
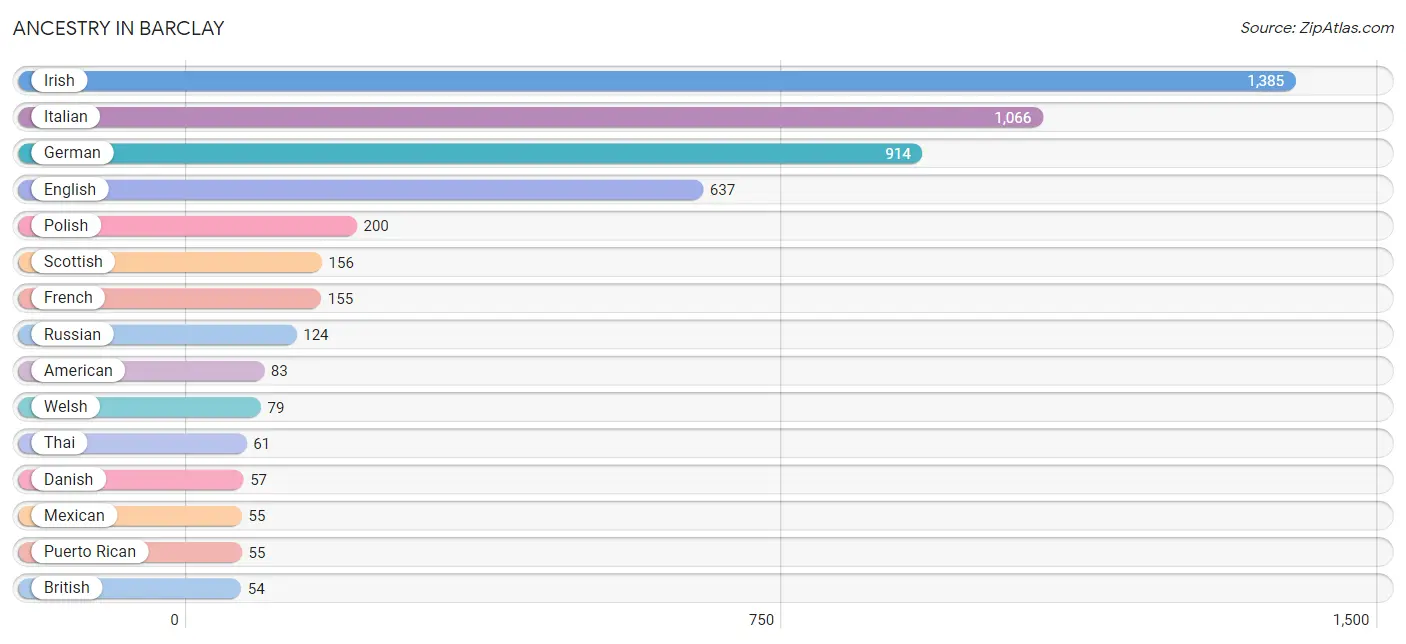
Ancestry in Barclay
The most populous ancestries reported in Barclay are Irish (1,385 | 30.7%), Italian (1,066 | 23.7%), German (914 | 20.3%), English (637 | 14.1%), and Polish (200 | 4.4%), together accounting for 93.3% of all Barclay residents.
| Ancestry | # Population | % Population |
| African | 23 | 0.5% |
| American | 83 | 1.8% |
| Arab | 22 | 0.5% |
| Armenian | 26 | 0.6% |
| Austrian | 5 | 0.1% |
| Belgian | 18 | 0.4% |
| Brazilian | 7 | 0.2% |
| British | 54 | 1.2% |
| Burmese | 48 | 1.1% |
| Central American | 16 | 0.4% |
| Cherokee | 23 | 0.5% |
| Colombian | 19 | 0.4% |
| Croatian | 21 | 0.5% |
| Cuban | 24 | 0.5% |
| Czech | 40 | 0.9% |
| Czechoslovakian | 7 | 0.2% |
| Danish | 57 | 1.3% |
| Dutch | 23 | 0.5% |
| Eastern European | 4 | 0.1% |
| English | 637 | 14.1% |
| Estonian | 44 | 1.0% |
| European | 38 | 0.8% |
| French | 155 | 3.4% |
| French Canadian | 18 | 0.4% |
| German | 914 | 20.3% |
| Indian (Asian) | 5 | 0.1% |
| Irish | 1,385 | 30.7% |
| Italian | 1,066 | 23.7% |
| Jamaican | 16 | 0.4% |
| Korean | 34 | 0.7% |
| Lebanese | 22 | 0.5% |
| Lithuanian | 43 | 0.9% |
| Mexican | 55 | 1.2% |
| Panamanian | 16 | 0.4% |
| Pennsylvania German | 7 | 0.2% |
| Polish | 200 | 4.4% |
| Puerto Rican | 55 | 1.2% |
| Romanian | 7 | 0.2% |
| Russian | 124 | 2.8% |
| Scotch-Irish | 52 | 1.1% |
| Scottish | 156 | 3.5% |
| Seminole | 23 | 0.5% |
| Slovak | 23 | 0.5% |
| South African | 8 | 0.2% |
| South American | 19 | 0.4% |
| Spaniard | 11 | 0.2% |
| Spanish | 6 | 0.1% |
| Subsaharan African | 31 | 0.7% |
| Swedish | 39 | 0.9% |
| Swiss | 23 | 0.5% |
| Thai | 61 | 1.3% |
| Ukrainian | 23 | 0.5% |
| Welsh | 79 | 1.8% | View All 53 Rows |
Immigrants in Barclay
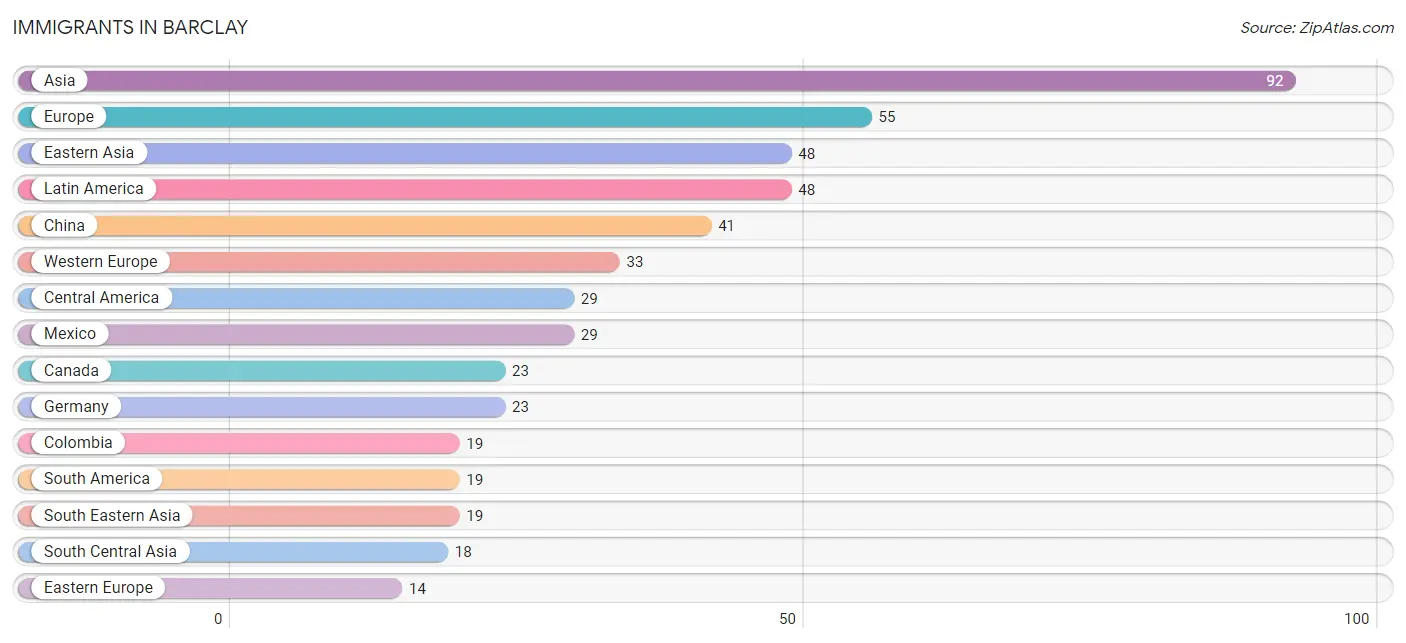
The most numerous immigrant groups reported in Barclay came from Asia (92 | 2.0%), Europe (55 | 1.2%), Eastern Asia (48 | 1.1%), Latin America (48 | 1.1%), and China (41 | 0.9%), together accounting for 6.3% of all Barclay residents.
| Immigration Origin | # Population | % Population |
| Asia | 92 | 2.0% |
| Canada | 23 | 0.5% |
| Central America | 29 | 0.6% |
| China | 41 | 0.9% |
| Colombia | 19 | 0.4% |
| Eastern Asia | 48 | 1.1% |
| Eastern Europe | 14 | 0.3% |
| Europe | 55 | 1.2% |
| France | 10 | 0.2% |
| Germany | 23 | 0.5% |
| India | 11 | 0.2% |
| Italy | 8 | 0.2% |
| Korea | 7 | 0.2% |
| Latin America | 48 | 1.1% |
| Lebanon | 7 | 0.2% |
| Mexico | 29 | 0.6% |
| Philippines | 7 | 0.2% |
| Russia | 14 | 0.3% |
| Singapore | 5 | 0.1% |
| South America | 19 | 0.4% |
| South Central Asia | 18 | 0.4% |
| South Eastern Asia | 19 | 0.4% |
| Southern Europe | 8 | 0.2% |
| Taiwan | 5 | 0.1% |
| Uzbekistan | 7 | 0.2% |
| Vietnam | 7 | 0.2% |
| Western Asia | 7 | 0.2% |
| Western Europe | 33 | 0.7% | View All 28 Rows |
Sex and Age in Barclay
Sex and Age in Barclay
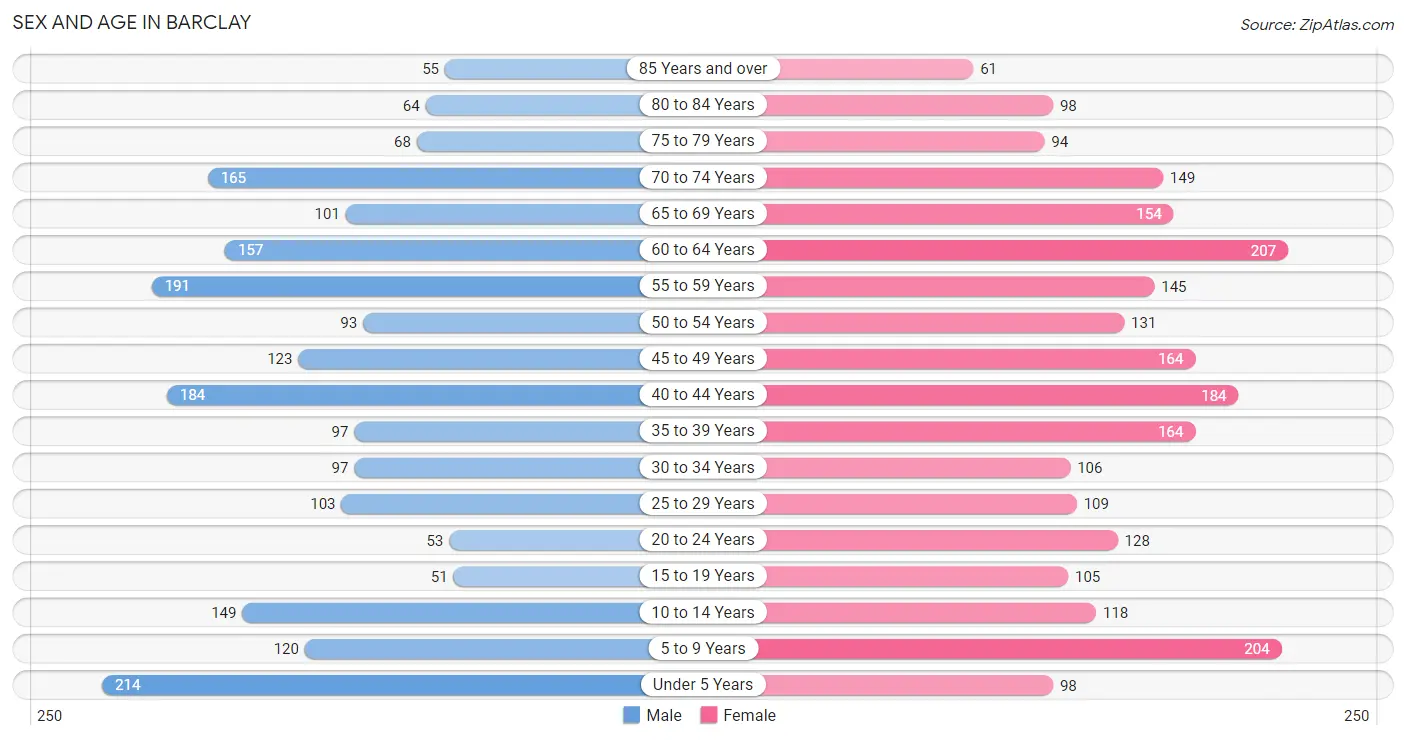
The most populous age groups in Barclay are Under 5 Years (214 | 10.3%) for men and 60 to 64 Years (207 | 8.6%) for women.
| Age Bracket | Male | Female |
| Under 5 Years | 214 (10.3%) | 98 (4.1%) |
| 5 to 9 Years | 120 (5.8%) | 204 (8.4%) |
| 10 to 14 Years | 149 (7.1%) | 118 (4.9%) |
| 15 to 19 Years | 51 (2.5%) | 105 (4.3%) |
| 20 to 24 Years | 53 (2.5%) | 128 (5.3%) |
| 25 to 29 Years | 103 (4.9%) | 109 (4.5%) |
| 30 to 34 Years | 97 (4.6%) | 106 (4.4%) |
| 35 to 39 Years | 97 (4.6%) | 164 (6.8%) |
| 40 to 44 Years | 184 (8.8%) | 184 (7.6%) |
| 45 to 49 Years | 123 (5.9%) | 164 (6.8%) |
| 50 to 54 Years | 93 (4.5%) | 131 (5.4%) |
| 55 to 59 Years | 191 (9.2%) | 145 (6.0%) |
| 60 to 64 Years | 157 (7.5%) | 207 (8.6%) |
| 65 to 69 Years | 101 (4.8%) | 154 (6.4%) |
| 70 to 74 Years | 165 (7.9%) | 149 (6.2%) |
| 75 to 79 Years | 68 (3.3%) | 94 (3.9%) |
| 80 to 84 Years | 64 (3.1%) | 98 (4.1%) |
| 85 Years and over | 55 (2.6%) | 61 (2.5%) |
| Total | 2,085 (100.0%) | 2,419 (100.0%) |
Families and Households in Barclay
Median Family Size in Barclay
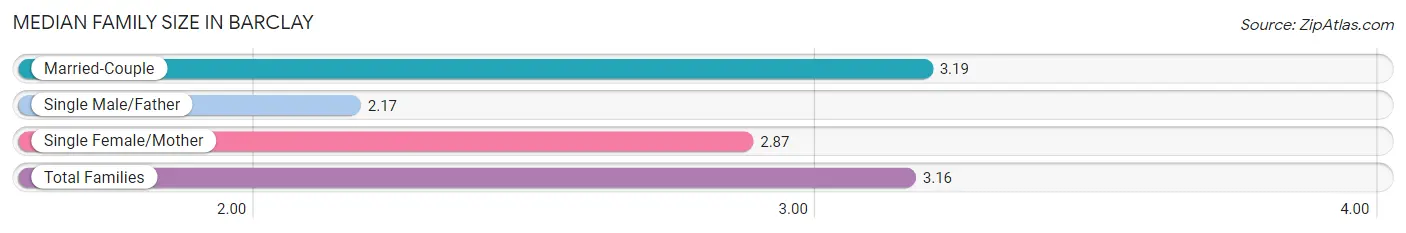
The median family size in Barclay is 3.16 persons per family, with married-couple families (1,196 | 91.7%) accounting for the largest median family size of 3.19 persons per family. On the other hand, single male/father families (6 | 0.5%) represent the smallest median family size with 2.17 persons per family.
| Family Type | # Families | Family Size |
| Married-Couple | 1,196 (91.7%) | 3.19 |
| Single Male/Father | 6 (0.5%) | 2.17 |
| Single Female/Mother | 102 (7.8%) | 2.87 |
| Total Families | 1,304 (100.0%) | 3.16 |
Median Household Size in Barclay
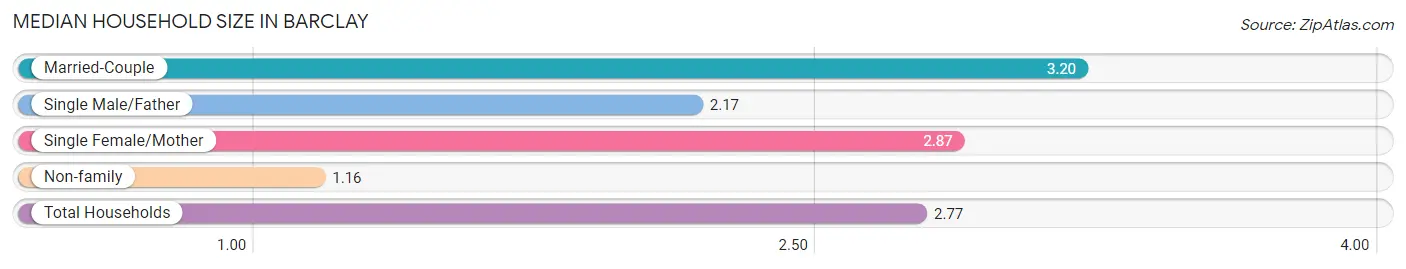
The median household size in Barclay is 2.77 persons per household, with married-couple households (1,196 | 73.7%) accounting for the largest median household size of 3.2 persons per household. non-family households (320 | 19.7%) represent the smallest median household size with 1.16 persons per household.
| Household Type | # Households | Household Size |
| Married-Couple | 1,196 (73.7%) | 3.20 |
| Single Male/Father | 6 (0.4%) | 2.17 |
| Single Female/Mother | 102 (6.3%) | 2.87 |
| Non-family | 320 (19.7%) | 1.16 |
| Total Households | 1,624 (100.0%) | 2.77 |
Household Size by Marriage Status in Barclay
Out of a total of 1,624 households in Barclay, 1,304 (80.3%) are family households, while 320 (19.7%) are nonfamily households. The most numerous type of family households are 2-person households, comprising 556, and the most common type of nonfamily households are 1-person households, comprising 268.
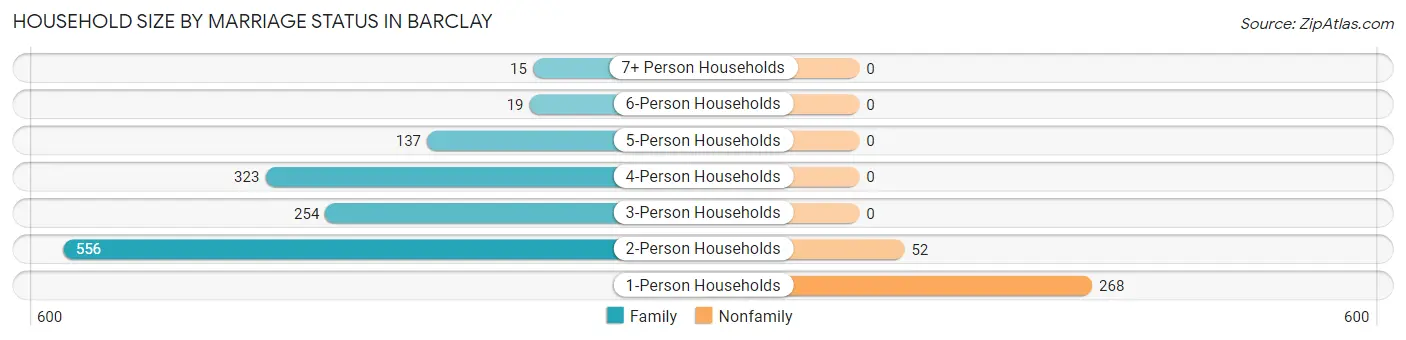
| Household Size | Family Households | Nonfamily Households |
| 1-Person Households | - | 268 (16.5%) |
| 2-Person Households | 556 (34.2%) | 52 (3.2%) |
| 3-Person Households | 254 (15.6%) | 0 (0.0%) |
| 4-Person Households | 323 (19.9%) | 0 (0.0%) |
| 5-Person Households | 137 (8.4%) | 0 (0.0%) |
| 6-Person Households | 19 (1.2%) | 0 (0.0%) |
| 7+ Person Households | 15 (0.9%) | 0 (0.0%) |
| Total | 1,304 (80.3%) | 320 (19.7%) |
Female Fertility in Barclay
Fertility by Age in Barclay
Average fertility rate in Barclay is 79.0 births per 1,000 women. Women in the age bracket of 35 to 50 years have the highest fertility rate with 101.0 births per 1,000 women. Women in the age bracket of 35 to 50 years acount for 68.8% of all women with births.
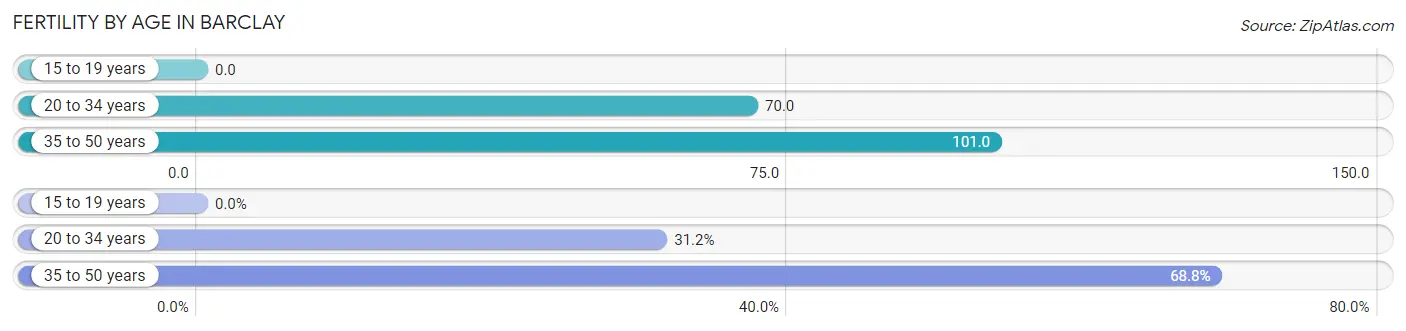
| Age Bracket | Women with Births | Births / 1,000 Women |
| 15 to 19 years | 0 (0.0%) | 0.0 |
| 20 to 34 years | 24 (31.2%) | 70.0 |
| 35 to 50 years | 53 (68.8%) | 101.0 |
| Total | 77 (100.0%) | 79.0 |
Fertility by Age by Marriage Status in Barclay
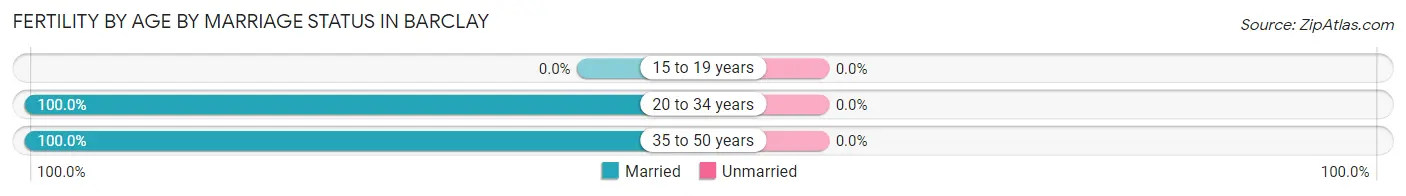
| Age Bracket | Married | Unmarried |
| 15 to 19 years | 0 (0.0%) | 0 (0.0%) |
| 20 to 34 years | 24 (100.0%) | 0 (0.0%) |
| 35 to 50 years | 53 (100.0%) | 0 (0.0%) |
| Total | 77 (100.0%) | 0 (0.0%) |
Fertility by Education in Barclay
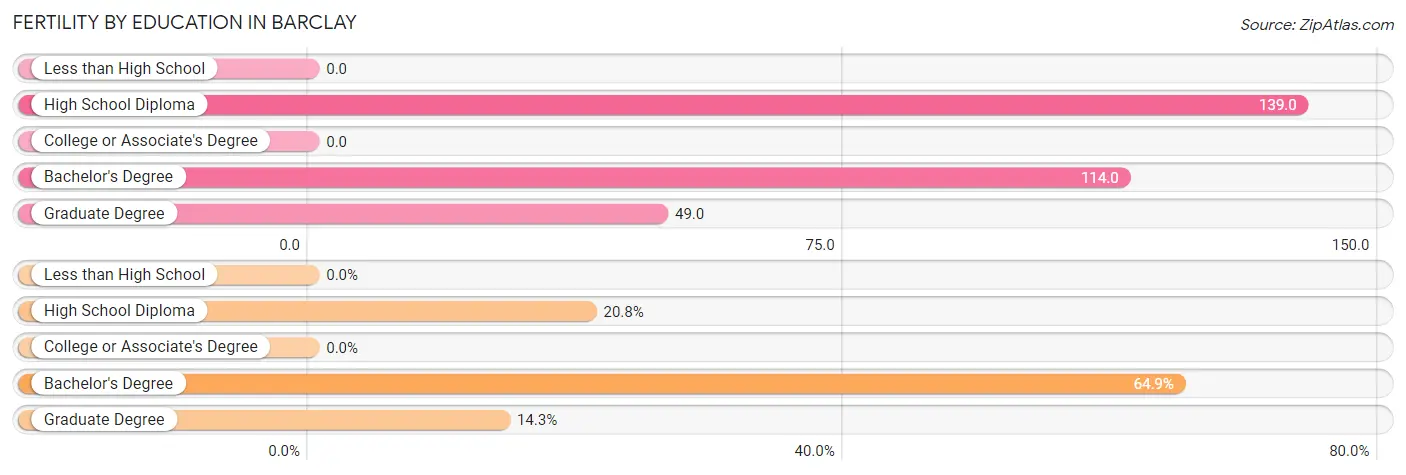
| Educational Attainment | Women with Births | Births / 1,000 Women |
| Less than High School | 0 (0.0%) | 0.0 |
| High School Diploma | 16 (20.8%) | 139.0 |
| College or Associate's Degree | 0 (0.0%) | 0.0 |
| Bachelor's Degree | 50 (64.9%) | 114.0 |
| Graduate Degree | 11 (14.3%) | 49.0 |
| Total | 77 (100.0%) | 79.0 |
Fertility by Education by Marriage Status in Barclay
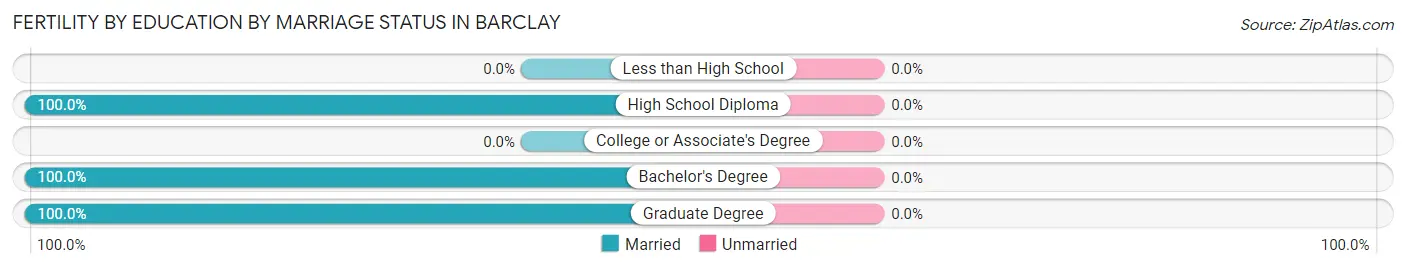
| Educational Attainment | Married | Unmarried |
| Less than High School | 0 (0.0%) | 0 (0.0%) |
| High School Diploma | 16 (100.0%) | 0 (0.0%) |
| College or Associate's Degree | 0 (0.0%) | 0 (0.0%) |
| Bachelor's Degree | 50 (100.0%) | 0 (0.0%) |
| Graduate Degree | 11 (100.0%) | 0 (0.0%) |
| Total | 77 (100.0%) | 0 (0.0%) |
Employment Characteristics in Barclay
Employment by Class of Employer in Barclay
Among the 2,256 employed individuals in Barclay, private company employees (1,486 | 65.9%), not-for-profit organizations (222 | 9.8%), and self-employed (not incorporated) (198 | 8.8%) make up the most common classes of employment.
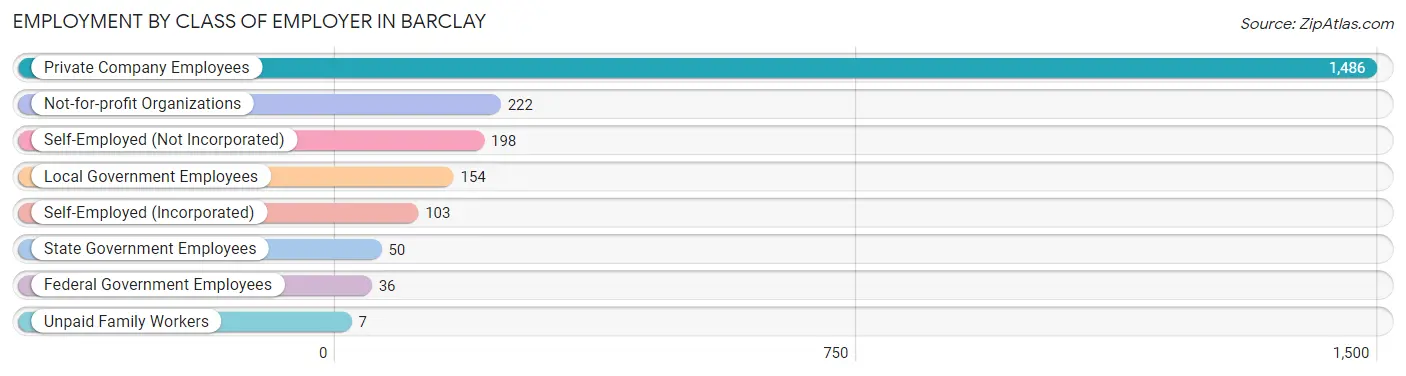
| Employer Class | # Employees | % Employees |
| Private Company Employees | 1,486 | 65.9% |
| Self-Employed (Incorporated) | 103 | 4.6% |
| Self-Employed (Not Incorporated) | 198 | 8.8% |
| Not-for-profit Organizations | 222 | 9.8% |
| Local Government Employees | 154 | 6.8% |
| State Government Employees | 50 | 2.2% |
| Federal Government Employees | 36 | 1.6% |
| Unpaid Family Workers | 7 | 0.3% |
| Total | 2,256 | 100.0% |
Employment Status by Age in Barclay
According to the labor force statistics for Barclay, out of the total population over 16 years of age (3,558), 66.6% or 2,370 individuals are in the labor force, with 3.4% or 81 of them unemployed. The age group with the highest labor force participation rate is 20 to 24 years, with 91.2% or 165 individuals in the labor force. Within the labor force, the 65 to 74 years age range has the highest percentage of unemployed individuals, with 9.8% or 27 of them being unemployed.
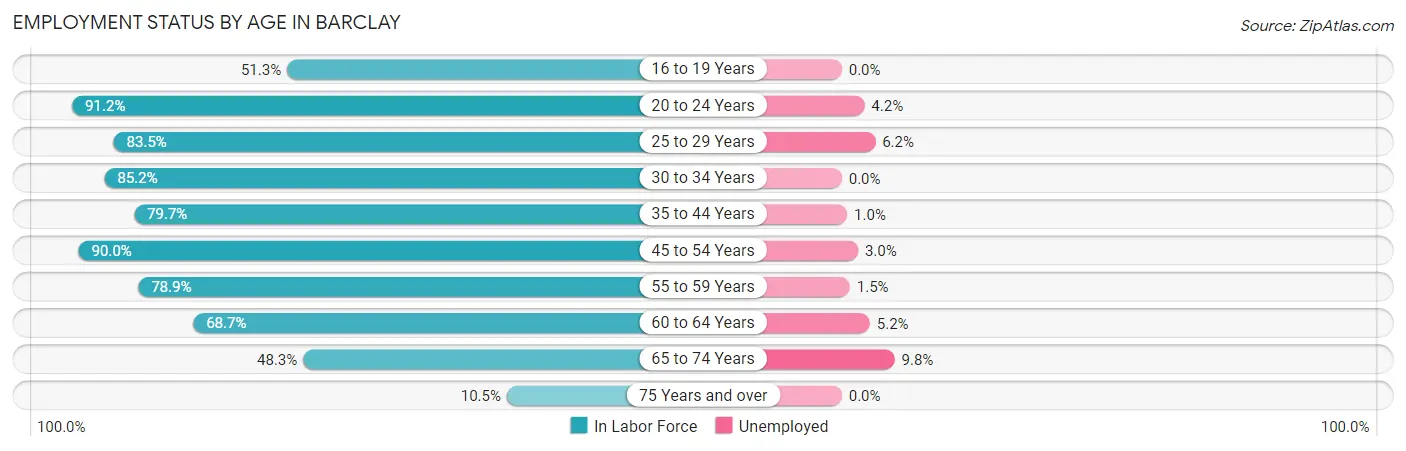
| Age Bracket | In Labor Force | Unemployed |
| 16 to 19 Years | 58 (51.3%) | 0 (0.0%) |
| 20 to 24 Years | 165 (91.2%) | 7 (4.2%) |
| 25 to 29 Years | 177 (83.5%) | 11 (6.2%) |
| 30 to 34 Years | 173 (85.2%) | 0 (0.0%) |
| 35 to 44 Years | 501 (79.7%) | 5 (1.0%) |
| 45 to 54 Years | 460 (90.0%) | 14 (3.0%) |
| 55 to 59 Years | 265 (78.9%) | 4 (1.5%) |
| 60 to 64 Years | 250 (68.7%) | 13 (5.2%) |
| 65 to 74 Years | 275 (48.3%) | 27 (9.8%) |
| 75 Years and over | 46 (10.5%) | 0 (0.0%) |
| Total | 2,370 (66.6%) | 81 (3.4%) |
Employment Status by Educational Attainment in Barclay
According to labor force statistics for Barclay, 81.0% of individuals (1,827) out of the total population between 25 and 64 years of age (2,255) are in the labor force, with 2.6% or 48 of them being unemployed. The group with the highest labor force participation rate are those with the educational attainment of bachelor's degree or higher, with 85.8% or 1,454 individuals in the labor force. Within the labor force, individuals with high school diploma education have the highest percentage of unemployment, with 19.2% or 25 of them being unemployed.
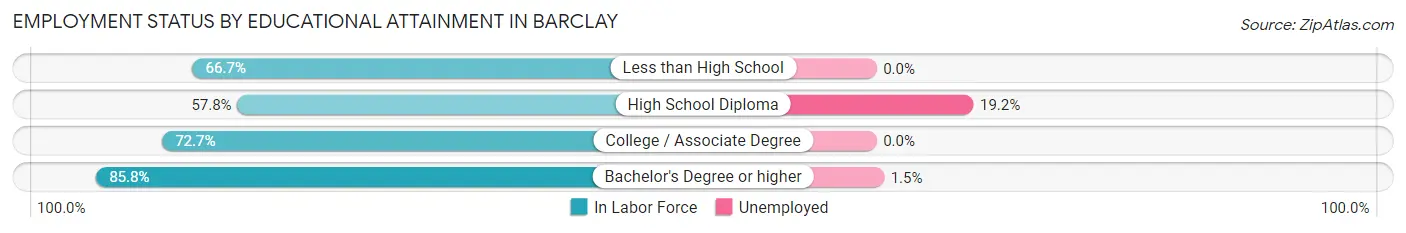
| Educational Attainment | In Labor Force | Unemployed |
| Less than High School | 18 (66.7%) | 0 (0.0%) |
| High School Diploma | 130 (57.8%) | 43 (19.2%) |
| College / Associate Degree | 224 (72.7%) | 0 (0.0%) |
| Bachelor's Degree or higher | 1,454 (85.8%) | 25 (1.5%) |
| Total | 1,827 (81.0%) | 59 (2.6%) |
Employment Occupations by Sex in Barclay
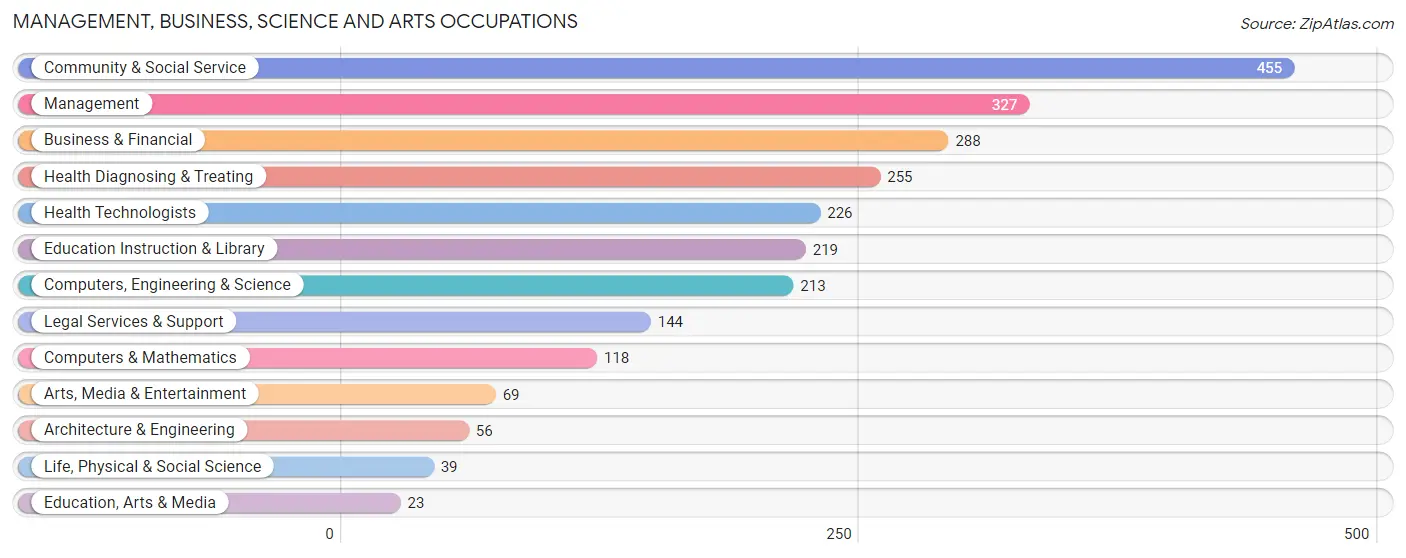
Management, Business, Science and Arts Occupations
The most common Management, Business, Science and Arts occupations in Barclay are Community & Social Service (455 | 19.9%), Management (327 | 14.3%), Business & Financial (288 | 12.6%), Health Diagnosing & Treating (255 | 11.1%), and Health Technologists (226 | 9.9%).
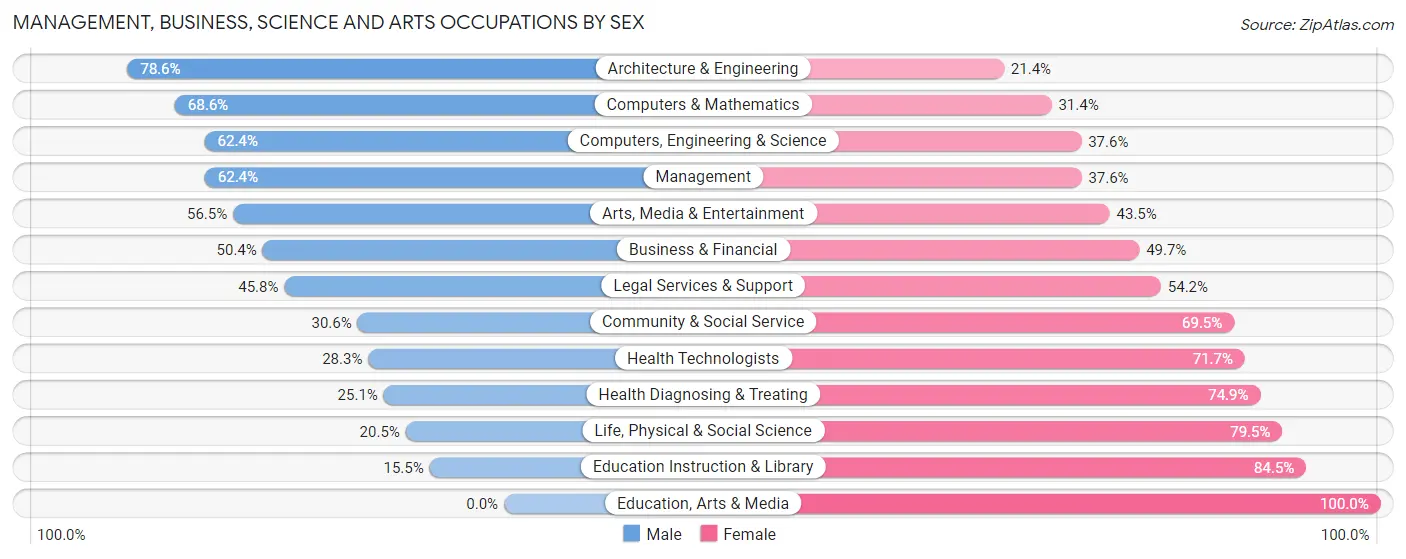
Management, Business, Science and Arts Occupations by Sex
Within the Management, Business, Science and Arts occupations in Barclay, the most male-oriented occupations are Architecture & Engineering (78.6%), Computers & Mathematics (68.6%), and Computers, Engineering & Science (62.4%), while the most female-oriented occupations are Education, Arts & Media (100.0%), Education Instruction & Library (84.5%), and Life, Physical & Social Science (79.5%).
| Occupation | Male | Female |
| Management | 204 (62.4%) | 123 (37.6%) |
| Business & Financial | 145 (50.3%) | 143 (49.6%) |
| Computers, Engineering & Science | 133 (62.4%) | 80 (37.6%) |
| Computers & Mathematics | 81 (68.6%) | 37 (31.4%) |
| Architecture & Engineering | 44 (78.6%) | 12 (21.4%) |
| Life, Physical & Social Science | 8 (20.5%) | 31 (79.5%) |
| Community & Social Service | 139 (30.5%) | 316 (69.5%) |
| Education, Arts & Media | 0 (0.0%) | 23 (100.0%) |
| Legal Services & Support | 66 (45.8%) | 78 (54.2%) |
| Education Instruction & Library | 34 (15.5%) | 185 (84.5%) |
| Arts, Media & Entertainment | 39 (56.5%) | 30 (43.5%) |
| Health Diagnosing & Treating | 64 (25.1%) | 191 (74.9%) |
| Health Technologists | 64 (28.3%) | 162 (71.7%) |
| Total (Category) | 685 (44.5%) | 853 (55.5%) |
| Total (Overall) | 1,119 (48.9%) | 1,170 (51.1%) |
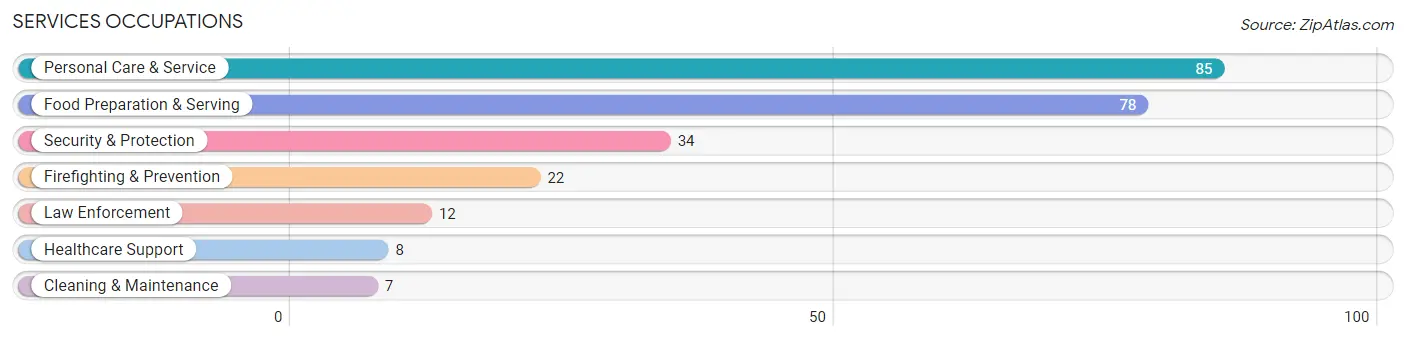
Services Occupations
The most common Services occupations in Barclay are Personal Care & Service (85 | 3.7%), Food Preparation & Serving (78 | 3.4%), Security & Protection (34 | 1.5%), Firefighting & Prevention (22 | 1.0%), and Law Enforcement (12 | 0.5%).
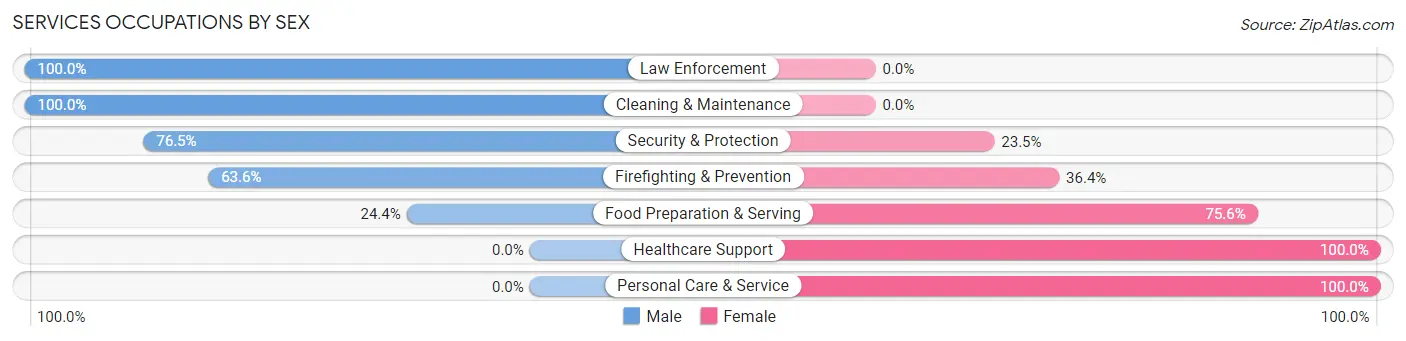
Services Occupations by Sex
Within the Services occupations in Barclay, the most male-oriented occupations are Law Enforcement (100.0%), Cleaning & Maintenance (100.0%), and Security & Protection (76.5%), while the most female-oriented occupations are Healthcare Support (100.0%), Personal Care & Service (100.0%), and Food Preparation & Serving (75.6%).
| Occupation | Male | Female |
| Healthcare Support | 0 (0.0%) | 8 (100.0%) |
| Security & Protection | 26 (76.5%) | 8 (23.5%) |
| Firefighting & Prevention | 14 (63.6%) | 8 (36.4%) |
| Law Enforcement | 12 (100.0%) | 0 (0.0%) |
| Food Preparation & Serving | 19 (24.4%) | 59 (75.6%) |
| Cleaning & Maintenance | 7 (100.0%) | 0 (0.0%) |
| Personal Care & Service | 0 (0.0%) | 85 (100.0%) |
| Total (Category) | 52 (24.5%) | 160 (75.5%) |
| Total (Overall) | 1,119 (48.9%) | 1,170 (51.1%) |
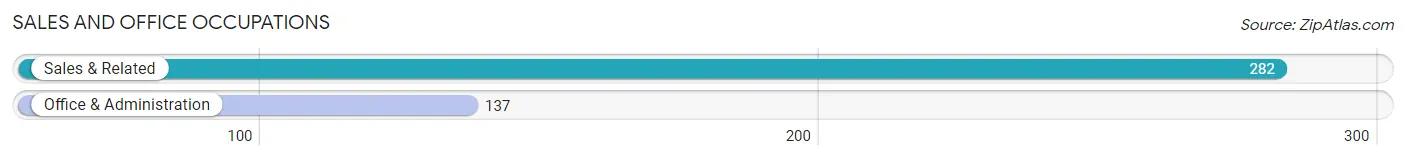
Sales and Office Occupations
The most common Sales and Office occupations in Barclay are Sales & Related (282 | 12.3%), and Office & Administration (137 | 6.0%).
Sales and Office Occupations by Sex
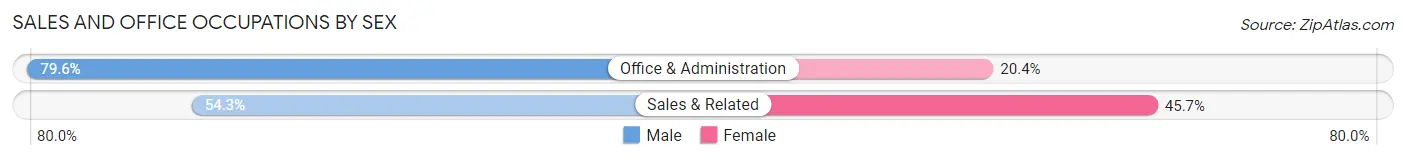
| Occupation | Male | Female |
| Sales & Related | 153 (54.3%) | 129 (45.7%) |
| Office & Administration | 109 (79.6%) | 28 (20.4%) |
| Total (Category) | 262 (62.5%) | 157 (37.5%) |
| Total (Overall) | 1,119 (48.9%) | 1,170 (51.1%) |
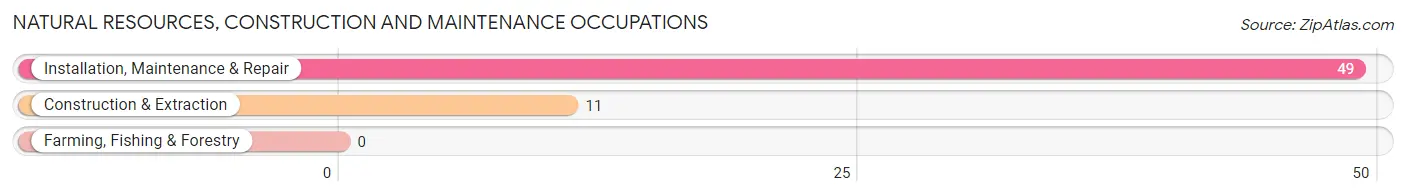
Natural Resources, Construction and Maintenance Occupations
The most common Natural Resources, Construction and Maintenance occupations in Barclay are Installation, Maintenance & Repair (49 | 2.1%), and Construction & Extraction (11 | 0.5%).
Natural Resources, Construction and Maintenance Occupations by Sex
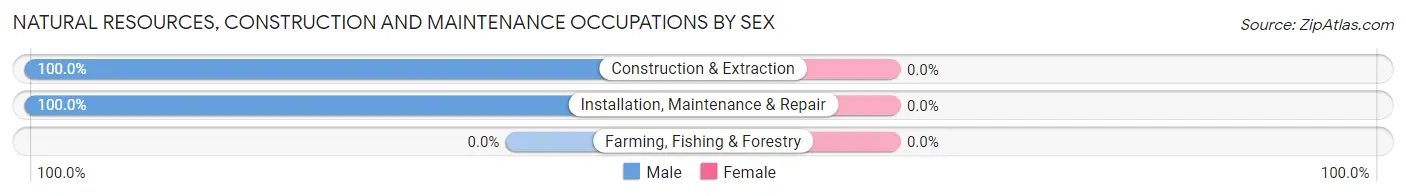
| Occupation | Male | Female |
| Farming, Fishing & Forestry | 0 (0.0%) | 0 (0.0%) |
| Construction & Extraction | 11 (100.0%) | 0 (0.0%) |
| Installation, Maintenance & Repair | 49 (100.0%) | 0 (0.0%) |
| Total (Category) | 60 (100.0%) | 0 (0.0%) |
| Total (Overall) | 1,119 (48.9%) | 1,170 (51.1%) |
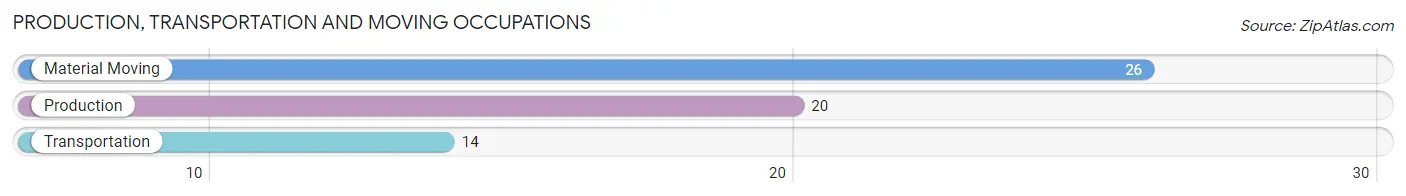
Production, Transportation and Moving Occupations
The most common Production, Transportation and Moving occupations in Barclay are Material Moving (26 | 1.1%), Production (20 | 0.9%), and Transportation (14 | 0.6%).
Production, Transportation and Moving Occupations by Sex
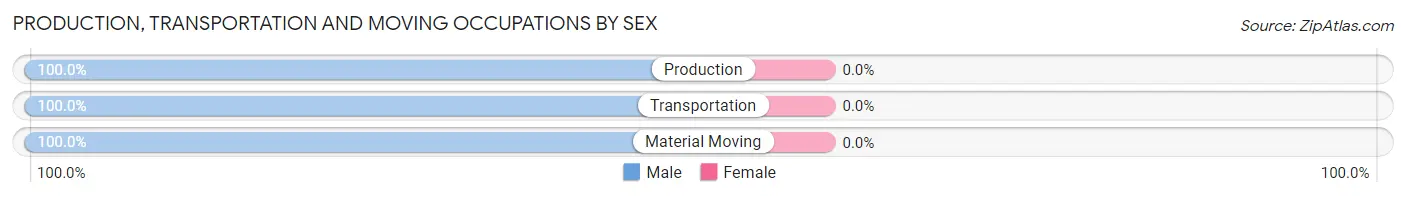
| Occupation | Male | Female |
| Production | 20 (100.0%) | 0 (0.0%) |
| Transportation | 14 (100.0%) | 0 (0.0%) |
| Material Moving | 26 (100.0%) | 0 (0.0%) |
| Total (Category) | 60 (100.0%) | 0 (0.0%) |
| Total (Overall) | 1,119 (48.9%) | 1,170 (51.1%) |
Employment Industries by Sex in Barclay
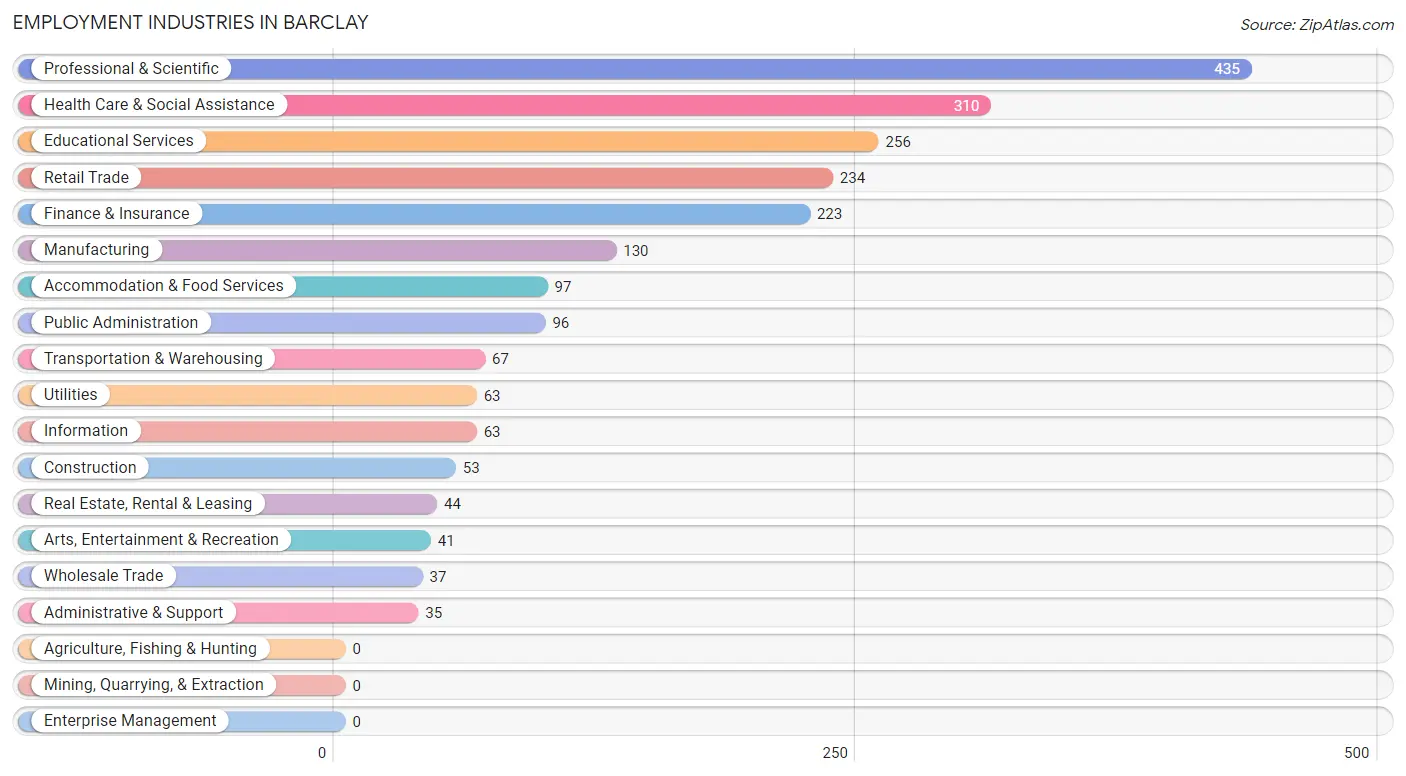
Employment Industries in Barclay
The major employment industries in Barclay include Professional & Scientific (435 | 19.0%), Health Care & Social Assistance (310 | 13.5%), Educational Services (256 | 11.2%), Retail Trade (234 | 10.2%), and Finance & Insurance (223 | 9.7%).
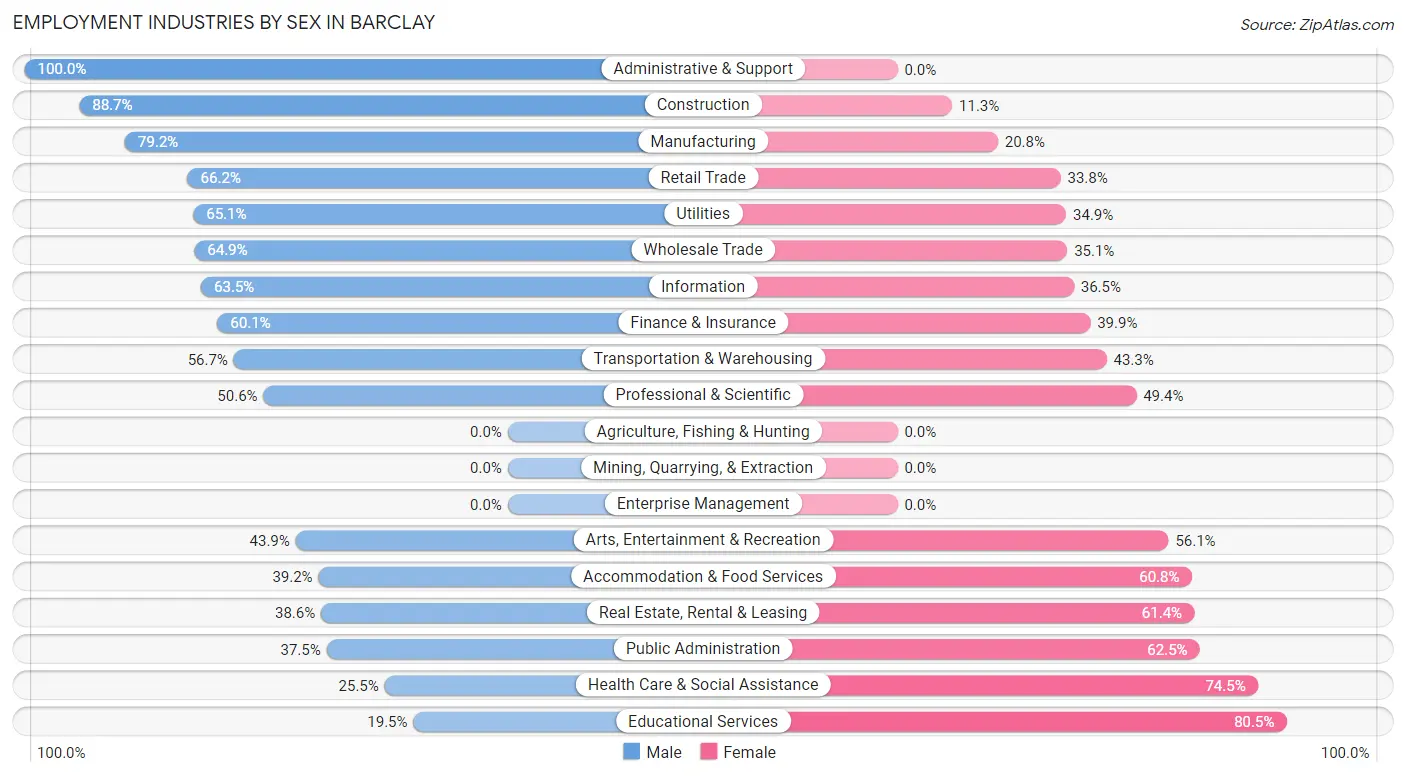
Employment Industries by Sex in Barclay
The Barclay industries that see more men than women are Administrative & Support (100.0%), Construction (88.7%), and Manufacturing (79.2%), whereas the industries that tend to have a higher number of women are Educational Services (80.5%), Health Care & Social Assistance (74.5%), and Public Administration (62.5%).
| Industry | Male | Female |
| Agriculture, Fishing & Hunting | 0 (0.0%) | 0 (0.0%) |
| Mining, Quarrying, & Extraction | 0 (0.0%) | 0 (0.0%) |
| Construction | 47 (88.7%) | 6 (11.3%) |
| Manufacturing | 103 (79.2%) | 27 (20.8%) |
| Wholesale Trade | 24 (64.9%) | 13 (35.1%) |
| Retail Trade | 155 (66.2%) | 79 (33.8%) |
| Transportation & Warehousing | 38 (56.7%) | 29 (43.3%) |
| Utilities | 41 (65.1%) | 22 (34.9%) |
| Information | 40 (63.5%) | 23 (36.5%) |
| Finance & Insurance | 134 (60.1%) | 89 (39.9%) |
| Real Estate, Rental & Leasing | 17 (38.6%) | 27 (61.4%) |
| Professional & Scientific | 220 (50.6%) | 215 (49.4%) |
| Enterprise Management | 0 (0.0%) | 0 (0.0%) |
| Administrative & Support | 35 (100.0%) | 0 (0.0%) |
| Educational Services | 50 (19.5%) | 206 (80.5%) |
| Health Care & Social Assistance | 79 (25.5%) | 231 (74.5%) |
| Arts, Entertainment & Recreation | 18 (43.9%) | 23 (56.1%) |
| Accommodation & Food Services | 38 (39.2%) | 59 (60.8%) |
| Public Administration | 36 (37.5%) | 60 (62.5%) |
| Total | 1,119 (48.9%) | 1,170 (51.1%) |
Education in Barclay
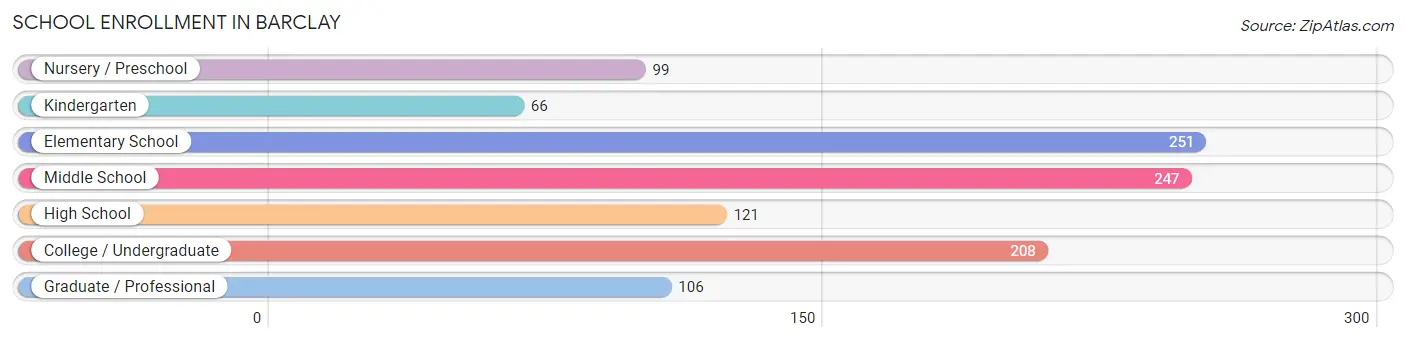
School Enrollment in Barclay
The most common levels of schooling among the 1,098 students in Barclay are elementary school (251 | 22.9%), middle school (247 | 22.5%), and college / undergraduate (208 | 18.9%).
| School Level | # Students | % Students |
| Nursery / Preschool | 99 | 9.0% |
| Kindergarten | 66 | 6.0% |
| Elementary School | 251 | 22.9% |
| Middle School | 247 | 22.5% |
| High School | 121 | 11.0% |
| College / Undergraduate | 208 | 18.9% |
| Graduate / Professional | 106 | 9.7% |
| Total | 1,098 | 100.0% |
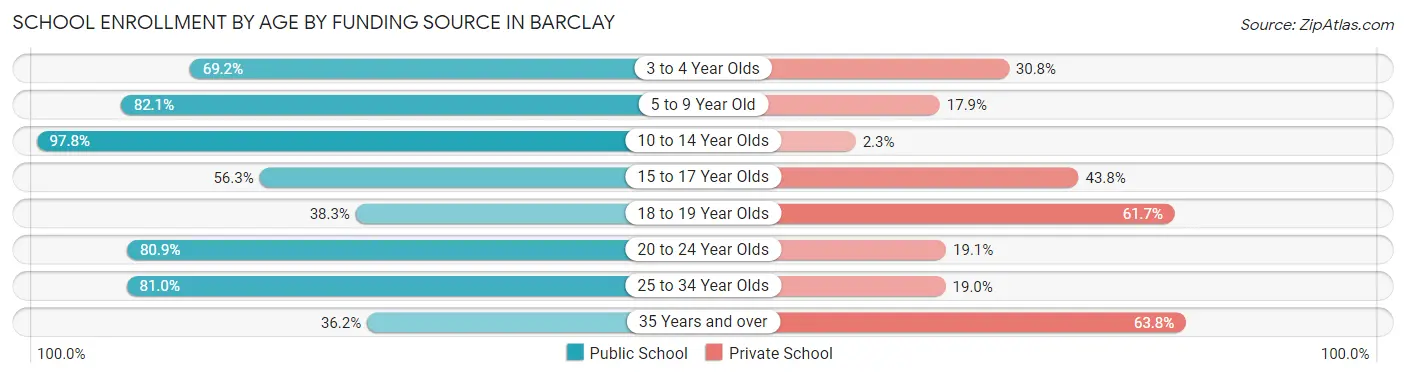
School Enrollment by Age by Funding Source in Barclay
Out of a total of 1,098 students who are enrolled in schools in Barclay, 250 (22.8%) attend a private institution, while the remaining 848 (77.2%) are enrolled in public schools. The age group of 35 years and over has the highest likelihood of being enrolled in private schools, with 44 (63.8% in the age bracket) enrolled. Conversely, the age group of 10 to 14 year olds has the lowest likelihood of being enrolled in a private school, with 261 (97.8% in the age bracket) attending a public institution.
| Age Bracket | Public School | Private School |
| 3 to 4 Year Olds | 54 (69.2%) | 24 (30.8%) |
| 5 to 9 Year Old | 261 (82.1%) | 57 (17.9%) |
| 10 to 14 Year Olds | 261 (97.8%) | 6 (2.2%) |
| 15 to 17 Year Olds | 54 (56.2%) | 42 (43.8%) |
| 18 to 19 Year Olds | 23 (38.3%) | 37 (61.7%) |
| 20 to 24 Year Olds | 106 (80.9%) | 25 (19.1%) |
| 25 to 34 Year Olds | 64 (81.0%) | 15 (19.0%) |
| 35 Years and over | 25 (36.2%) | 44 (63.8%) |
| Total | 848 (77.2%) | 250 (22.8%) |
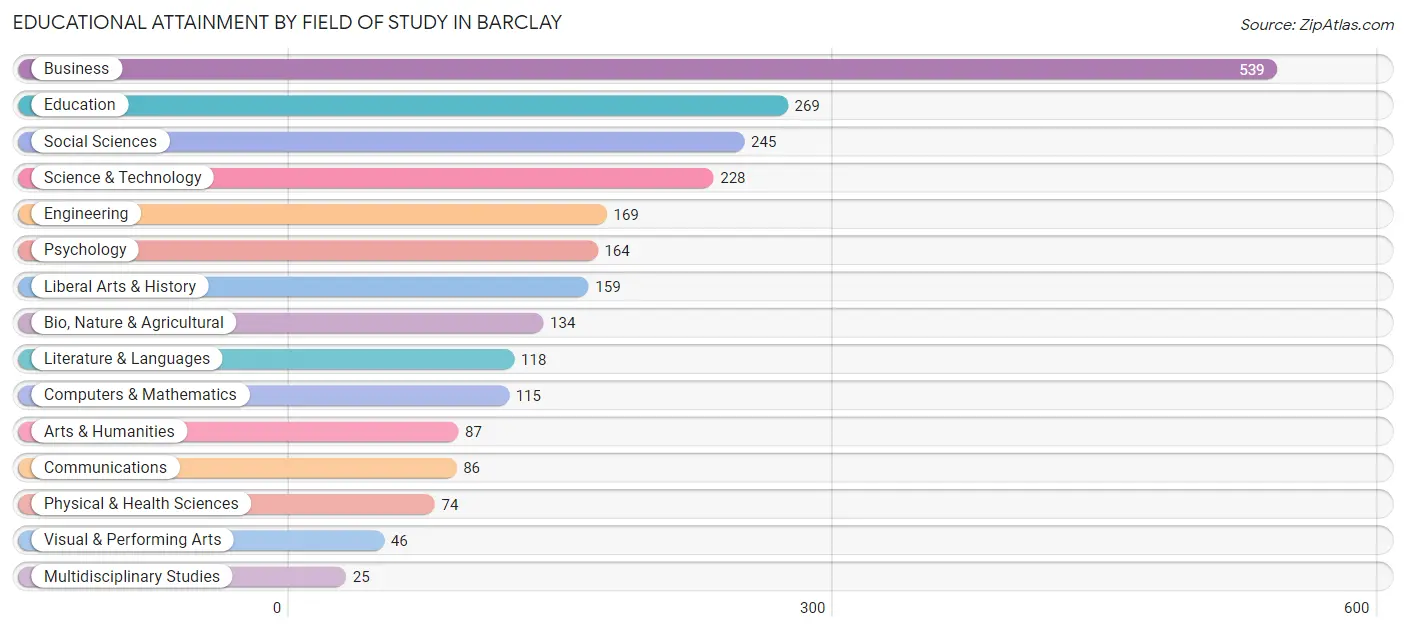
Educational Attainment by Field of Study in Barclay
Business (539 | 21.9%), education (269 | 10.9%), social sciences (245 | 10.0%), science & technology (228 | 9.3%), and engineering (169 | 6.9%) are the most common fields of study among 2,458 individuals in Barclay who have obtained a bachelor's degree or higher.
| Field of Study | # Graduates | % Graduates |
| Computers & Mathematics | 115 | 4.7% |
| Bio, Nature & Agricultural | 134 | 5.4% |
| Physical & Health Sciences | 74 | 3.0% |
| Psychology | 164 | 6.7% |
| Social Sciences | 245 | 10.0% |
| Engineering | 169 | 6.9% |
| Multidisciplinary Studies | 25 | 1.0% |
| Science & Technology | 228 | 9.3% |
| Business | 539 | 21.9% |
| Education | 269 | 10.9% |
| Literature & Languages | 118 | 4.8% |
| Liberal Arts & History | 159 | 6.5% |
| Visual & Performing Arts | 46 | 1.9% |
| Communications | 86 | 3.5% |
| Arts & Humanities | 87 | 3.5% |
| Total | 2,458 | 100.0% |
Transportation & Commute in Barclay
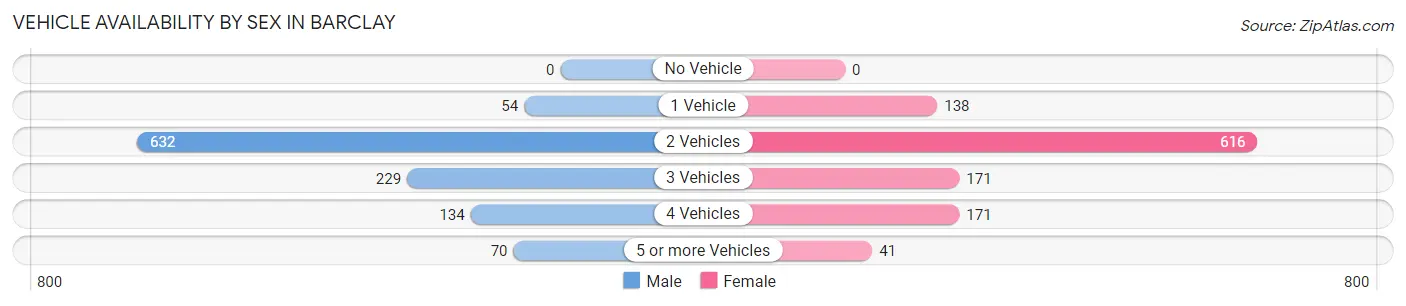
Vehicle Availability by Sex in Barclay
The most prevalent vehicle ownership categories in Barclay are males with 2 vehicles (632, accounting for 56.5%) and females with 2 vehicles (616, making up 55.6%).
| Vehicles Available | Male | Female |
| No Vehicle | 0 (0.0%) | 0 (0.0%) |
| 1 Vehicle | 54 (4.8%) | 138 (12.1%) |
| 2 Vehicles | 632 (56.5%) | 616 (54.2%) |
| 3 Vehicles | 229 (20.5%) | 171 (15.0%) |
| 4 Vehicles | 134 (12.0%) | 171 (15.0%) |
| 5 or more Vehicles | 70 (6.3%) | 41 (3.6%) |
| Total | 1,119 (100.0%) | 1,137 (100.0%) |
Commute Time in Barclay
The most frequently occuring commute durations in Barclay are 15 to 19 minutes (345 commuters, 20.5%), 10 to 14 minutes (252 commuters, 15.0%), and 5 to 9 minutes (203 commuters, 12.0%).
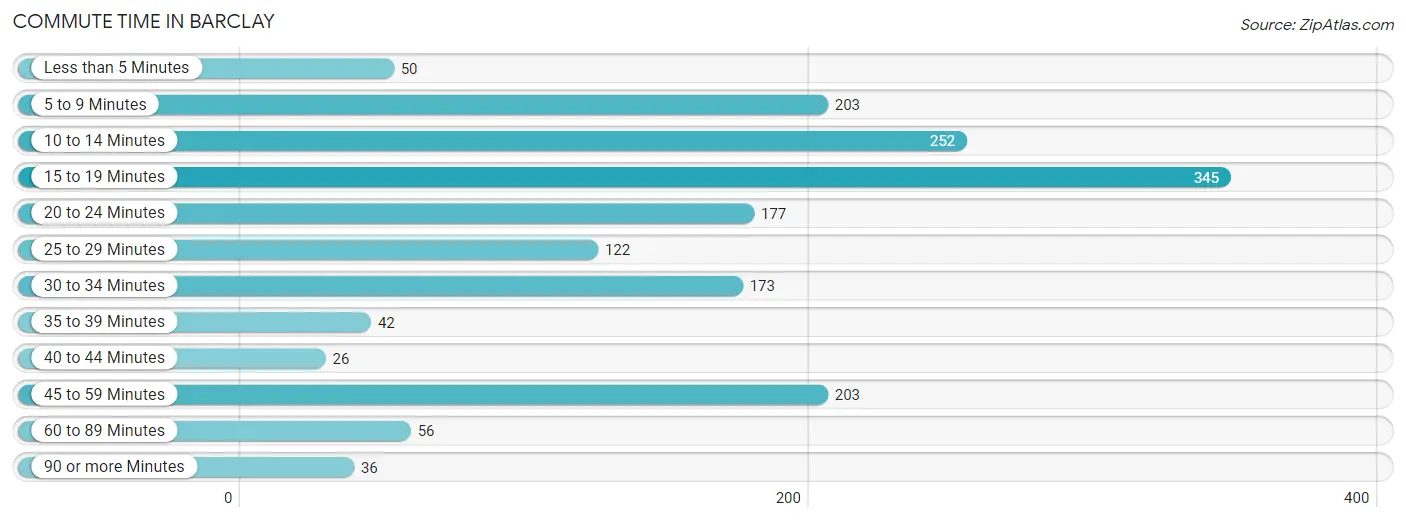
| Commute Time | # Commuters | % Commuters |
| Less than 5 Minutes | 50 | 3.0% |
| 5 to 9 Minutes | 203 | 12.0% |
| 10 to 14 Minutes | 252 | 15.0% |
| 15 to 19 Minutes | 345 | 20.5% |
| 20 to 24 Minutes | 177 | 10.5% |
| 25 to 29 Minutes | 122 | 7.2% |
| 30 to 34 Minutes | 173 | 10.3% |
| 35 to 39 Minutes | 42 | 2.5% |
| 40 to 44 Minutes | 26 | 1.5% |
| 45 to 59 Minutes | 203 | 12.0% |
| 60 to 89 Minutes | 56 | 3.3% |
| 90 or more Minutes | 36 | 2.1% |
Commute Time by Sex in Barclay
The most common commute times in Barclay are 45 to 59 minutes (157 commuters, 18.9%) for males and 15 to 19 minutes (224 commuters, 26.3%) for females.
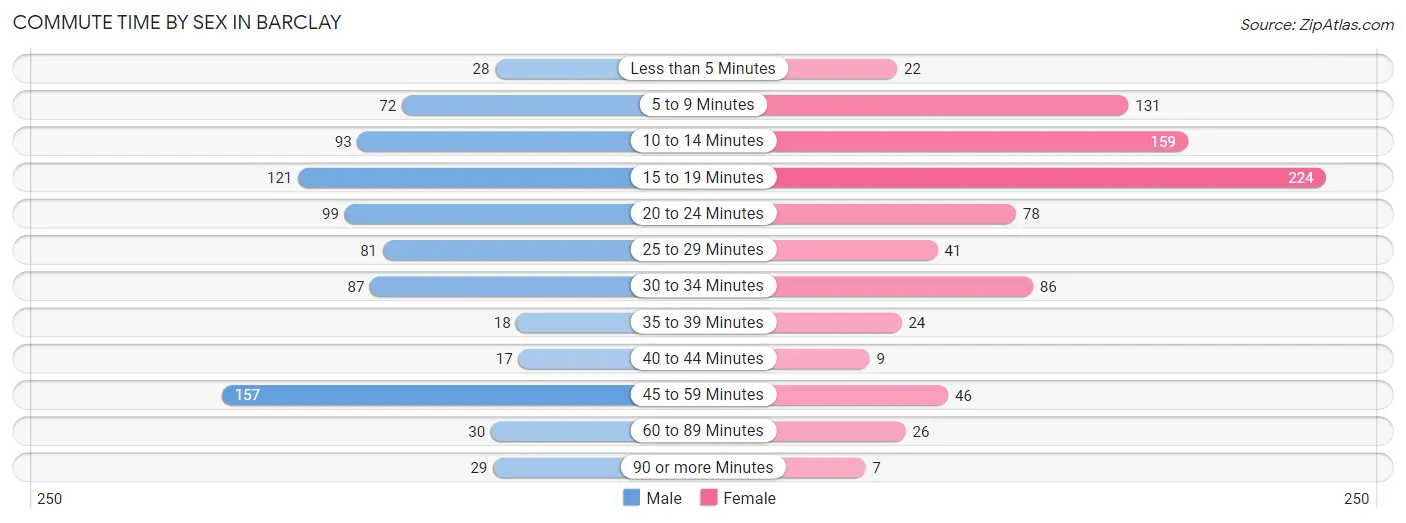
| Commute Time | Male | Female |
| Less than 5 Minutes | 28 (3.4%) | 22 (2.6%) |
| 5 to 9 Minutes | 72 (8.6%) | 131 (15.4%) |
| 10 to 14 Minutes | 93 (11.2%) | 159 (18.6%) |
| 15 to 19 Minutes | 121 (14.5%) | 224 (26.3%) |
| 20 to 24 Minutes | 99 (11.9%) | 78 (9.1%) |
| 25 to 29 Minutes | 81 (9.7%) | 41 (4.8%) |
| 30 to 34 Minutes | 87 (10.5%) | 86 (10.1%) |
| 35 to 39 Minutes | 18 (2.2%) | 24 (2.8%) |
| 40 to 44 Minutes | 17 (2.0%) | 9 (1.1%) |
| 45 to 59 Minutes | 157 (18.9%) | 46 (5.4%) |
| 60 to 89 Minutes | 30 (3.6%) | 26 (3.0%) |
| 90 or more Minutes | 29 (3.5%) | 7 (0.8%) |
Time of Departure to Work by Sex in Barclay
The most frequent times of departure to work in Barclay are 7:30 AM to 7:59 AM (144, 17.3%) for males and 8:30 AM to 8:59 AM (155, 18.2%) for females.
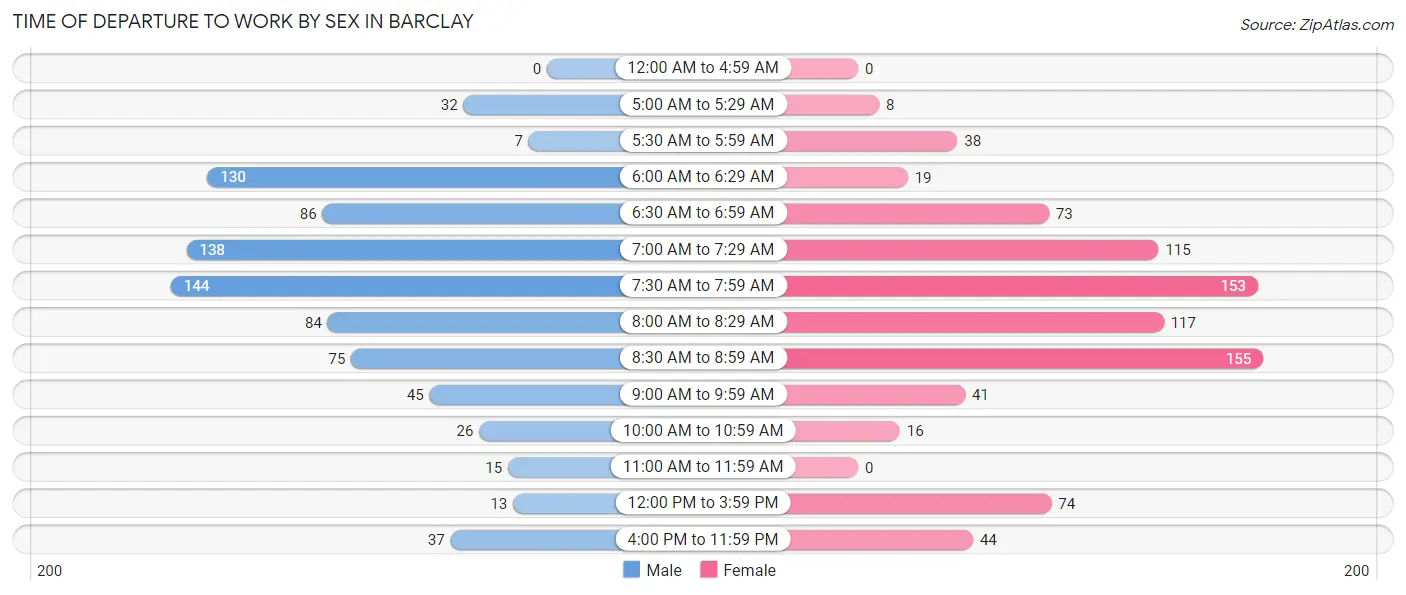
| Time of Departure | Male | Female |
| 12:00 AM to 4:59 AM | 0 (0.0%) | 0 (0.0%) |
| 5:00 AM to 5:29 AM | 32 (3.8%) | 8 (0.9%) |
| 5:30 AM to 5:59 AM | 7 (0.8%) | 38 (4.4%) |
| 6:00 AM to 6:29 AM | 130 (15.6%) | 19 (2.2%) |
| 6:30 AM to 6:59 AM | 86 (10.3%) | 73 (8.6%) |
| 7:00 AM to 7:29 AM | 138 (16.6%) | 115 (13.5%) |
| 7:30 AM to 7:59 AM | 144 (17.3%) | 153 (17.9%) |
| 8:00 AM to 8:29 AM | 84 (10.1%) | 117 (13.7%) |
| 8:30 AM to 8:59 AM | 75 (9.0%) | 155 (18.2%) |
| 9:00 AM to 9:59 AM | 45 (5.4%) | 41 (4.8%) |
| 10:00 AM to 10:59 AM | 26 (3.1%) | 16 (1.9%) |
| 11:00 AM to 11:59 AM | 15 (1.8%) | 0 (0.0%) |
| 12:00 PM to 3:59 PM | 13 (1.6%) | 74 (8.7%) |
| 4:00 PM to 11:59 PM | 37 (4.4%) | 44 (5.2%) |
| Total | 832 (100.0%) | 853 (100.0%) |
Housing Occupancy in Barclay
Occupancy by Ownership in Barclay
Of the total 1,624 dwellings in Barclay, owner-occupied units account for 1,588 (97.8%), while renter-occupied units make up 36 (2.2%).
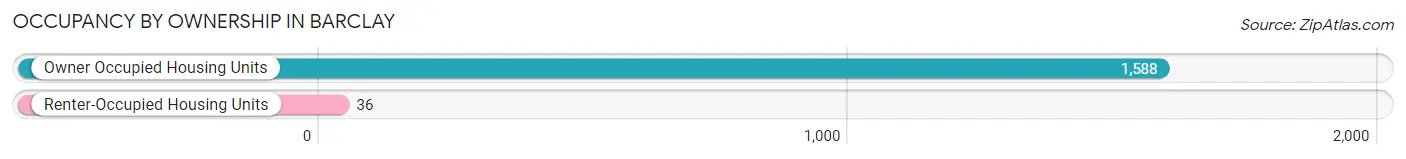
| Occupancy | # Housing Units | % Housing Units |
| Owner Occupied Housing Units | 1,588 | 97.8% |
| Renter-Occupied Housing Units | 36 | 2.2% |
| Total Occupied Housing Units | 1,624 | 100.0% |
Occupancy by Household Size in Barclay
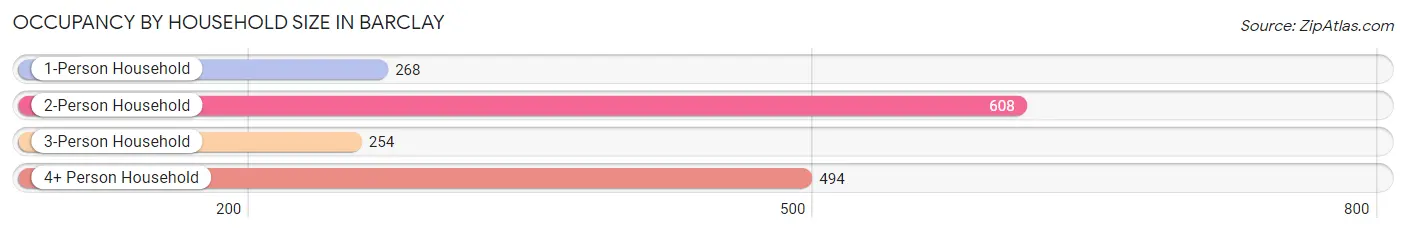
| Household Size | # Housing Units | % Housing Units |
| 1-Person Household | 268 | 16.5% |
| 2-Person Household | 608 | 37.4% |
| 3-Person Household | 254 | 15.6% |
| 4+ Person Household | 494 | 30.4% |
| Total Housing Units | 1,624 | 100.0% |
Occupancy by Ownership by Household Size in Barclay
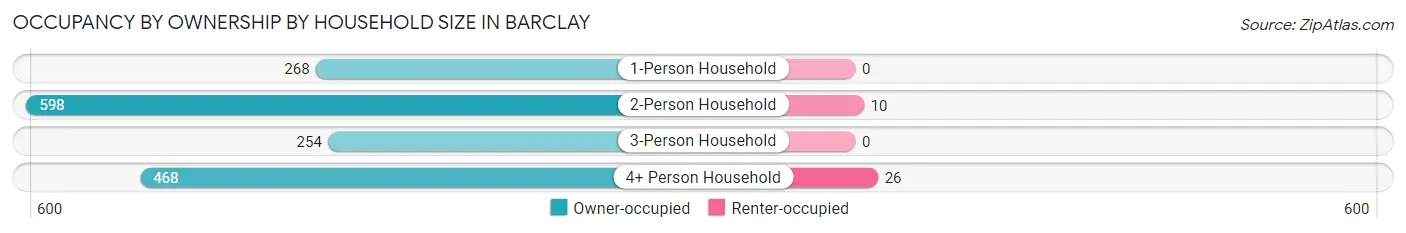
| Household Size | Owner-occupied | Renter-occupied |
| 1-Person Household | 268 (100.0%) | 0 (0.0%) |
| 2-Person Household | 598 (98.4%) | 10 (1.6%) |
| 3-Person Household | 254 (100.0%) | 0 (0.0%) |
| 4+ Person Household | 468 (94.7%) | 26 (5.3%) |
| Total Housing Units | 1,588 (97.8%) | 36 (2.2%) |
Occupancy by Educational Attainment in Barclay
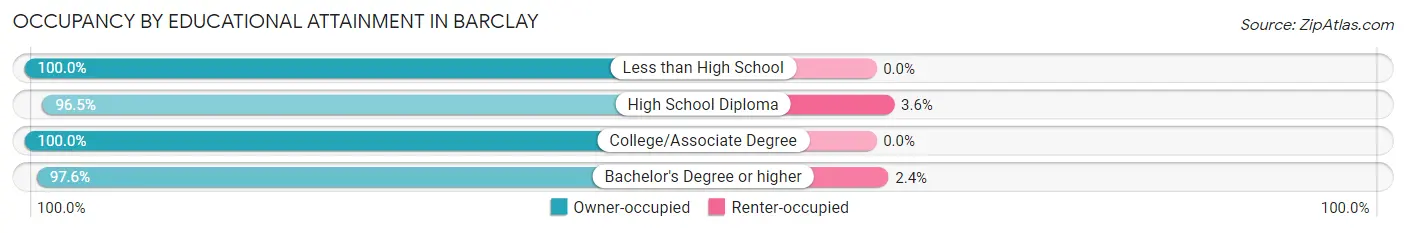
| Household Size | Owner-occupied | Renter-occupied |
| Less than High School | 55 (100.0%) | 0 (0.0%) |
| High School Diploma | 136 (96.5%) | 5 (3.5%) |
| College/Associate Degree | 148 (100.0%) | 0 (0.0%) |
| Bachelor's Degree or higher | 1,249 (97.6%) | 31 (2.4%) |
Occupancy by Age of Householder in Barclay
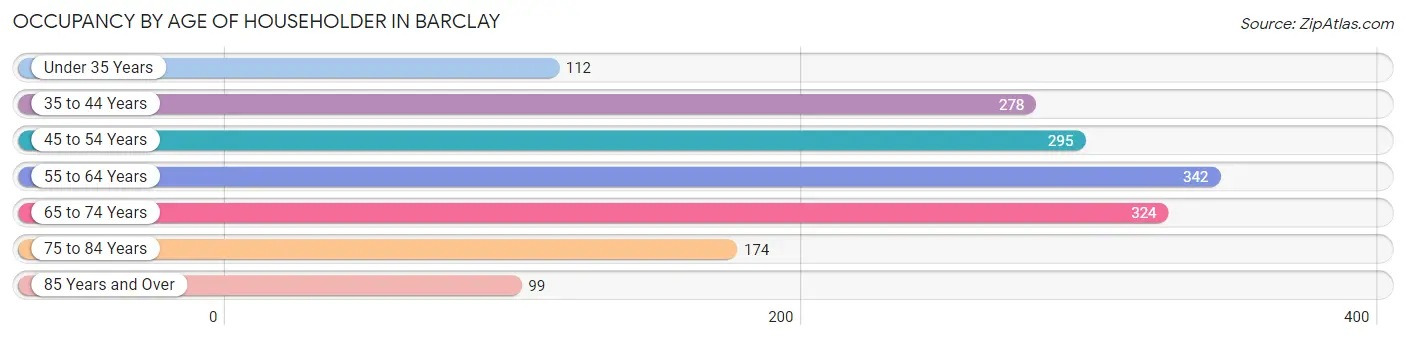
| Age Bracket | # Households | % Households |
| Under 35 Years | 112 | 6.9% |
| 35 to 44 Years | 278 | 17.1% |
| 45 to 54 Years | 295 | 18.2% |
| 55 to 64 Years | 342 | 21.1% |
| 65 to 74 Years | 324 | 20.0% |
| 75 to 84 Years | 174 | 10.7% |
| 85 Years and Over | 99 | 6.1% |
| Total | 1,624 | 100.0% |
Housing Finances in Barclay
Median Income by Occupancy in Barclay
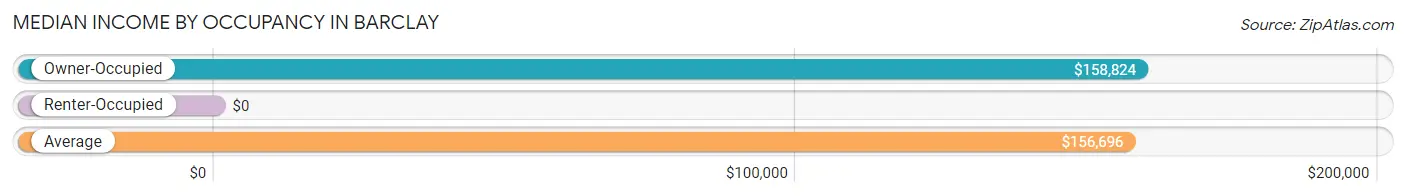
| Occupancy Type | # Households | Median Income |
| Owner-Occupied | 1,588 (97.8%) | $158,824 |
| Renter-Occupied | 36 (2.2%) | $0 |
| Average | 1,624 (100.0%) | $156,696 |
Occupancy by Householder Income Bracket in Barclay
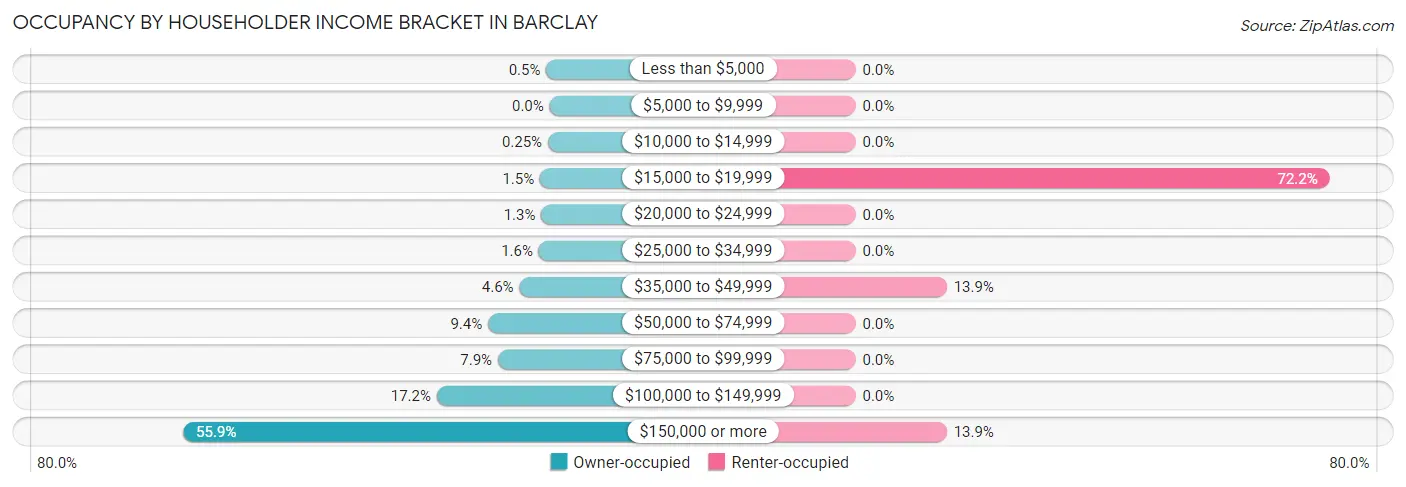
| Income Bracket | Owner-occupied | Renter-occupied |
| Less than $5,000 | 8 (0.5%) | 0 (0.0%) |
| $5,000 to $9,999 | 0 (0.0%) | 0 (0.0%) |
| $10,000 to $14,999 | 4 (0.3%) | 0 (0.0%) |
| $15,000 to $19,999 | 23 (1.5%) | 26 (72.2%) |
| $20,000 to $24,999 | 20 (1.3%) | 0 (0.0%) |
| $25,000 to $34,999 | 26 (1.6%) | 0 (0.0%) |
| $35,000 to $49,999 | 73 (4.6%) | 5 (13.9%) |
| $50,000 to $74,999 | 149 (9.4%) | 0 (0.0%) |
| $75,000 to $99,999 | 125 (7.9%) | 0 (0.0%) |
| $100,000 to $149,999 | 273 (17.2%) | 0 (0.0%) |
| $150,000 or more | 887 (55.9%) | 5 (13.9%) |
| Total | 1,588 (100.0%) | 36 (100.0%) |
Monthly Housing Cost Tiers in Barclay
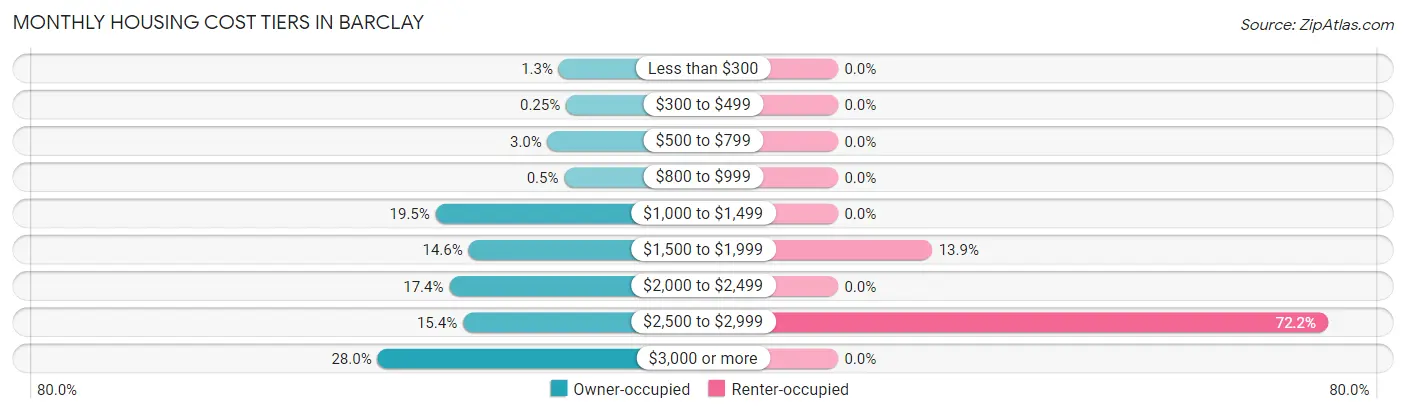
| Monthly Cost | Owner-occupied | Renter-occupied |
| Less than $300 | 21 (1.3%) | 0 (0.0%) |
| $300 to $499 | 4 (0.3%) | 0 (0.0%) |
| $500 to $799 | 47 (3.0%) | 0 (0.0%) |
| $800 to $999 | 8 (0.5%) | 0 (0.0%) |
| $1,000 to $1,499 | 309 (19.5%) | 0 (0.0%) |
| $1,500 to $1,999 | 232 (14.6%) | 5 (13.9%) |
| $2,000 to $2,499 | 277 (17.4%) | 0 (0.0%) |
| $2,500 to $2,999 | 245 (15.4%) | 26 (72.2%) |
| $3,000 or more | 445 (28.0%) | 0 (0.0%) |
| Total | 1,588 (100.0%) | 36 (100.0%) |
Physical Housing Characteristics in Barclay
Housing Structures in Barclay
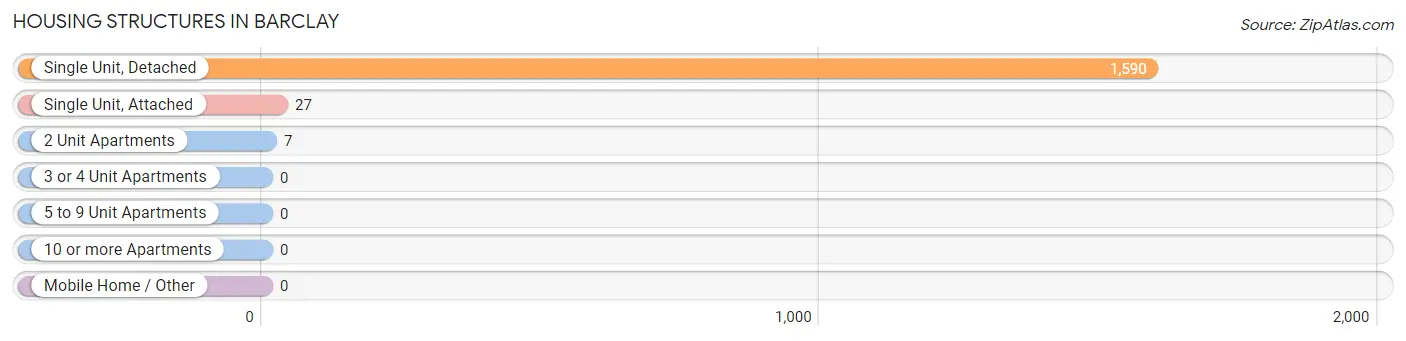
| Structure Type | # Housing Units | % Housing Units |
| Single Unit, Detached | 1,590 | 97.9% |
| Single Unit, Attached | 27 | 1.7% |
| 2 Unit Apartments | 7 | 0.4% |
| 3 or 4 Unit Apartments | 0 | 0.0% |
| 5 to 9 Unit Apartments | 0 | 0.0% |
| 10 or more Apartments | 0 | 0.0% |
| Mobile Home / Other | 0 | 0.0% |
| Total | 1,624 | 100.0% |
Housing Structures by Occupancy in Barclay
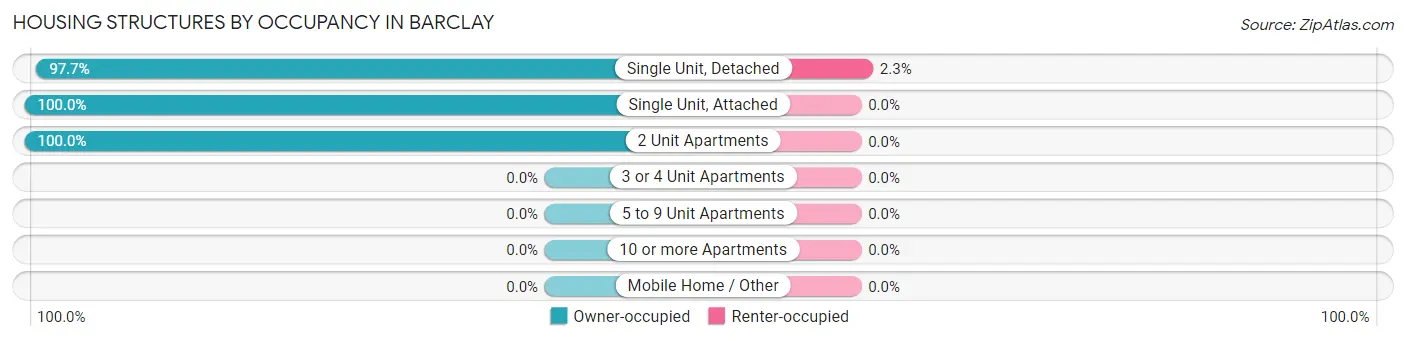
| Structure Type | Owner-occupied | Renter-occupied |
| Single Unit, Detached | 1,554 (97.7%) | 36 (2.3%) |
| Single Unit, Attached | 27 (100.0%) | 0 (0.0%) |
| 2 Unit Apartments | 7 (100.0%) | 0 (0.0%) |
| 3 or 4 Unit Apartments | 0 (0.0%) | 0 (0.0%) |
| 5 to 9 Unit Apartments | 0 (0.0%) | 0 (0.0%) |
| 10 or more Apartments | 0 (0.0%) | 0 (0.0%) |
| Mobile Home / Other | 0 (0.0%) | 0 (0.0%) |
| Total | 1,588 (97.8%) | 36 (2.2%) |
Housing Structures by Number of Rooms in Barclay
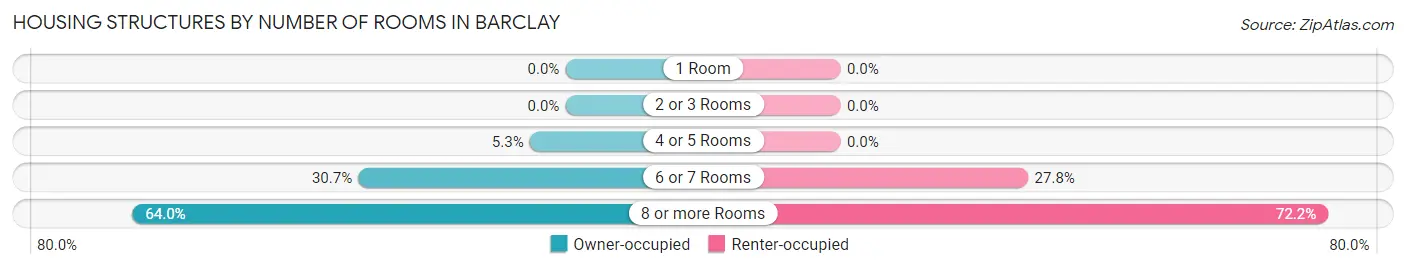
| Number of Rooms | Owner-occupied | Renter-occupied |
| 1 Room | 0 (0.0%) | 0 (0.0%) |
| 2 or 3 Rooms | 0 (0.0%) | 0 (0.0%) |
| 4 or 5 Rooms | 84 (5.3%) | 0 (0.0%) |
| 6 or 7 Rooms | 487 (30.7%) | 10 (27.8%) |
| 8 or more Rooms | 1,017 (64.0%) | 26 (72.2%) |
| Total | 1,588 (100.0%) | 36 (100.0%) |
Housing Structure by Heating Type in Barclay
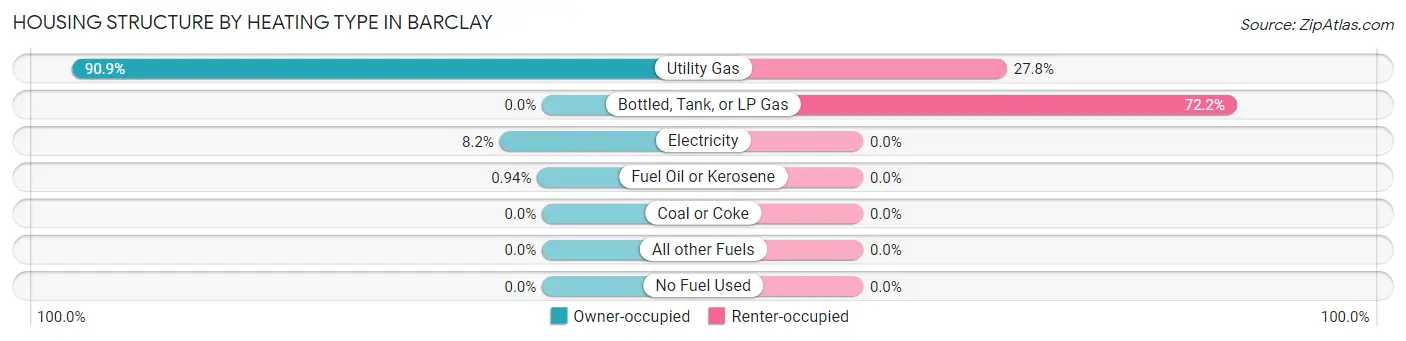
| Heating Type | Owner-occupied | Renter-occupied |
| Utility Gas | 1,443 (90.9%) | 10 (27.8%) |
| Bottled, Tank, or LP Gas | 0 (0.0%) | 26 (72.2%) |
| Electricity | 130 (8.2%) | 0 (0.0%) |
| Fuel Oil or Kerosene | 15 (0.9%) | 0 (0.0%) |
| Coal or Coke | 0 (0.0%) | 0 (0.0%) |
| All other Fuels | 0 (0.0%) | 0 (0.0%) |
| No Fuel Used | 0 (0.0%) | 0 (0.0%) |
| Total | 1,588 (100.0%) | 36 (100.0%) |
Household Vehicle Usage in Barclay
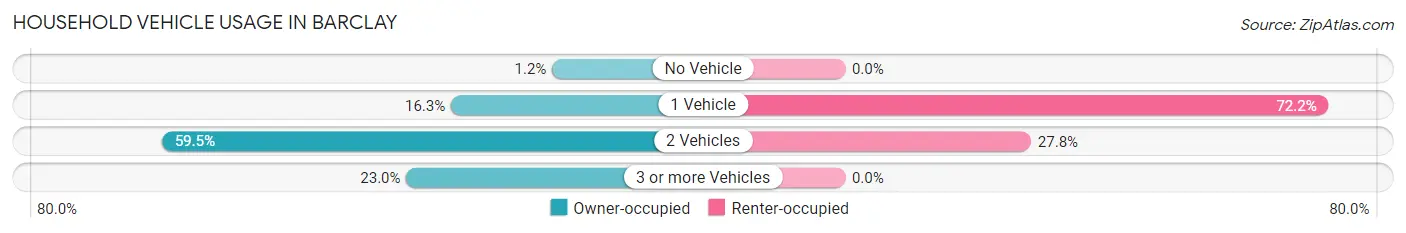
| Vehicles per Household | Owner-occupied | Renter-occupied |
| No Vehicle | 19 (1.2%) | 0 (0.0%) |
| 1 Vehicle | 259 (16.3%) | 26 (72.2%) |
| 2 Vehicles | 945 (59.5%) | 10 (27.8%) |
| 3 or more Vehicles | 365 (23.0%) | 0 (0.0%) |
| Total | 1,588 (100.0%) | 36 (100.0%) |
Real Estate & Mortgages in Barclay
Real Estate and Mortgage Overview in Barclay
| Characteristic | Without Mortgage | With Mortgage |
| Housing Units | 563 | 1,025 |
| Median Property Value | $400,200 | $424,300 |
| Median Household Income | $117,986 | $650 |
| Monthly Housing Costs | $1,359 | $439 |
| Real Estate Taxes | $10,001 | $14 |
Property Value by Mortgage Status in Barclay
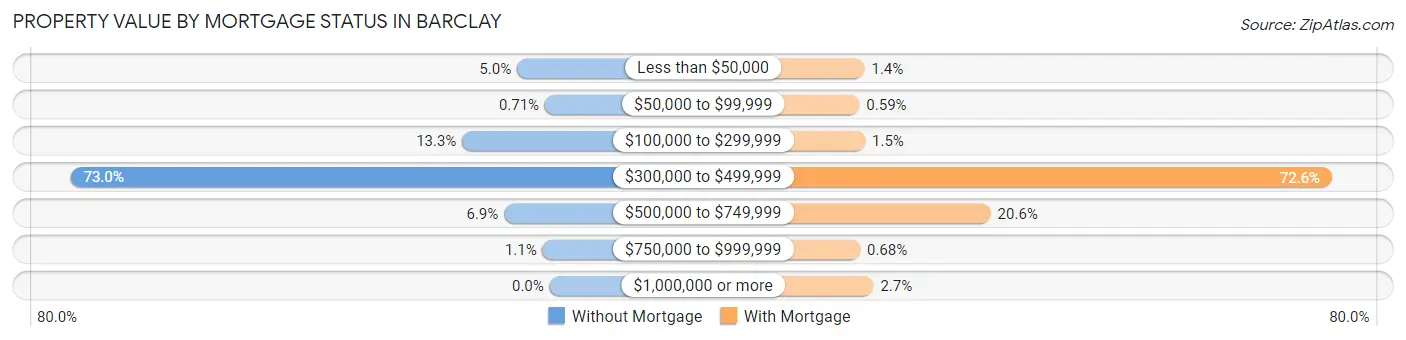
| Property Value | Without Mortgage | With Mortgage |
| Less than $50,000 | 28 (5.0%) | 14 (1.4%) |
| $50,000 to $99,999 | 4 (0.7%) | 6 (0.6%) |
| $100,000 to $299,999 | 75 (13.3%) | 15 (1.5%) |
| $300,000 to $499,999 | 411 (73.0%) | 744 (72.6%) |
| $500,000 to $749,999 | 39 (6.9%) | 211 (20.6%) |
| $750,000 to $999,999 | 6 (1.1%) | 7 (0.7%) |
| $1,000,000 or more | 0 (0.0%) | 28 (2.7%) |
| Total | 563 (100.0%) | 1,025 (100.0%) |
Household Income by Mortgage Status in Barclay
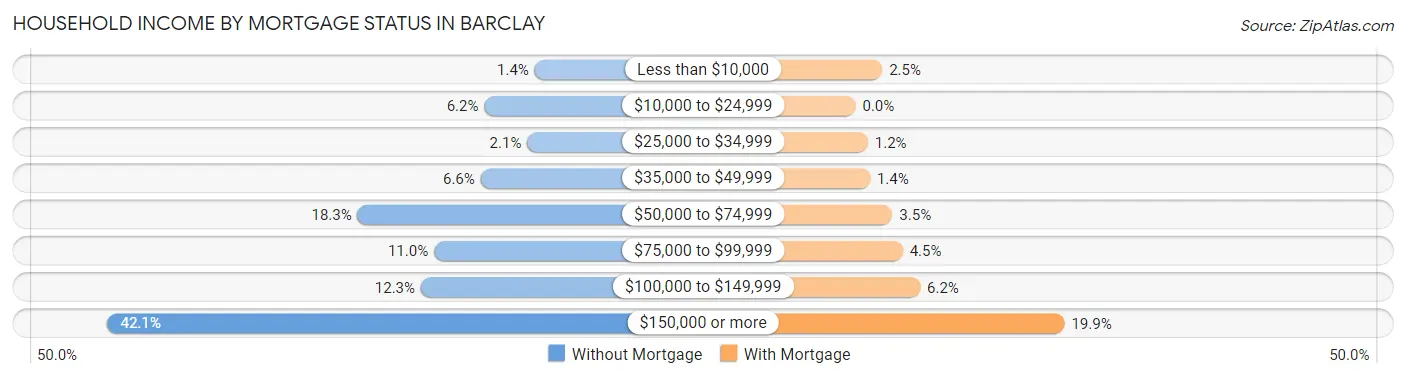
| Household Income | Without Mortgage | With Mortgage |
| Less than $10,000 | 8 (1.4%) | 26 (2.5%) |
| $10,000 to $24,999 | 35 (6.2%) | 0 (0.0%) |
| $25,000 to $34,999 | 12 (2.1%) | 12 (1.2%) |
| $35,000 to $49,999 | 37 (6.6%) | 14 (1.4%) |
| $50,000 to $74,999 | 103 (18.3%) | 36 (3.5%) |
| $75,000 to $99,999 | 62 (11.0%) | 46 (4.5%) |
| $100,000 to $149,999 | 69 (12.3%) | 63 (6.1%) |
| $150,000 or more | 237 (42.1%) | 204 (19.9%) |
| Total | 563 (100.0%) | 1,025 (100.0%) |
Property Value to Household Income Ratio in Barclay
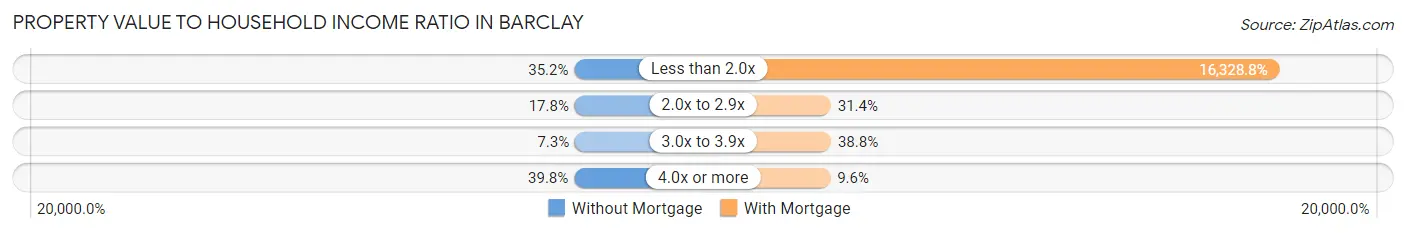
| Value-to-Income Ratio | Without Mortgage | With Mortgage |
| Less than 2.0x | 198 (35.2%) | 167,370 (16,328.8%) |
| 2.0x to 2.9x | 100 (17.8%) | 322 (31.4%) |
| 3.0x to 3.9x | 41 (7.3%) | 398 (38.8%) |
| 4.0x or more | 224 (39.8%) | 98 (9.6%) |
| Total | 563 (100.0%) | 1,025 (100.0%) |
Real Estate Taxes by Mortgage Status in Barclay
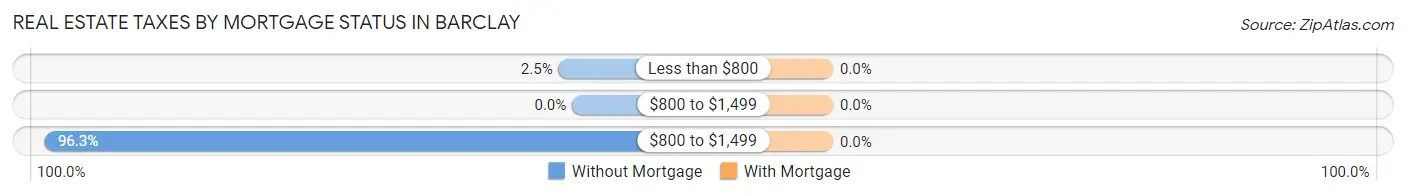
| Property Taxes | Without Mortgage | With Mortgage |
| Less than $800 | 14 (2.5%) | 0 (0.0%) |
| $800 to $1,499 | 0 (0.0%) | 0 (0.0%) |
| $800 to $1,499 | 542 (96.3%) | 0 (0.0%) |
| Total | 563 (100.0%) | 1,025 (100.0%) |
Health & Disability in Barclay
Health Insurance Coverage by Age in Barclay
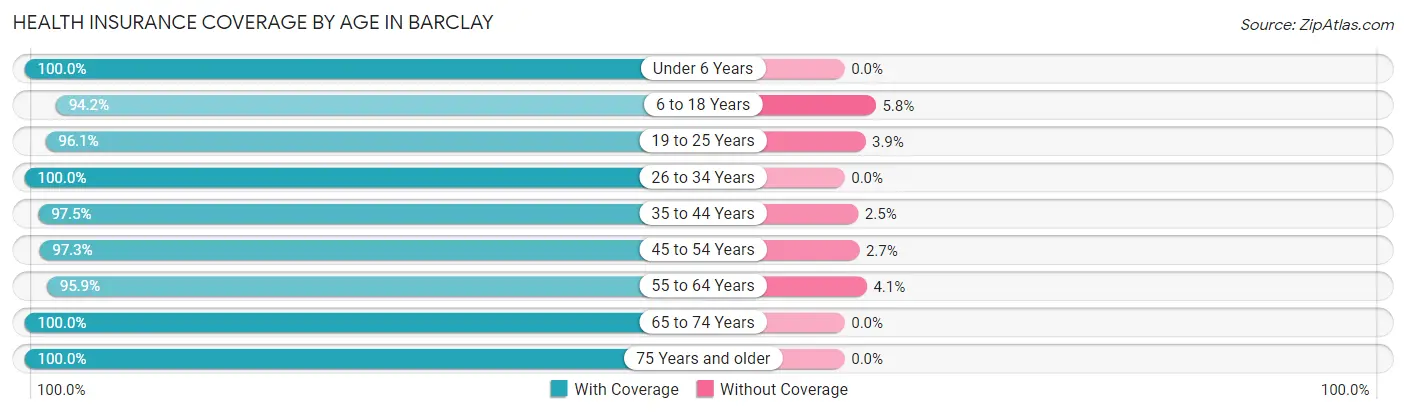
| Age Bracket | With Coverage | Without Coverage |
| Under 6 Years | 374 (100.0%) | 0 (0.0%) |
| 6 to 18 Years | 632 (94.2%) | 39 (5.8%) |
| 19 to 25 Years | 273 (96.1%) | 11 (3.9%) |
| 26 to 34 Years | 326 (100.0%) | 0 (0.0%) |
| 35 to 44 Years | 613 (97.5%) | 16 (2.5%) |
| 45 to 54 Years | 497 (97.3%) | 14 (2.7%) |
| 55 to 64 Years | 671 (95.9%) | 29 (4.1%) |
| 65 to 74 Years | 569 (100.0%) | 0 (0.0%) |
| 75 Years and older | 440 (100.0%) | 0 (0.0%) |
| Total | 4,395 (97.6%) | 109 (2.4%) |
Health Insurance Coverage by Citizenship Status in Barclay
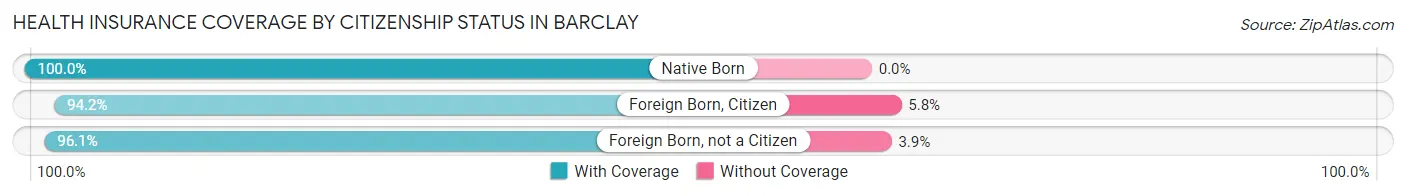
| Citizenship Status | With Coverage | Without Coverage |
| Native Born | 374 (100.0%) | 0 (0.0%) |
| Foreign Born, Citizen | 632 (94.2%) | 39 (5.8%) |
| Foreign Born, not a Citizen | 273 (96.1%) | 11 (3.9%) |
Health Insurance Coverage by Household Income in Barclay
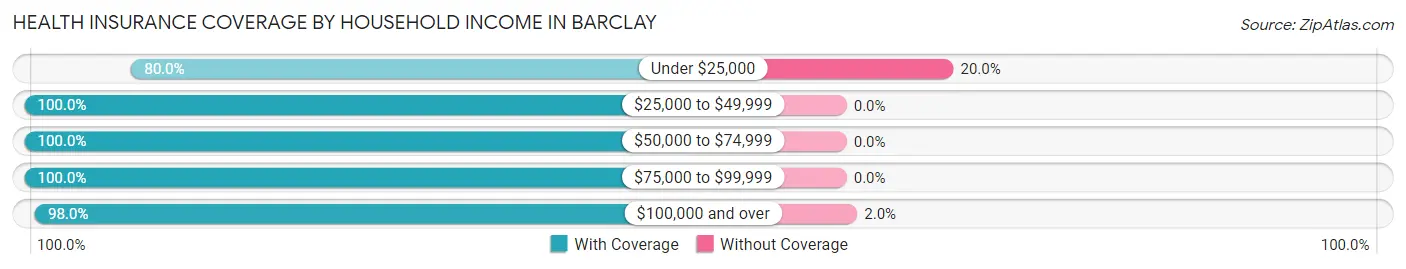
| Household Income | With Coverage | Without Coverage |
| Under $25,000 | 148 (80.0%) | 37 (20.0%) |
| $25,000 to $49,999 | 172 (100.0%) | 0 (0.0%) |
| $50,000 to $74,999 | 266 (100.0%) | 0 (0.0%) |
| $75,000 to $99,999 | 219 (100.0%) | 0 (0.0%) |
| $100,000 and over | 3,590 (98.0%) | 72 (2.0%) |
Public vs Private Health Insurance Coverage by Age in Barclay
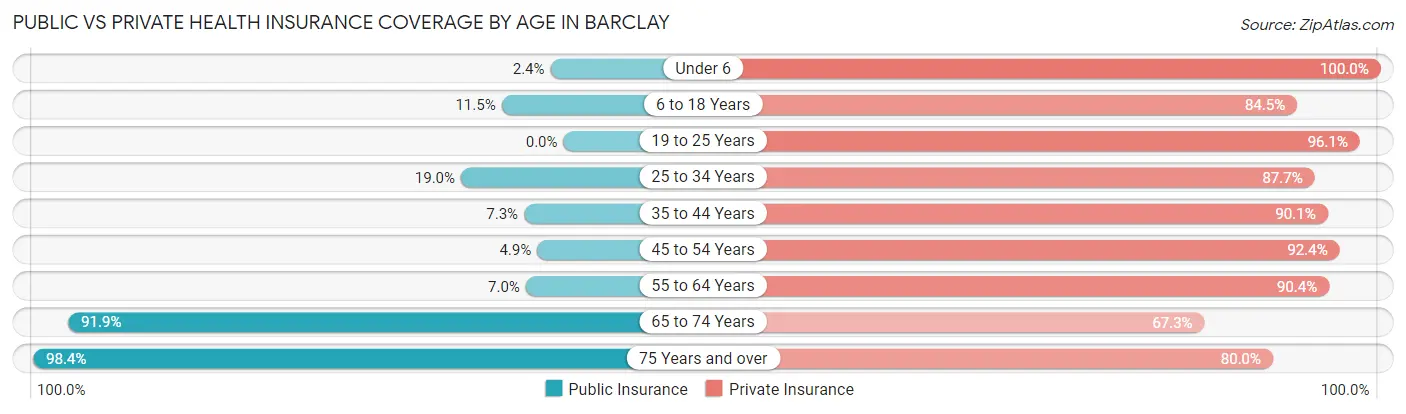
| Age Bracket | Public Insurance | Private Insurance |
| Under 6 | 9 (2.4%) | 374 (100.0%) |
| 6 to 18 Years | 77 (11.5%) | 567 (84.5%) |
| 19 to 25 Years | 0 (0.0%) | 273 (96.1%) |
| 25 to 34 Years | 62 (19.0%) | 286 (87.7%) |
| 35 to 44 Years | 46 (7.3%) | 567 (90.1%) |
| 45 to 54 Years | 25 (4.9%) | 472 (92.4%) |
| 55 to 64 Years | 49 (7.0%) | 633 (90.4%) |
| 65 to 74 Years | 523 (91.9%) | 383 (67.3%) |
| 75 Years and over | 433 (98.4%) | 352 (80.0%) |
| Total | 1,224 (27.2%) | 3,907 (86.8%) |
Disability Status by Sex by Age in Barclay
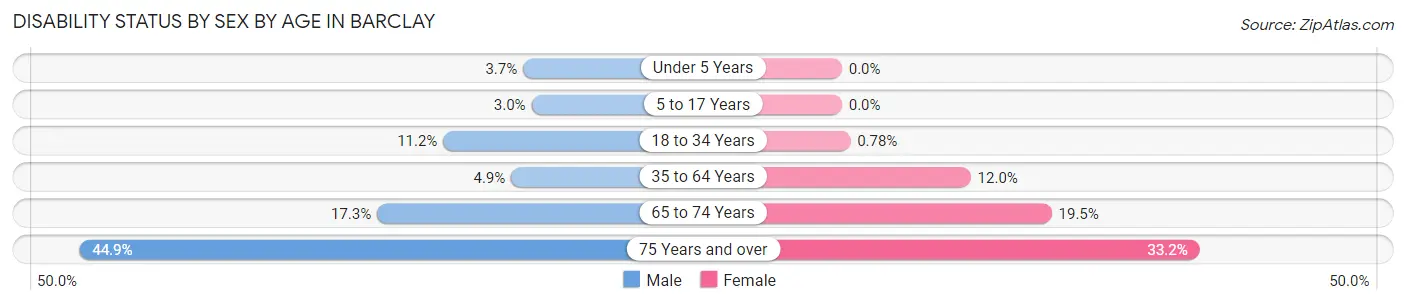
| Age Bracket | Male | Female |
| Under 5 Years | 8 (3.7%) | 0 (0.0%) |
| 5 to 17 Years | 9 (3.0%) | 0 (0.0%) |
| 18 to 34 Years | 30 (11.2%) | 3 (0.8%) |
| 35 to 64 Years | 41 (4.9%) | 119 (12.0%) |
| 65 to 74 Years | 46 (17.3%) | 59 (19.5%) |
| 75 Years and over | 84 (44.9%) | 84 (33.2%) |
Disability Class by Sex by Age in Barclay
Disability Class: Hearing Difficulty
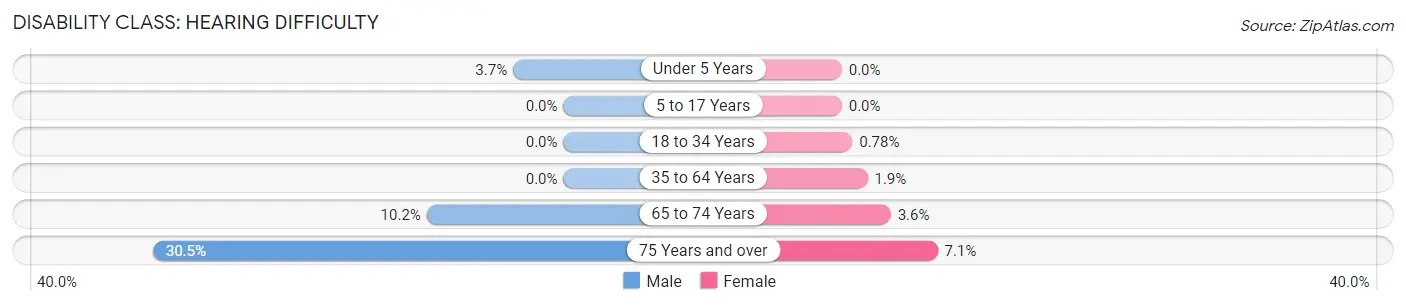
| Age Bracket | Male | Female |
| Under 5 Years | 8 (3.7%) | 0 (0.0%) |
| 5 to 17 Years | 0 (0.0%) | 0 (0.0%) |
| 18 to 34 Years | 0 (0.0%) | 3 (0.8%) |
| 35 to 64 Years | 0 (0.0%) | 19 (1.9%) |
| 65 to 74 Years | 27 (10.2%) | 11 (3.6%) |
| 75 Years and over | 57 (30.5%) | 18 (7.1%) |
Disability Class: Vision Difficulty
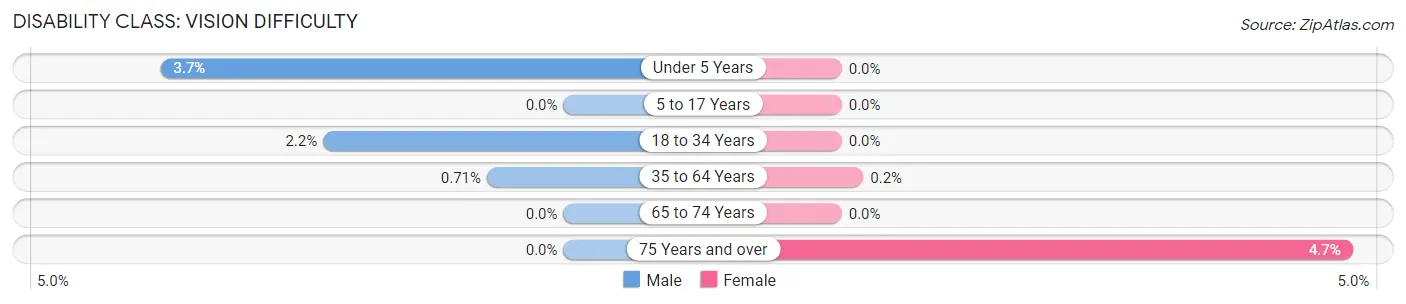
| Age Bracket | Male | Female |
| Under 5 Years | 8 (3.7%) | 0 (0.0%) |
| 5 to 17 Years | 0 (0.0%) | 0 (0.0%) |
| 18 to 34 Years | 6 (2.2%) | 0 (0.0%) |
| 35 to 64 Years | 6 (0.7%) | 2 (0.2%) |
| 65 to 74 Years | 0 (0.0%) | 0 (0.0%) |
| 75 Years and over | 0 (0.0%) | 12 (4.7%) |
Disability Class: Cognitive Difficulty
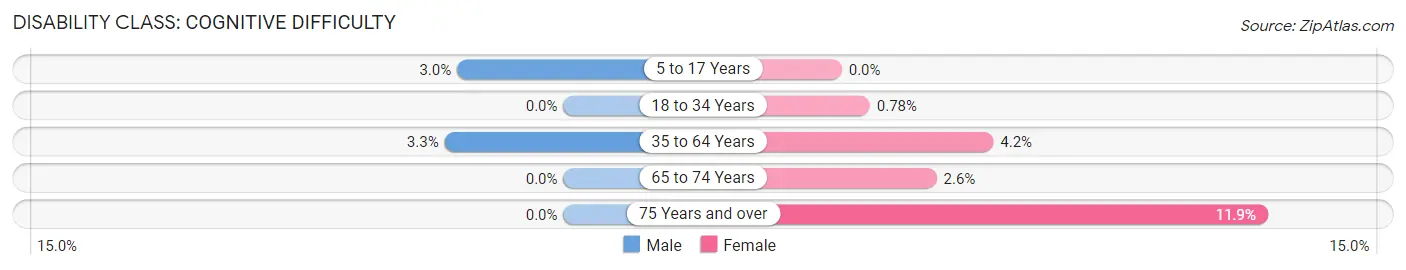
| Age Bracket | Male | Female |
| 5 to 17 Years | 9 (3.0%) | 0 (0.0%) |
| 18 to 34 Years | 0 (0.0%) | 3 (0.8%) |
| 35 to 64 Years | 28 (3.3%) | 42 (4.2%) |
| 65 to 74 Years | 0 (0.0%) | 8 (2.6%) |
| 75 Years and over | 0 (0.0%) | 30 (11.9%) |
Disability Class: Ambulatory Difficulty
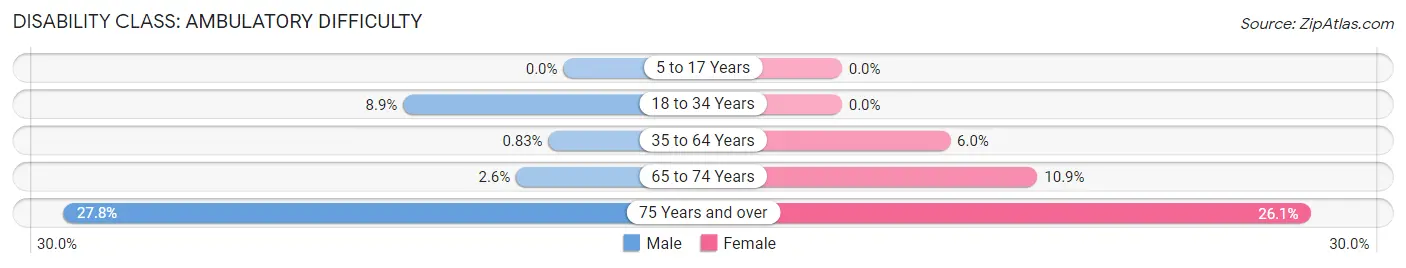
| Age Bracket | Male | Female |
| 5 to 17 Years | 0 (0.0%) | 0 (0.0%) |
| 18 to 34 Years | 24 (8.9%) | 0 (0.0%) |
| 35 to 64 Years | 7 (0.8%) | 60 (6.0%) |
| 65 to 74 Years | 7 (2.6%) | 33 (10.9%) |
| 75 Years and over | 52 (27.8%) | 66 (26.1%) |
Disability Class: Self-Care Difficulty
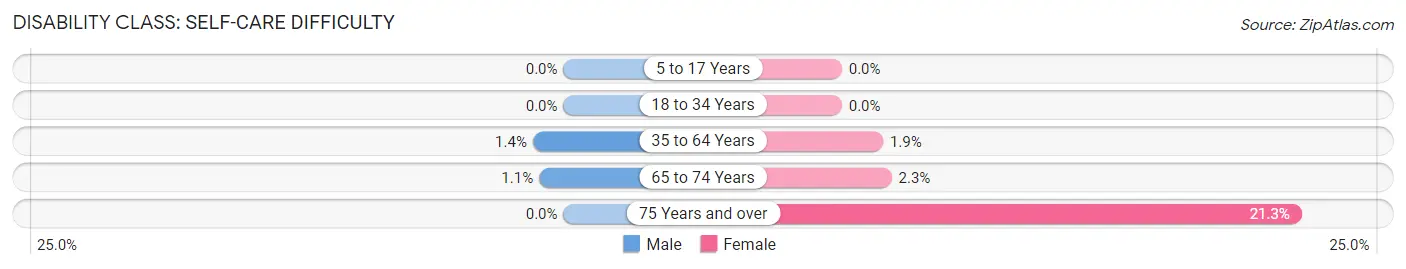
| Age Bracket | Male | Female |
| 5 to 17 Years | 0 (0.0%) | 0 (0.0%) |
| 18 to 34 Years | 0 (0.0%) | 0 (0.0%) |
| 35 to 64 Years | 12 (1.4%) | 19 (1.9%) |
| 65 to 74 Years | 3 (1.1%) | 7 (2.3%) |
| 75 Years and over | 0 (0.0%) | 54 (21.3%) |
Technology Access in Barclay
Computing Device Access in Barclay
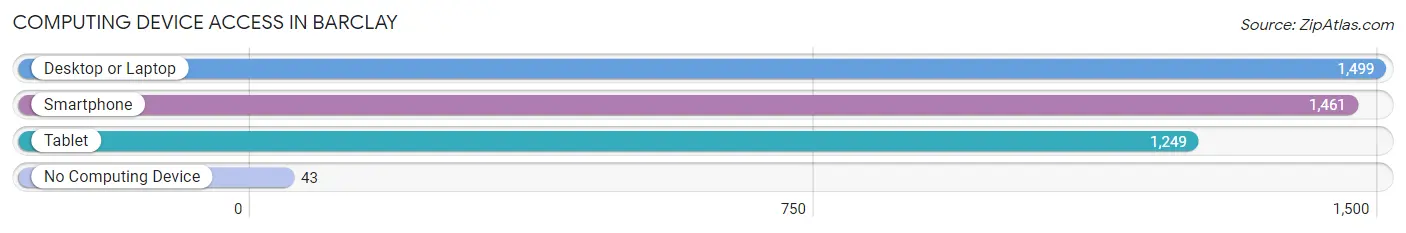
| Device Type | # Households | % Households |
| Desktop or Laptop | 1,499 | 92.3% |
| Smartphone | 1,461 | 90.0% |
| Tablet | 1,249 | 76.9% |
| No Computing Device | 43 | 2.6% |
| Total | 1,624 | 100.0% |
Internet Access in Barclay
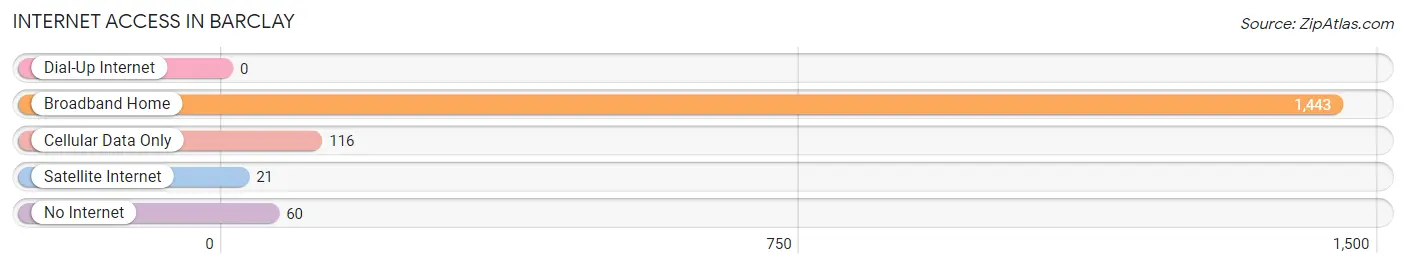
| Internet Type | # Households | % Households |
| Dial-Up Internet | 0 | 0.0% |
| Broadband Home | 1,443 | 88.8% |
| Cellular Data Only | 116 | 7.1% |
| Satellite Internet | 21 | 1.3% |
| No Internet | 60 | 3.7% |
| Total | 1,624 | 100.0% |
Barclay Summary
Barclay is a small borough located in Camden County, New Jersey. It is situated on the Delaware River, just south of Philadelphia. The borough was incorporated in 1894 and has a population of approximately 1,400 people.
Geography
Barclay is located in the Delaware Valley region of New Jersey. It is situated on the Delaware River, just south of Philadelphia. The borough is bordered by the townships of Gloucester and Winslow. The total area of the borough is 0.7 square miles, all of which is land. The terrain is mostly flat, with some rolling hills.
Climate
Barclay has a humid subtropical climate, with hot, humid summers and cold, wet winters. The average annual temperature is around 55°F, with an average high of around 80°F in the summer and an average low of around 30°F in the winter. The average annual precipitation is around 45 inches.
Demographics
As of the 2010 census, the population of Barclay was 1,400 people. The racial makeup of the borough was 94.3% White, 2.3% African American, 0.3% Native American, 0.7% Asian, 0.1% Pacific Islander, and 2.3% from other races. Hispanic or Latino of any race were 4.3% of the population.
Economy
Barclay is a small, rural borough with a limited economy. The primary industries are agriculture and tourism. The borough is home to several small farms, which produce a variety of fruits and vegetables. The borough also has several small businesses, including restaurants, retail stores, and professional services.
The borough is also home to several historic sites, including the Barclay Mansion, which was built in 1790 and is listed on the National Register of Historic Places. The borough also has several parks and recreational areas, including the Barclay Park, which offers a variety of outdoor activities.
Conclusion
Barclay is a small borough located in Camden County, New Jersey. It is situated on the Delaware River, just south of Philadelphia. The borough was incorporated in 1894 and has a population of approximately 1,400 people. The borough has a humid subtropical climate, with hot, humid summers and cold, wet winters. The primary industries are agriculture and tourism. The borough is home to several small farms, which produce a variety of fruits and vegetables. The borough also has several small businesses, including restaurants, retail stores, and professional services. The borough is also home to several historic sites, including the Barclay Mansion, which was built in 1790 and is listed on the National Register of Historic Places. The borough also has several parks and recreational areas, including the Barclay Park, which offers a variety of outdoor activities.
Common Questions
What is Per Capita Income in Barclay?
Per Capita income in Barclay is $70,040.
What is the Median Family Income in Barclay?
Median Family Income in Barclay is $175,600.
What is the Median Household income in Barclay?
Median Household Income in Barclay is $156,696.
What is Income or Wage Gap in Barclay?
Income or Wage Gap in Barclay is 61.4%.
Women in Barclay earn 38.6 cents for every dollar earned by a man.
What is Inequality or Gini Index in Barclay?
Inequality or Gini Index in Barclay is 0.40.
What is the Total Population of Barclay?
Total Population of Barclay is 4,504.
What is the Total Male Population of Barclay?
Total Male Population of Barclay is 2,085.
What is the Total Female Population of Barclay?
Total Female Population of Barclay is 2,419.
What is the Ratio of Males per 100 Females in Barclay?
There are 86.19 Males per 100 Females in Barclay.
What is the Ratio of Females per 100 Males in Barclay?
There are 116.02 Females per 100 Males in Barclay.
What is the Median Population Age in Barclay?
Median Population Age in Barclay is 44.1 Years.
What is the Average Family Size in Barclay
Average Family Size in Barclay is 3.2 People.
What is the Average Household Size in Barclay
Average Household Size in Barclay is 2.8 People.
How Large is the Labor Force in Barclay?
There are 2,370 People in the Labor Forcein in Barclay.
What is the Percentage of People in the Labor Force in Barclay?
66.6% of People are in the Labor Force in Barclay.
What is the Unemployment Rate in Barclay?
Unemployment Rate in Barclay is 3.4%.