North Beach Haven, NJ Map & Demographics
North Beach Haven Map
North Beach Haven Overview
$79,255
PER CAPITA INCOME
$126,161
AVG FAMILY INCOME
$104,183
AVG HOUSEHOLD INCOME
41.3%
WAGE / INCOME GAP [ % ]
58.7¢/ $1
WAGE / INCOME GAP [ $ ]
0.50
INEQUALITY / GINI INDEX
2,250
TOTAL POPULATION
1,168
MALE POPULATION
1,082
FEMALE POPULATION
107.95
MALES / 100 FEMALES
92.64
FEMALES / 100 MALES
59.0
MEDIAN AGE
2.7
AVG FAMILY SIZE
2.0
AVG HOUSEHOLD SIZE
1,089
LABOR FORCE [ PEOPLE ]
53.0%
PERCENT IN LABOR FORCE
10.7%
UNEMPLOYMENT RATE
Income in North Beach Haven
Income Overview in North Beach Haven
Per Capita Income in North Beach Haven is $79,255, while median incomes of families and households are $126,161 and $104,183 respectively.
| Characteristic | Number | Measure |
| Per Capita Income | 2,250 | $79,255 |
| Median Family Income | 673 | $126,161 |
| Mean Family Income | 673 | $188,247 |
| Median Household Income | 1,096 | $104,183 |
| Mean Household Income | 1,096 | $159,136 |
| Income Deficit | 673 | $0 |
| Wage / Income Gap (%) | 2,250 | 41.30% |
| Wage / Income Gap ($) | 2,250 | 58.70¢ per $1 |
| Gini / Inequality Index | 2,250 | 0.50 |
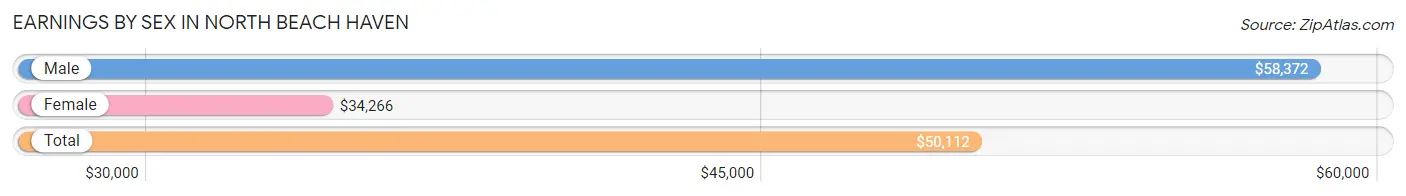
Earnings by Sex in North Beach Haven
Average Earnings in North Beach Haven are $50,112, $58,372 for men and $34,266 for women, a difference of 41.3%.
| Sex | Number | Average Earnings |
| Male | 646 (57.1%) | $58,372 |
| Female | 485 (42.9%) | $34,266 |
| Total | 1,131 (100.0%) | $50,112 |
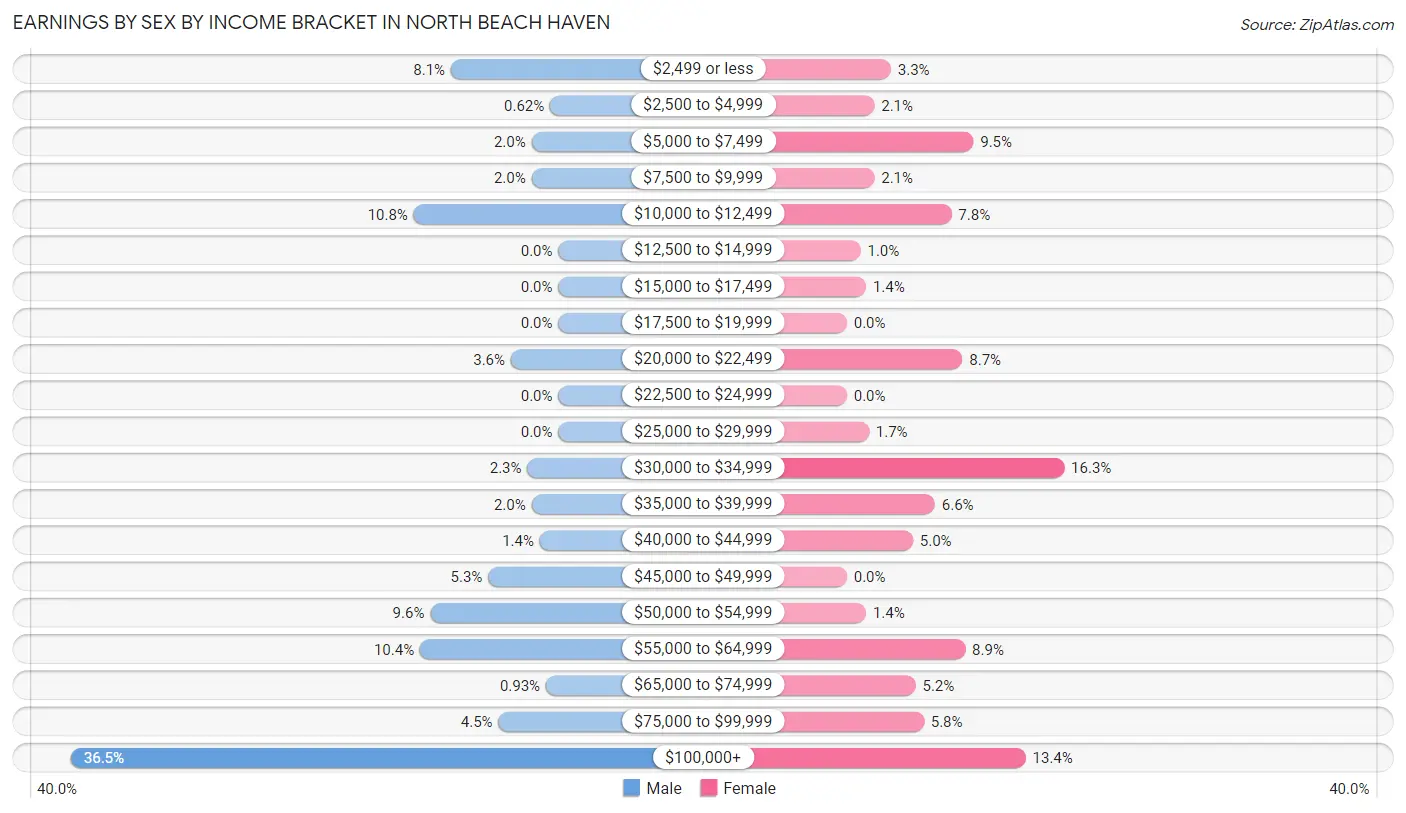
Earnings by Sex by Income Bracket in North Beach Haven
The most common earnings brackets in North Beach Haven are $100,000+ for men (236 | 36.5%) and $30,000 to $34,999 for women (79 | 16.3%).
| Income | Male | Female |
| $2,499 or less | 52 (8.1%) | 16 (3.3%) |
| $2,500 to $4,999 | 4 (0.6%) | 10 (2.1%) |
| $5,000 to $7,499 | 13 (2.0%) | 46 (9.5%) |
| $7,500 to $9,999 | 13 (2.0%) | 10 (2.1%) |
| $10,000 to $12,499 | 70 (10.8%) | 38 (7.8%) |
| $12,500 to $14,999 | 0 (0.0%) | 5 (1.0%) |
| $15,000 to $17,499 | 0 (0.0%) | 7 (1.4%) |
| $17,500 to $19,999 | 0 (0.0%) | 0 (0.0%) |
| $20,000 to $22,499 | 23 (3.6%) | 42 (8.7%) |
| $22,500 to $24,999 | 0 (0.0%) | 0 (0.0%) |
| $25,000 to $29,999 | 0 (0.0%) | 8 (1.7%) |
| $30,000 to $34,999 | 15 (2.3%) | 79 (16.3%) |
| $35,000 to $39,999 | 13 (2.0%) | 32 (6.6%) |
| $40,000 to $44,999 | 9 (1.4%) | 24 (5.0%) |
| $45,000 to $49,999 | 34 (5.3%) | 0 (0.0%) |
| $50,000 to $54,999 | 62 (9.6%) | 7 (1.4%) |
| $55,000 to $64,999 | 67 (10.4%) | 43 (8.9%) |
| $65,000 to $74,999 | 6 (0.9%) | 25 (5.1%) |
| $75,000 to $99,999 | 29 (4.5%) | 28 (5.8%) |
| $100,000+ | 236 (36.5%) | 65 (13.4%) |
| Total | 646 (100.0%) | 485 (100.0%) |
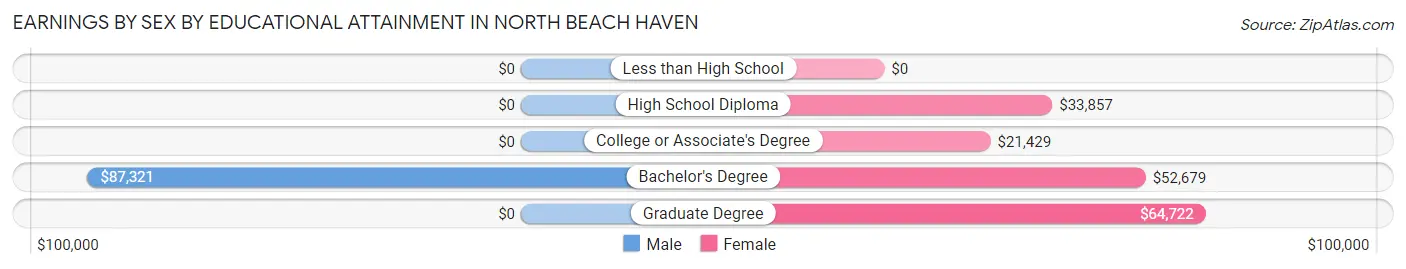
Earnings by Sex by Educational Attainment in North Beach Haven
Average earnings in North Beach Haven are $61,719 for men and $34,901 for women, a difference of 43.4%. Men with an educational attainment of bachelor's degree enjoy the highest average annual earnings of $87,321, while those with bachelor's degree education earn the least with $87,321. Women with an educational attainment of graduate degree earn the most with the average annual earnings of $64,722, while those with college or associate's degree education have the smallest earnings of $21,429.
| Educational Attainment | Male Income | Female Income |
| Less than High School | - | - |
| High School Diploma | - | - |
| College or Associate's Degree | - | - |
| Bachelor's Degree | $87,321 | $52,679 |
| Graduate Degree | - | - |
| Total | $61,719 | $34,901 |
Family Income in North Beach Haven
Family Income Brackets in North Beach Haven
According to the North Beach Haven family income data, there are 206 families falling into the $200,000+ income range, which is the most common income bracket and makes up 30.6% of all families.
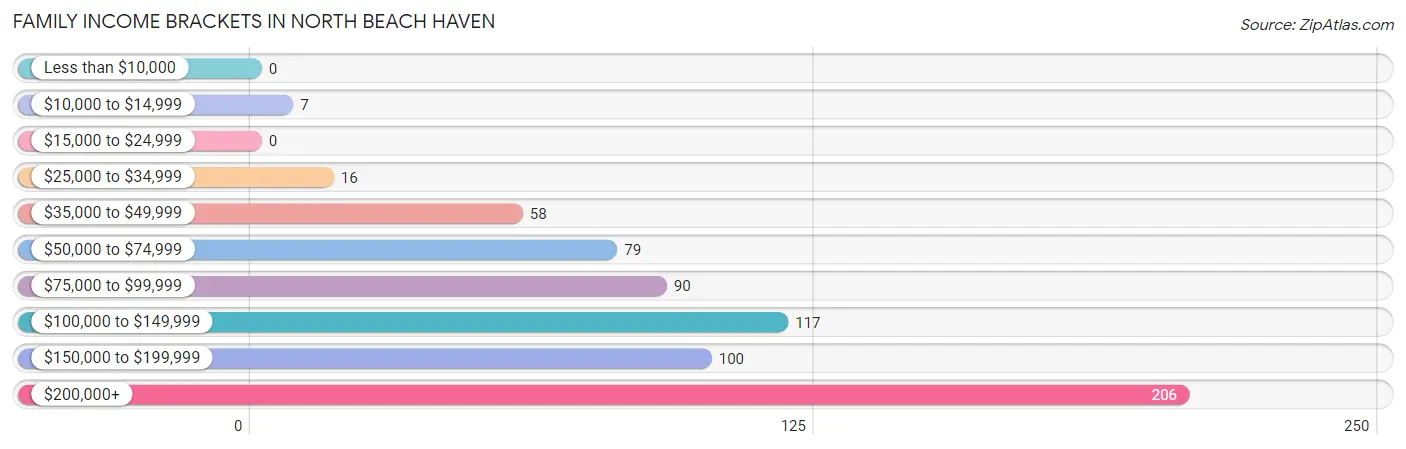
| Income Bracket | # Families | % Families |
| Less than $10,000 | 0 | 0.0% |
| $10,000 to $14,999 | 7 | 1.0% |
| $15,000 to $24,999 | 0 | 0.0% |
| $25,000 to $34,999 | 16 | 2.4% |
| $35,000 to $49,999 | 58 | 8.6% |
| $50,000 to $74,999 | 79 | 11.7% |
| $75,000 to $99,999 | 90 | 13.4% |
| $100,000 to $149,999 | 117 | 17.4% |
| $150,000 to $199,999 | 100 | 14.9% |
| $200,000+ | 206 | 30.6% |
Family Income by Famaliy Size in North Beach Haven
6-person families (21 | 3.1%) account for the highest median family income in North Beach Haven with $188,281 per family, while 2-person families (462 | 68.6%) have the highest median income of $57,361 per family member.
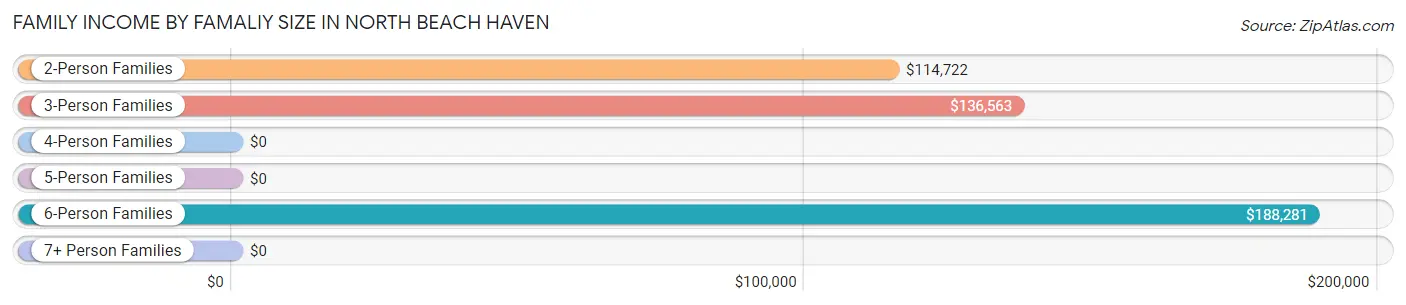
| Income Bracket | # Families | Median Income |
| 2-Person Families | 462 (68.6%) | $114,722 |
| 3-Person Families | 138 (20.5%) | $136,563 |
| 4-Person Families | 38 (5.7%) | $0 |
| 5-Person Families | 14 (2.1%) | $0 |
| 6-Person Families | 21 (3.1%) | $188,281 |
| 7+ Person Families | 0 (0.0%) | $0 |
| Total | 673 (100.0%) | $126,161 |
Family Income by Number of Earners in North Beach Haven
The median family income in North Beach Haven is $126,161, with families comprising 2 earners (243) having the highest median family income of $213,750, while families with no earners (188) have the lowest median family income of $108,214, accounting for 36.1% and 27.9% of families, respectively.
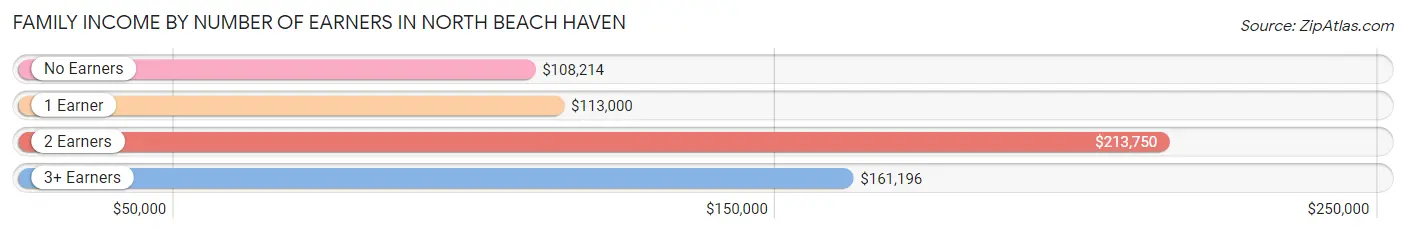
| Number of Earners | # Families | Median Income |
| No Earners | 188 (27.9%) | $108,214 |
| 1 Earner | 194 (28.8%) | $113,000 |
| 2 Earners | 243 (36.1%) | $213,750 |
| 3+ Earners | 48 (7.1%) | $161,196 |
| Total | 673 (100.0%) | $126,161 |
Household Income in North Beach Haven
Household Income Brackets in North Beach Haven
With 246 households falling in the category, the $100,000 to $149,999 income range is the most frequent in North Beach Haven, accounting for 22.5% of all households. In contrast, only 14 households (1.3%) fall into the less than $10,000 income bracket, making it the least populous group.
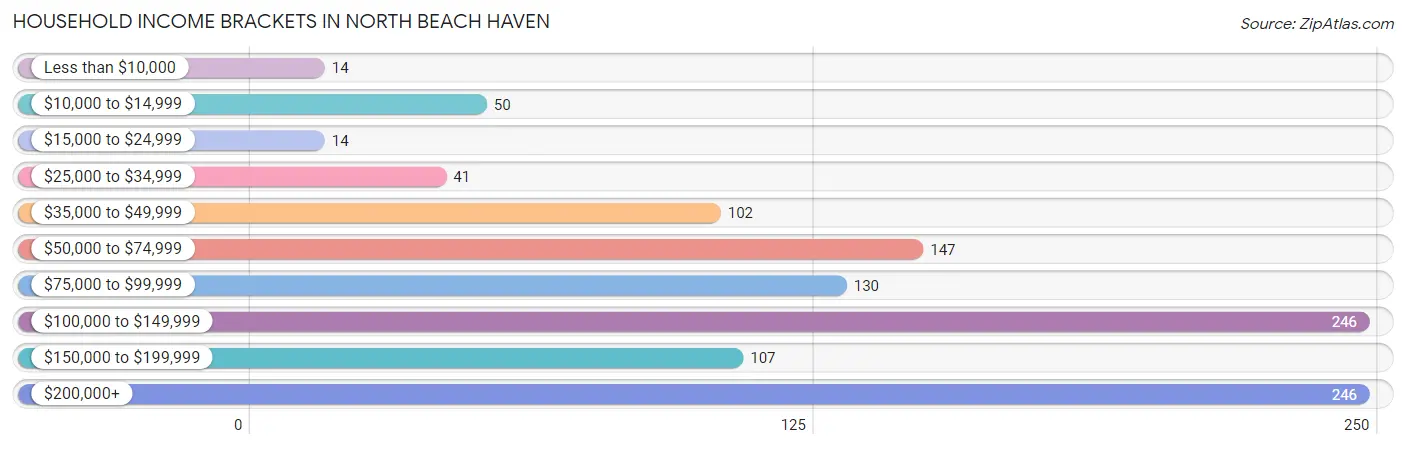
| Income Bracket | # Households | % Households |
| Less than $10,000 | 14 | 1.3% |
| $10,000 to $14,999 | 50 | 4.6% |
| $15,000 to $24,999 | 14 | 1.3% |
| $25,000 to $34,999 | 41 | 3.7% |
| $35,000 to $49,999 | 102 | 9.3% |
| $50,000 to $74,999 | 147 | 13.4% |
| $75,000 to $99,999 | 130 | 11.9% |
| $100,000 to $149,999 | 246 | 22.4% |
| $150,000 to $199,999 | 107 | 9.8% |
| $200,000+ | 246 | 22.4% |
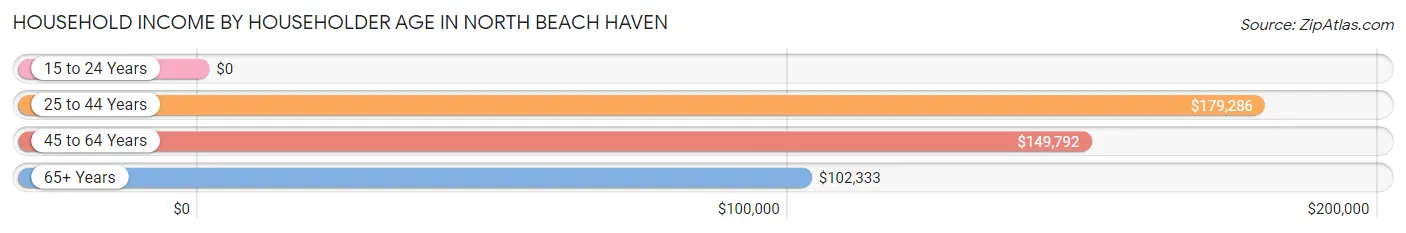
Household Income by Householder Age in North Beach Haven
The median household income in North Beach Haven is $104,183, with the highest median household income of $179,286 found in the 25 to 44 years age bracket for the primary householder. A total of 92 households (8.4%) fall into this category. Meanwhile, the 15 to 24 years age bracket for the primary householder has the lowest median household income of $0, with 37 households (3.4%) in this group.
| Income Bracket | # Households | Median Income |
| 15 to 24 Years | 37 (3.4%) | $0 |
| 25 to 44 Years | 92 (8.4%) | $179,286 |
| 45 to 64 Years | 373 (34.0%) | $149,792 |
| 65+ Years | 594 (54.2%) | $102,333 |
| Total | 1,096 (100.0%) | $104,183 |
Poverty in North Beach Haven
Income Below Poverty by Sex and Age in North Beach Haven
With 3.8% poverty level for males and 3.1% for females among the residents of North Beach Haven, 18 to 24 year old males and 65 to 74 year old females are the most vulnerable to poverty, with 37 males (45.1%) and 19 females (5.5%) in their respective age groups living below the poverty level.
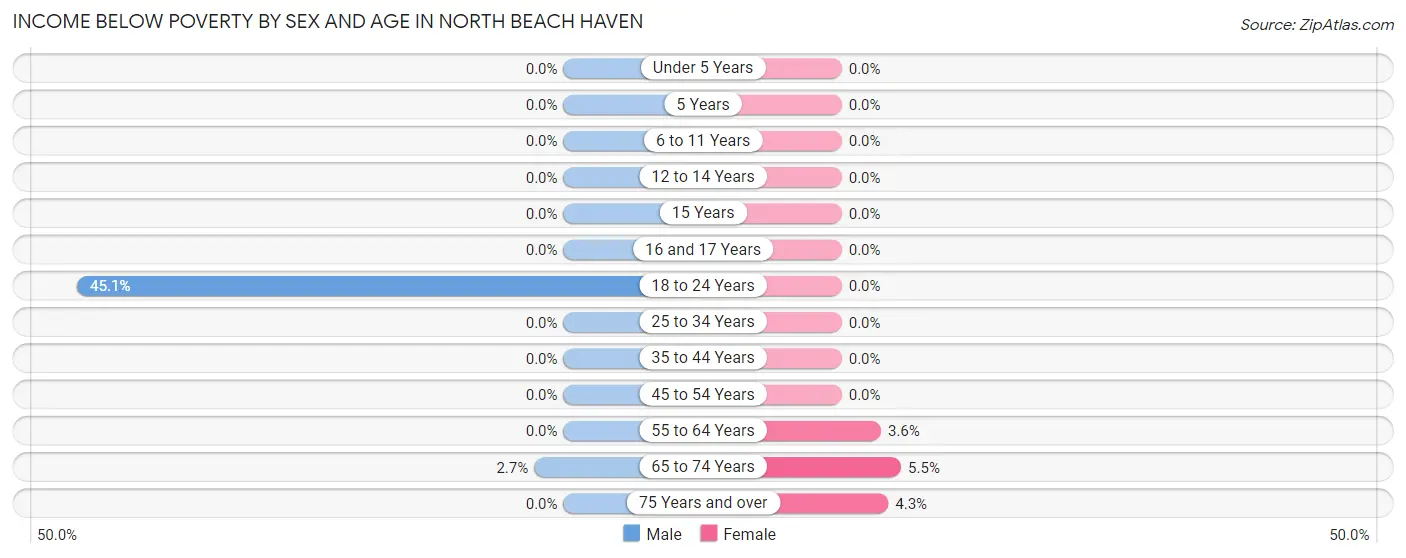
| Age Bracket | Male | Female |
| Under 5 Years | 0 (0.0%) | 0 (0.0%) |
| 5 Years | 0 (0.0%) | 0 (0.0%) |
| 6 to 11 Years | 0 (0.0%) | 0 (0.0%) |
| 12 to 14 Years | 0 (0.0%) | 0 (0.0%) |
| 15 Years | 0 (0.0%) | 0 (0.0%) |
| 16 and 17 Years | 0 (0.0%) | 0 (0.0%) |
| 18 to 24 Years | 37 (45.1%) | 0 (0.0%) |
| 25 to 34 Years | 0 (0.0%) | 0 (0.0%) |
| 35 to 44 Years | 0 (0.0%) | 0 (0.0%) |
| 45 to 54 Years | 0 (0.0%) | 0 (0.0%) |
| 55 to 64 Years | 0 (0.0%) | 8 (3.6%) |
| 65 to 74 Years | 7 (2.7%) | 19 (5.5%) |
| 75 Years and over | 0 (0.0%) | 7 (4.3%) |
| Total | 44 (3.8%) | 34 (3.1%) |
Income Above Poverty by Sex and Age in North Beach Haven
According to the poverty statistics in North Beach Haven, males aged under 5 years and females aged 12 to 14 years are the age groups that are most secure financially, with 100.0% of males and 100.0% of females in these age groups living above the poverty line.
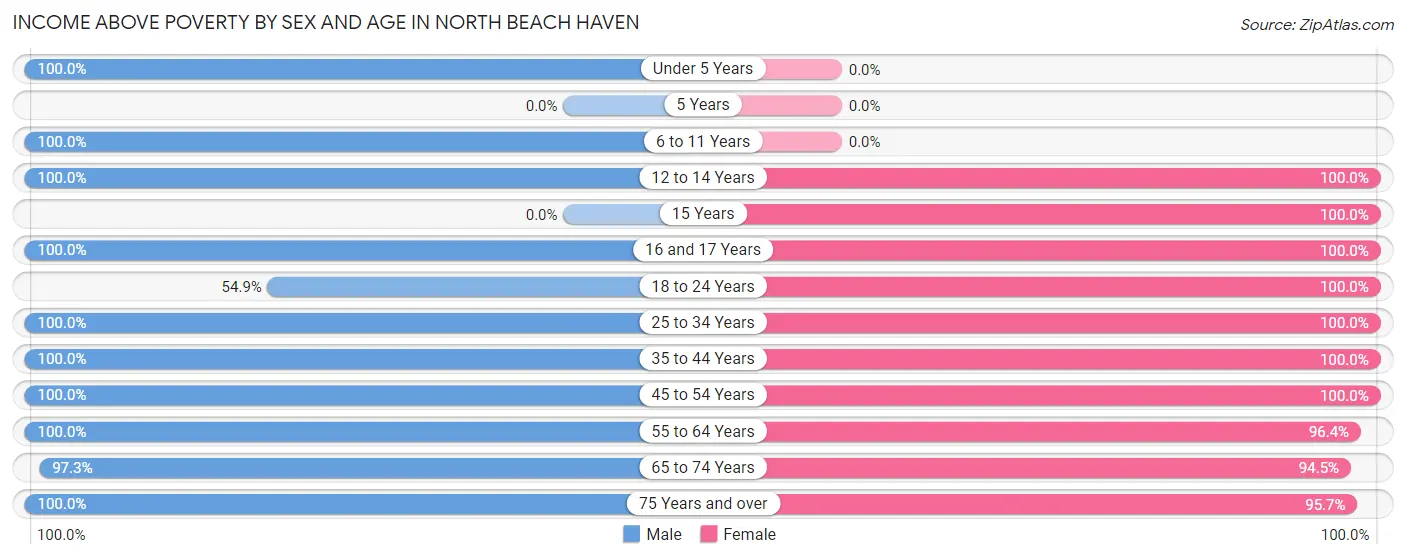
| Age Bracket | Male | Female |
| Under 5 Years | 81 (100.0%) | 0 (0.0%) |
| 5 Years | 0 (0.0%) | 0 (0.0%) |
| 6 to 11 Years | 66 (100.0%) | 0 (0.0%) |
| 12 to 14 Years | 15 (100.0%) | 29 (100.0%) |
| 15 Years | 0 (0.0%) | 4 (100.0%) |
| 16 and 17 Years | 7 (100.0%) | 32 (100.0%) |
| 18 to 24 Years | 45 (54.9%) | 32 (100.0%) |
| 25 to 34 Years | 41 (100.0%) | 117 (100.0%) |
| 35 to 44 Years | 91 (100.0%) | 37 (100.0%) |
| 45 to 54 Years | 152 (100.0%) | 104 (100.0%) |
| 55 to 64 Years | 221 (100.0%) | 212 (96.4%) |
| 65 to 74 Years | 250 (97.3%) | 326 (94.5%) |
| 75 Years and over | 155 (100.0%) | 155 (95.7%) |
| Total | 1,124 (96.2%) | 1,048 (96.9%) |
Income Below Poverty Among Married-Couple Families in North Beach Haven
The poverty statistics for married-couple families in North Beach Haven show that 1.1% or 7 of the total 608 families live below the poverty line. Families with no children have the highest poverty rate of 1.4%, comprising of 7 families. On the other hand, families with 1 or 2 children have the lowest poverty rate of 0.0%, which includes 0 families.
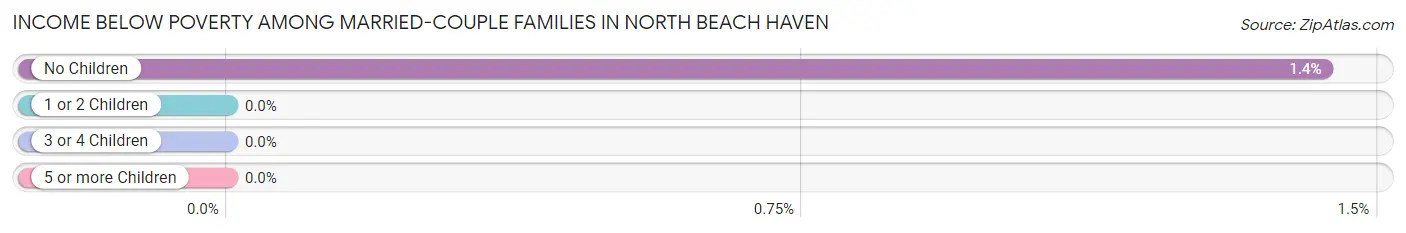
| Children | Above Poverty | Below Poverty |
| No Children | 483 (98.6%) | 7 (1.4%) |
| 1 or 2 Children | 102 (100.0%) | 0 (0.0%) |
| 3 or 4 Children | 16 (100.0%) | 0 (0.0%) |
| 5 or more Children | 0 (0.0%) | 0 (0.0%) |
| Total | 601 (98.9%) | 7 (1.1%) |
Income Below Poverty Among Single-Parent Households in North Beach Haven
| Children | Single Father | Single Mother |
| No Children | 0 (0.0%) | 0 (0.0%) |
| 1 or 2 Children | 0 (0.0%) | 0 (0.0%) |
| 3 or 4 Children | 0 (0.0%) | 0 (0.0%) |
| 5 or more Children | 0 (0.0%) | 0 (0.0%) |
| Total | 0 (0.0%) | 0 (0.0%) |
Income Below Poverty Among Married-Couple vs Single-Parent Households in North Beach Haven
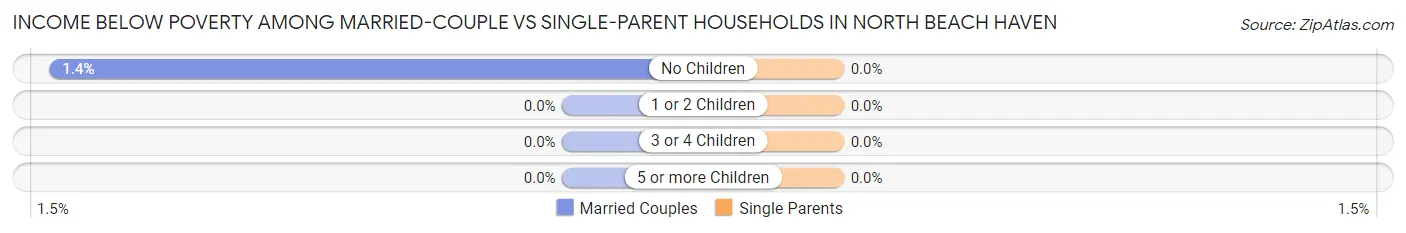
| Children | Married-Couple Families | Single-Parent Households |
| No Children | 7 (1.4%) | 0 (0.0%) |
| 1 or 2 Children | 0 (0.0%) | 0 (0.0%) |
| 3 or 4 Children | 0 (0.0%) | 0 (0.0%) |
| 5 or more Children | 0 (0.0%) | 0 (0.0%) |
| Total | 7 (1.1%) | 0 (0.0%) |
Race in North Beach Haven
The most populous races in North Beach Haven are White / Caucasian (2,028 | 90.1%), Two or more Races (118 | 5.2%), and Asian (73 | 3.2%).
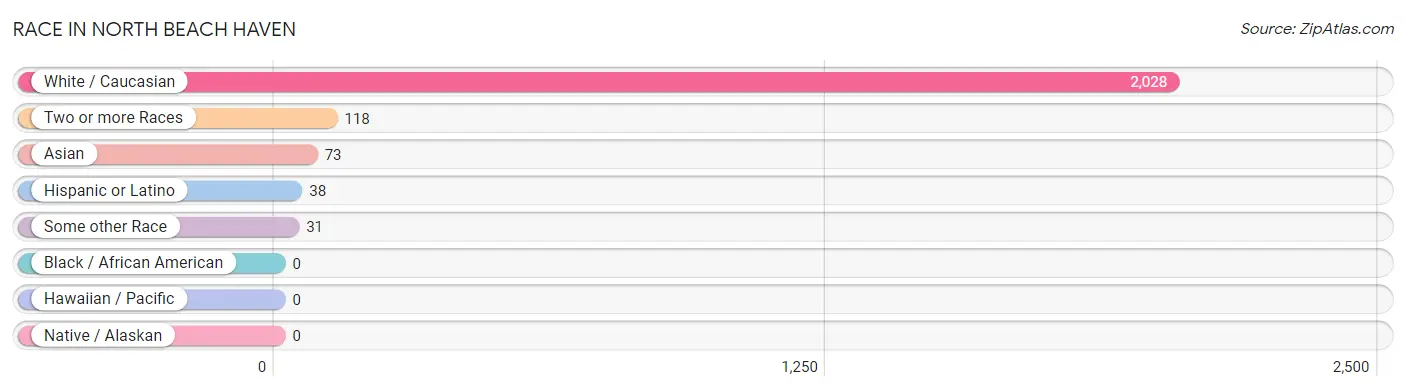
| Race | # Population | % Population |
| Asian | 73 | 3.2% |
| Black / African American | 0 | 0.0% |
| Hawaiian / Pacific | 0 | 0.0% |
| Hispanic or Latino | 38 | 1.7% |
| Native / Alaskan | 0 | 0.0% |
| White / Caucasian | 2,028 | 90.1% |
| Two or more Races | 118 | 5.2% |
| Some other Race | 31 | 1.4% |
| Total | 2,250 | 100.0% |
Ancestry in North Beach Haven
The most populous ancestries reported in North Beach Haven are Italian (491 | 21.8%), German (440 | 19.6%), English (267 | 11.9%), Irish (261 | 11.6%), and Scottish (122 | 5.4%), together accounting for 70.3% of all North Beach Haven residents.
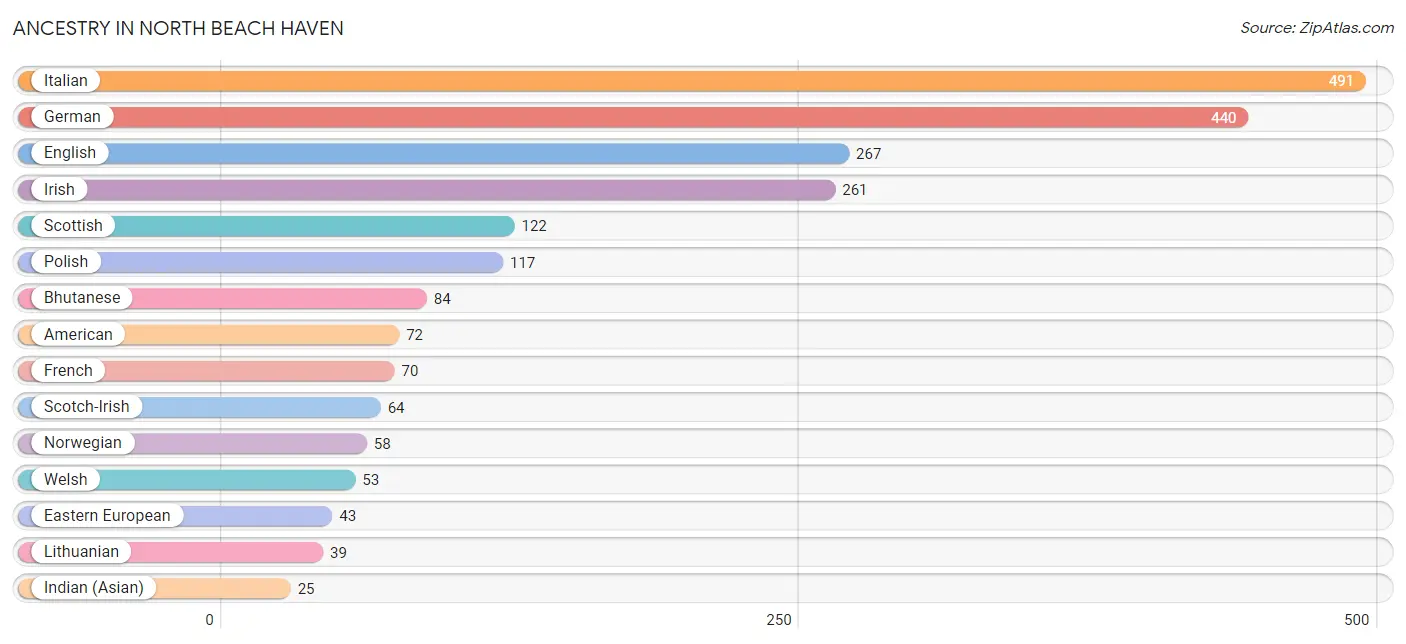
| Ancestry | # Population | % Population |
| American | 72 | 3.2% |
| Armenian | 13 | 0.6% |
| Bhutanese | 84 | 3.7% |
| Colombian | 7 | 0.3% |
| Czech | 13 | 0.6% |
| Czechoslovakian | 7 | 0.3% |
| Danish | 12 | 0.5% |
| Dominican | 7 | 0.3% |
| Dutch | 15 | 0.7% |
| Eastern European | 43 | 1.9% |
| English | 267 | 11.9% |
| European | 13 | 0.6% |
| French | 70 | 3.1% |
| German | 440 | 19.6% |
| Greek | 24 | 1.1% |
| Guamanian / Chamorro | 6 | 0.3% |
| Indian (Asian) | 25 | 1.1% |
| Irish | 261 | 11.6% |
| Italian | 491 | 21.8% |
| Korean | 9 | 0.4% |
| Lithuanian | 39 | 1.7% |
| Northern European | 10 | 0.4% |
| Norwegian | 58 | 2.6% |
| Polish | 117 | 5.2% |
| Portuguese | 24 | 1.1% |
| Russian | 20 | 0.9% |
| Scotch-Irish | 64 | 2.8% |
| Scottish | 122 | 5.4% |
| South American | 7 | 0.3% |
| Sri Lankan | 22 | 1.0% |
| Swiss | 11 | 0.5% |
| Thai | 22 | 1.0% |
| Welsh | 53 | 2.4% | View All 33 Rows |
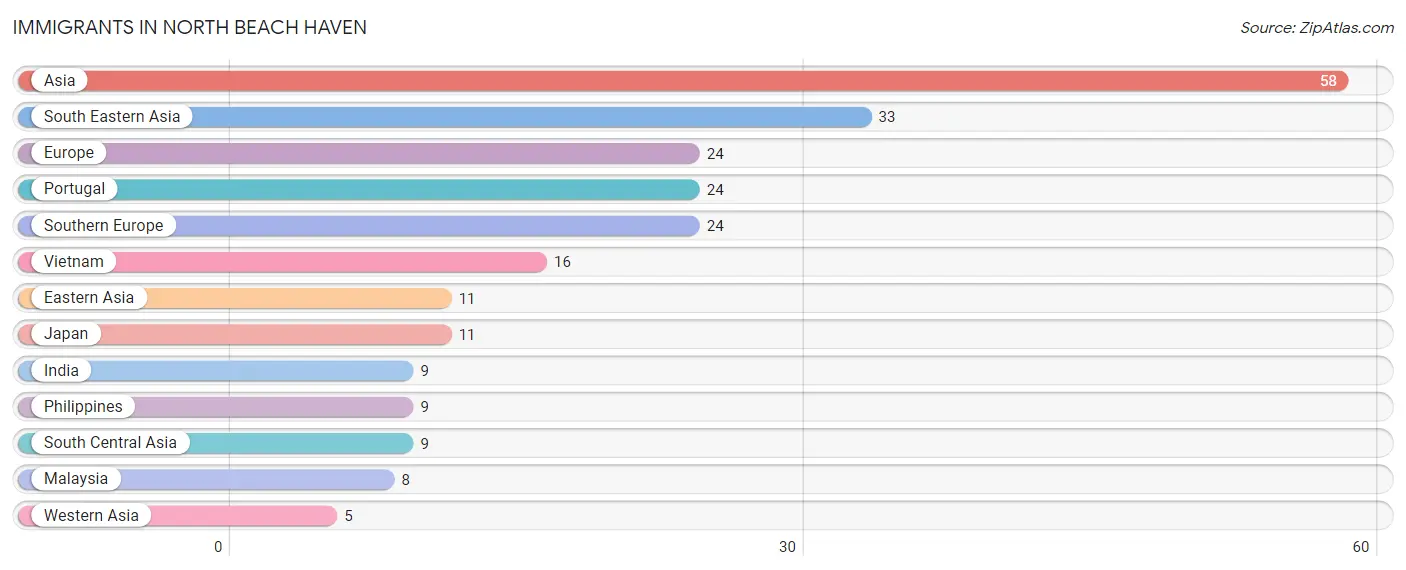
Immigrants in North Beach Haven
The most numerous immigrant groups reported in North Beach Haven came from Asia (58 | 2.6%), South Eastern Asia (33 | 1.5%), Europe (24 | 1.1%), Portugal (24 | 1.1%), and Southern Europe (24 | 1.1%), together accounting for 7.3% of all North Beach Haven residents.
| Immigration Origin | # Population | % Population |
| Asia | 58 | 2.6% |
| Eastern Asia | 11 | 0.5% |
| Europe | 24 | 1.1% |
| India | 9 | 0.4% |
| Japan | 11 | 0.5% |
| Malaysia | 8 | 0.4% |
| Philippines | 9 | 0.4% |
| Portugal | 24 | 1.1% |
| South Central Asia | 9 | 0.4% |
| South Eastern Asia | 33 | 1.5% |
| Southern Europe | 24 | 1.1% |
| Vietnam | 16 | 0.7% |
| Western Asia | 5 | 0.2% | View All 13 Rows |
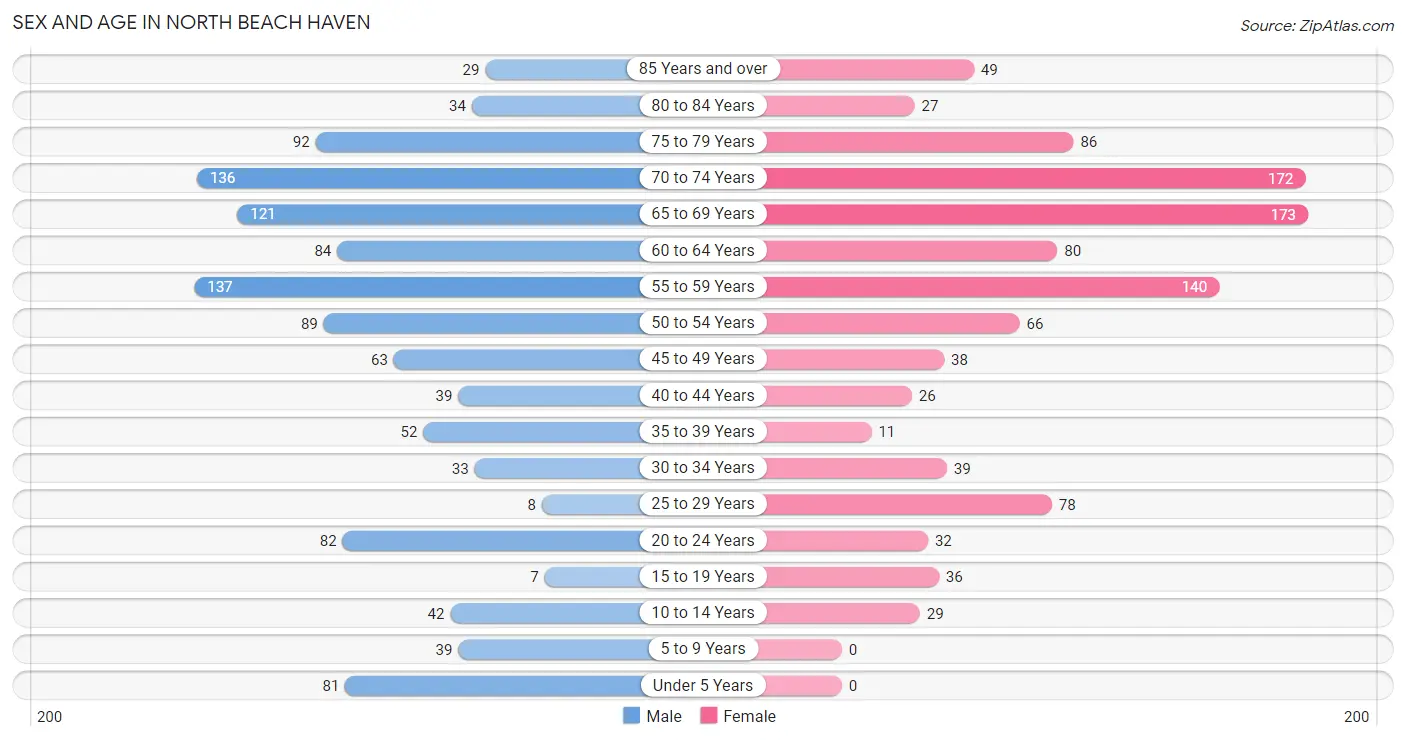
Sex and Age in North Beach Haven
Sex and Age in North Beach Haven
The most populous age groups in North Beach Haven are 55 to 59 Years (137 | 11.7%) for men and 65 to 69 Years (173 | 16.0%) for women.
| Age Bracket | Male | Female |
| Under 5 Years | 81 (6.9%) | 0 (0.0%) |
| 5 to 9 Years | 39 (3.3%) | 0 (0.0%) |
| 10 to 14 Years | 42 (3.6%) | 29 (2.7%) |
| 15 to 19 Years | 7 (0.6%) | 36 (3.3%) |
| 20 to 24 Years | 82 (7.0%) | 32 (3.0%) |
| 25 to 29 Years | 8 (0.7%) | 78 (7.2%) |
| 30 to 34 Years | 33 (2.8%) | 39 (3.6%) |
| 35 to 39 Years | 52 (4.4%) | 11 (1.0%) |
| 40 to 44 Years | 39 (3.3%) | 26 (2.4%) |
| 45 to 49 Years | 63 (5.4%) | 38 (3.5%) |
| 50 to 54 Years | 89 (7.6%) | 66 (6.1%) |
| 55 to 59 Years | 137 (11.7%) | 140 (12.9%) |
| 60 to 64 Years | 84 (7.2%) | 80 (7.4%) |
| 65 to 69 Years | 121 (10.4%) | 173 (16.0%) |
| 70 to 74 Years | 136 (11.6%) | 172 (15.9%) |
| 75 to 79 Years | 92 (7.9%) | 86 (8.0%) |
| 80 to 84 Years | 34 (2.9%) | 27 (2.5%) |
| 85 Years and over | 29 (2.5%) | 49 (4.5%) |
| Total | 1,168 (100.0%) | 1,082 (100.0%) |
Families and Households in North Beach Haven
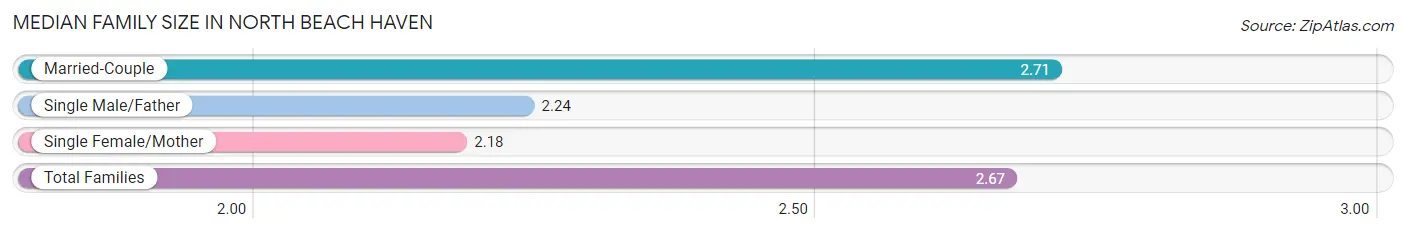
Median Family Size in North Beach Haven
The median family size in North Beach Haven is 2.67 persons per family, with married-couple families (608 | 90.3%) accounting for the largest median family size of 2.71 persons per family. On the other hand, single female/mother families (11 | 1.6%) represent the smallest median family size with 2.18 persons per family.
| Family Type | # Families | Family Size |
| Married-Couple | 608 (90.3%) | 2.71 |
| Single Male/Father | 54 (8.0%) | 2.24 |
| Single Female/Mother | 11 (1.6%) | 2.18 |
| Total Families | 673 (100.0%) | 2.67 |
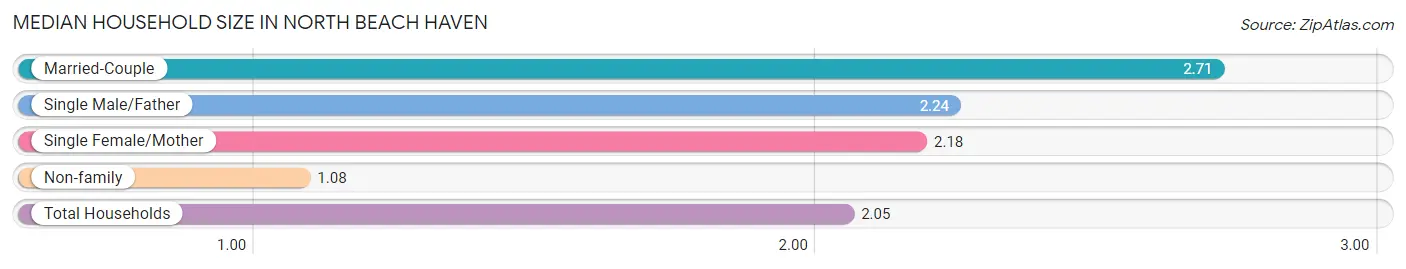
Median Household Size in North Beach Haven
The median household size in North Beach Haven is 2.05 persons per household, with married-couple households (608 | 55.5%) accounting for the largest median household size of 2.71 persons per household. non-family households (423 | 38.6%) represent the smallest median household size with 1.08 persons per household.
| Household Type | # Households | Household Size |
| Married-Couple | 608 (55.5%) | 2.71 |
| Single Male/Father | 54 (4.9%) | 2.24 |
| Single Female/Mother | 11 (1.0%) | 2.18 |
| Non-family | 423 (38.6%) | 1.08 |
| Total Households | 1,096 (100.0%) | 2.05 |
Household Size by Marriage Status in North Beach Haven
Out of a total of 1,096 households in North Beach Haven, 673 (61.4%) are family households, while 423 (38.6%) are nonfamily households. The most numerous type of family households are 2-person households, comprising 462, and the most common type of nonfamily households are 1-person households, comprising 388.
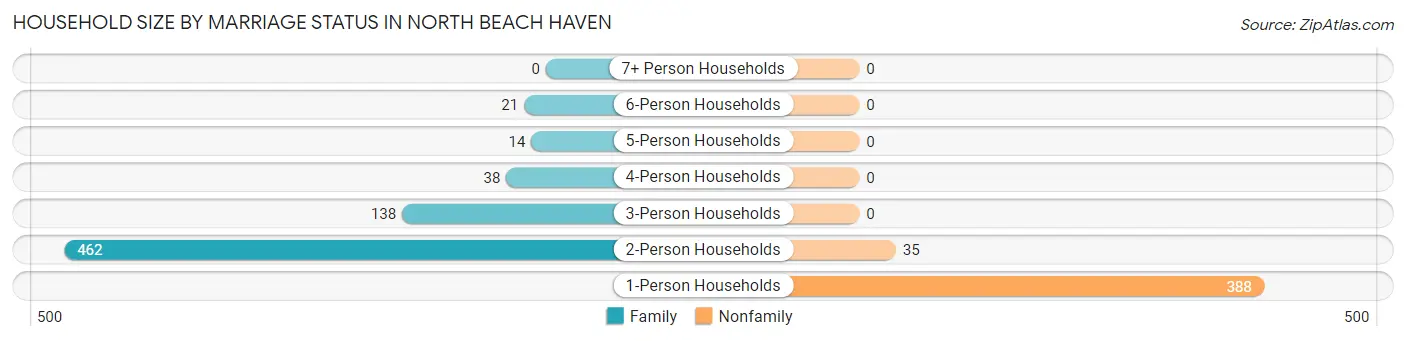
| Household Size | Family Households | Nonfamily Households |
| 1-Person Households | - | 388 (35.4%) |
| 2-Person Households | 462 (42.1%) | 35 (3.2%) |
| 3-Person Households | 138 (12.6%) | 0 (0.0%) |
| 4-Person Households | 38 (3.5%) | 0 (0.0%) |
| 5-Person Households | 14 (1.3%) | 0 (0.0%) |
| 6-Person Households | 21 (1.9%) | 0 (0.0%) |
| 7+ Person Households | 0 (0.0%) | 0 (0.0%) |
| Total | 673 (61.4%) | 423 (38.6%) |
Female Fertility in North Beach Haven
Fertility by Age in North Beach Haven
Average fertility rate in North Beach Haven is 42.0 births per 1,000 women. Women in the age bracket of 35 to 50 years have the highest fertility rate with 138.0 births per 1,000 women. Women in the age bracket of 35 to 50 years acount for 100.0% of all women with births.
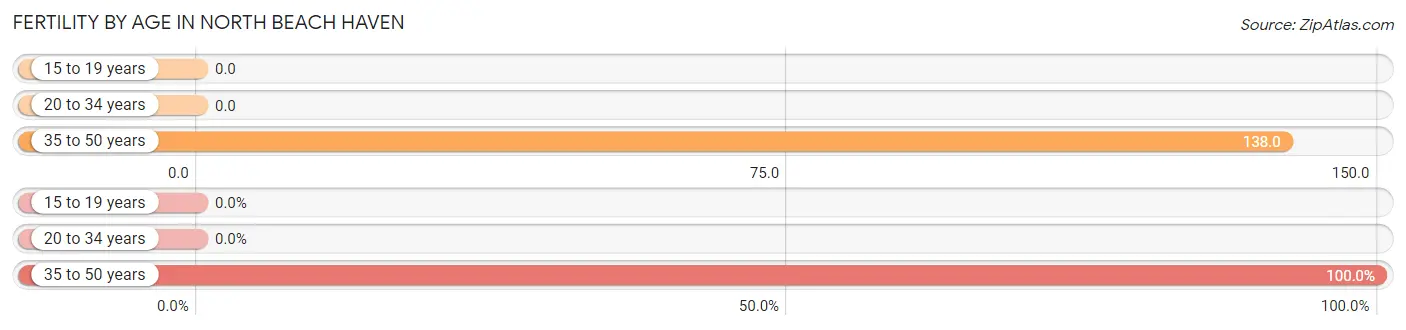
| Age Bracket | Women with Births | Births / 1,000 Women |
| 15 to 19 years | 0 (0.0%) | 0.0 |
| 20 to 34 years | 0 (0.0%) | 0.0 |
| 35 to 50 years | 11 (100.0%) | 138.0 |
| Total | 11 (100.0%) | 42.0 |
Fertility by Age by Marriage Status in North Beach Haven
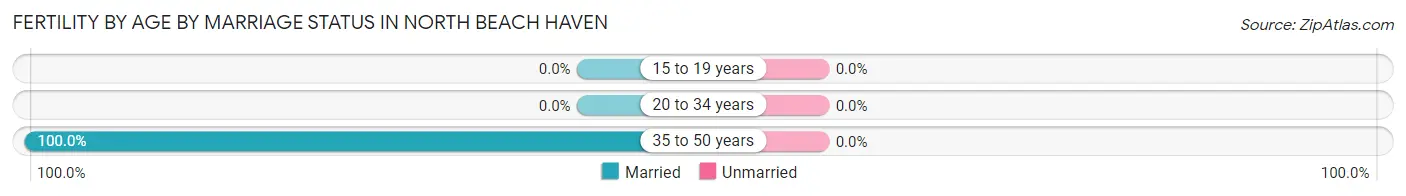
| Age Bracket | Married | Unmarried |
| 15 to 19 years | 0 (0.0%) | 0 (0.0%) |
| 20 to 34 years | 0 (0.0%) | 0 (0.0%) |
| 35 to 50 years | 11 (100.0%) | 0 (0.0%) |
| Total | 11 (100.0%) | 0 (0.0%) |
Fertility by Education in North Beach Haven
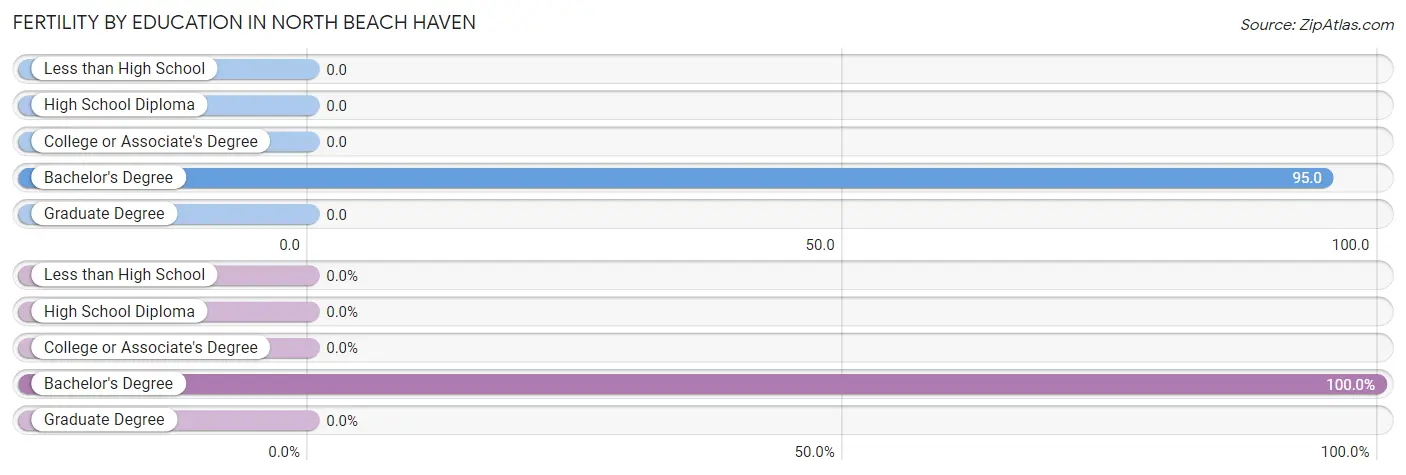
| Educational Attainment | Women with Births | Births / 1,000 Women |
| Less than High School | 0 (0.0%) | 0.0 |
| High School Diploma | 0 (0.0%) | 0.0 |
| College or Associate's Degree | 0 (0.0%) | 0.0 |
| Bachelor's Degree | 11 (100.0%) | 95.0 |
| Graduate Degree | 0 (0.0%) | 0.0 |
| Total | 11 (100.0%) | 42.0 |
Fertility by Education by Marriage Status in North Beach Haven
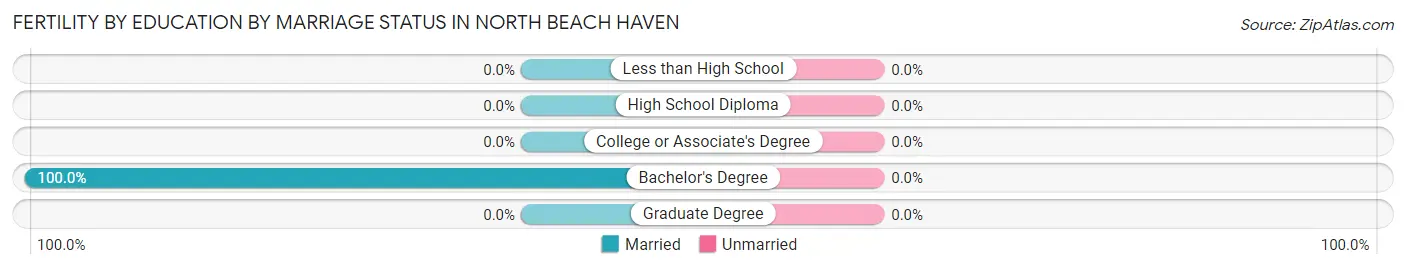
| Educational Attainment | Married | Unmarried |
| Less than High School | 0 (0.0%) | 0 (0.0%) |
| High School Diploma | 0 (0.0%) | 0 (0.0%) |
| College or Associate's Degree | 0 (0.0%) | 0 (0.0%) |
| Bachelor's Degree | 11 (100.0%) | 0 (0.0%) |
| Graduate Degree | 0 (0.0%) | 0 (0.0%) |
| Total | 11 (100.0%) | 0 (0.0%) |
Employment Characteristics in North Beach Haven
Employment by Class of Employer in North Beach Haven
Among the 931 employed individuals in North Beach Haven, private company employees (543 | 58.3%), local government employees (109 | 11.7%), and self-employed (incorporated) (102 | 11.0%) make up the most common classes of employment.
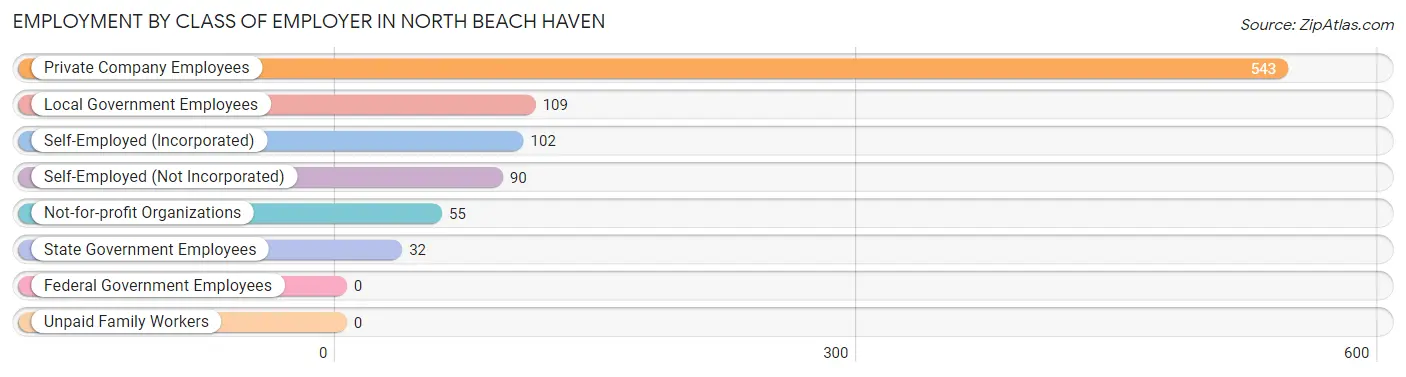
| Employer Class | # Employees | % Employees |
| Private Company Employees | 543 | 58.3% |
| Self-Employed (Incorporated) | 102 | 11.0% |
| Self-Employed (Not Incorporated) | 90 | 9.7% |
| Not-for-profit Organizations | 55 | 5.9% |
| Local Government Employees | 109 | 11.7% |
| State Government Employees | 32 | 3.4% |
| Federal Government Employees | 0 | 0.0% |
| Unpaid Family Workers | 0 | 0.0% |
| Total | 931 | 100.0% |
Employment Status by Age in North Beach Haven
According to the labor force statistics for North Beach Haven, out of the total population over 16 years of age (2,055), 53.0% or 1,089 individuals are in the labor force, with 10.7% or 117 of them unemployed. The age group with the highest labor force participation rate is 20 to 24 years, with 100.0% or 114 individuals in the labor force. Within the labor force, the 30 to 34 years age range has the highest percentage of unemployed individuals, with 24.6% or 16 of them being unemployed.
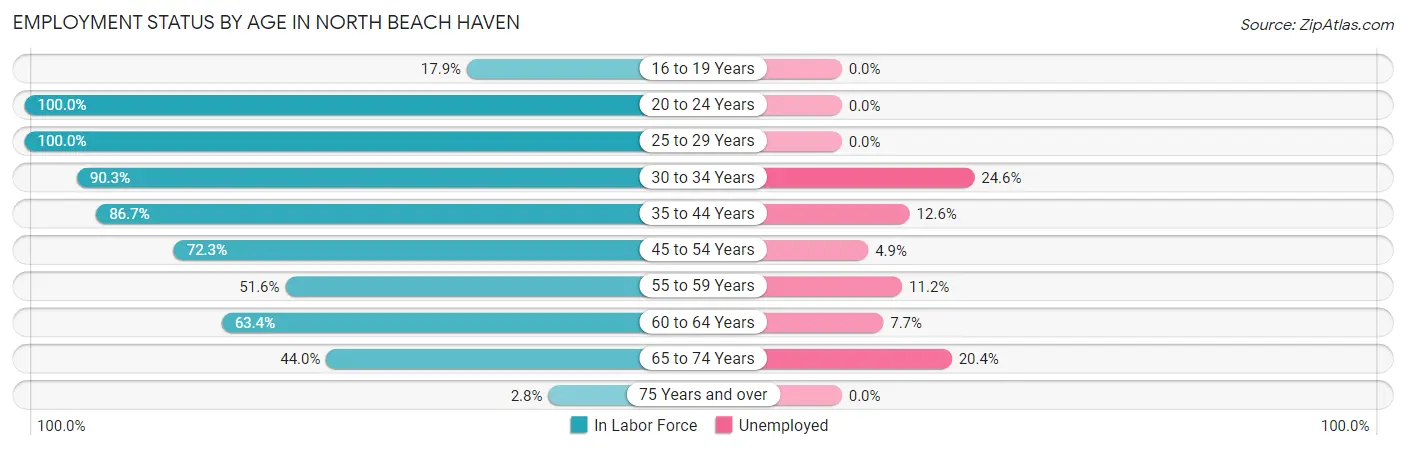
| Age Bracket | In Labor Force | Unemployed |
| 16 to 19 Years | 7 (17.9%) | 0 (0.0%) |
| 20 to 24 Years | 114 (100.0%) | 0 (0.0%) |
| 25 to 29 Years | 86 (100.0%) | 0 (0.0%) |
| 30 to 34 Years | 65 (90.3%) | 16 (24.6%) |
| 35 to 44 Years | 111 (86.7%) | 14 (12.6%) |
| 45 to 54 Years | 185 (72.3%) | 9 (4.9%) |
| 55 to 59 Years | 143 (51.6%) | 16 (11.2%) |
| 60 to 64 Years | 104 (63.4%) | 8 (7.7%) |
| 65 to 74 Years | 265 (44.0%) | 54 (20.4%) |
| 75 Years and over | 9 (2.8%) | 0 (0.0%) |
| Total | 1,089 (53.0%) | 117 (10.7%) |
Employment Status by Educational Attainment in North Beach Haven
According to labor force statistics for North Beach Haven, 70.6% of individuals (694) out of the total population between 25 and 64 years of age (983) are in the labor force, with 9.1% or 63 of them being unemployed. The group with the highest labor force participation rate are those with the educational attainment of college / associate degree, with 84.1% or 90 individuals in the labor force. Within the labor force, individuals with less than high school education have the highest percentage of unemployment, with 56.3% or 9 of them being unemployed.
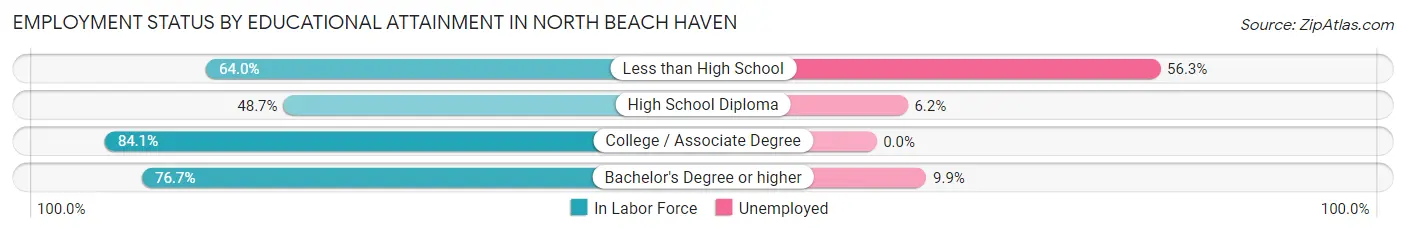
| Educational Attainment | In Labor Force | Unemployed |
| Less than High School | 16 (64.0%) | 14 (56.3%) |
| High School Diploma | 113 (48.7%) | 14 (6.2%) |
| College / Associate Degree | 90 (84.1%) | 0 (0.0%) |
| Bachelor's Degree or higher | 475 (76.7%) | 61 (9.9%) |
| Total | 694 (70.6%) | 89 (9.1%) |
Employment Occupations by Sex in North Beach Haven
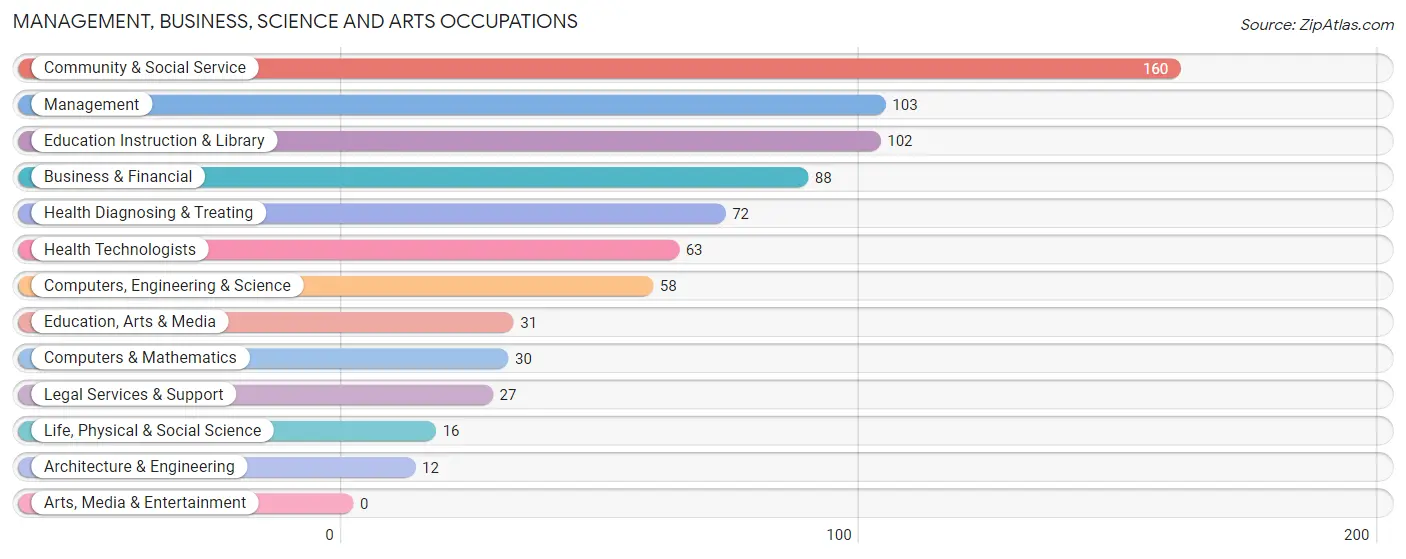
Management, Business, Science and Arts Occupations
The most common Management, Business, Science and Arts occupations in North Beach Haven are Community & Social Service (160 | 16.5%), Management (103 | 10.6%), Education Instruction & Library (102 | 10.5%), Business & Financial (88 | 9.0%), and Health Diagnosing & Treating (72 | 7.4%).
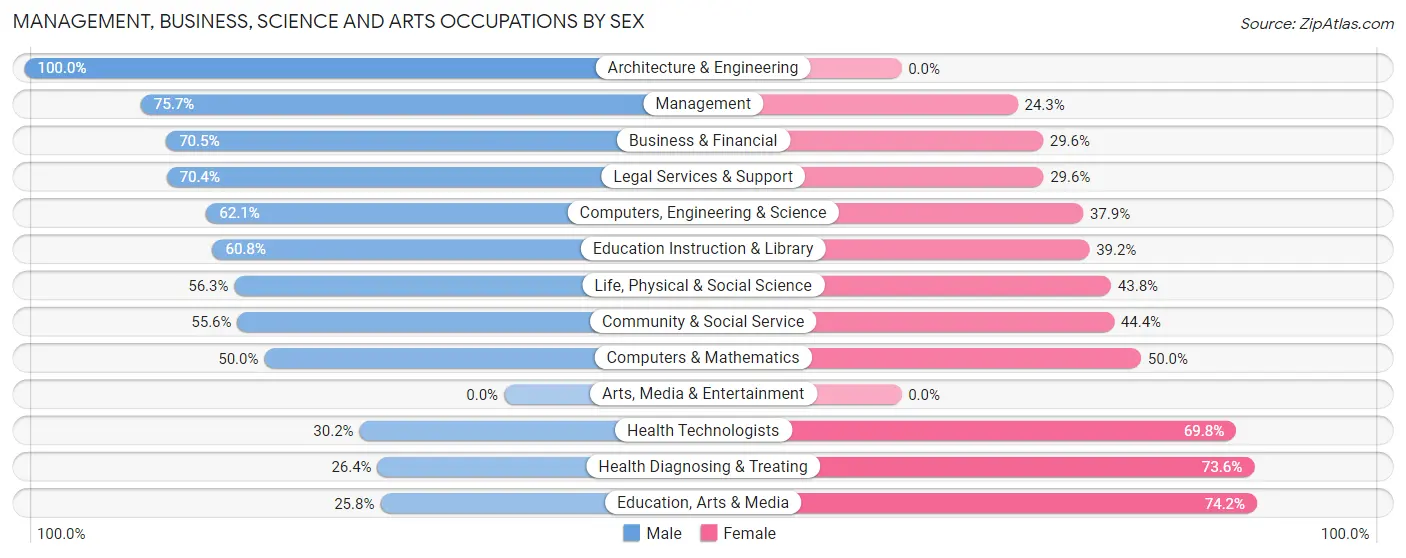
Management, Business, Science and Arts Occupations by Sex
Within the Management, Business, Science and Arts occupations in North Beach Haven, the most male-oriented occupations are Architecture & Engineering (100.0%), Management (75.7%), and Business & Financial (70.5%), while the most female-oriented occupations are Education, Arts & Media (74.2%), Health Diagnosing & Treating (73.6%), and Health Technologists (69.8%).
| Occupation | Male | Female |
| Management | 78 (75.7%) | 25 (24.3%) |
| Business & Financial | 62 (70.5%) | 26 (29.5%) |
| Computers, Engineering & Science | 36 (62.1%) | 22 (37.9%) |
| Computers & Mathematics | 15 (50.0%) | 15 (50.0%) |
| Architecture & Engineering | 12 (100.0%) | 0 (0.0%) |
| Life, Physical & Social Science | 9 (56.2%) | 7 (43.8%) |
| Community & Social Service | 89 (55.6%) | 71 (44.4%) |
| Education, Arts & Media | 8 (25.8%) | 23 (74.2%) |
| Legal Services & Support | 19 (70.4%) | 8 (29.6%) |
| Education Instruction & Library | 62 (60.8%) | 40 (39.2%) |
| Arts, Media & Entertainment | 0 (0.0%) | 0 (0.0%) |
| Health Diagnosing & Treating | 19 (26.4%) | 53 (73.6%) |
| Health Technologists | 19 (30.2%) | 44 (69.8%) |
| Total (Category) | 284 (59.0%) | 197 (41.0%) |
| Total (Overall) | 556 (57.2%) | 416 (42.8%) |
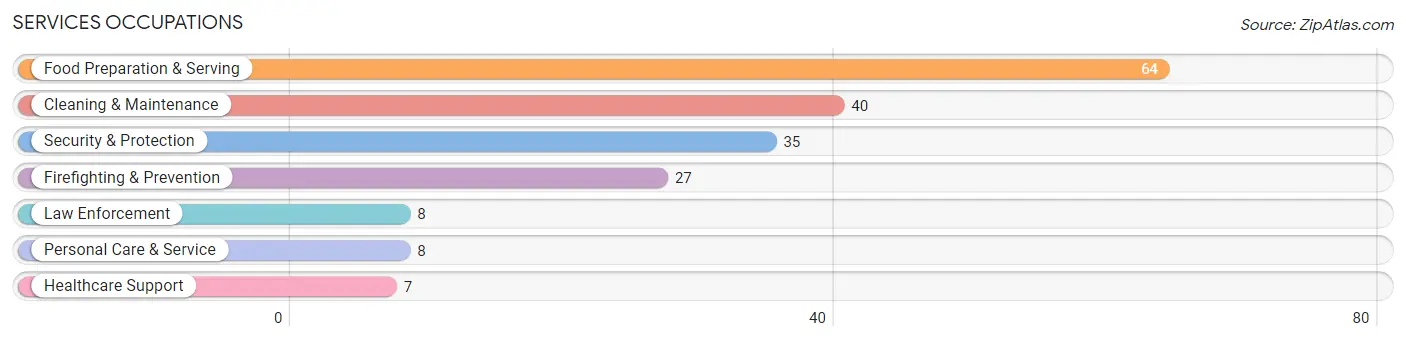
Services Occupations
The most common Services occupations in North Beach Haven are Food Preparation & Serving (64 | 6.6%), Cleaning & Maintenance (40 | 4.1%), Security & Protection (35 | 3.6%), Firefighting & Prevention (27 | 2.8%), and Law Enforcement (8 | 0.8%).
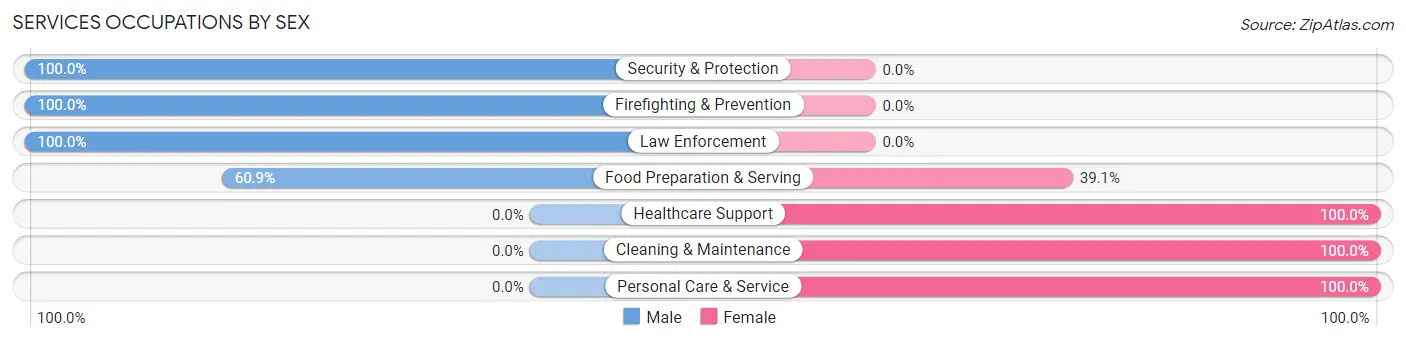
Services Occupations by Sex
Within the Services occupations in North Beach Haven, the most male-oriented occupations are Security & Protection (100.0%), Firefighting & Prevention (100.0%), and Law Enforcement (100.0%), while the most female-oriented occupations are Healthcare Support (100.0%), Cleaning & Maintenance (100.0%), and Personal Care & Service (100.0%).
| Occupation | Male | Female |
| Healthcare Support | 0 (0.0%) | 7 (100.0%) |
| Security & Protection | 35 (100.0%) | 0 (0.0%) |
| Firefighting & Prevention | 27 (100.0%) | 0 (0.0%) |
| Law Enforcement | 8 (100.0%) | 0 (0.0%) |
| Food Preparation & Serving | 39 (60.9%) | 25 (39.1%) |
| Cleaning & Maintenance | 0 (0.0%) | 40 (100.0%) |
| Personal Care & Service | 0 (0.0%) | 8 (100.0%) |
| Total (Category) | 74 (48.0%) | 80 (51.9%) |
| Total (Overall) | 556 (57.2%) | 416 (42.8%) |
Sales and Office Occupations
The most common Sales and Office occupations in North Beach Haven are Sales & Related (181 | 18.6%), and Office & Administration (52 | 5.3%).
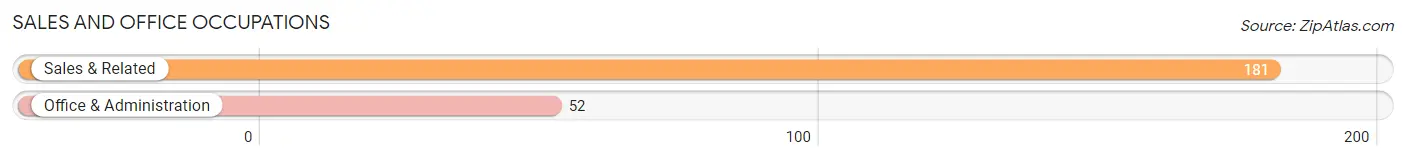
Sales and Office Occupations by Sex
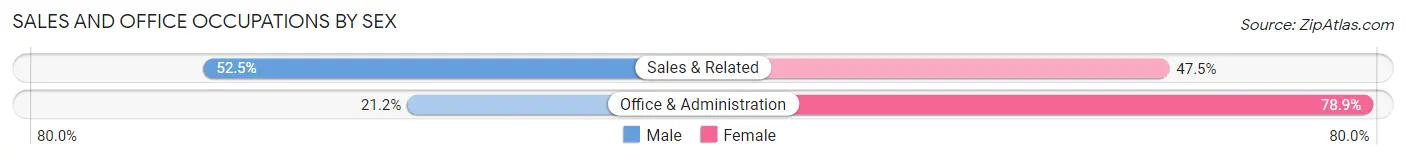
| Occupation | Male | Female |
| Sales & Related | 95 (52.5%) | 86 (47.5%) |
| Office & Administration | 11 (21.1%) | 41 (78.8%) |
| Total (Category) | 106 (45.5%) | 127 (54.5%) |
| Total (Overall) | 556 (57.2%) | 416 (42.8%) |
Natural Resources, Construction and Maintenance Occupations
The most common Natural Resources, Construction and Maintenance occupations in North Beach Haven are Installation, Maintenance & Repair (62 | 6.4%), and Construction & Extraction (24 | 2.5%).
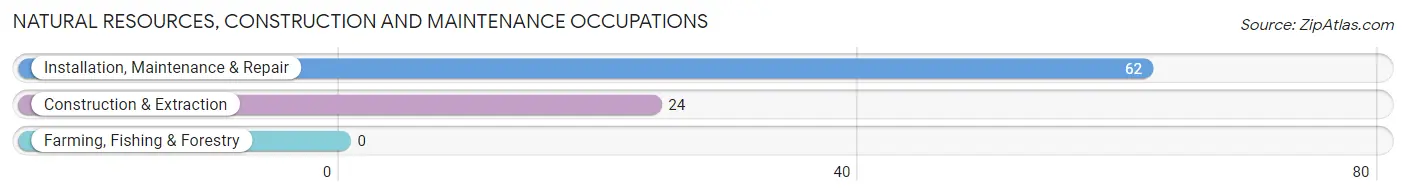
Natural Resources, Construction and Maintenance Occupations by Sex
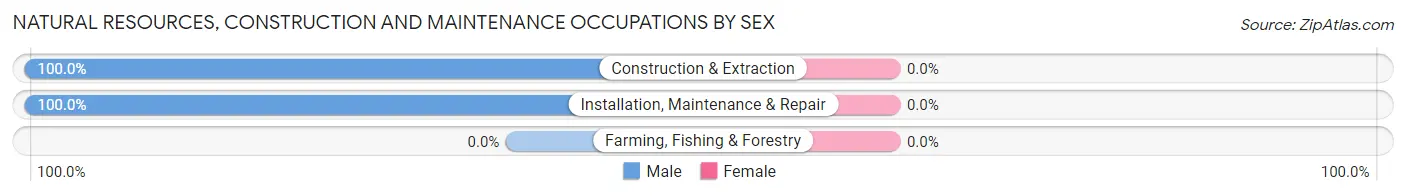
| Occupation | Male | Female |
| Farming, Fishing & Forestry | 0 (0.0%) | 0 (0.0%) |
| Construction & Extraction | 24 (100.0%) | 0 (0.0%) |
| Installation, Maintenance & Repair | 62 (100.0%) | 0 (0.0%) |
| Total (Category) | 86 (100.0%) | 0 (0.0%) |
| Total (Overall) | 556 (57.2%) | 416 (42.8%) |
Production, Transportation and Moving Occupations
The most common Production, Transportation and Moving occupations in North Beach Haven are Production (12 | 1.2%), and Transportation (6 | 0.6%).
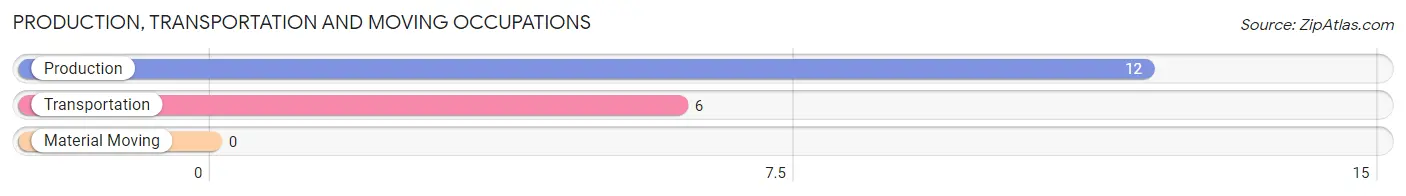
Production, Transportation and Moving Occupations by Sex
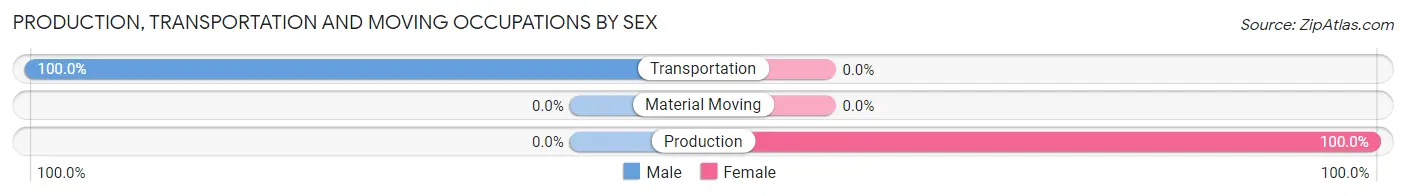
| Occupation | Male | Female |
| Production | 0 (0.0%) | 12 (100.0%) |
| Transportation | 6 (100.0%) | 0 (0.0%) |
| Material Moving | 0 (0.0%) | 0 (0.0%) |
| Total (Category) | 6 (33.3%) | 12 (66.7%) |
| Total (Overall) | 556 (57.2%) | 416 (42.8%) |
Employment Industries by Sex in North Beach Haven
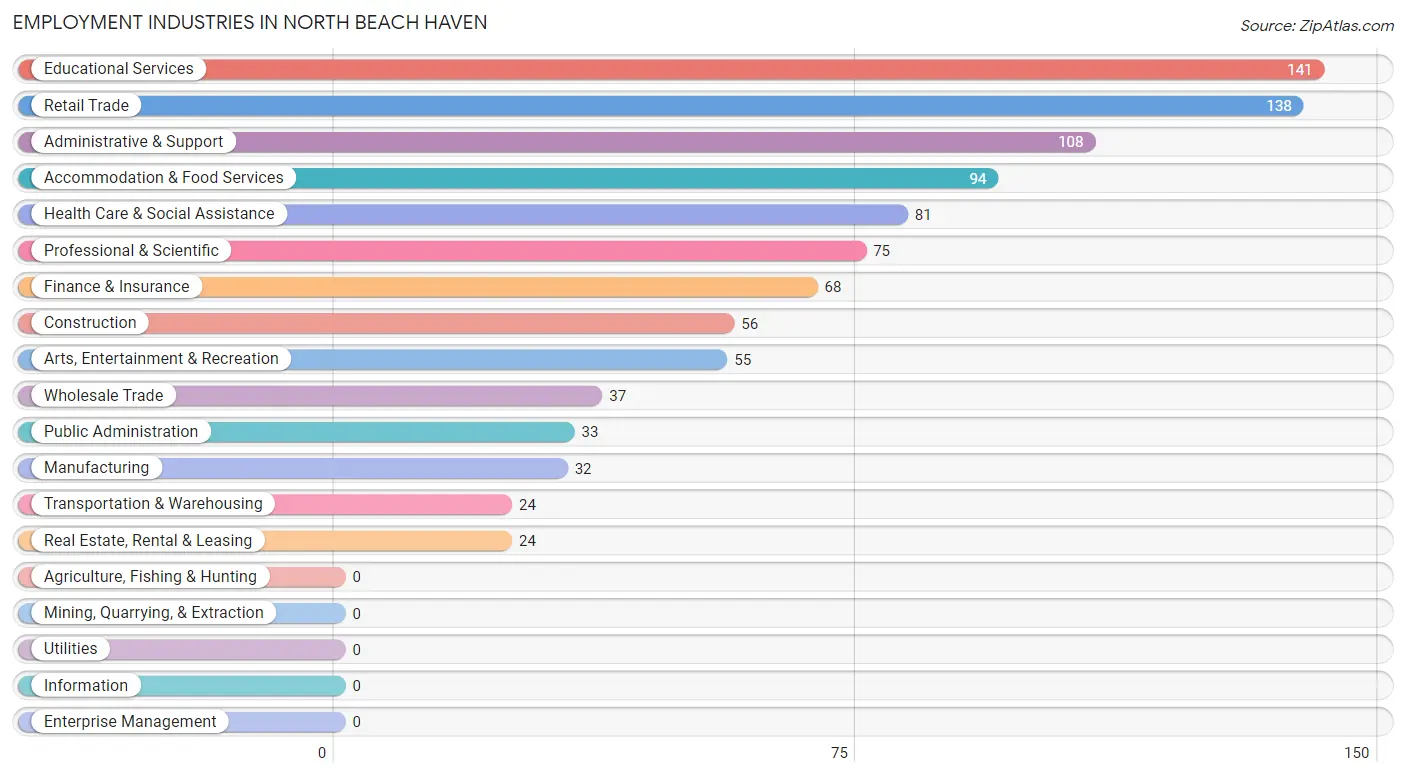
Employment Industries in North Beach Haven
The major employment industries in North Beach Haven include Educational Services (141 | 14.5%), Retail Trade (138 | 14.2%), Administrative & Support (108 | 11.1%), Accommodation & Food Services (94 | 9.7%), and Health Care & Social Assistance (81 | 8.3%).
Employment Industries by Sex in North Beach Haven
The North Beach Haven industries that see more men than women are Transportation & Warehousing (100.0%), Construction (87.5%), and Arts, Entertainment & Recreation (85.5%), whereas the industries that tend to have a higher number of women are Health Care & Social Assistance (77.8%), Real Estate, Rental & Leasing (70.8%), and Accommodation & Food Services (58.5%).
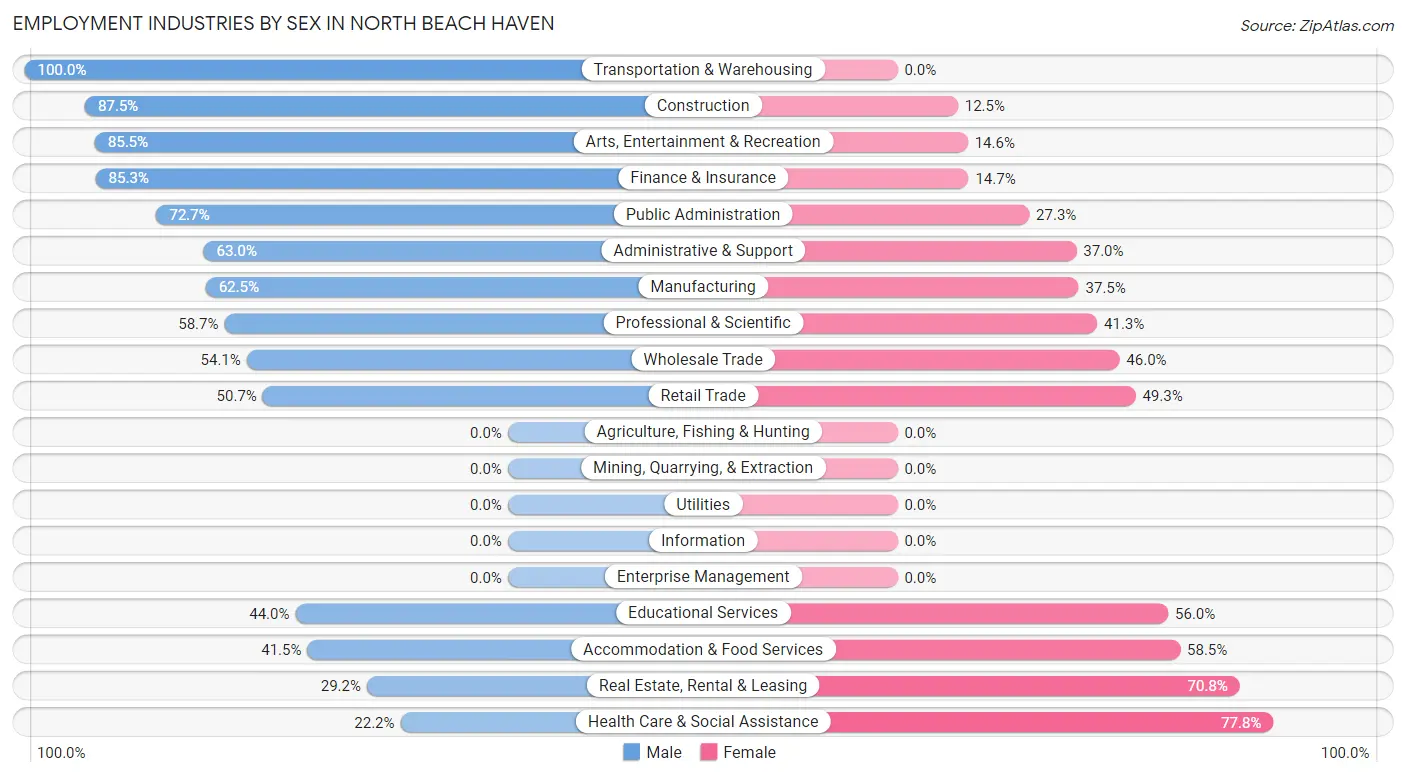
| Industry | Male | Female |
| Agriculture, Fishing & Hunting | 0 (0.0%) | 0 (0.0%) |
| Mining, Quarrying, & Extraction | 0 (0.0%) | 0 (0.0%) |
| Construction | 49 (87.5%) | 7 (12.5%) |
| Manufacturing | 20 (62.5%) | 12 (37.5%) |
| Wholesale Trade | 20 (54.0%) | 17 (46.0%) |
| Retail Trade | 70 (50.7%) | 68 (49.3%) |
| Transportation & Warehousing | 24 (100.0%) | 0 (0.0%) |
| Utilities | 0 (0.0%) | 0 (0.0%) |
| Information | 0 (0.0%) | 0 (0.0%) |
| Finance & Insurance | 58 (85.3%) | 10 (14.7%) |
| Real Estate, Rental & Leasing | 7 (29.2%) | 17 (70.8%) |
| Professional & Scientific | 44 (58.7%) | 31 (41.3%) |
| Enterprise Management | 0 (0.0%) | 0 (0.0%) |
| Administrative & Support | 68 (63.0%) | 40 (37.0%) |
| Educational Services | 62 (44.0%) | 79 (56.0%) |
| Health Care & Social Assistance | 18 (22.2%) | 63 (77.8%) |
| Arts, Entertainment & Recreation | 47 (85.5%) | 8 (14.5%) |
| Accommodation & Food Services | 39 (41.5%) | 55 (58.5%) |
| Public Administration | 24 (72.7%) | 9 (27.3%) |
| Total | 556 (57.2%) | 416 (42.8%) |
Education in North Beach Haven
School Enrollment in North Beach Haven
The most common levels of schooling among the 194 students in North Beach Haven are high school (56 | 28.9%), graduate / professional (55 | 28.3%), and elementary school (38 | 19.6%).
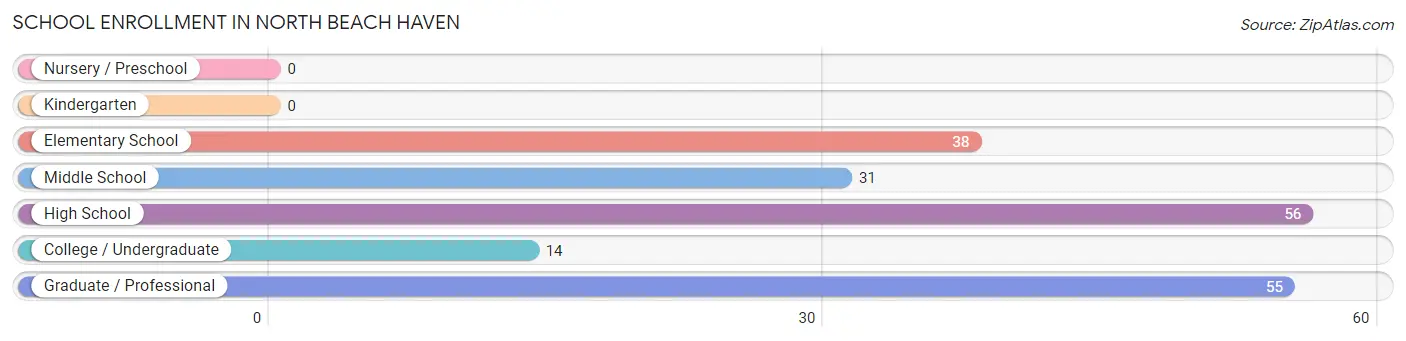
| School Level | # Students | % Students |
| Nursery / Preschool | 0 | 0.0% |
| Kindergarten | 0 | 0.0% |
| Elementary School | 38 | 19.6% |
| Middle School | 31 | 16.0% |
| High School | 56 | 28.9% |
| College / Undergraduate | 14 | 7.2% |
| Graduate / Professional | 55 | 28.3% |
| Total | 194 | 100.0% |
School Enrollment by Age by Funding Source in North Beach Haven
Out of a total of 194 students who are enrolled in schools in North Beach Haven, 39 (20.1%) attend a private institution, while the remaining 155 (79.9%) are enrolled in public schools. The age group of 10 to 14 year olds has the highest likelihood of being enrolled in private schools, with 22 (43.1% in the age bracket) enrolled. Conversely, the age group of 15 to 17 year olds has the lowest likelihood of being enrolled in a private school, with 43 (100.0% in the age bracket) attending a public institution.
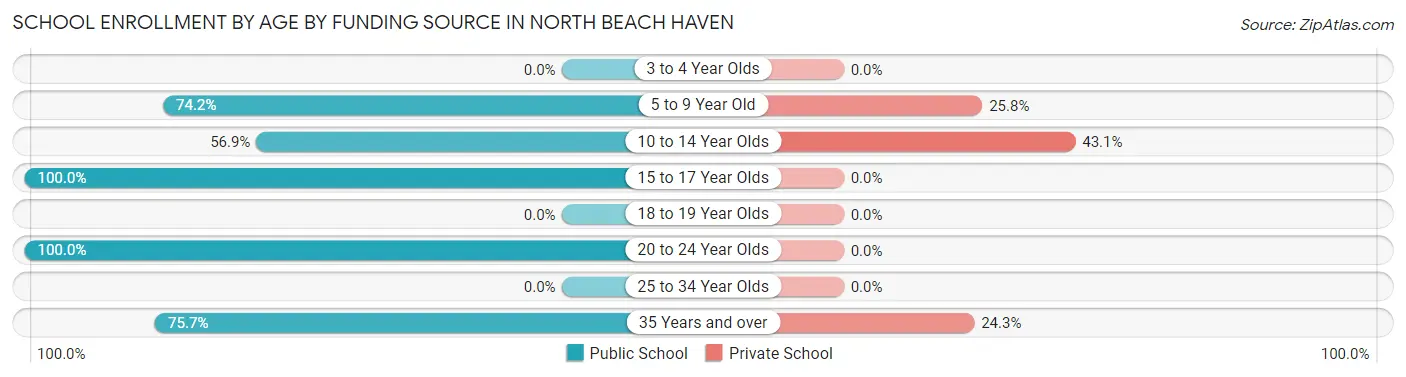
| Age Bracket | Public School | Private School |
| 3 to 4 Year Olds | 0 (0.0%) | 0 (0.0%) |
| 5 to 9 Year Old | 23 (74.2%) | 8 (25.8%) |
| 10 to 14 Year Olds | 29 (56.9%) | 22 (43.1%) |
| 15 to 17 Year Olds | 43 (100.0%) | 0 (0.0%) |
| 18 to 19 Year Olds | 0 (0.0%) | 0 (0.0%) |
| 20 to 24 Year Olds | 32 (100.0%) | 0 (0.0%) |
| 25 to 34 Year Olds | 0 (0.0%) | 0 (0.0%) |
| 35 Years and over | 28 (75.7%) | 9 (24.3%) |
| Total | 155 (79.9%) | 39 (20.1%) |
Educational Attainment by Field of Study in North Beach Haven
Business (254 | 20.1%), education (243 | 19.3%), social sciences (188 | 14.9%), literature & languages (108 | 8.6%), and science & technology (100 | 7.9%) are the most common fields of study among 1,261 individuals in North Beach Haven who have obtained a bachelor's degree or higher.
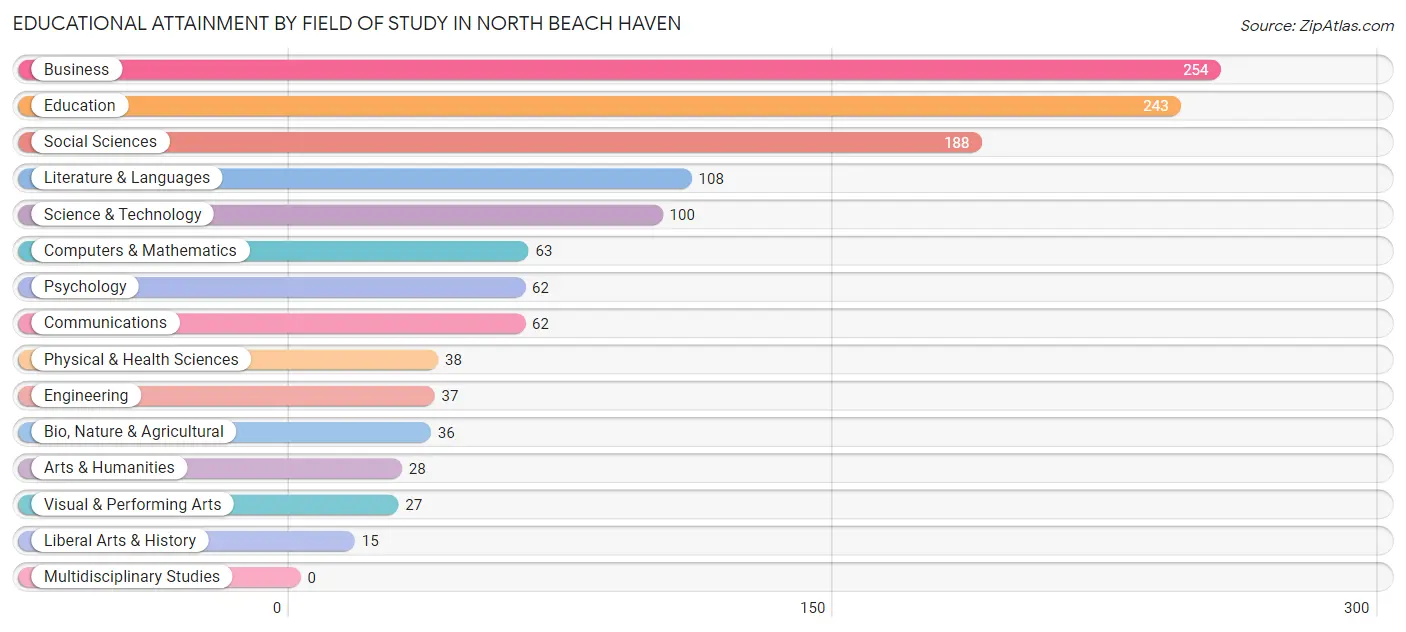
| Field of Study | # Graduates | % Graduates |
| Computers & Mathematics | 63 | 5.0% |
| Bio, Nature & Agricultural | 36 | 2.9% |
| Physical & Health Sciences | 38 | 3.0% |
| Psychology | 62 | 4.9% |
| Social Sciences | 188 | 14.9% |
| Engineering | 37 | 2.9% |
| Multidisciplinary Studies | 0 | 0.0% |
| Science & Technology | 100 | 7.9% |
| Business | 254 | 20.1% |
| Education | 243 | 19.3% |
| Literature & Languages | 108 | 8.6% |
| Liberal Arts & History | 15 | 1.2% |
| Visual & Performing Arts | 27 | 2.1% |
| Communications | 62 | 4.9% |
| Arts & Humanities | 28 | 2.2% |
| Total | 1,261 | 100.0% |
Transportation & Commute in North Beach Haven
Vehicle Availability by Sex in North Beach Haven
The most prevalent vehicle ownership categories in North Beach Haven are males with 2 vehicles (314, accounting for 60.0%) and females with 2 vehicles (171, making up 77.0%).
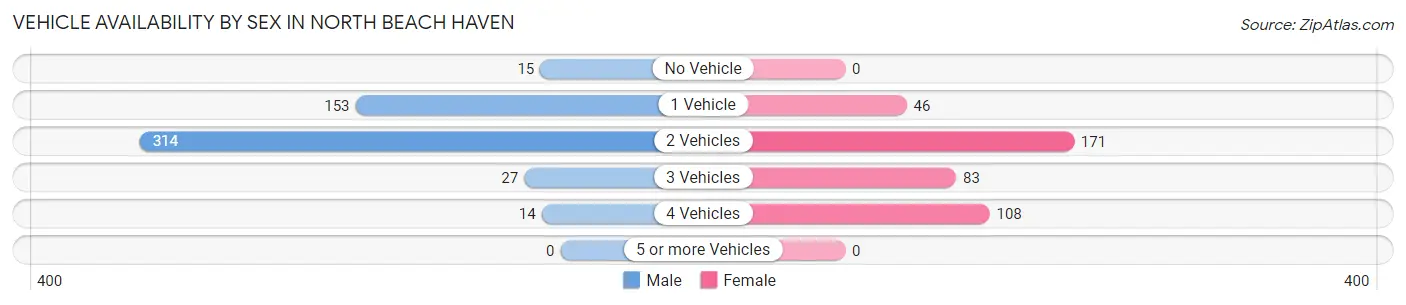
| Vehicles Available | Male | Female |
| No Vehicle | 15 (2.9%) | 0 (0.0%) |
| 1 Vehicle | 153 (29.2%) | 46 (11.3%) |
| 2 Vehicles | 314 (60.0%) | 171 (41.9%) |
| 3 Vehicles | 27 (5.2%) | 83 (20.3%) |
| 4 Vehicles | 14 (2.7%) | 108 (26.5%) |
| 5 or more Vehicles | 0 (0.0%) | 0 (0.0%) |
| Total | 523 (100.0%) | 408 (100.0%) |
Commute Time in North Beach Haven
The most frequently occuring commute durations in North Beach Haven are 5 to 9 minutes (101 commuters, 15.2%), 15 to 19 minutes (94 commuters, 14.2%), and 10 to 14 minutes (87 commuters, 13.1%).
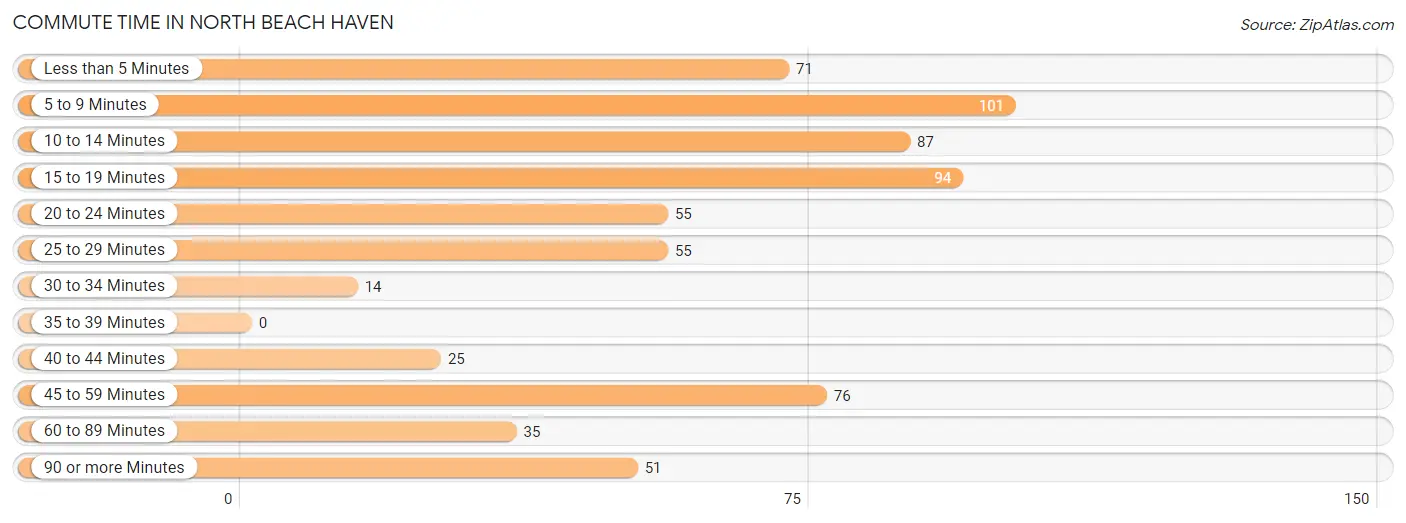
| Commute Time | # Commuters | % Commuters |
| Less than 5 Minutes | 71 | 10.7% |
| 5 to 9 Minutes | 101 | 15.2% |
| 10 to 14 Minutes | 87 | 13.1% |
| 15 to 19 Minutes | 94 | 14.2% |
| 20 to 24 Minutes | 55 | 8.3% |
| 25 to 29 Minutes | 55 | 8.3% |
| 30 to 34 Minutes | 14 | 2.1% |
| 35 to 39 Minutes | 0 | 0.0% |
| 40 to 44 Minutes | 25 | 3.8% |
| 45 to 59 Minutes | 76 | 11.5% |
| 60 to 89 Minutes | 35 | 5.3% |
| 90 or more Minutes | 51 | 7.7% |
Commute Time by Sex in North Beach Haven
The most common commute times in North Beach Haven are 15 to 19 minutes (64 commuters, 15.9%) for males and 5 to 9 minutes (51 commuters, 19.5%) for females.
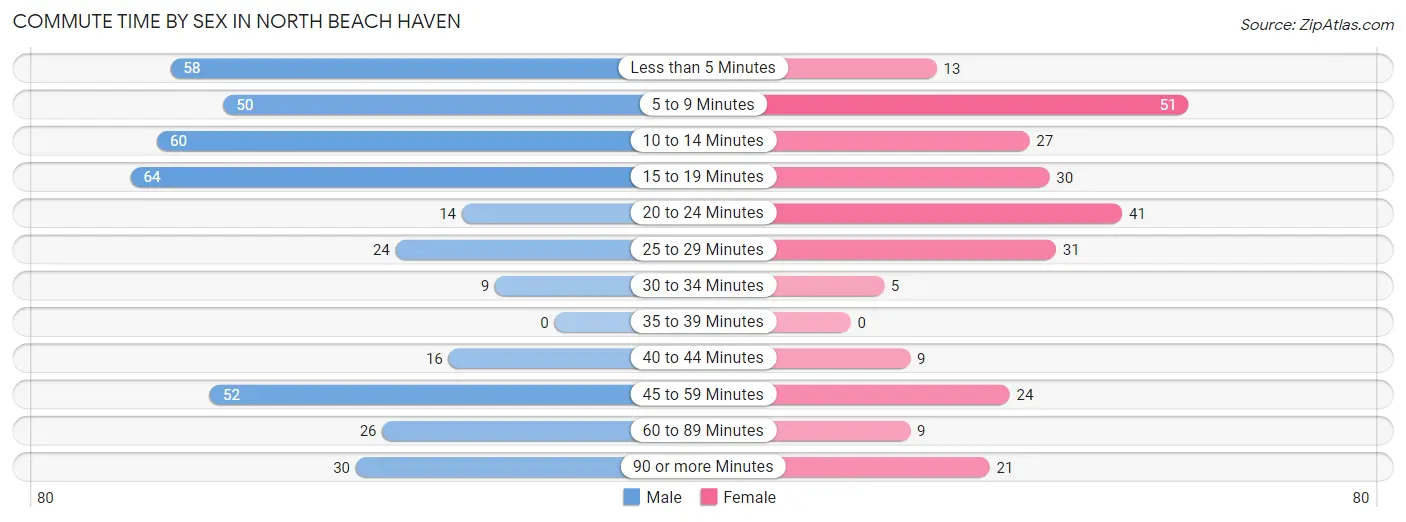
| Commute Time | Male | Female |
| Less than 5 Minutes | 58 (14.4%) | 13 (5.0%) |
| 5 to 9 Minutes | 50 (12.4%) | 51 (19.5%) |
| 10 to 14 Minutes | 60 (14.9%) | 27 (10.3%) |
| 15 to 19 Minutes | 64 (15.9%) | 30 (11.5%) |
| 20 to 24 Minutes | 14 (3.5%) | 41 (15.7%) |
| 25 to 29 Minutes | 24 (6.0%) | 31 (11.9%) |
| 30 to 34 Minutes | 9 (2.2%) | 5 (1.9%) |
| 35 to 39 Minutes | 0 (0.0%) | 0 (0.0%) |
| 40 to 44 Minutes | 16 (4.0%) | 9 (3.5%) |
| 45 to 59 Minutes | 52 (12.9%) | 24 (9.2%) |
| 60 to 89 Minutes | 26 (6.5%) | 9 (3.5%) |
| 90 or more Minutes | 30 (7.4%) | 21 (8.1%) |
Time of Departure to Work by Sex in North Beach Haven
The most frequent times of departure to work in North Beach Haven are 7:30 AM to 7:59 AM (124, 30.8%) for males and 10:00 AM to 10:59 AM (58, 22.2%) for females.
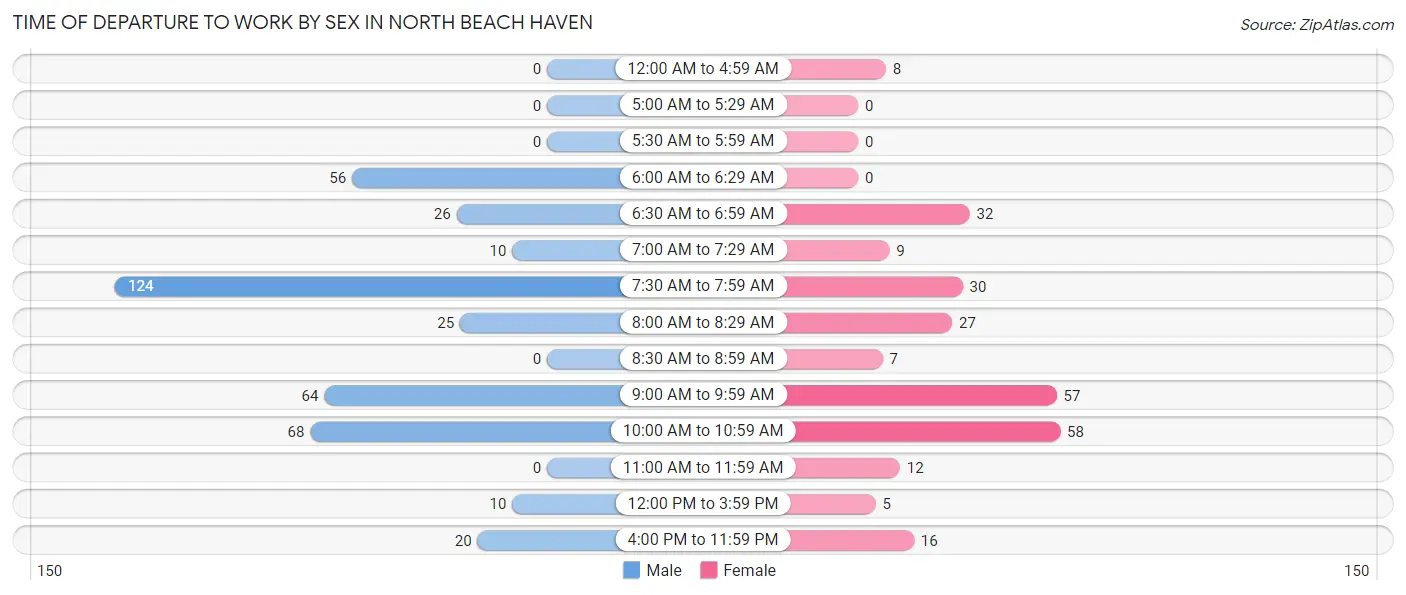
| Time of Departure | Male | Female |
| 12:00 AM to 4:59 AM | 0 (0.0%) | 8 (3.1%) |
| 5:00 AM to 5:29 AM | 0 (0.0%) | 0 (0.0%) |
| 5:30 AM to 5:59 AM | 0 (0.0%) | 0 (0.0%) |
| 6:00 AM to 6:29 AM | 56 (13.9%) | 0 (0.0%) |
| 6:30 AM to 6:59 AM | 26 (6.5%) | 32 (12.3%) |
| 7:00 AM to 7:29 AM | 10 (2.5%) | 9 (3.5%) |
| 7:30 AM to 7:59 AM | 124 (30.8%) | 30 (11.5%) |
| 8:00 AM to 8:29 AM | 25 (6.2%) | 27 (10.3%) |
| 8:30 AM to 8:59 AM | 0 (0.0%) | 7 (2.7%) |
| 9:00 AM to 9:59 AM | 64 (15.9%) | 57 (21.8%) |
| 10:00 AM to 10:59 AM | 68 (16.9%) | 58 (22.2%) |
| 11:00 AM to 11:59 AM | 0 (0.0%) | 12 (4.6%) |
| 12:00 PM to 3:59 PM | 10 (2.5%) | 5 (1.9%) |
| 4:00 PM to 11:59 PM | 20 (5.0%) | 16 (6.1%) |
| Total | 403 (100.0%) | 261 (100.0%) |
Housing Occupancy in North Beach Haven
Occupancy by Ownership in North Beach Haven
Of the total 1,096 dwellings in North Beach Haven, owner-occupied units account for 995 (90.8%), while renter-occupied units make up 101 (9.2%).
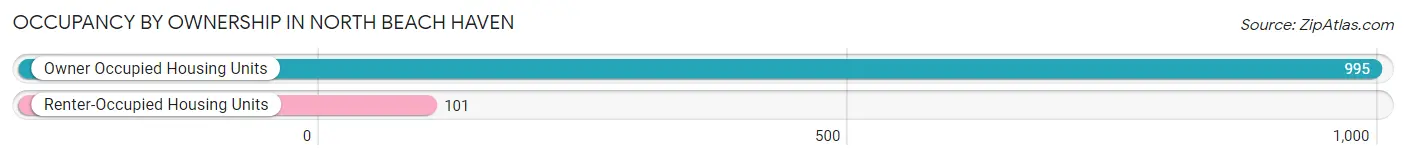
| Occupancy | # Housing Units | % Housing Units |
| Owner Occupied Housing Units | 995 | 90.8% |
| Renter-Occupied Housing Units | 101 | 9.2% |
| Total Occupied Housing Units | 1,096 | 100.0% |
Occupancy by Household Size in North Beach Haven
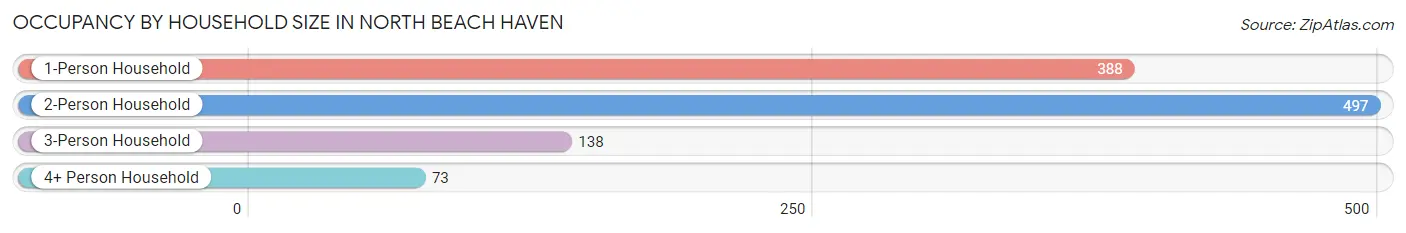
| Household Size | # Housing Units | % Housing Units |
| 1-Person Household | 388 | 35.4% |
| 2-Person Household | 497 | 45.4% |
| 3-Person Household | 138 | 12.6% |
| 4+ Person Household | 73 | 6.7% |
| Total Housing Units | 1,096 | 100.0% |
Occupancy by Ownership by Household Size in North Beach Haven
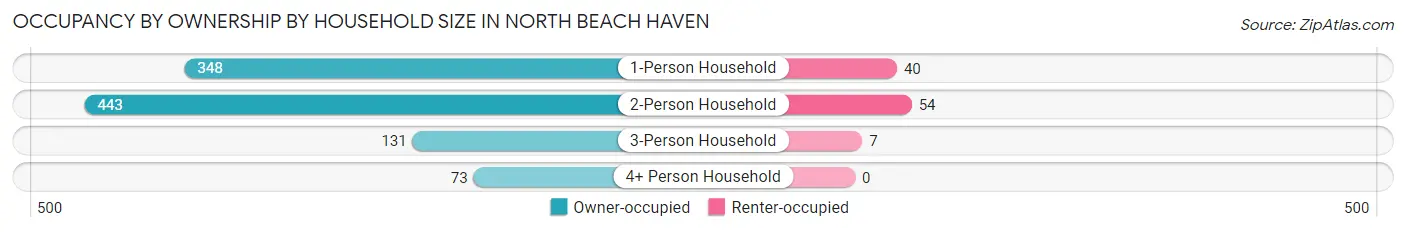
| Household Size | Owner-occupied | Renter-occupied |
| 1-Person Household | 348 (89.7%) | 40 (10.3%) |
| 2-Person Household | 443 (89.1%) | 54 (10.9%) |
| 3-Person Household | 131 (94.9%) | 7 (5.1%) |
| 4+ Person Household | 73 (100.0%) | 0 (0.0%) |
| Total Housing Units | 995 (90.8%) | 101 (9.2%) |
Occupancy by Educational Attainment in North Beach Haven
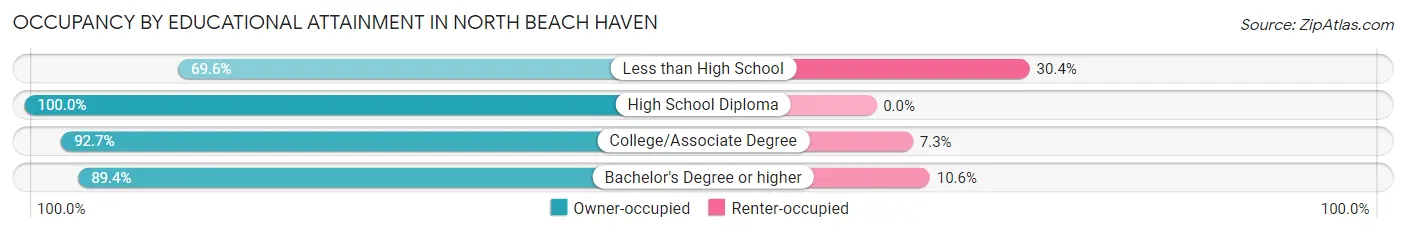
| Household Size | Owner-occupied | Renter-occupied |
| Less than High School | 16 (69.6%) | 7 (30.4%) |
| High School Diploma | 119 (100.0%) | 0 (0.0%) |
| College/Associate Degree | 204 (92.7%) | 16 (7.3%) |
| Bachelor's Degree or higher | 656 (89.4%) | 78 (10.6%) |
Occupancy by Age of Householder in North Beach Haven
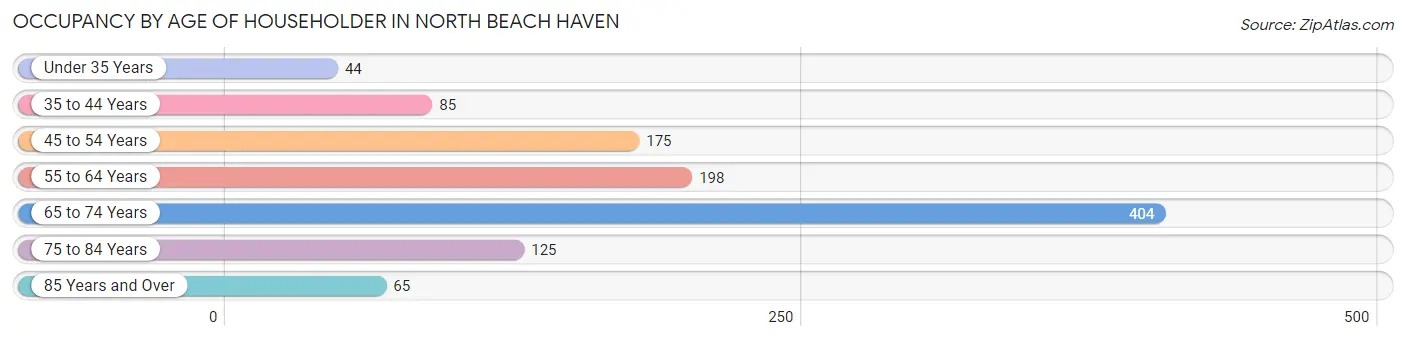
| Age Bracket | # Households | % Households |
| Under 35 Years | 44 | 4.0% |
| 35 to 44 Years | 85 | 7.8% |
| 45 to 54 Years | 175 | 16.0% |
| 55 to 64 Years | 198 | 18.1% |
| 65 to 74 Years | 404 | 36.9% |
| 75 to 84 Years | 125 | 11.4% |
| 85 Years and Over | 65 | 5.9% |
| Total | 1,096 | 100.0% |
Housing Finances in North Beach Haven
Median Income by Occupancy in North Beach Haven
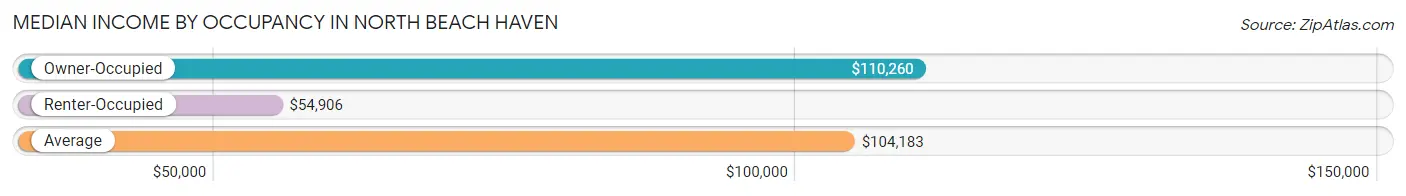
| Occupancy Type | # Households | Median Income |
| Owner-Occupied | 995 (90.8%) | $110,260 |
| Renter-Occupied | 101 (9.2%) | $54,906 |
| Average | 1,096 (100.0%) | $104,183 |
Occupancy by Householder Income Bracket in North Beach Haven
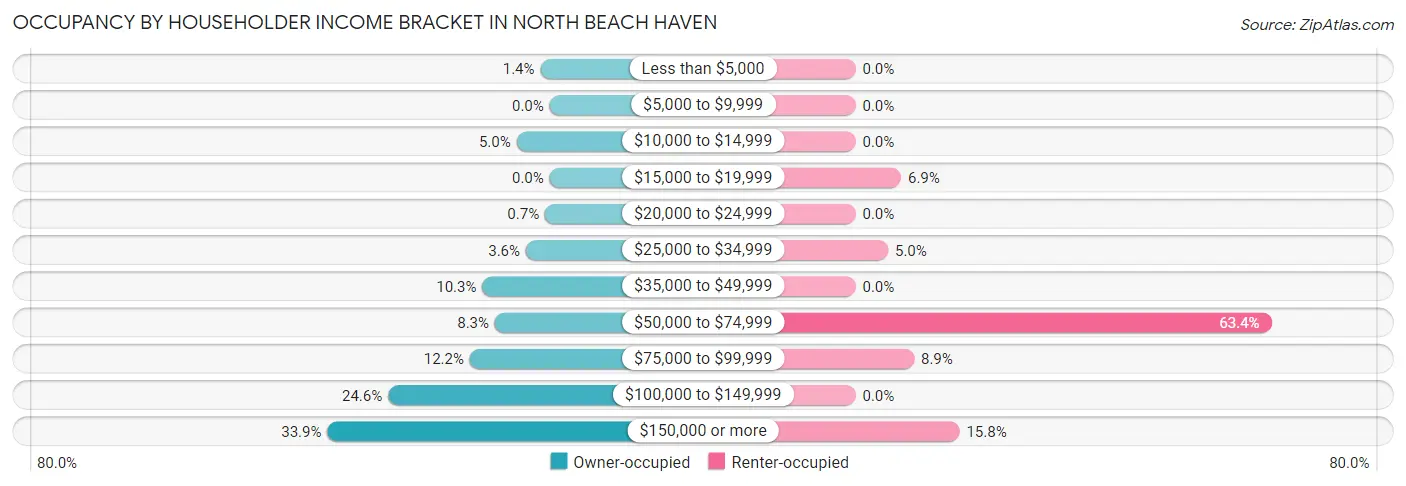
| Income Bracket | Owner-occupied | Renter-occupied |
| Less than $5,000 | 14 (1.4%) | 0 (0.0%) |
| $5,000 to $9,999 | 0 (0.0%) | 0 (0.0%) |
| $10,000 to $14,999 | 50 (5.0%) | 0 (0.0%) |
| $15,000 to $19,999 | 0 (0.0%) | 7 (6.9%) |
| $20,000 to $24,999 | 7 (0.7%) | 0 (0.0%) |
| $25,000 to $34,999 | 36 (3.6%) | 5 (5.0%) |
| $35,000 to $49,999 | 102 (10.2%) | 0 (0.0%) |
| $50,000 to $74,999 | 83 (8.3%) | 64 (63.4%) |
| $75,000 to $99,999 | 121 (12.2%) | 9 (8.9%) |
| $100,000 to $149,999 | 245 (24.6%) | 0 (0.0%) |
| $150,000 or more | 337 (33.9%) | 16 (15.8%) |
| Total | 995 (100.0%) | 101 (100.0%) |
Monthly Housing Cost Tiers in North Beach Haven
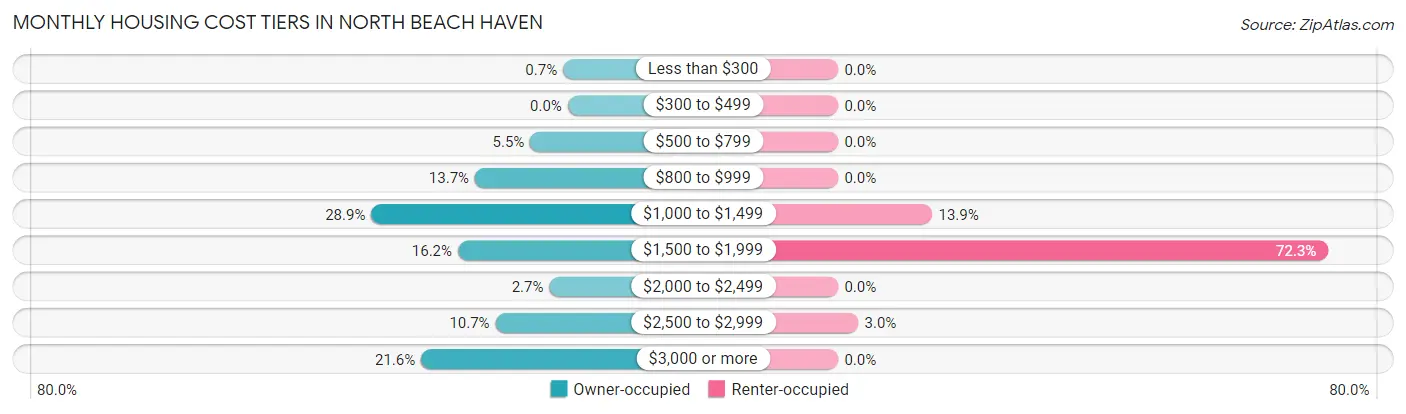
| Monthly Cost | Owner-occupied | Renter-occupied |
| Less than $300 | 7 (0.7%) | 0 (0.0%) |
| $300 to $499 | 0 (0.0%) | 0 (0.0%) |
| $500 to $799 | 55 (5.5%) | 0 (0.0%) |
| $800 to $999 | 136 (13.7%) | 0 (0.0%) |
| $1,000 to $1,499 | 288 (28.9%) | 14 (13.9%) |
| $1,500 to $1,999 | 161 (16.2%) | 73 (72.3%) |
| $2,000 to $2,499 | 27 (2.7%) | 0 (0.0%) |
| $2,500 to $2,999 | 106 (10.6%) | 3 (3.0%) |
| $3,000 or more | 215 (21.6%) | 0 (0.0%) |
| Total | 995 (100.0%) | 101 (100.0%) |
Physical Housing Characteristics in North Beach Haven
Housing Structures in North Beach Haven
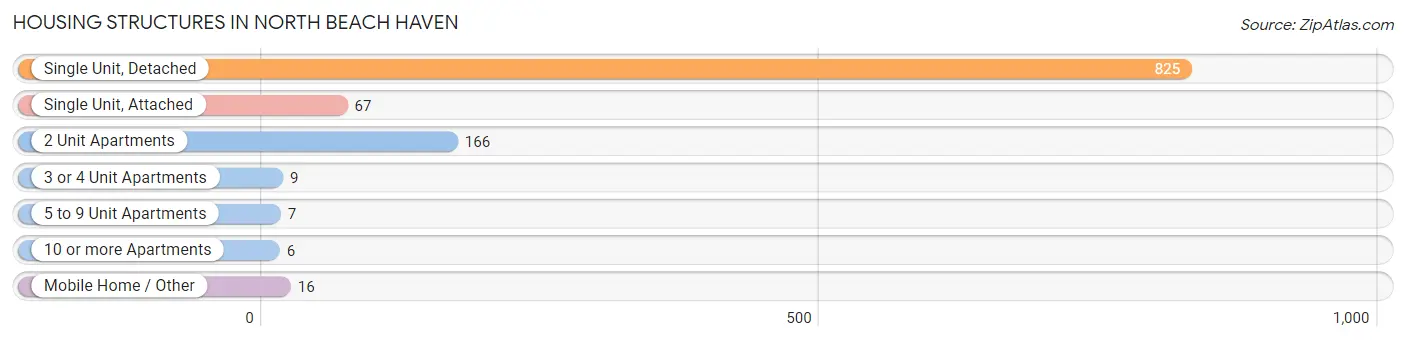
| Structure Type | # Housing Units | % Housing Units |
| Single Unit, Detached | 825 | 75.3% |
| Single Unit, Attached | 67 | 6.1% |
| 2 Unit Apartments | 166 | 15.1% |
| 3 or 4 Unit Apartments | 9 | 0.8% |
| 5 to 9 Unit Apartments | 7 | 0.6% |
| 10 or more Apartments | 6 | 0.5% |
| Mobile Home / Other | 16 | 1.5% |
| Total | 1,096 | 100.0% |
Housing Structures by Occupancy in North Beach Haven
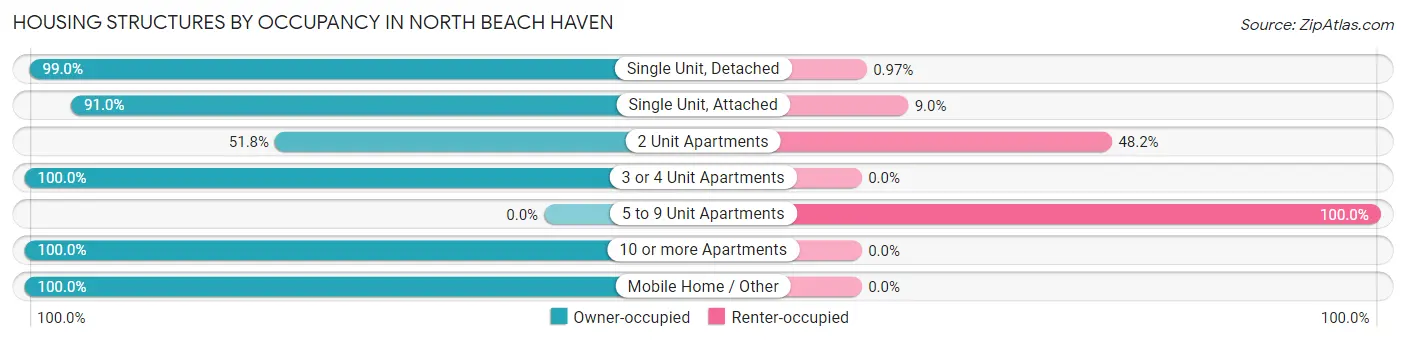
| Structure Type | Owner-occupied | Renter-occupied |
| Single Unit, Detached | 817 (99.0%) | 8 (1.0%) |
| Single Unit, Attached | 61 (91.0%) | 6 (9.0%) |
| 2 Unit Apartments | 86 (51.8%) | 80 (48.2%) |
| 3 or 4 Unit Apartments | 9 (100.0%) | 0 (0.0%) |
| 5 to 9 Unit Apartments | 0 (0.0%) | 7 (100.0%) |
| 10 or more Apartments | 6 (100.0%) | 0 (0.0%) |
| Mobile Home / Other | 16 (100.0%) | 0 (0.0%) |
| Total | 995 (90.8%) | 101 (9.2%) |
Housing Structures by Number of Rooms in North Beach Haven
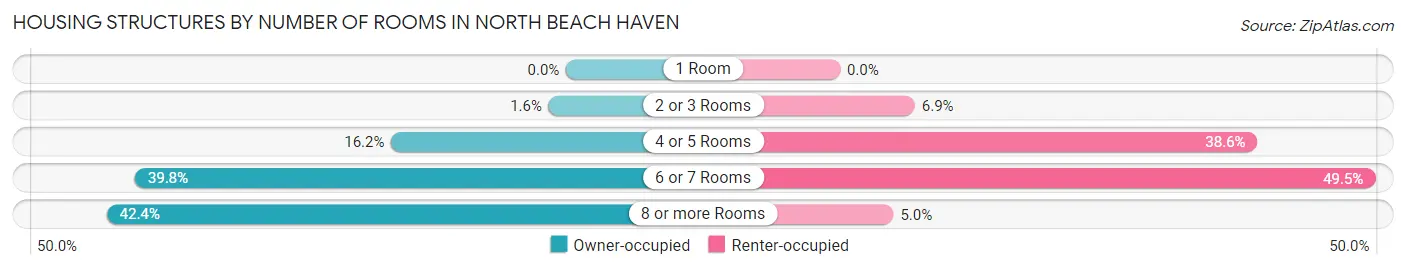
| Number of Rooms | Owner-occupied | Renter-occupied |
| 1 Room | 0 (0.0%) | 0 (0.0%) |
| 2 or 3 Rooms | 16 (1.6%) | 7 (6.9%) |
| 4 or 5 Rooms | 161 (16.2%) | 39 (38.6%) |
| 6 or 7 Rooms | 396 (39.8%) | 50 (49.5%) |
| 8 or more Rooms | 422 (42.4%) | 5 (5.0%) |
| Total | 995 (100.0%) | 101 (100.0%) |
Housing Structure by Heating Type in North Beach Haven
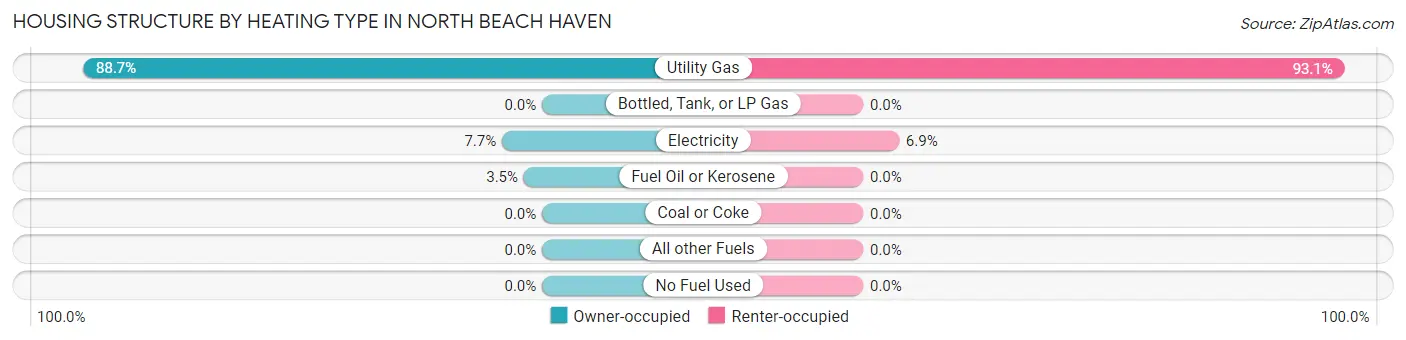
| Heating Type | Owner-occupied | Renter-occupied |
| Utility Gas | 883 (88.7%) | 94 (93.1%) |
| Bottled, Tank, or LP Gas | 0 (0.0%) | 0 (0.0%) |
| Electricity | 77 (7.7%) | 7 (6.9%) |
| Fuel Oil or Kerosene | 35 (3.5%) | 0 (0.0%) |
| Coal or Coke | 0 (0.0%) | 0 (0.0%) |
| All other Fuels | 0 (0.0%) | 0 (0.0%) |
| No Fuel Used | 0 (0.0%) | 0 (0.0%) |
| Total | 995 (100.0%) | 101 (100.0%) |
Household Vehicle Usage in North Beach Haven
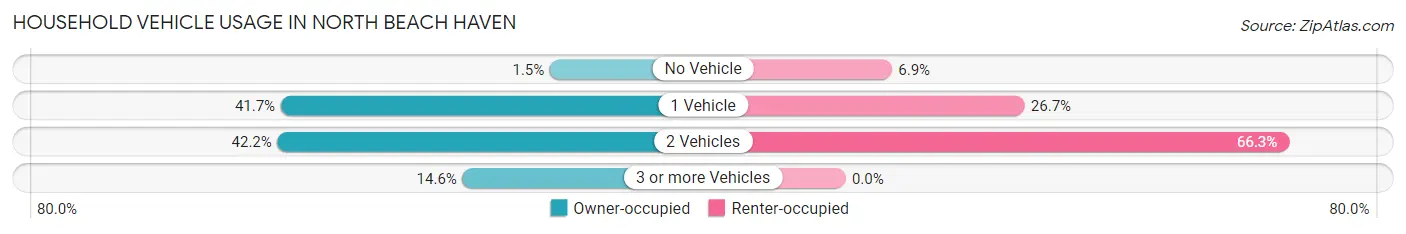
| Vehicles per Household | Owner-occupied | Renter-occupied |
| No Vehicle | 15 (1.5%) | 7 (6.9%) |
| 1 Vehicle | 415 (41.7%) | 27 (26.7%) |
| 2 Vehicles | 420 (42.2%) | 67 (66.3%) |
| 3 or more Vehicles | 145 (14.6%) | 0 (0.0%) |
| Total | 995 (100.0%) | 101 (100.0%) |
Real Estate & Mortgages in North Beach Haven
Real Estate and Mortgage Overview in North Beach Haven
| Characteristic | Without Mortgage | With Mortgage |
| Housing Units | 572 | 423 |
| Median Property Value | $975,600 | $940,600 |
| Median Household Income | $96,500 | $166 |
| Monthly Housing Costs | $1,219 | $202 |
| Real Estate Taxes | $8,283 | $0 |
Property Value by Mortgage Status in North Beach Haven
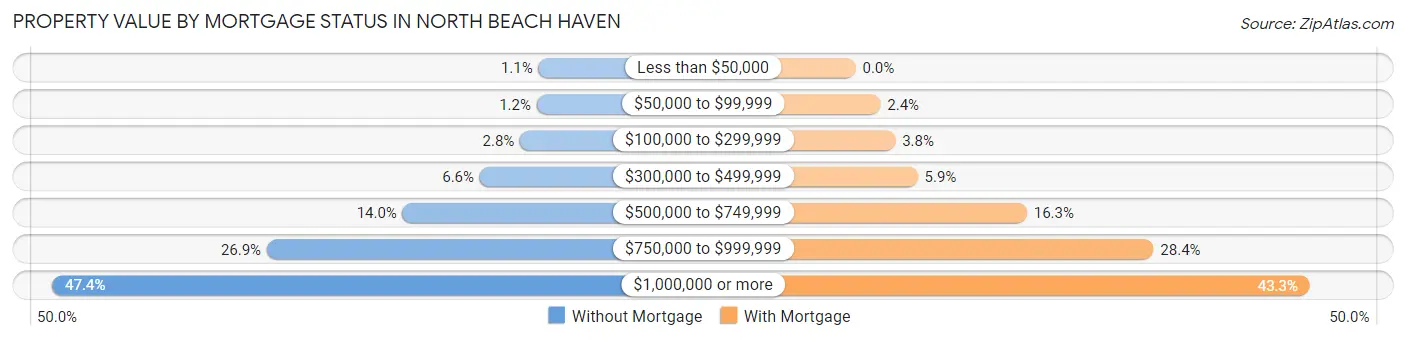
| Property Value | Without Mortgage | With Mortgage |
| Less than $50,000 | 6 (1.1%) | 0 (0.0%) |
| $50,000 to $99,999 | 7 (1.2%) | 10 (2.4%) |
| $100,000 to $299,999 | 16 (2.8%) | 16 (3.8%) |
| $300,000 to $499,999 | 38 (6.6%) | 25 (5.9%) |
| $500,000 to $749,999 | 80 (14.0%) | 69 (16.3%) |
| $750,000 to $999,999 | 154 (26.9%) | 120 (28.4%) |
| $1,000,000 or more | 271 (47.4%) | 183 (43.3%) |
| Total | 572 (100.0%) | 423 (100.0%) |
Household Income by Mortgage Status in North Beach Haven
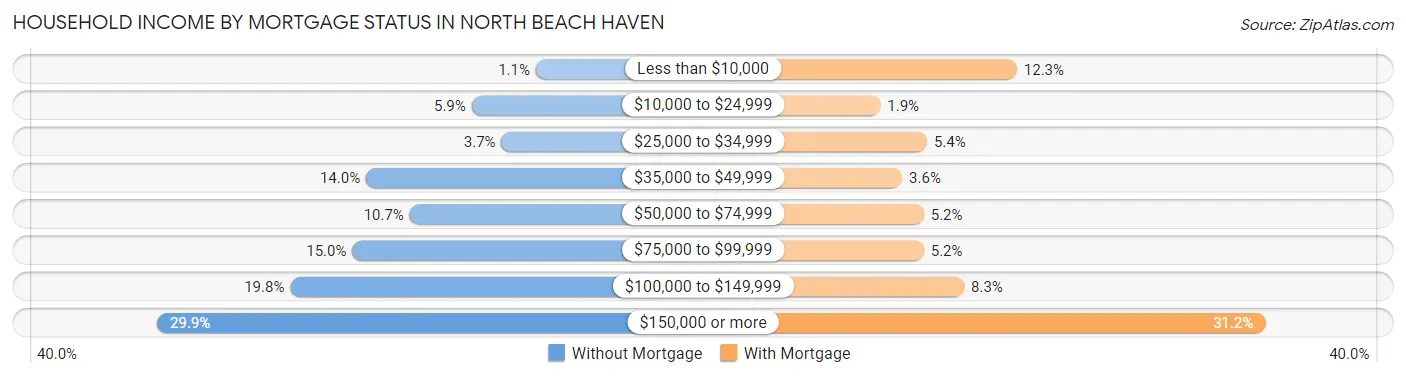
| Household Income | Without Mortgage | With Mortgage |
| Less than $10,000 | 6 (1.1%) | 52 (12.3%) |
| $10,000 to $24,999 | 34 (5.9%) | 8 (1.9%) |
| $25,000 to $34,999 | 21 (3.7%) | 23 (5.4%) |
| $35,000 to $49,999 | 80 (14.0%) | 15 (3.5%) |
| $50,000 to $74,999 | 61 (10.7%) | 22 (5.2%) |
| $75,000 to $99,999 | 86 (15.0%) | 22 (5.2%) |
| $100,000 to $149,999 | 113 (19.8%) | 35 (8.3%) |
| $150,000 or more | 171 (29.9%) | 132 (31.2%) |
| Total | 572 (100.0%) | 423 (100.0%) |
Property Value to Household Income Ratio in North Beach Haven
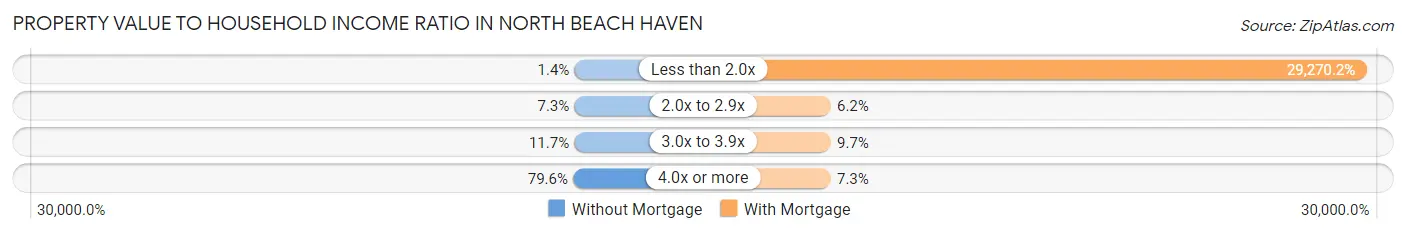
| Value-to-Income Ratio | Without Mortgage | With Mortgage |
| Less than 2.0x | 8 (1.4%) | 123,813 (29,270.2%) |
| 2.0x to 2.9x | 42 (7.3%) | 26 (6.1%) |
| 3.0x to 3.9x | 67 (11.7%) | 41 (9.7%) |
| 4.0x or more | 455 (79.5%) | 31 (7.3%) |
| Total | 572 (100.0%) | 423 (100.0%) |
Real Estate Taxes by Mortgage Status in North Beach Haven
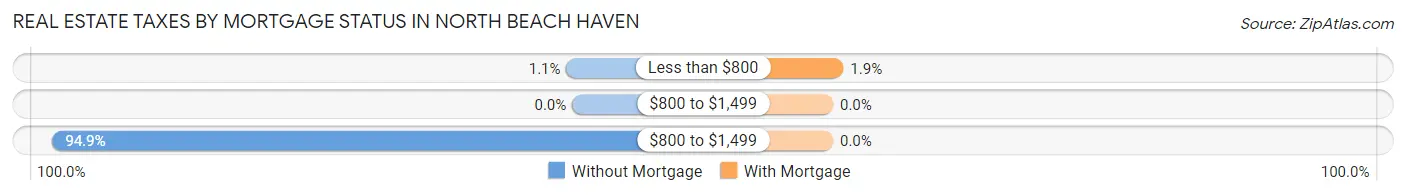
| Property Taxes | Without Mortgage | With Mortgage |
| Less than $800 | 6 (1.1%) | 8 (1.9%) |
| $800 to $1,499 | 0 (0.0%) | 0 (0.0%) |
| $800 to $1,499 | 543 (94.9%) | 0 (0.0%) |
| Total | 572 (100.0%) | 423 (100.0%) |
Health & Disability in North Beach Haven
Health Insurance Coverage by Age in North Beach Haven
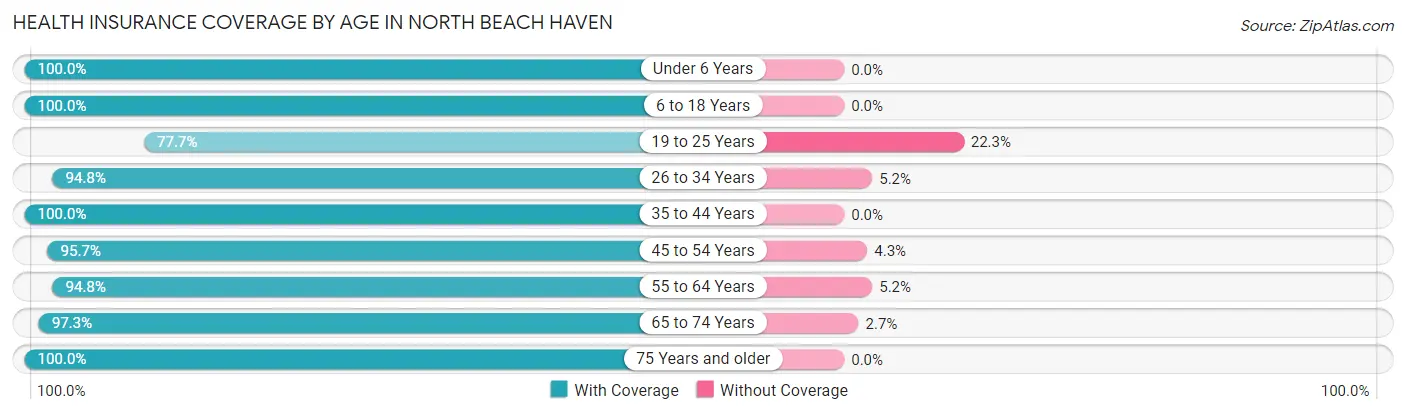
| Age Bracket | With Coverage | Without Coverage |
| Under 6 Years | 81 (100.0%) | 0 (0.0%) |
| 6 to 18 Years | 153 (100.0%) | 0 (0.0%) |
| 19 to 25 Years | 122 (77.7%) | 35 (22.3%) |
| 26 to 34 Years | 109 (94.8%) | 6 (5.2%) |
| 35 to 44 Years | 128 (100.0%) | 0 (0.0%) |
| 45 to 54 Years | 245 (95.7%) | 11 (4.3%) |
| 55 to 64 Years | 418 (94.8%) | 23 (5.2%) |
| 65 to 74 Years | 586 (97.3%) | 16 (2.7%) |
| 75 Years and older | 317 (100.0%) | 0 (0.0%) |
| Total | 2,159 (96.0%) | 91 (4.0%) |
Health Insurance Coverage by Citizenship Status in North Beach Haven
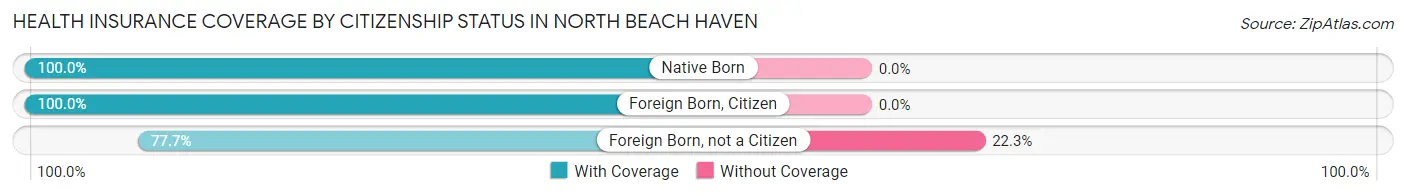
| Citizenship Status | With Coverage | Without Coverage |
| Native Born | 81 (100.0%) | 0 (0.0%) |
| Foreign Born, Citizen | 153 (100.0%) | 0 (0.0%) |
| Foreign Born, not a Citizen | 122 (77.7%) | 35 (22.3%) |
Health Insurance Coverage by Household Income in North Beach Haven
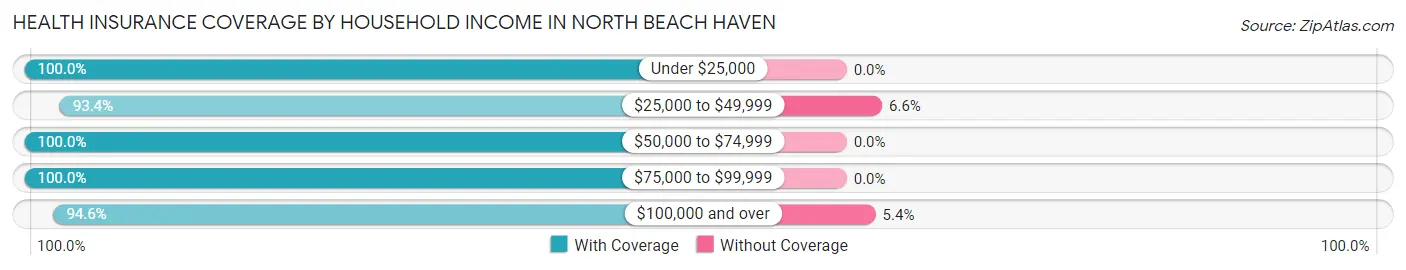
| Household Income | With Coverage | Without Coverage |
| Under $25,000 | 85 (100.0%) | 0 (0.0%) |
| $25,000 to $49,999 | 212 (93.4%) | 15 (6.6%) |
| $50,000 to $74,999 | 247 (100.0%) | 0 (0.0%) |
| $75,000 to $99,999 | 287 (100.0%) | 0 (0.0%) |
| $100,000 and over | 1,328 (94.6%) | 76 (5.4%) |
Public vs Private Health Insurance Coverage by Age in North Beach Haven
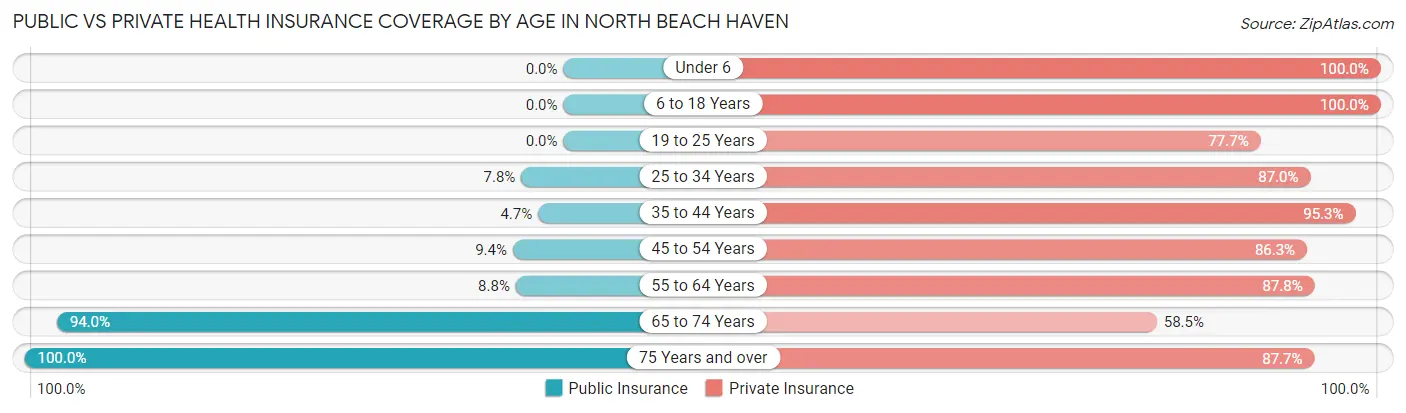
| Age Bracket | Public Insurance | Private Insurance |
| Under 6 | 0 (0.0%) | 81 (100.0%) |
| 6 to 18 Years | 0 (0.0%) | 153 (100.0%) |
| 19 to 25 Years | 0 (0.0%) | 122 (77.7%) |
| 25 to 34 Years | 9 (7.8%) | 100 (87.0%) |
| 35 to 44 Years | 6 (4.7%) | 122 (95.3%) |
| 45 to 54 Years | 24 (9.4%) | 221 (86.3%) |
| 55 to 64 Years | 39 (8.8%) | 387 (87.8%) |
| 65 to 74 Years | 566 (94.0%) | 352 (58.5%) |
| 75 Years and over | 317 (100.0%) | 278 (87.7%) |
| Total | 961 (42.7%) | 1,816 (80.7%) |
Disability Status by Sex by Age in North Beach Haven
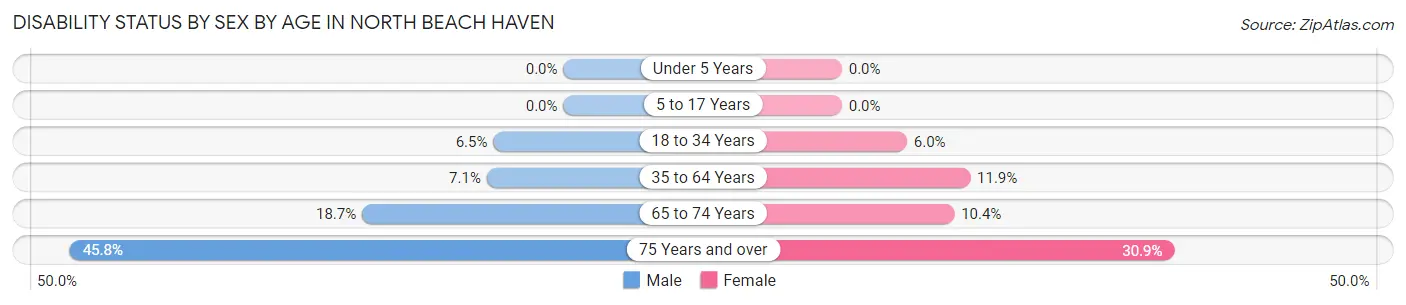
| Age Bracket | Male | Female |
| Under 5 Years | 0 (0.0%) | 0 (0.0%) |
| 5 to 17 Years | 0 (0.0%) | 0 (0.0%) |
| 18 to 34 Years | 8 (6.5%) | 9 (6.0%) |
| 35 to 64 Years | 33 (7.1%) | 43 (11.9%) |
| 65 to 74 Years | 48 (18.7%) | 36 (10.4%) |
| 75 Years and over | 71 (45.8%) | 50 (30.9%) |
Disability Class by Sex by Age in North Beach Haven
Disability Class: Hearing Difficulty
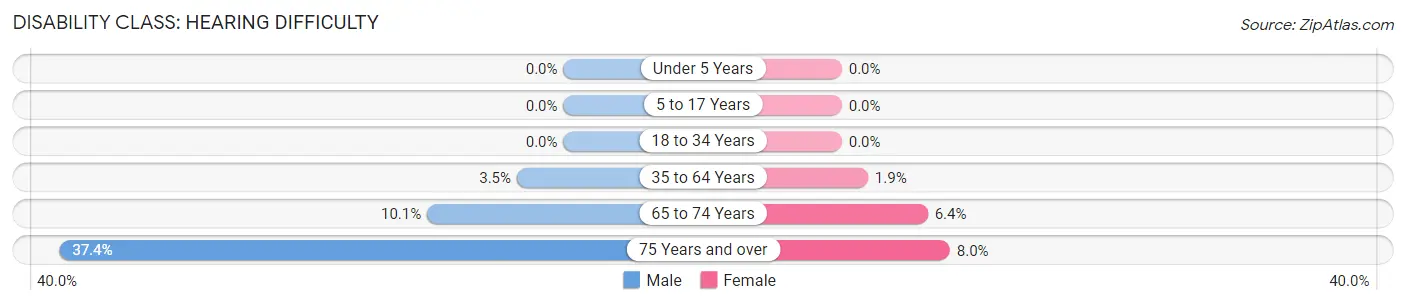
| Age Bracket | Male | Female |
| Under 5 Years | 0 (0.0%) | 0 (0.0%) |
| 5 to 17 Years | 0 (0.0%) | 0 (0.0%) |
| 18 to 34 Years | 0 (0.0%) | 0 (0.0%) |
| 35 to 64 Years | 16 (3.5%) | 7 (1.9%) |
| 65 to 74 Years | 26 (10.1%) | 22 (6.4%) |
| 75 Years and over | 58 (37.4%) | 13 (8.0%) |
Disability Class: Vision Difficulty
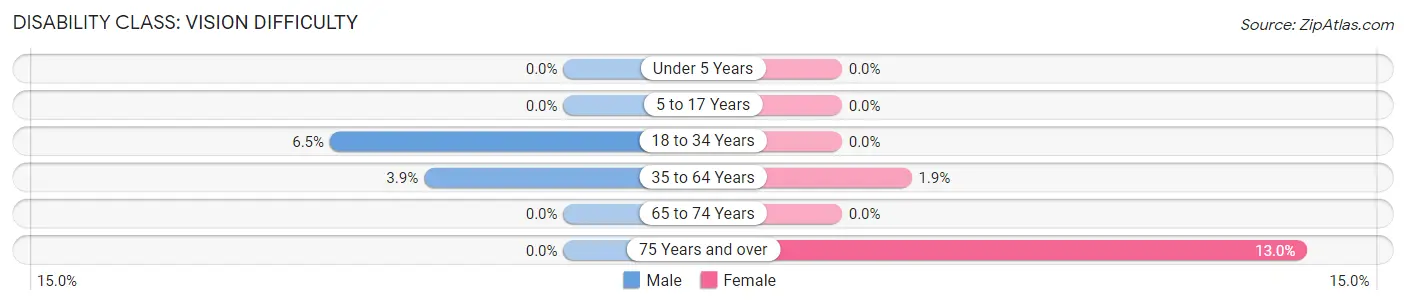
| Age Bracket | Male | Female |
| Under 5 Years | 0 (0.0%) | 0 (0.0%) |
| 5 to 17 Years | 0 (0.0%) | 0 (0.0%) |
| 18 to 34 Years | 8 (6.5%) | 0 (0.0%) |
| 35 to 64 Years | 18 (3.9%) | 7 (1.9%) |
| 65 to 74 Years | 0 (0.0%) | 0 (0.0%) |
| 75 Years and over | 0 (0.0%) | 21 (13.0%) |
Disability Class: Cognitive Difficulty
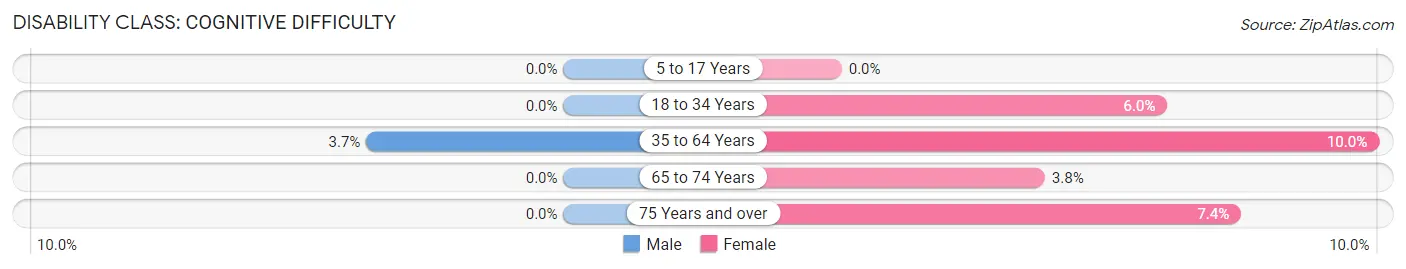
| Age Bracket | Male | Female |
| 5 to 17 Years | 0 (0.0%) | 0 (0.0%) |
| 18 to 34 Years | 0 (0.0%) | 9 (6.0%) |
| 35 to 64 Years | 17 (3.7%) | 36 (10.0%) |
| 65 to 74 Years | 0 (0.0%) | 13 (3.8%) |
| 75 Years and over | 0 (0.0%) | 12 (7.4%) |
Disability Class: Ambulatory Difficulty
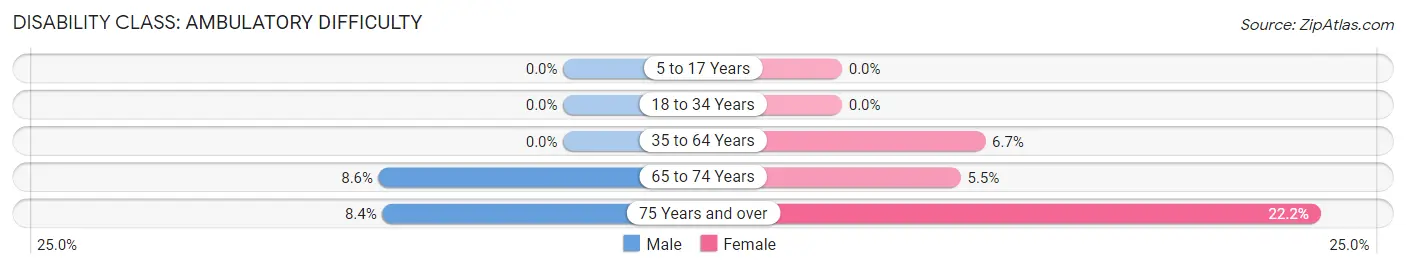
| Age Bracket | Male | Female |
| 5 to 17 Years | 0 (0.0%) | 0 (0.0%) |
| 18 to 34 Years | 0 (0.0%) | 0 (0.0%) |
| 35 to 64 Years | 0 (0.0%) | 24 (6.7%) |
| 65 to 74 Years | 22 (8.6%) | 19 (5.5%) |
| 75 Years and over | 13 (8.4%) | 36 (22.2%) |
Disability Class: Self-Care Difficulty
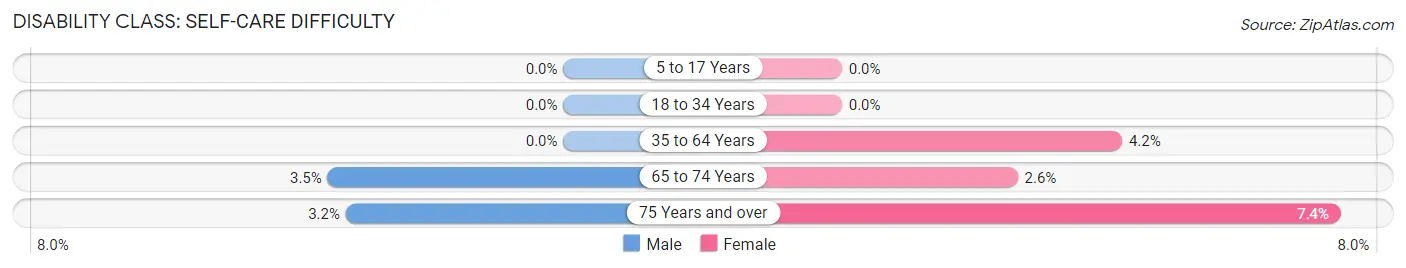
| Age Bracket | Male | Female |
| 5 to 17 Years | 0 (0.0%) | 0 (0.0%) |
| 18 to 34 Years | 0 (0.0%) | 0 (0.0%) |
| 35 to 64 Years | 0 (0.0%) | 15 (4.2%) |
| 65 to 74 Years | 9 (3.5%) | 9 (2.6%) |
| 75 Years and over | 5 (3.2%) | 12 (7.4%) |
Technology Access in North Beach Haven
Computing Device Access in North Beach Haven
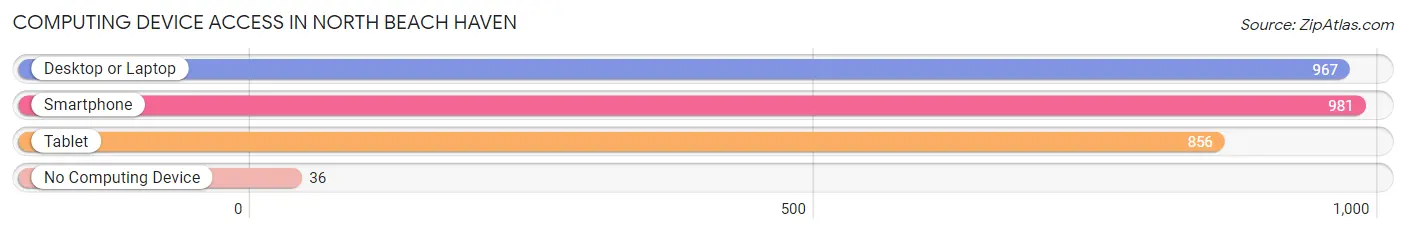
| Device Type | # Households | % Households |
| Desktop or Laptop | 967 | 88.2% |
| Smartphone | 981 | 89.5% |
| Tablet | 856 | 78.1% |
| No Computing Device | 36 | 3.3% |
| Total | 1,096 | 100.0% |
Internet Access in North Beach Haven
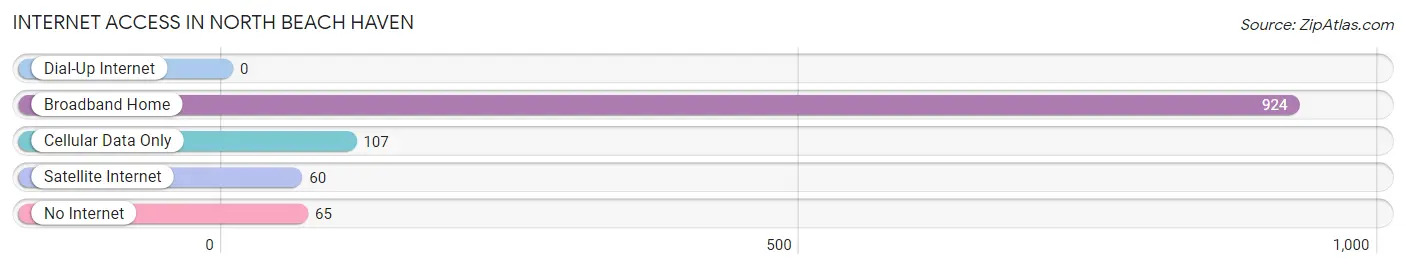
| Internet Type | # Households | % Households |
| Dial-Up Internet | 0 | 0.0% |
| Broadband Home | 924 | 84.3% |
| Cellular Data Only | 107 | 9.8% |
| Satellite Internet | 60 | 5.5% |
| No Internet | 65 | 5.9% |
| Total | 1,096 | 100.0% |
North Beach Haven Summary
History
North Beach Haven is a small borough located in Ocean County, New Jersey. It is situated on Long Beach Island, a barrier island off the coast of New Jersey. The borough was incorporated in 1906 and is one of the oldest communities on the island.
The area was first settled by the Lenni Lenape Native Americans, who called the island “Manahawkin”, meaning “land of good corn”. The first European settlers arrived in the late 1600s, and the area was known as “Beach Haven”. In the early 1800s, the area was a popular destination for wealthy New Yorkers, who built large summer homes along the beach.
In the late 1800s, the area began to develop as a resort destination. The first hotel, the Beach Haven Hotel, was built in 1878. The hotel was a popular destination for wealthy families from New York and Philadelphia.
In 1906, the area was incorporated as the Borough of North Beach Haven. The borough was named after the nearby North Beach, which was a popular spot for swimming and fishing.
Geography
North Beach Haven is located on Long Beach Island, a barrier island off the coast of New Jersey. The borough is situated between the Atlantic Ocean and Barnegat Bay. The borough is bordered by the boroughs of Beach Haven to the south and Ship Bottom to the north.
The borough covers an area of 1.2 square miles and is home to approximately 1,500 people. The borough is divided into two sections, North Beach Haven and South Beach Haven. The borough is home to several beaches, including North Beach, South Beach, and Haven Beach.
Economy
North Beach Haven is a popular tourist destination, and the local economy is largely driven by tourism. The borough is home to several hotels, restaurants, and shops. The borough also has a thriving fishing industry, with several charter boats offering deep sea fishing trips.
The borough is also home to several marinas, which offer boat rentals and other services. The borough is also home to several art galleries, which feature works by local artists.
Demographics
As of the 2010 census, North Beach Haven had a population of 1,521. The racial makeup of the borough was 94.3% White, 1.2% African American, 0.2% Native American, 0.7% Asian, 0.1% Pacific Islander, 1.7% from other races, and 1.7% from two or more races. Hispanic or Latino of any race were 4.2% of the population.
The median household income in North Beach Haven was $63,750, and the median family income was $76,250. The per capita income for the borough was $35,945. About 4.3% of families and 6.2% of the population were below the poverty line, including 8.3% of those under age 18 and 4.2% of those age 65 or over.
Common Questions
What is Per Capita Income in North Beach Haven?
Per Capita income in North Beach Haven is $79,255.
What is the Median Family Income in North Beach Haven?
Median Family Income in North Beach Haven is $126,161.
What is the Median Household income in North Beach Haven?
Median Household Income in North Beach Haven is $104,183.
What is Income or Wage Gap in North Beach Haven?
Income or Wage Gap in North Beach Haven is 41.3%.
Women in North Beach Haven earn 58.7 cents for every dollar earned by a man.
What is Inequality or Gini Index in North Beach Haven?
Inequality or Gini Index in North Beach Haven is 0.50.
What is the Total Population of North Beach Haven?
Total Population of North Beach Haven is 2,250.
What is the Total Male Population of North Beach Haven?
Total Male Population of North Beach Haven is 1,168.
What is the Total Female Population of North Beach Haven?
Total Female Population of North Beach Haven is 1,082.
What is the Ratio of Males per 100 Females in North Beach Haven?
There are 107.95 Males per 100 Females in North Beach Haven.
What is the Ratio of Females per 100 Males in North Beach Haven?
There are 92.64 Females per 100 Males in North Beach Haven.
What is the Median Population Age in North Beach Haven?
Median Population Age in North Beach Haven is 59.0 Years.
What is the Average Family Size in North Beach Haven
Average Family Size in North Beach Haven is 2.7 People.
What is the Average Household Size in North Beach Haven
Average Household Size in North Beach Haven is 2.0 People.
How Large is the Labor Force in North Beach Haven?
There are 1,089 People in the Labor Forcein in North Beach Haven.
What is the Percentage of People in the Labor Force in North Beach Haven?
53.0% of People are in the Labor Force in North Beach Haven.
What is the Unemployment Rate in North Beach Haven?
Unemployment Rate in North Beach Haven is 10.7%.