Lavallette borough, NJ Map & Demographics
Lavallette borough Overview
$80,917
PER CAPITA INCOME
$131,851
AVG FAMILY INCOME
$108,750
AVG HOUSEHOLD INCOME
18.8%
WAGE / INCOME GAP [ % ]
81.2¢/ $1
WAGE / INCOME GAP [ $ ]
0.53
INEQUALITY / GINI INDEX
2,036
TOTAL POPULATION
951
MALE POPULATION
1,085
FEMALE POPULATION
87.65
MALES / 100 FEMALES
114.09
FEMALES / 100 MALES
61.5
MEDIAN AGE
2.5
AVG FAMILY SIZE
2.1
AVG HOUSEHOLD SIZE
869
LABOR FORCE [ PEOPLE ]
48.4%
PERCENT IN LABOR FORCE
1.2%
UNEMPLOYMENT RATE
Income in Lavallette borough
Income Overview in Lavallette borough
Per Capita Income in Lavallette borough is $80,917, while median incomes of families and households are $131,851 and $108,750 respectively.
| Characteristic | Number | Measure |
| Per Capita Income | 2,036 | $80,917 |
| Median Family Income | 664 | $131,851 |
| Mean Family Income | 664 | $211,364 |
| Median Household Income | 971 | $108,750 |
| Mean Household Income | 971 | $169,047 |
| Income Deficit | 664 | $0 |
| Wage / Income Gap (%) | 2,036 | 18.80% |
| Wage / Income Gap ($) | 2,036 | 81.20¢ per $1 |
| Gini / Inequality Index | 2,036 | 0.53 |
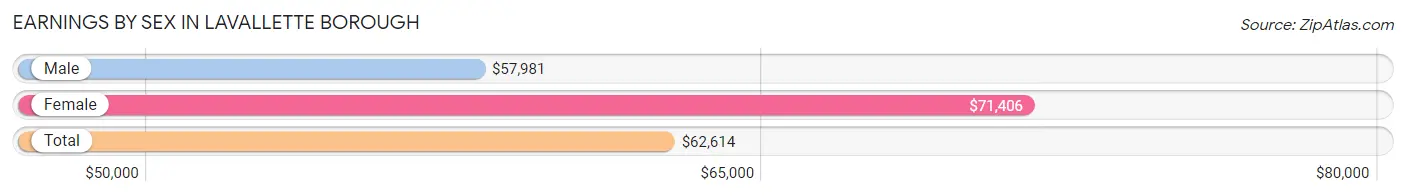
Earnings by Sex in Lavallette borough
Average Earnings in Lavallette borough are $62,614, $57,981 for men and $71,406 for women, a difference of 18.8%.
| Sex | Number | Average Earnings |
| Male | 487 (51.4%) | $57,981 |
| Female | 460 (48.6%) | $71,406 |
| Total | 947 (100.0%) | $62,614 |
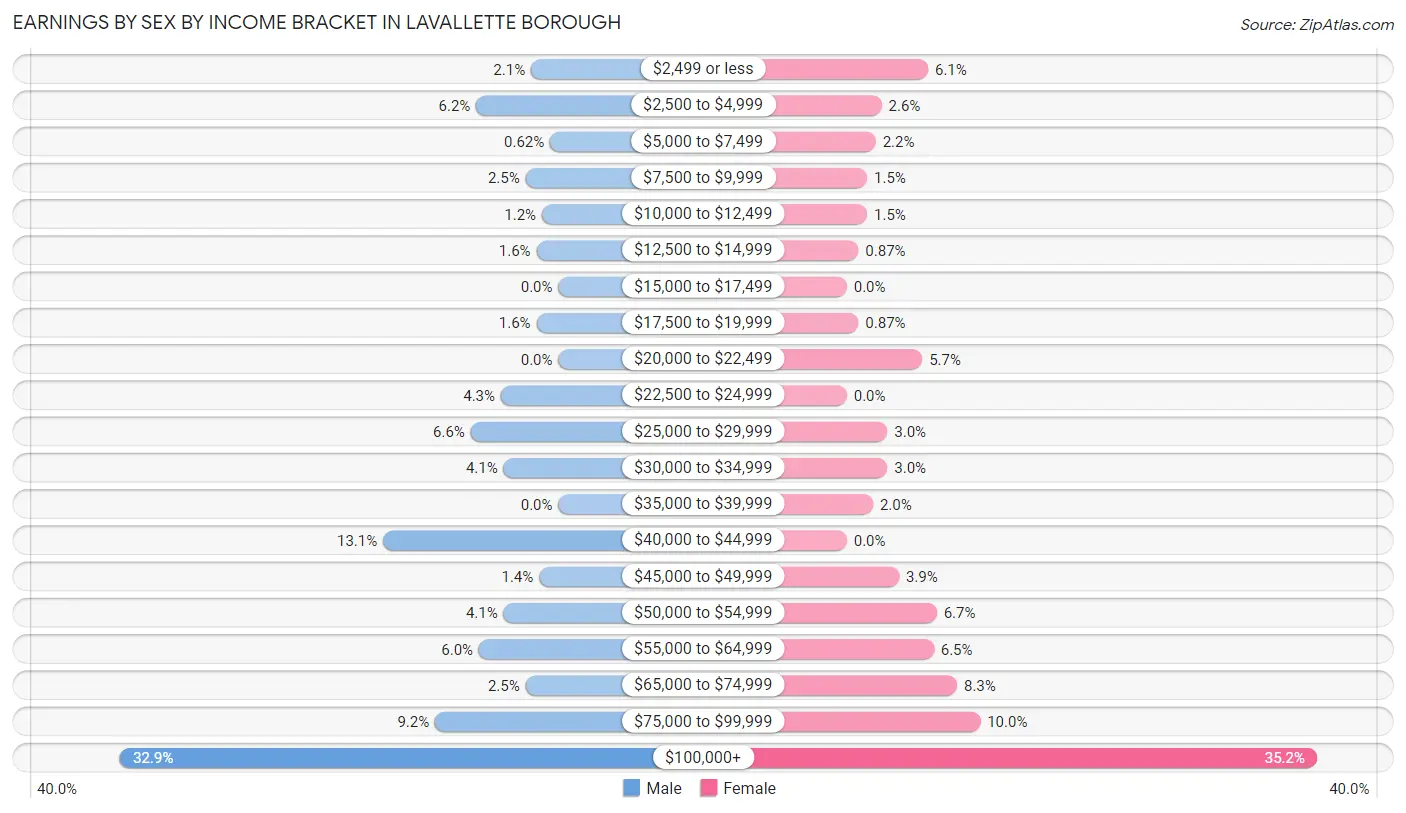
Earnings by Sex by Income Bracket in Lavallette borough
The most common earnings brackets in Lavallette borough are $100,000+ for men (160 | 32.9%) and $100,000+ for women (162 | 35.2%).
| Income | Male | Female |
| $2,499 or less | 10 (2.1%) | 28 (6.1%) |
| $2,500 to $4,999 | 30 (6.2%) | 12 (2.6%) |
| $5,000 to $7,499 | 3 (0.6%) | 10 (2.2%) |
| $7,500 to $9,999 | 12 (2.5%) | 7 (1.5%) |
| $10,000 to $12,499 | 6 (1.2%) | 7 (1.5%) |
| $12,500 to $14,999 | 8 (1.6%) | 4 (0.9%) |
| $15,000 to $17,499 | 0 (0.0%) | 0 (0.0%) |
| $17,500 to $19,999 | 8 (1.6%) | 4 (0.9%) |
| $20,000 to $22,499 | 0 (0.0%) | 26 (5.7%) |
| $22,500 to $24,999 | 21 (4.3%) | 0 (0.0%) |
| $25,000 to $29,999 | 32 (6.6%) | 14 (3.0%) |
| $30,000 to $34,999 | 20 (4.1%) | 14 (3.0%) |
| $35,000 to $39,999 | 0 (0.0%) | 9 (2.0%) |
| $40,000 to $44,999 | 64 (13.1%) | 0 (0.0%) |
| $45,000 to $49,999 | 7 (1.4%) | 18 (3.9%) |
| $50,000 to $54,999 | 20 (4.1%) | 31 (6.7%) |
| $55,000 to $64,999 | 29 (5.9%) | 30 (6.5%) |
| $65,000 to $74,999 | 12 (2.5%) | 38 (8.3%) |
| $75,000 to $99,999 | 45 (9.2%) | 46 (10.0%) |
| $100,000+ | 160 (32.9%) | 162 (35.2%) |
| Total | 487 (100.0%) | 460 (100.0%) |
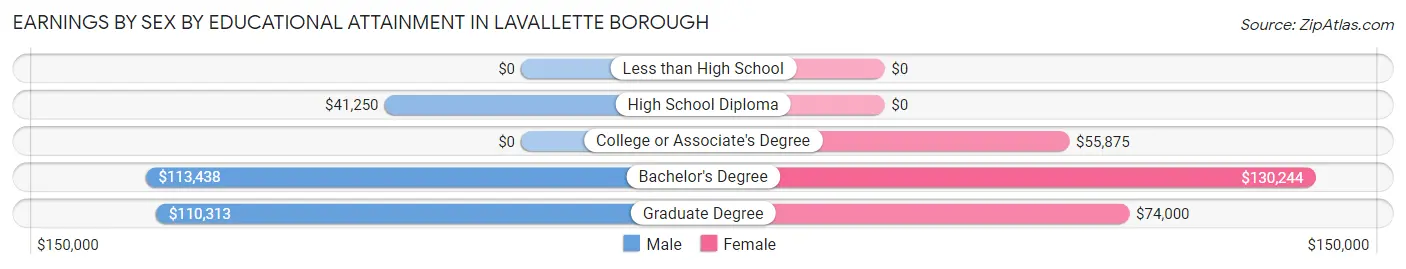
Earnings by Sex by Educational Attainment in Lavallette borough
Average earnings in Lavallette borough are $66,250 for men and $74,000 for women, a difference of 10.5%. Men with an educational attainment of bachelor's degree enjoy the highest average annual earnings of $113,438, while those with high school diploma education earn the least with $41,250. Women with an educational attainment of bachelor's degree earn the most with the average annual earnings of $130,244, while those with college or associate's degree education have the smallest earnings of $55,875.
| Educational Attainment | Male Income | Female Income |
| Less than High School | - | - |
| High School Diploma | $41,250 | $0 |
| College or Associate's Degree | - | - |
| Bachelor's Degree | $113,438 | $130,244 |
| Graduate Degree | $110,313 | $74,000 |
| Total | $66,250 | $74,000 |
Family Income in Lavallette borough
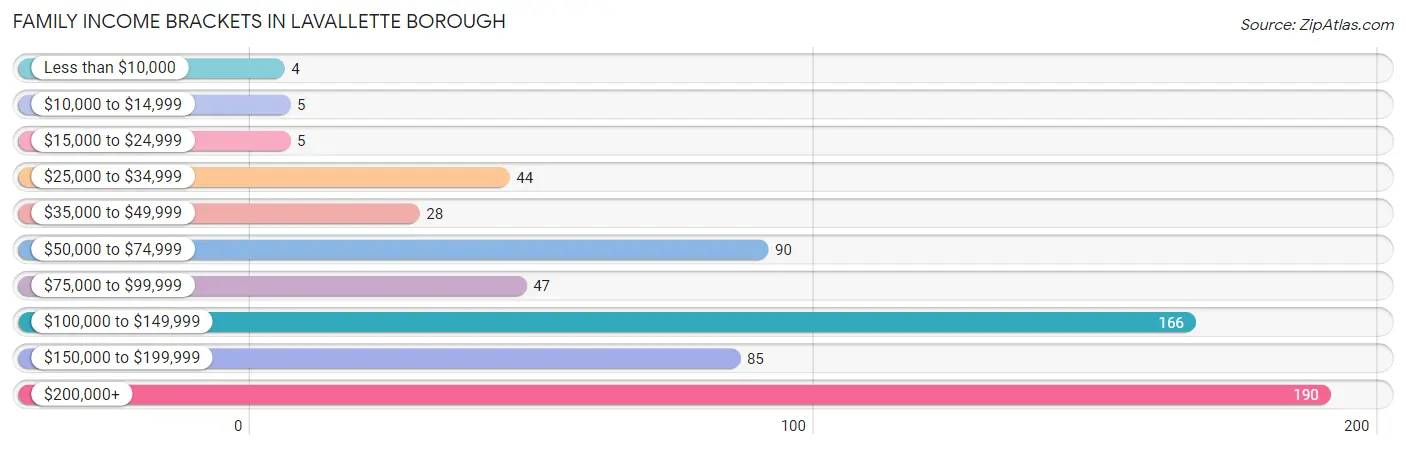
Family Income Brackets in Lavallette borough
According to the Lavallette borough family income data, there are 190 families falling into the $200,000+ income range, which is the most common income bracket and makes up 28.6% of all families. Conversely, the less than $10,000 income bracket is the least frequent group with only 4 families (0.6%) belonging to this category.
| Income Bracket | # Families | % Families |
| Less than $10,000 | 4 | 0.6% |
| $10,000 to $14,999 | 5 | 0.8% |
| $15,000 to $24,999 | 5 | 0.8% |
| $25,000 to $34,999 | 44 | 6.6% |
| $35,000 to $49,999 | 28 | 4.2% |
| $50,000 to $74,999 | 90 | 13.6% |
| $75,000 to $99,999 | 47 | 7.1% |
| $100,000 to $149,999 | 166 | 25.0% |
| $150,000 to $199,999 | 85 | 12.8% |
| $200,000+ | 190 | 28.6% |
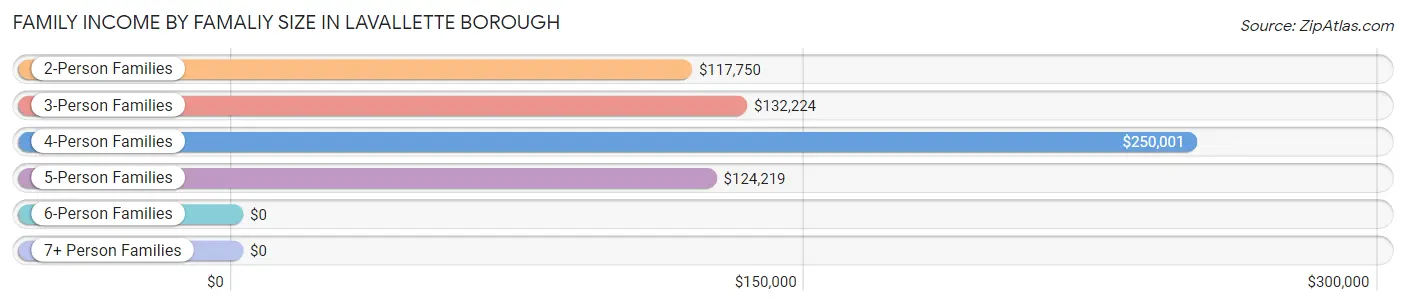
Family Income by Famaliy Size in Lavallette borough
4-person families (29 | 4.4%) account for the highest median family income in Lavallette borough with $250,001 per family, while 4-person families (29 | 4.4%) have the highest median income of $62,500 per family member.
| Income Bracket | # Families | Median Income |
| 2-Person Families | 457 (68.8%) | $117,750 |
| 3-Person Families | 163 (24.5%) | $132,224 |
| 4-Person Families | 29 (4.4%) | $250,001 |
| 5-Person Families | 15 (2.3%) | $124,219 |
| 6-Person Families | 0 (0.0%) | $0 |
| 7+ Person Families | 0 (0.0%) | $0 |
| Total | 664 (100.0%) | $131,851 |
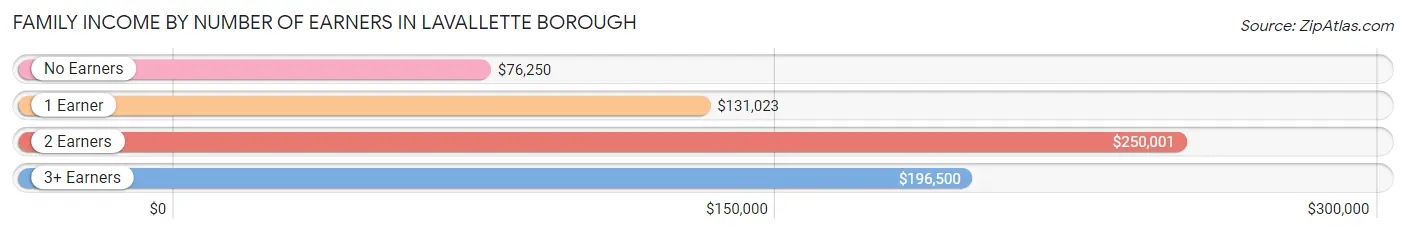
Family Income by Number of Earners in Lavallette borough
The median family income in Lavallette borough is $131,851, with families comprising 2 earners (143) having the highest median family income of $250,001, while families with no earners (222) have the lowest median family income of $76,250, accounting for 21.5% and 33.4% of families, respectively.
| Number of Earners | # Families | Median Income |
| No Earners | 222 (33.4%) | $76,250 |
| 1 Earner | 239 (36.0%) | $131,023 |
| 2 Earners | 143 (21.5%) | $250,001 |
| 3+ Earners | 60 (9.0%) | $196,500 |
| Total | 664 (100.0%) | $131,851 |
Household Income in Lavallette borough
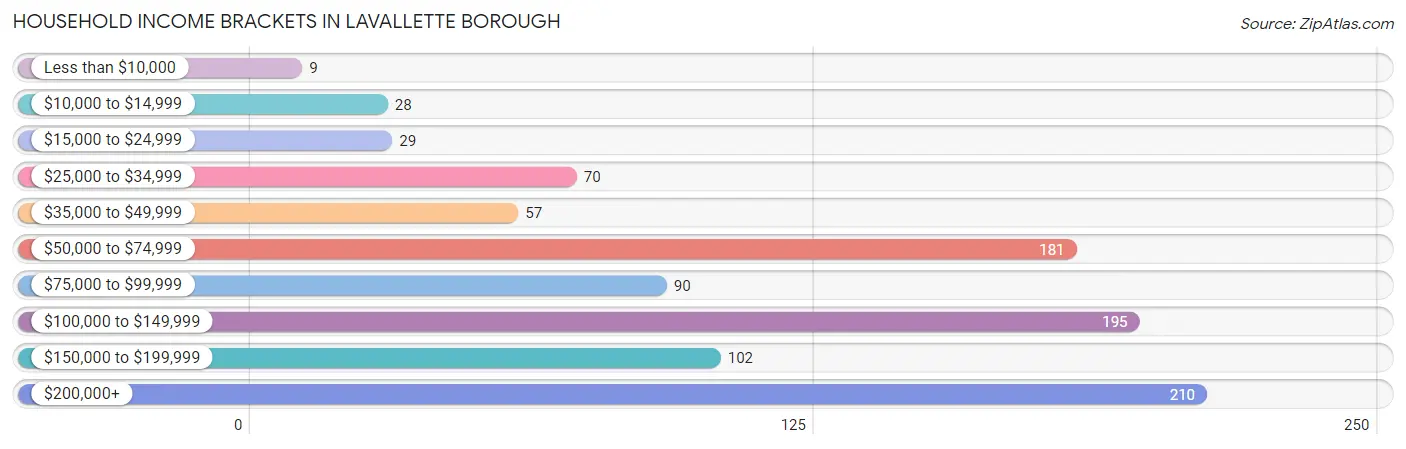
Household Income Brackets in Lavallette borough
With 210 households falling in the category, the $200,000+ income range is the most frequent in Lavallette borough, accounting for 21.6% of all households. In contrast, only 9 households (0.9%) fall into the less than $10,000 income bracket, making it the least populous group.
| Income Bracket | # Households | % Households |
| Less than $10,000 | 9 | 0.9% |
| $10,000 to $14,999 | 28 | 2.9% |
| $15,000 to $24,999 | 29 | 3.0% |
| $25,000 to $34,999 | 70 | 7.2% |
| $35,000 to $49,999 | 57 | 5.9% |
| $50,000 to $74,999 | 181 | 18.6% |
| $75,000 to $99,999 | 90 | 9.3% |
| $100,000 to $149,999 | 195 | 20.1% |
| $150,000 to $199,999 | 102 | 10.5% |
| $200,000+ | 210 | 21.6% |
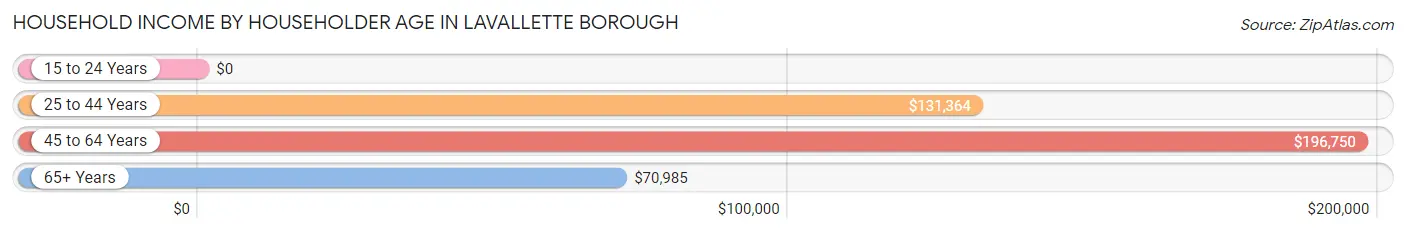
Household Income by Householder Age in Lavallette borough
The median household income in Lavallette borough is $108,750, with the highest median household income of $196,750 found in the 45 to 64 years age bracket for the primary householder. A total of 327 households (33.7%) fall into this category. Meanwhile, the 15 to 24 years age bracket for the primary householder has the lowest median household income of $0, with 20 households (2.1%) in this group.
| Income Bracket | # Households | Median Income |
| 15 to 24 Years | 20 (2.1%) | $0 |
| 25 to 44 Years | 106 (10.9%) | $131,364 |
| 45 to 64 Years | 327 (33.7%) | $196,750 |
| 65+ Years | 518 (53.3%) | $70,985 |
| Total | 971 (100.0%) | $108,750 |
Poverty in Lavallette borough
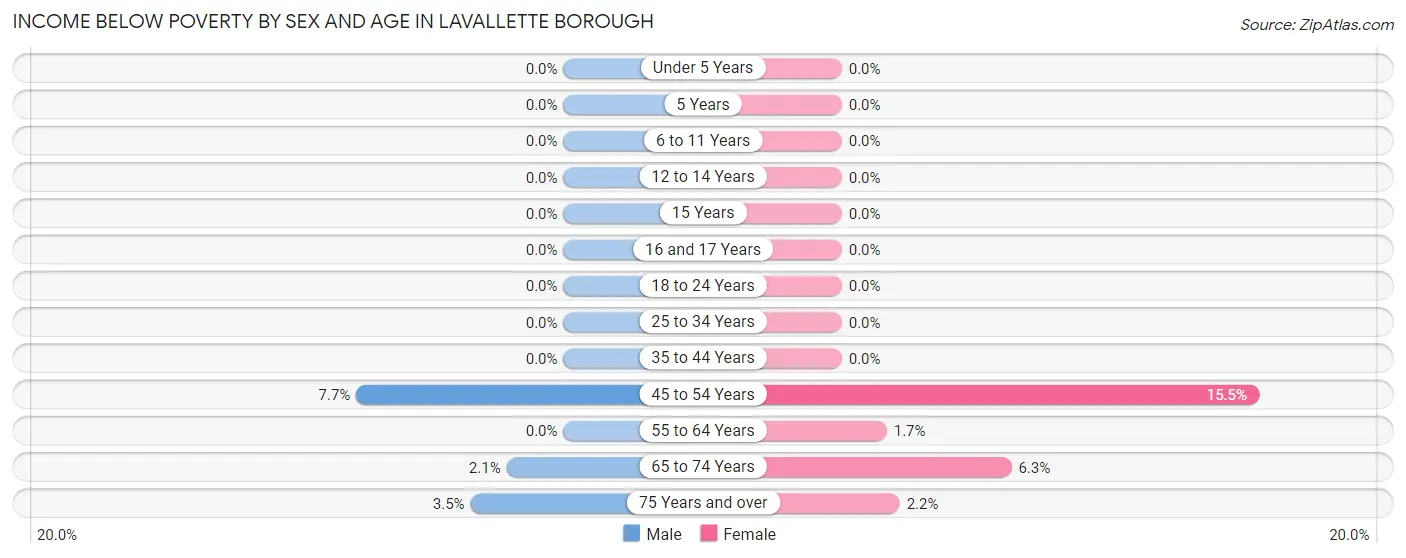
Income Below Poverty by Sex and Age in Lavallette borough
With 1.5% poverty level for males and 3.4% for females among the residents of Lavallette borough, 45 to 54 year old males and 45 to 54 year old females are the most vulnerable to poverty, with 5 males (7.7%) and 13 females (15.5%) in their respective age groups living below the poverty level.
| Age Bracket | Male | Female |
| Under 5 Years | 0 (0.0%) | 0 (0.0%) |
| 5 Years | 0 (0.0%) | 0 (0.0%) |
| 6 to 11 Years | 0 (0.0%) | 0 (0.0%) |
| 12 to 14 Years | 0 (0.0%) | 0 (0.0%) |
| 15 Years | 0 (0.0%) | 0 (0.0%) |
| 16 and 17 Years | 0 (0.0%) | 0 (0.0%) |
| 18 to 24 Years | 0 (0.0%) | 0 (0.0%) |
| 25 to 34 Years | 0 (0.0%) | 0 (0.0%) |
| 35 to 44 Years | 0 (0.0%) | 0 (0.0%) |
| 45 to 54 Years | 5 (7.7%) | 13 (15.5%) |
| 55 to 64 Years | 0 (0.0%) | 4 (1.7%) |
| 65 to 74 Years | 4 (2.1%) | 15 (6.3%) |
| 75 Years and over | 5 (3.5%) | 5 (2.1%) |
| Total | 14 (1.5%) | 37 (3.4%) |
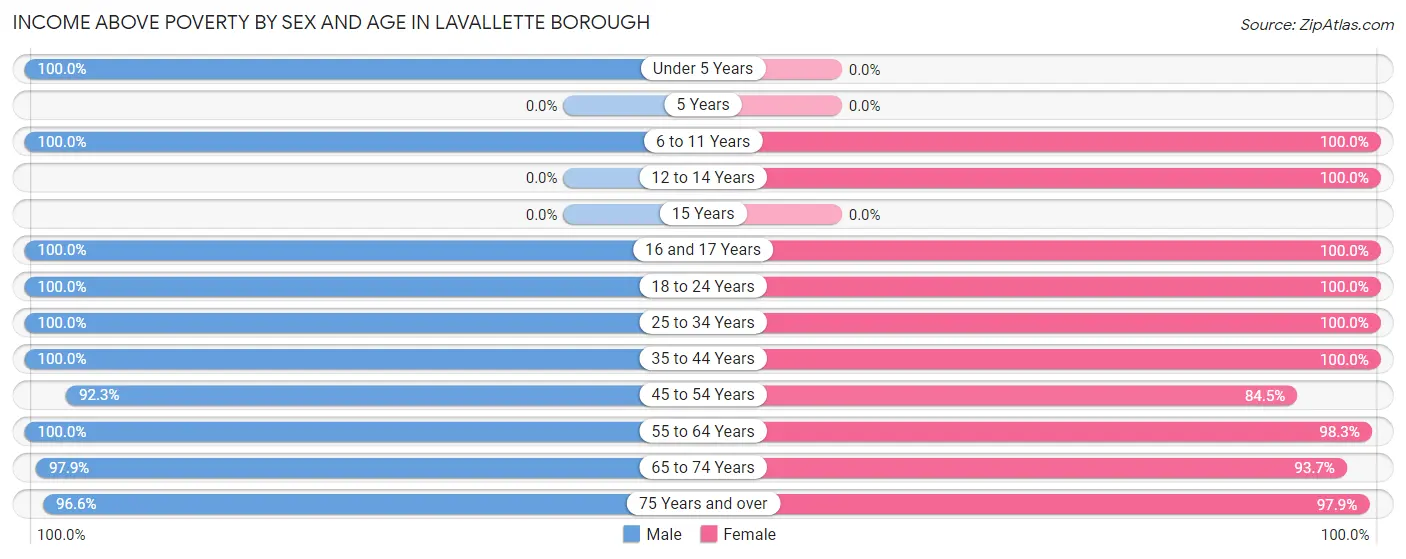
Income Above Poverty by Sex and Age in Lavallette borough
According to the poverty statistics in Lavallette borough, males aged under 5 years and females aged 6 to 11 years are the age groups that are most secure financially, with 100.0% of males and 100.0% of females in these age groups living above the poverty line.
| Age Bracket | Male | Female |
| Under 5 Years | 146 (100.0%) | 0 (0.0%) |
| 5 Years | 0 (0.0%) | 0 (0.0%) |
| 6 to 11 Years | 9 (100.0%) | 74 (100.0%) |
| 12 to 14 Years | 0 (0.0%) | 12 (100.0%) |
| 15 Years | 0 (0.0%) | 0 (0.0%) |
| 16 and 17 Years | 15 (100.0%) | 5 (100.0%) |
| 18 to 24 Years | 59 (100.0%) | 40 (100.0%) |
| 25 to 34 Years | 28 (100.0%) | 46 (100.0%) |
| 35 to 44 Years | 50 (100.0%) | 114 (100.0%) |
| 45 to 54 Years | 60 (92.3%) | 71 (84.5%) |
| 55 to 64 Years | 244 (100.0%) | 235 (98.3%) |
| 65 to 74 Years | 186 (97.9%) | 223 (93.7%) |
| 75 Years and over | 140 (96.6%) | 228 (97.9%) |
| Total | 937 (98.5%) | 1,048 (96.6%) |
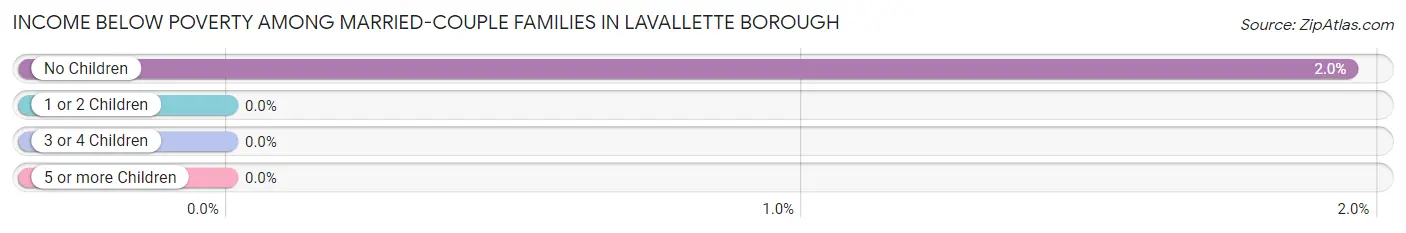
Income Below Poverty Among Married-Couple Families in Lavallette borough
The poverty statistics for married-couple families in Lavallette borough show that 1.8% or 9 of the total 492 families live below the poverty line. Families with no children have the highest poverty rate of 1.9%, comprising of 9 families. On the other hand, families with 1 or 2 children have the lowest poverty rate of 0.0%, which includes 0 families.
| Children | Above Poverty | Below Poverty |
| No Children | 452 (98.1%) | 9 (1.9%) |
| 1 or 2 Children | 31 (100.0%) | 0 (0.0%) |
| 3 or 4 Children | 0 (0.0%) | 0 (0.0%) |
| 5 or more Children | 0 (0.0%) | 0 (0.0%) |
| Total | 483 (98.2%) | 9 (1.8%) |
Income Below Poverty Among Single-Parent Households in Lavallette borough
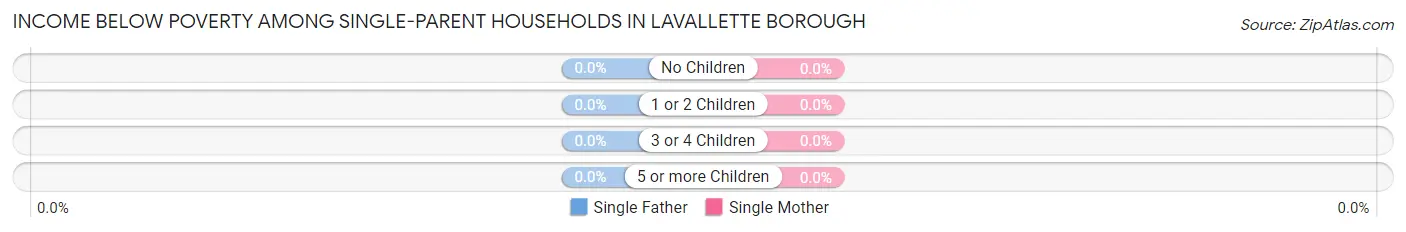
| Children | Single Father | Single Mother |
| No Children | 0 (0.0%) | 0 (0.0%) |
| 1 or 2 Children | 0 (0.0%) | 0 (0.0%) |
| 3 or 4 Children | 0 (0.0%) | 0 (0.0%) |
| 5 or more Children | 0 (0.0%) | 0 (0.0%) |
| Total | 0 (0.0%) | 0 (0.0%) |
Income Below Poverty Among Married-Couple vs Single-Parent Households in Lavallette borough
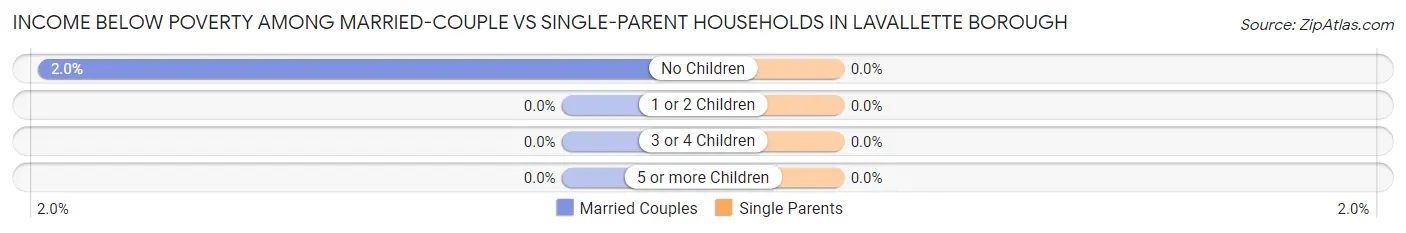
| Children | Married-Couple Families | Single-Parent Households |
| No Children | 9 (1.9%) | 0 (0.0%) |
| 1 or 2 Children | 0 (0.0%) | 0 (0.0%) |
| 3 or 4 Children | 0 (0.0%) | 0 (0.0%) |
| 5 or more Children | 0 (0.0%) | 0 (0.0%) |
| Total | 9 (1.8%) | 0 (0.0%) |
Race in Lavallette borough
The most populous races in Lavallette borough are White / Caucasian (1,946 | 95.6%), Two or more Races (83 | 4.1%), and Hispanic or Latino (41 | 2.0%).
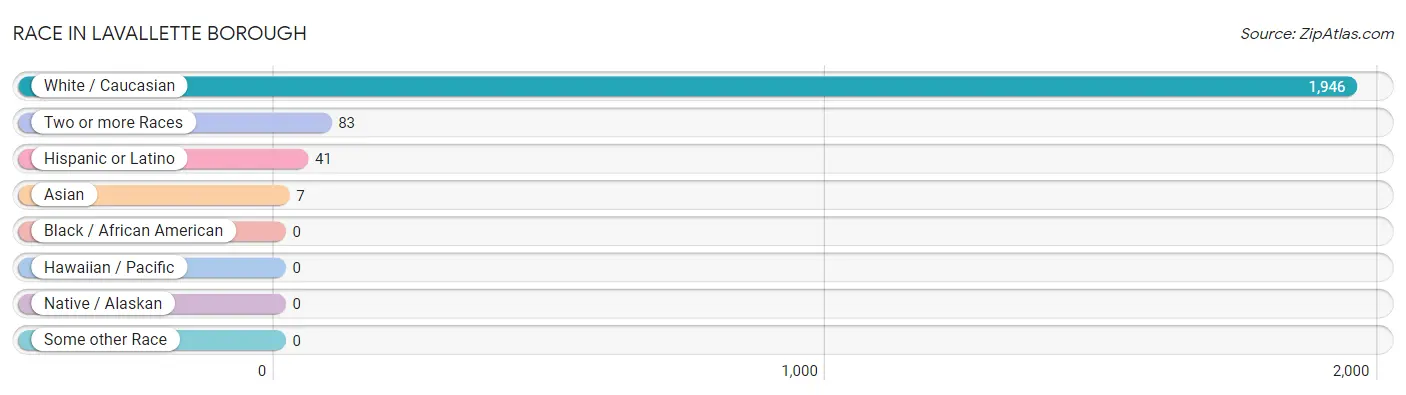
| Race | # Population | % Population |
| Asian | 7 | 0.3% |
| Black / African American | 0 | 0.0% |
| Hawaiian / Pacific | 0 | 0.0% |
| Hispanic or Latino | 41 | 2.0% |
| Native / Alaskan | 0 | 0.0% |
| White / Caucasian | 1,946 | 95.6% |
| Two or more Races | 83 | 4.1% |
| Some other Race | 0 | 0.0% |
| Total | 2,036 | 100.0% |
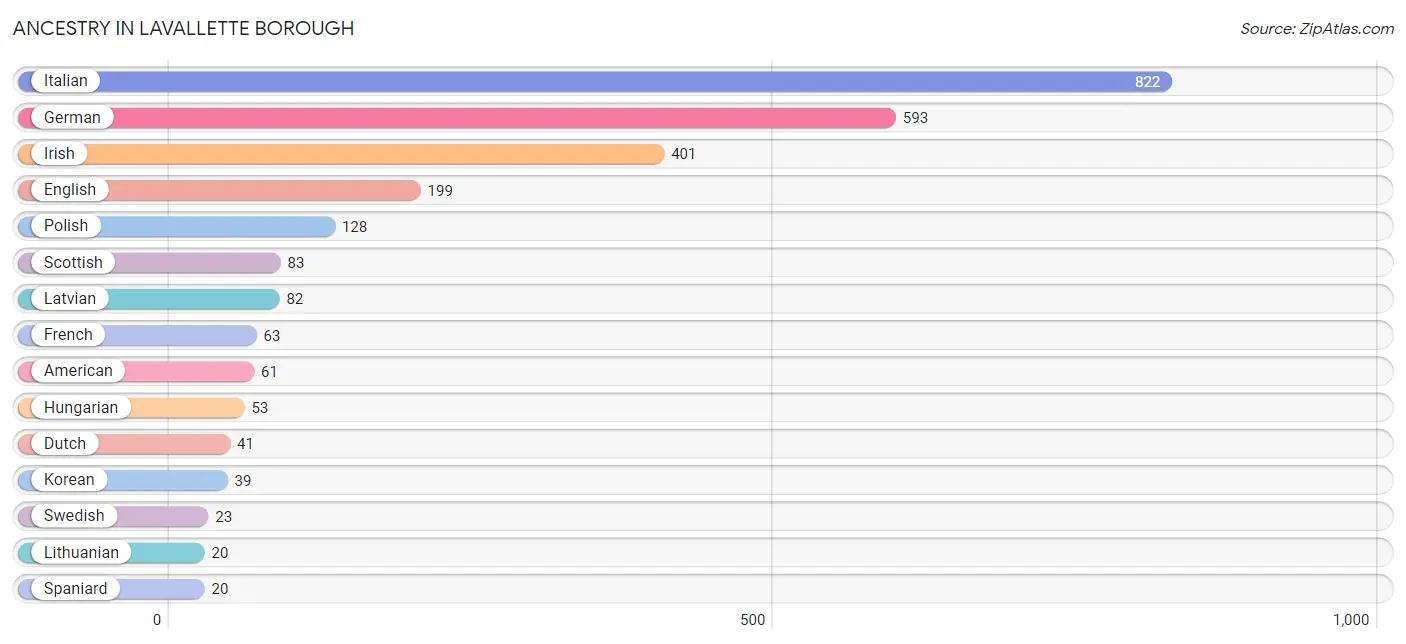
Ancestry in Lavallette borough
The most populous ancestries reported in Lavallette borough are Italian (822 | 40.4%), German (593 | 29.1%), Irish (401 | 19.7%), English (199 | 9.8%), and Polish (128 | 6.3%), together accounting for 105.3% of all Lavallette borough residents.
| Ancestry | # Population | % Population |
| American | 61 | 3.0% |
| Arab | 7 | 0.3% |
| Austrian | 3 | 0.2% |
| Cherokee | 4 | 0.2% |
| Croatian | 16 | 0.8% |
| Cuban | 8 | 0.4% |
| Czech | 9 | 0.4% |
| Dutch | 41 | 2.0% |
| Eastern European | 9 | 0.4% |
| English | 199 | 9.8% |
| European | 10 | 0.5% |
| French | 63 | 3.1% |
| German | 593 | 29.1% |
| Ghanaian | 9 | 0.4% |
| Hungarian | 53 | 2.6% |
| Irish | 401 | 19.7% |
| Italian | 822 | 40.4% |
| Korean | 39 | 1.9% |
| Latvian | 82 | 4.0% |
| Lebanese | 5 | 0.3% |
| Lithuanian | 20 | 1.0% |
| Polish | 128 | 6.3% |
| Portuguese | 6 | 0.3% |
| Puerto Rican | 13 | 0.6% |
| Russian | 14 | 0.7% |
| Samoan | 7 | 0.3% |
| Scandinavian | 3 | 0.2% |
| Scottish | 83 | 4.1% |
| Slovak | 8 | 0.4% |
| Spaniard | 20 | 1.0% |
| Subsaharan African | 9 | 0.4% |
| Swedish | 23 | 1.1% |
| Swiss | 5 | 0.3% |
| Syrian | 2 | 0.1% |
| Trinidadian and Tobagonian | 6 | 0.3% |
| Ukrainian | 16 | 0.8% |
| Welsh | 5 | 0.3% | View All 37 Rows |
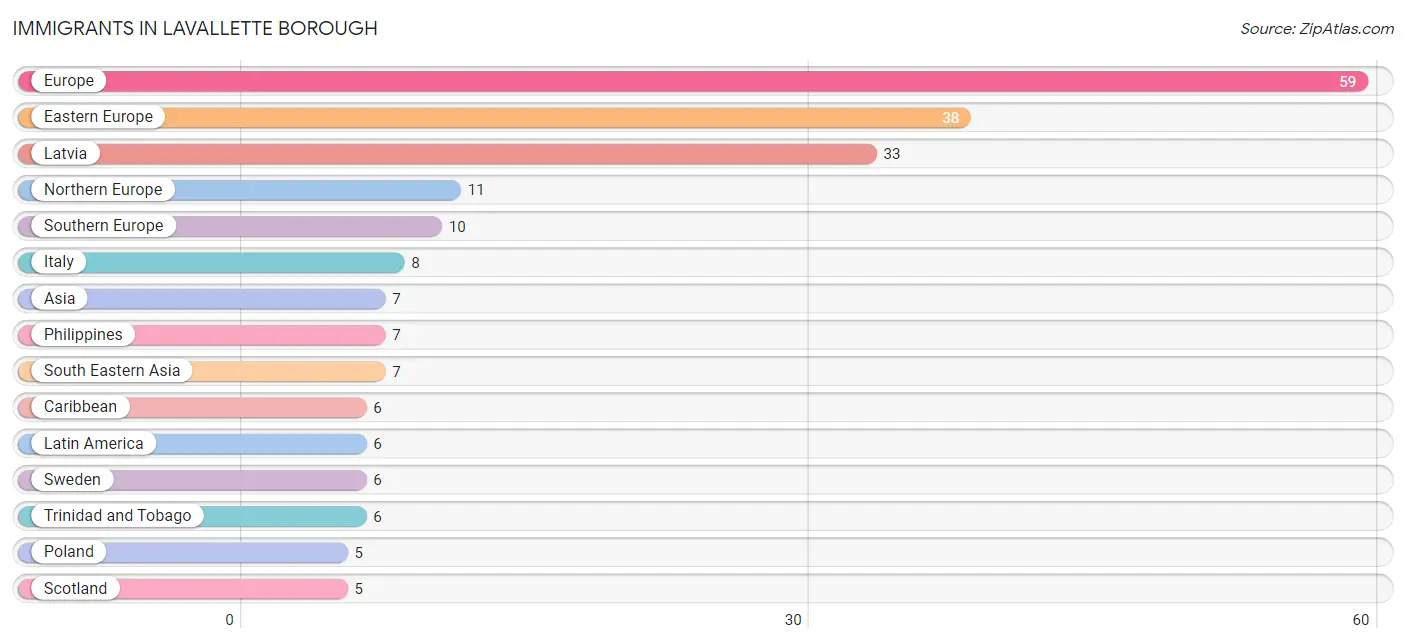
Immigrants in Lavallette borough
The most numerous immigrant groups reported in Lavallette borough came from Europe (59 | 2.9%), Eastern Europe (38 | 1.9%), Latvia (33 | 1.6%), Northern Europe (11 | 0.5%), and Southern Europe (10 | 0.5%), together accounting for 7.4% of all Lavallette borough residents.
| Immigration Origin | # Population | % Population |
| Asia | 7 | 0.3% |
| Caribbean | 6 | 0.3% |
| Eastern Europe | 38 | 1.9% |
| Europe | 59 | 2.9% |
| Italy | 8 | 0.4% |
| Latin America | 6 | 0.3% |
| Latvia | 33 | 1.6% |
| Northern Europe | 11 | 0.5% |
| Philippines | 7 | 0.3% |
| Poland | 5 | 0.3% |
| Portugal | 2 | 0.1% |
| Scotland | 5 | 0.3% |
| South Eastern Asia | 7 | 0.3% |
| Southern Europe | 10 | 0.5% |
| Sweden | 6 | 0.3% |
| Trinidad and Tobago | 6 | 0.3% | View All 16 Rows |
Sex and Age in Lavallette borough
Sex and Age in Lavallette borough
The most populous age groups in Lavallette borough are 60 to 64 Years (156 | 16.4%) for men and 70 to 74 Years (125 | 11.5%) for women.
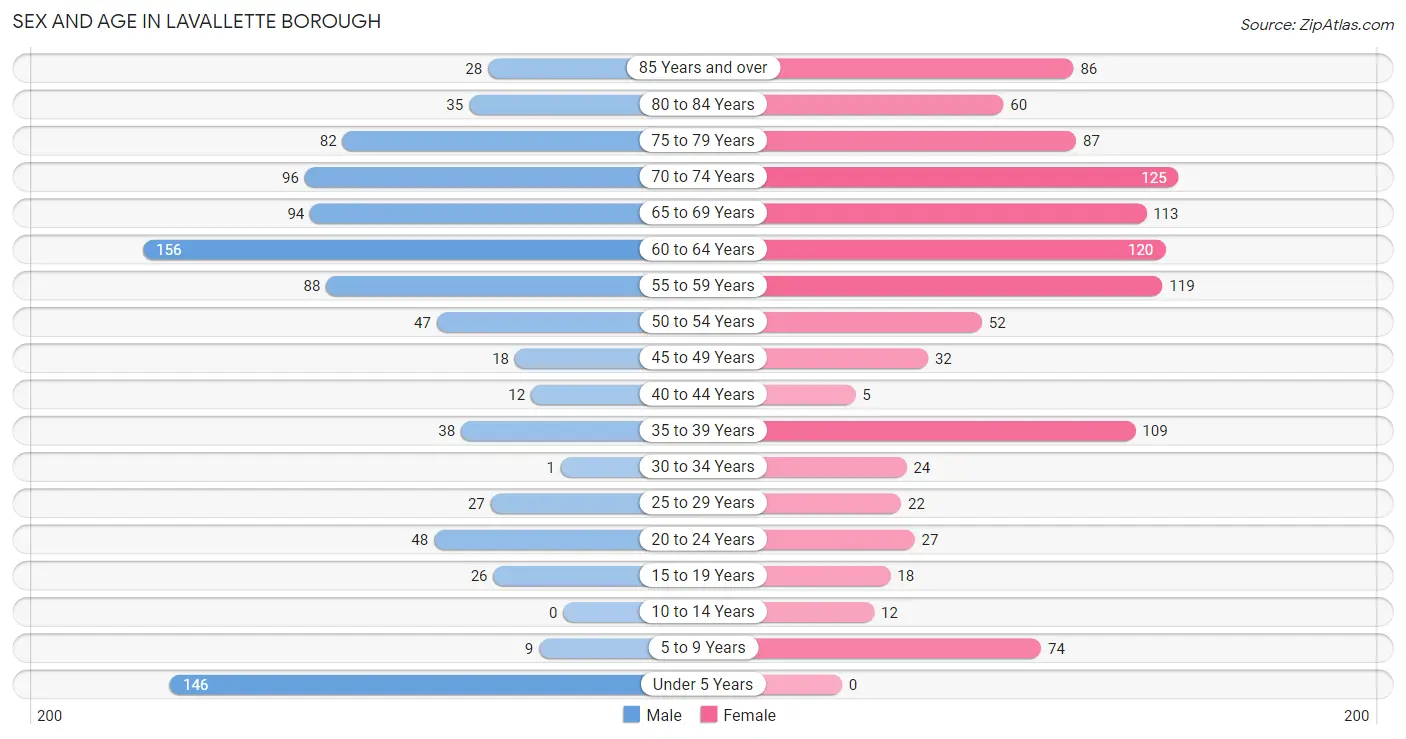
| Age Bracket | Male | Female |
| Under 5 Years | 146 (15.3%) | 0 (0.0%) |
| 5 to 9 Years | 9 (0.9%) | 74 (6.8%) |
| 10 to 14 Years | 0 (0.0%) | 12 (1.1%) |
| 15 to 19 Years | 26 (2.7%) | 18 (1.7%) |
| 20 to 24 Years | 48 (5.1%) | 27 (2.5%) |
| 25 to 29 Years | 27 (2.8%) | 22 (2.0%) |
| 30 to 34 Years | 1 (0.1%) | 24 (2.2%) |
| 35 to 39 Years | 38 (4.0%) | 109 (10.1%) |
| 40 to 44 Years | 12 (1.3%) | 5 (0.5%) |
| 45 to 49 Years | 18 (1.9%) | 32 (2.9%) |
| 50 to 54 Years | 47 (4.9%) | 52 (4.8%) |
| 55 to 59 Years | 88 (9.2%) | 119 (11.0%) |
| 60 to 64 Years | 156 (16.4%) | 120 (11.1%) |
| 65 to 69 Years | 94 (9.9%) | 113 (10.4%) |
| 70 to 74 Years | 96 (10.1%) | 125 (11.5%) |
| 75 to 79 Years | 82 (8.6%) | 87 (8.0%) |
| 80 to 84 Years | 35 (3.7%) | 60 (5.5%) |
| 85 Years and over | 28 (2.9%) | 86 (7.9%) |
| Total | 951 (100.0%) | 1,085 (100.0%) |
Families and Households in Lavallette borough
Median Family Size in Lavallette borough
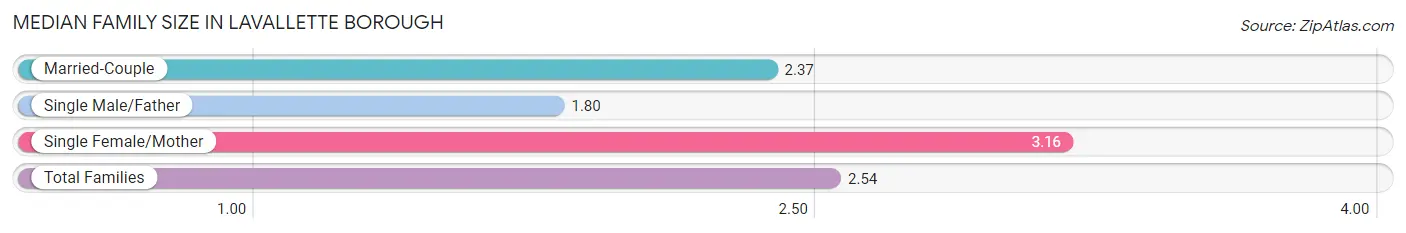
The median family size in Lavallette borough is 2.54 persons per family, with single female/mother families (152 | 22.9%) accounting for the largest median family size of 3.16 persons per family. On the other hand, single male/father families (20 | 3.0%) represent the smallest median family size with 1.80 persons per family.
| Family Type | # Families | Family Size |
| Married-Couple | 492 (74.1%) | 2.37 |
| Single Male/Father | 20 (3.0%) | 1.80 |
| Single Female/Mother | 152 (22.9%) | 3.16 |
| Total Families | 664 (100.0%) | 2.54 |
Median Household Size in Lavallette borough
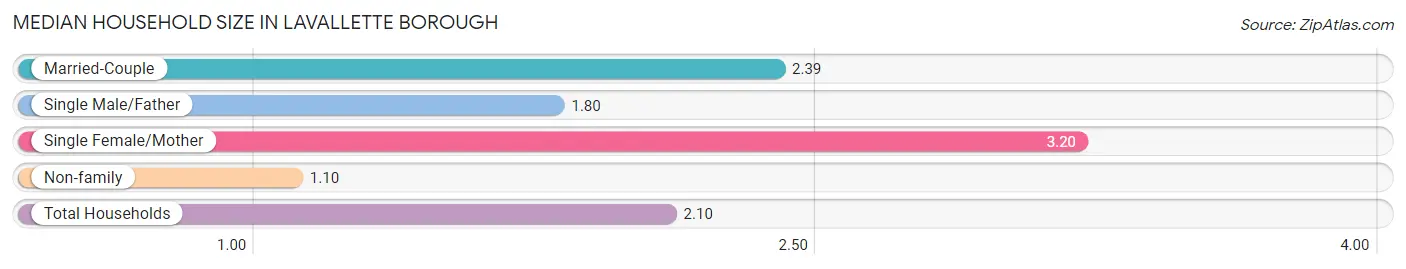
The median household size in Lavallette borough is 2.10 persons per household, with single female/mother households (152 | 15.7%) accounting for the largest median household size of 3.2 persons per household. non-family households (307 | 31.6%) represent the smallest median household size with 1.10 persons per household.
| Household Type | # Households | Household Size |
| Married-Couple | 492 (50.7%) | 2.39 |
| Single Male/Father | 20 (2.1%) | 1.80 |
| Single Female/Mother | 152 (15.7%) | 3.20 |
| Non-family | 307 (31.6%) | 1.10 |
| Total Households | 971 (100.0%) | 2.10 |
Household Size by Marriage Status in Lavallette borough
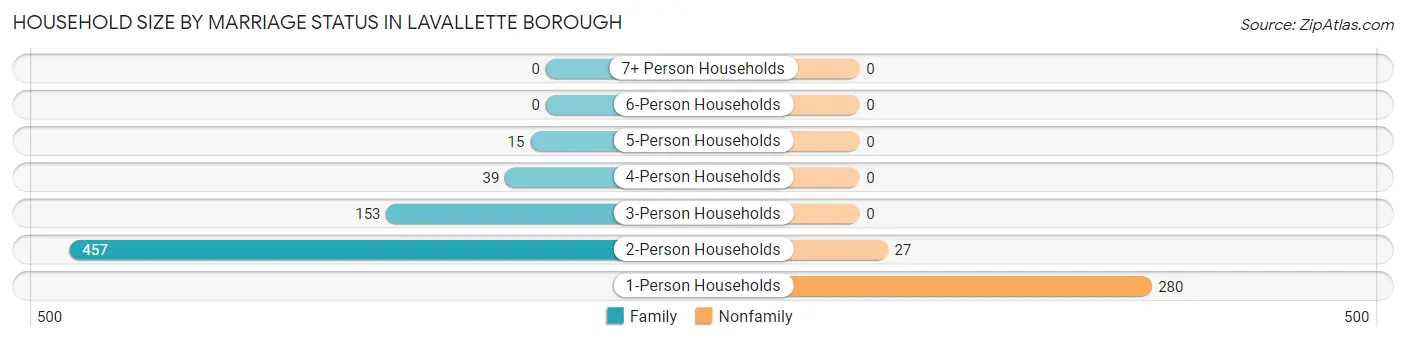
Out of a total of 971 households in Lavallette borough, 664 (68.4%) are family households, while 307 (31.6%) are nonfamily households. The most numerous type of family households are 2-person households, comprising 457, and the most common type of nonfamily households are 1-person households, comprising 280.
| Household Size | Family Households | Nonfamily Households |
| 1-Person Households | - | 280 (28.8%) |
| 2-Person Households | 457 (47.1%) | 27 (2.8%) |
| 3-Person Households | 153 (15.8%) | 0 (0.0%) |
| 4-Person Households | 39 (4.0%) | 0 (0.0%) |
| 5-Person Households | 15 (1.5%) | 0 (0.0%) |
| 6-Person Households | 0 (0.0%) | 0 (0.0%) |
| 7+ Person Households | 0 (0.0%) | 0 (0.0%) |
| Total | 664 (68.4%) | 307 (31.6%) |
Female Fertility in Lavallette borough
Fertility by Age in Lavallette borough
| Age Bracket | Women with Births | Births / 1,000 Women |
| 15 to 19 years | 0 (0.0%) | 0.0 |
| 20 to 34 years | 0 (0.0%) | 0.0 |
| 35 to 50 years | 0 (0.0%) | 0.0 |
| Total | 0 (0.0%) | 0.0 |
Fertility by Age by Marriage Status in Lavallette borough
| Age Bracket | Married | Unmarried |
| 15 to 19 years | 0 (0.0%) | 0 (0.0%) |
| 20 to 34 years | 0 (0.0%) | 0 (0.0%) |
| 35 to 50 years | 0 (0.0%) | 0 (0.0%) |
| Total | 0 (0.0%) | 0 (0.0%) |
Fertility by Education in Lavallette borough
| Educational Attainment | Women with Births | Births / 1,000 Women |
| Less than High School | 0 (0.0%) | 0.0 |
| High School Diploma | 0 (0.0%) | 0.0 |
| College or Associate's Degree | 0 (0.0%) | 0.0 |
| Bachelor's Degree | 0 (0.0%) | 0.0 |
| Graduate Degree | 0 (0.0%) | 0.0 |
| Total | 0 (0.0%) | 0.0 |
Fertility by Education by Marriage Status in Lavallette borough
| Educational Attainment | Married | Unmarried |
| Less than High School | 0 (0.0%) | 0 (0.0%) |
| High School Diploma | 0 (0.0%) | 0 (0.0%) |
| College or Associate's Degree | 0 (0.0%) | 0 (0.0%) |
| Bachelor's Degree | 0 (0.0%) | 0 (0.0%) |
| Graduate Degree | 0 (0.0%) | 0 (0.0%) |
| Total | 0 (0.0%) | 0 (0.0%) |
Employment Characteristics in Lavallette borough
Employment by Class of Employer in Lavallette borough
Among the 852 employed individuals in Lavallette borough, private company employees (608 | 71.4%), local government employees (86 | 10.1%), and self-employed (incorporated) (62 | 7.3%) make up the most common classes of employment.
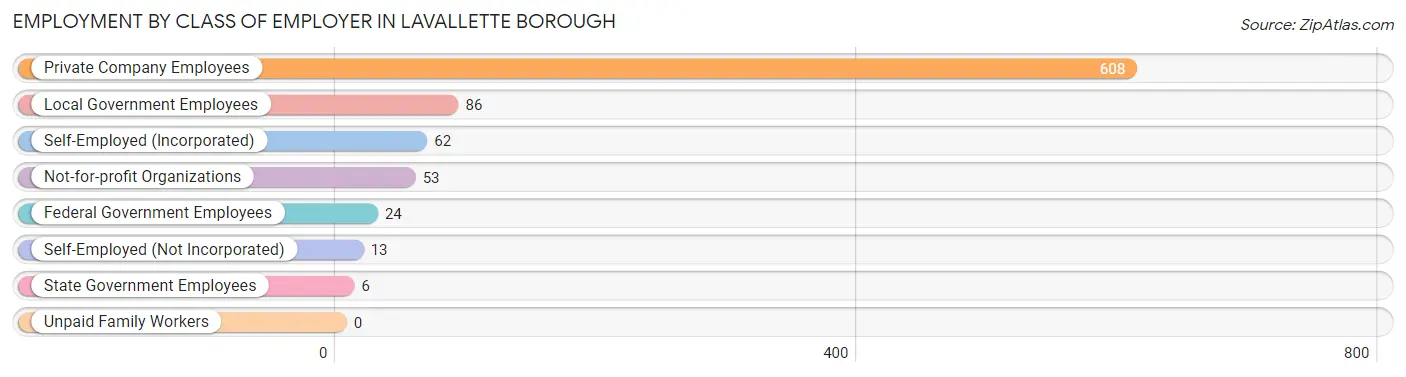
| Employer Class | # Employees | % Employees |
| Private Company Employees | 608 | 71.4% |
| Self-Employed (Incorporated) | 62 | 7.3% |
| Self-Employed (Not Incorporated) | 13 | 1.5% |
| Not-for-profit Organizations | 53 | 6.2% |
| Local Government Employees | 86 | 10.1% |
| State Government Employees | 6 | 0.7% |
| Federal Government Employees | 24 | 2.8% |
| Unpaid Family Workers | 0 | 0.0% |
| Total | 852 | 100.0% |
Employment Status by Age in Lavallette borough
According to the labor force statistics for Lavallette borough, out of the total population over 16 years of age (1,795), 48.4% or 869 individuals are in the labor force, with 1.2% or 10 of them unemployed. The age group with the highest labor force participation rate is 25 to 29 years, with 100.0% or 49 individuals in the labor force. Within the labor force, the 65 to 74 years age range has the highest percentage of unemployed individuals, with 6.6% or 5 of them being unemployed.
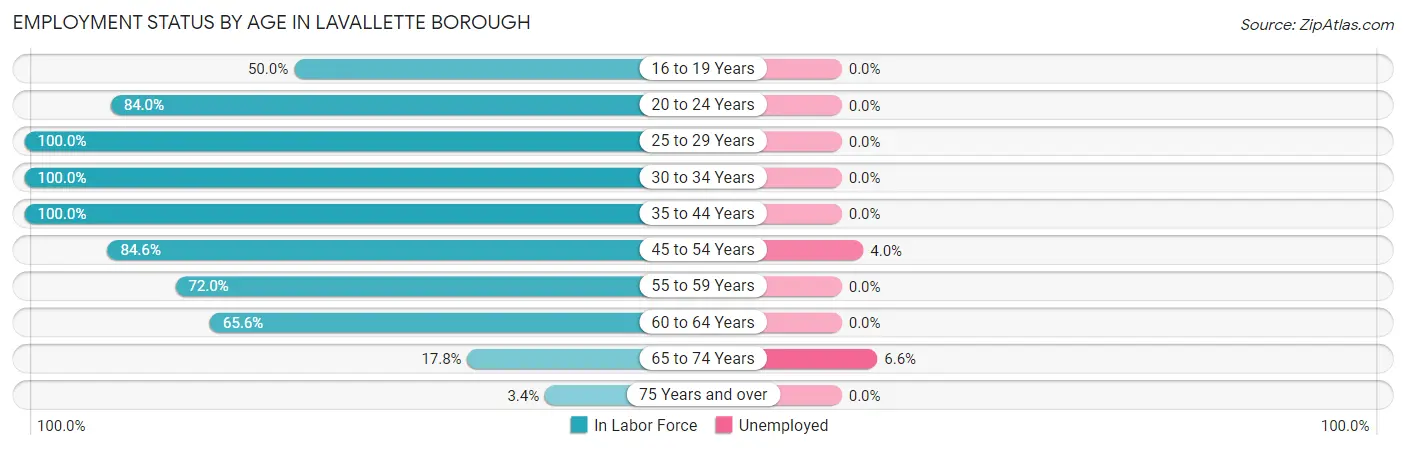
| Age Bracket | In Labor Force | Unemployed |
| 16 to 19 Years | 22 (50.0%) | 0 (0.0%) |
| 20 to 24 Years | 63 (84.0%) | 0 (0.0%) |
| 25 to 29 Years | 49 (100.0%) | 0 (0.0%) |
| 30 to 34 Years | 25 (100.0%) | 0 (0.0%) |
| 35 to 44 Years | 164 (100.0%) | 0 (0.0%) |
| 45 to 54 Years | 126 (84.6%) | 5 (4.0%) |
| 55 to 59 Years | 149 (72.0%) | 0 (0.0%) |
| 60 to 64 Years | 181 (65.6%) | 0 (0.0%) |
| 65 to 74 Years | 76 (17.8%) | 5 (6.6%) |
| 75 Years and over | 13 (3.4%) | 0 (0.0%) |
| Total | 869 (48.4%) | 10 (1.2%) |
Employment Status by Educational Attainment in Lavallette borough
According to labor force statistics for Lavallette borough, 79.8% of individuals (694) out of the total population between 25 and 64 years of age (870) are in the labor force, with 0.7% or 5 of them being unemployed. The group with the highest labor force participation rate are those with the educational attainment of less than high school, with 100.0% or 14 individuals in the labor force. Within the labor force, individuals with bachelor's degree or higher education have the highest percentage of unemployment, with 1.1% or 5 of them being unemployed.
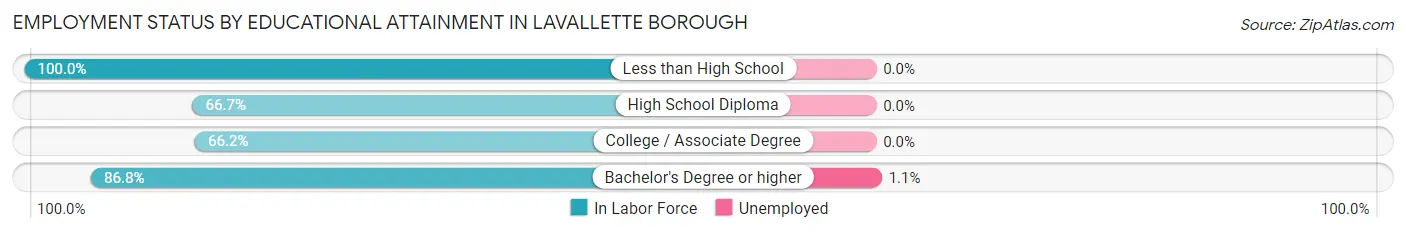
| Educational Attainment | In Labor Force | Unemployed |
| Less than High School | 14 (100.0%) | 0 (0.0%) |
| High School Diploma | 114 (66.7%) | 0 (0.0%) |
| College / Associate Degree | 92 (66.2%) | 0 (0.0%) |
| Bachelor's Degree or higher | 474 (86.8%) | 6 (1.1%) |
| Total | 694 (79.8%) | 6 (0.7%) |
Employment Occupations by Sex in Lavallette borough
Management, Business, Science and Arts Occupations
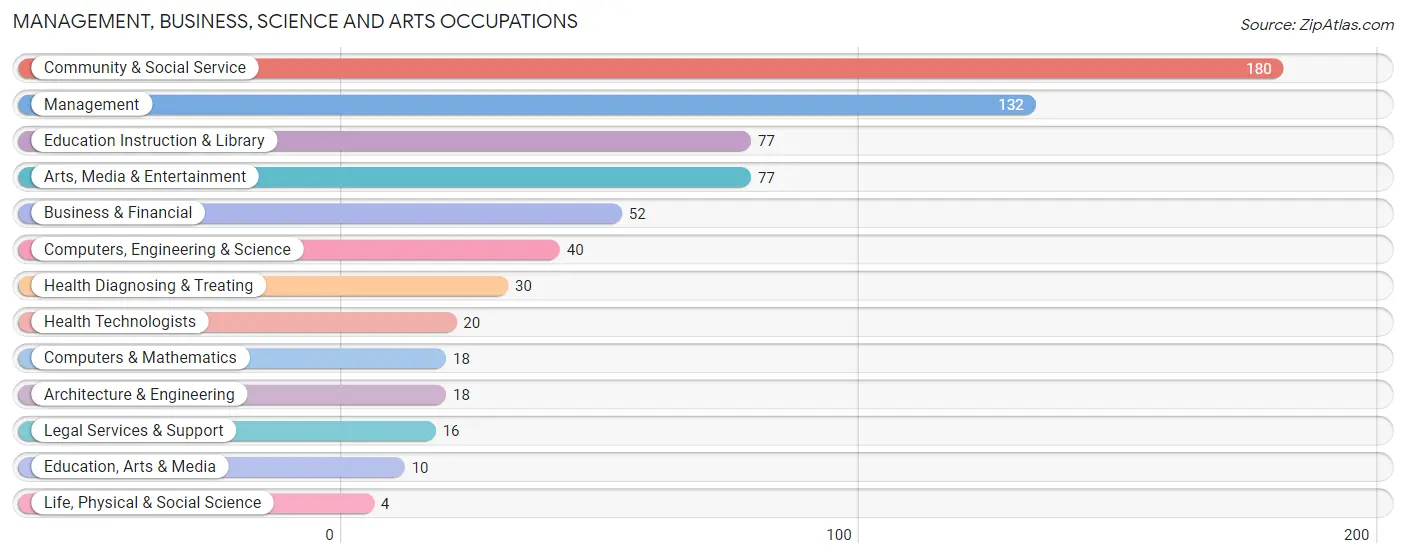
The most common Management, Business, Science and Arts occupations in Lavallette borough are Community & Social Service (180 | 21.0%), Management (132 | 15.4%), Education Instruction & Library (77 | 9.0%), Arts, Media & Entertainment (77 | 9.0%), and Business & Financial (52 | 6.1%).
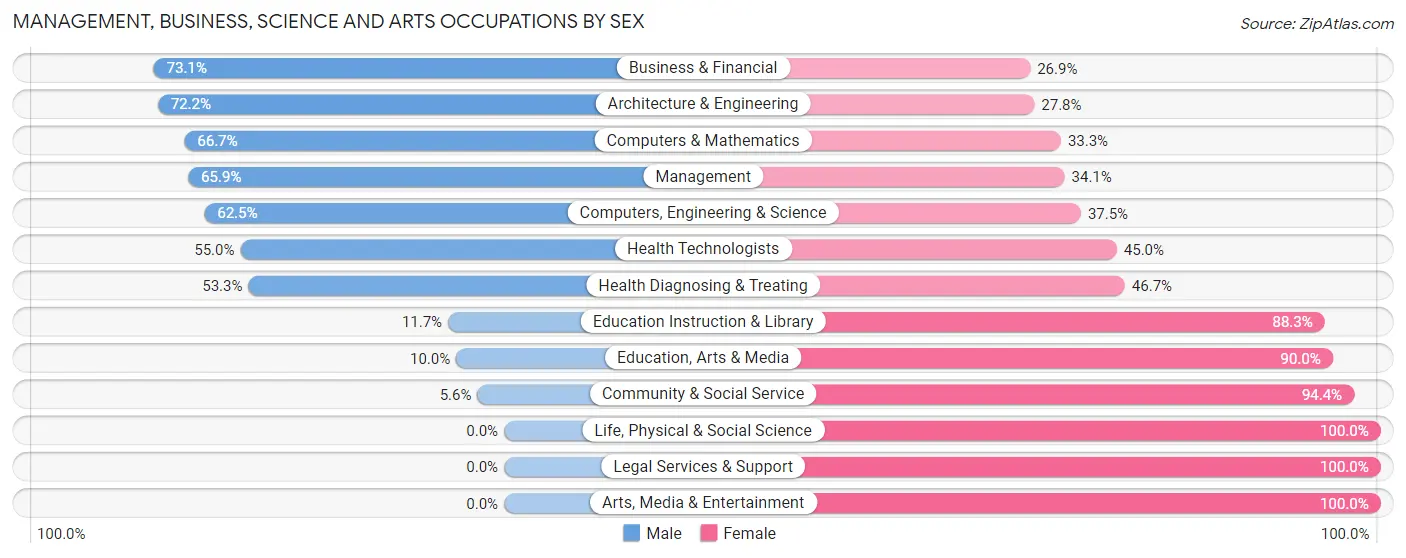
Management, Business, Science and Arts Occupations by Sex
Within the Management, Business, Science and Arts occupations in Lavallette borough, the most male-oriented occupations are Business & Financial (73.1%), Architecture & Engineering (72.2%), and Computers & Mathematics (66.7%), while the most female-oriented occupations are Life, Physical & Social Science (100.0%), Legal Services & Support (100.0%), and Arts, Media & Entertainment (100.0%).
| Occupation | Male | Female |
| Management | 87 (65.9%) | 45 (34.1%) |
| Business & Financial | 38 (73.1%) | 14 (26.9%) |
| Computers, Engineering & Science | 25 (62.5%) | 15 (37.5%) |
| Computers & Mathematics | 12 (66.7%) | 6 (33.3%) |
| Architecture & Engineering | 13 (72.2%) | 5 (27.8%) |
| Life, Physical & Social Science | 0 (0.0%) | 4 (100.0%) |
| Community & Social Service | 10 (5.6%) | 170 (94.4%) |
| Education, Arts & Media | 1 (10.0%) | 9 (90.0%) |
| Legal Services & Support | 0 (0.0%) | 16 (100.0%) |
| Education Instruction & Library | 9 (11.7%) | 68 (88.3%) |
| Arts, Media & Entertainment | 0 (0.0%) | 77 (100.0%) |
| Health Diagnosing & Treating | 16 (53.3%) | 14 (46.7%) |
| Health Technologists | 11 (55.0%) | 9 (45.0%) |
| Total (Category) | 176 (40.6%) | 258 (59.5%) |
| Total (Overall) | 447 (52.2%) | 410 (47.8%) |
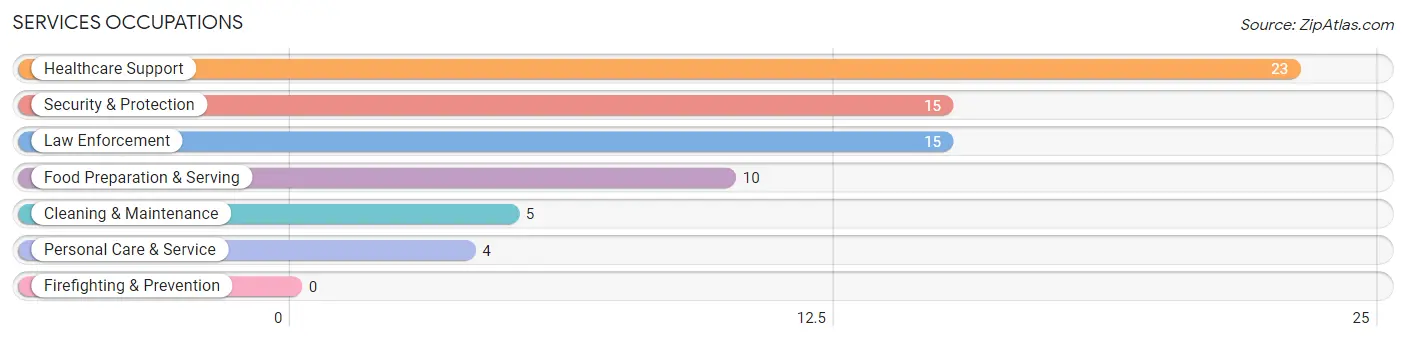
Services Occupations
The most common Services occupations in Lavallette borough are Healthcare Support (23 | 2.7%), Security & Protection (15 | 1.8%), Law Enforcement (15 | 1.8%), Food Preparation & Serving (10 | 1.2%), and Cleaning & Maintenance (5 | 0.6%).
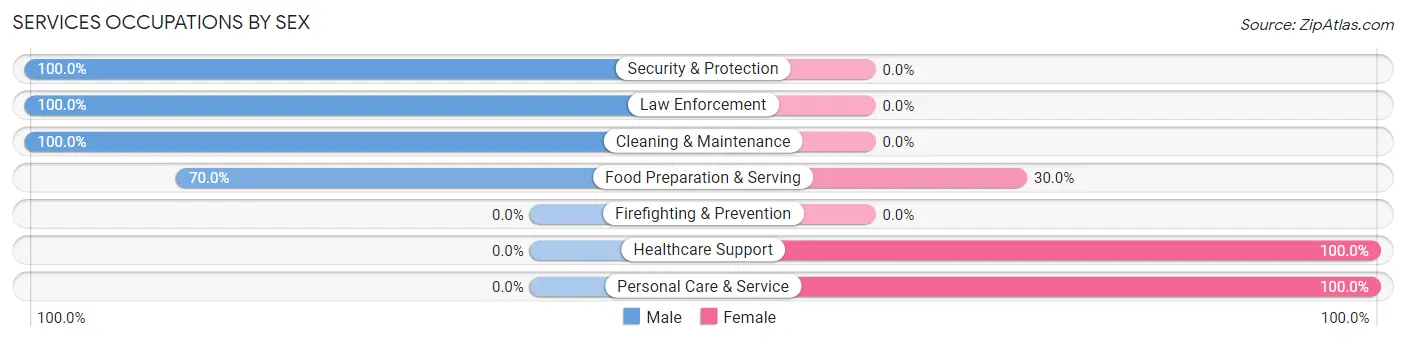
Services Occupations by Sex
Within the Services occupations in Lavallette borough, the most male-oriented occupations are Security & Protection (100.0%), Law Enforcement (100.0%), and Cleaning & Maintenance (100.0%), while the most female-oriented occupations are Healthcare Support (100.0%), Personal Care & Service (100.0%), and Food Preparation & Serving (30.0%).
| Occupation | Male | Female |
| Healthcare Support | 0 (0.0%) | 23 (100.0%) |
| Security & Protection | 15 (100.0%) | 0 (0.0%) |
| Firefighting & Prevention | 0 (0.0%) | 0 (0.0%) |
| Law Enforcement | 15 (100.0%) | 0 (0.0%) |
| Food Preparation & Serving | 7 (70.0%) | 3 (30.0%) |
| Cleaning & Maintenance | 5 (100.0%) | 0 (0.0%) |
| Personal Care & Service | 0 (0.0%) | 4 (100.0%) |
| Total (Category) | 27 (47.4%) | 30 (52.6%) |
| Total (Overall) | 447 (52.2%) | 410 (47.8%) |
Sales and Office Occupations
The most common Sales and Office occupations in Lavallette borough are Sales & Related (137 | 16.0%), and Office & Administration (75 | 8.7%).

Sales and Office Occupations by Sex

| Occupation | Male | Female |
| Sales & Related | 95 (69.3%) | 42 (30.7%) |
| Office & Administration | 9 (12.0%) | 66 (88.0%) |
| Total (Category) | 104 (49.1%) | 108 (50.9%) |
| Total (Overall) | 447 (52.2%) | 410 (47.8%) |
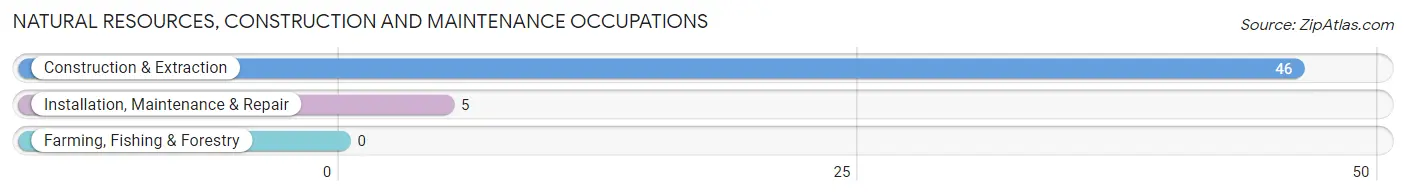
Natural Resources, Construction and Maintenance Occupations
The most common Natural Resources, Construction and Maintenance occupations in Lavallette borough are Construction & Extraction (46 | 5.4%), and Installation, Maintenance & Repair (5 | 0.6%).
Natural Resources, Construction and Maintenance Occupations by Sex

| Occupation | Male | Female |
| Farming, Fishing & Forestry | 0 (0.0%) | 0 (0.0%) |
| Construction & Extraction | 46 (100.0%) | 0 (0.0%) |
| Installation, Maintenance & Repair | 5 (100.0%) | 0 (0.0%) |
| Total (Category) | 51 (100.0%) | 0 (0.0%) |
| Total (Overall) | 447 (52.2%) | 410 (47.8%) |
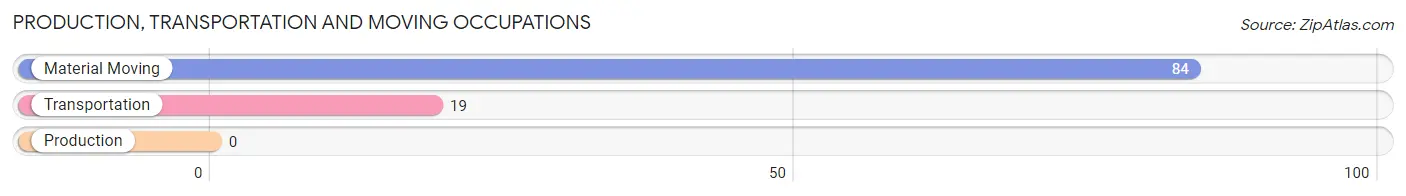
Production, Transportation and Moving Occupations
The most common Production, Transportation and Moving occupations in Lavallette borough are Material Moving (84 | 9.8%), and Transportation (19 | 2.2%).
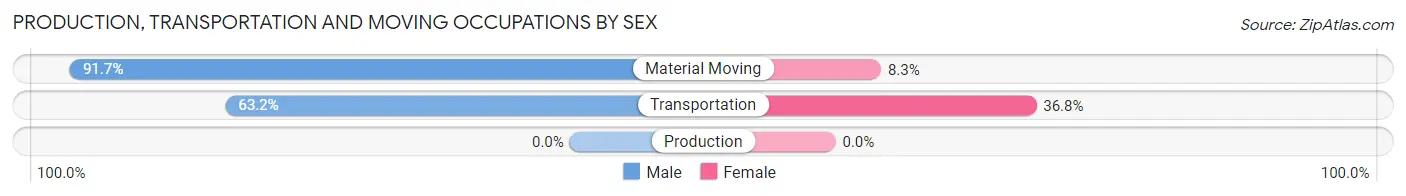
Production, Transportation and Moving Occupations by Sex
| Occupation | Male | Female |
| Production | 0 (0.0%) | 0 (0.0%) |
| Transportation | 12 (63.2%) | 7 (36.8%) |
| Material Moving | 77 (91.7%) | 7 (8.3%) |
| Total (Category) | 89 (86.4%) | 14 (13.6%) |
| Total (Overall) | 447 (52.2%) | 410 (47.8%) |
Employment Industries by Sex in Lavallette borough
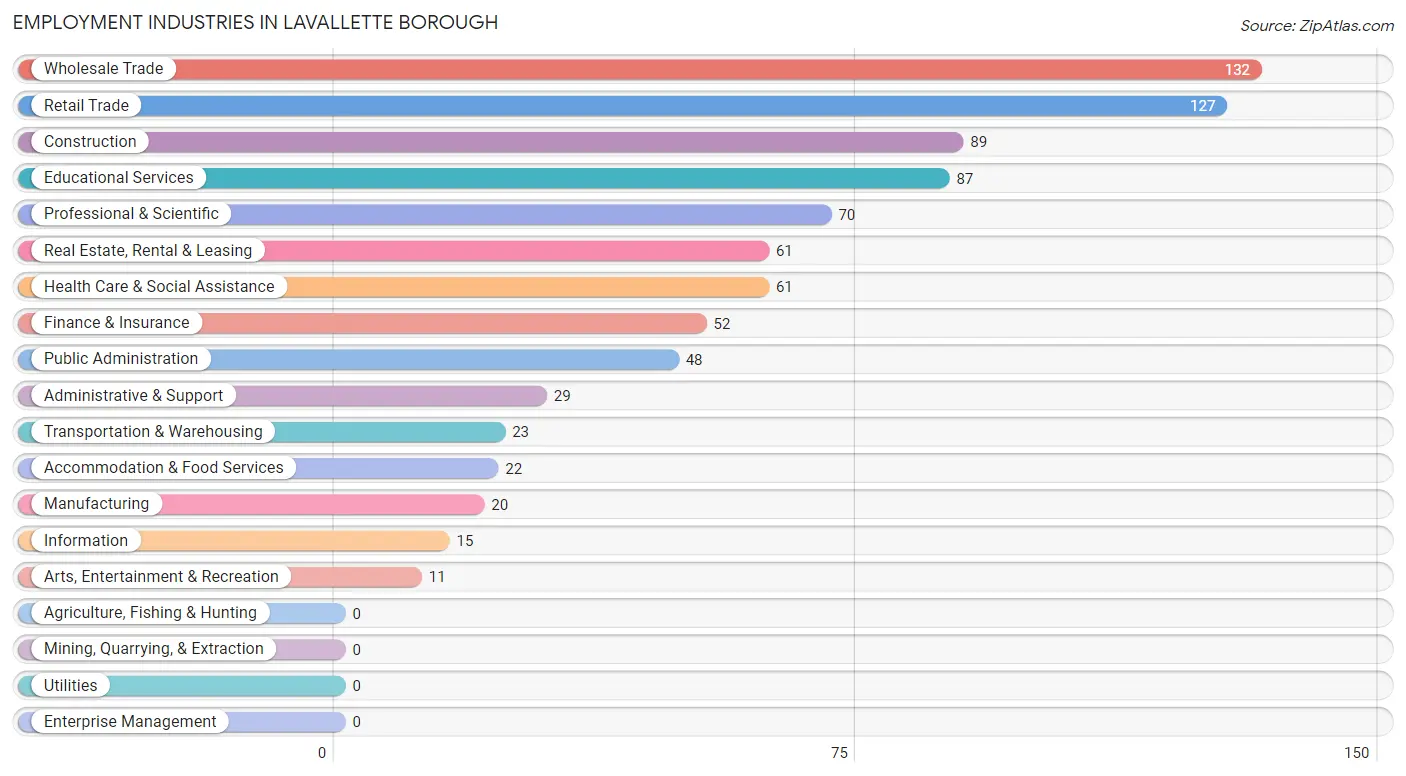
Employment Industries in Lavallette borough
The major employment industries in Lavallette borough include Wholesale Trade (132 | 15.4%), Retail Trade (127 | 14.8%), Construction (89 | 10.4%), Educational Services (87 | 10.2%), and Professional & Scientific (70 | 8.2%).
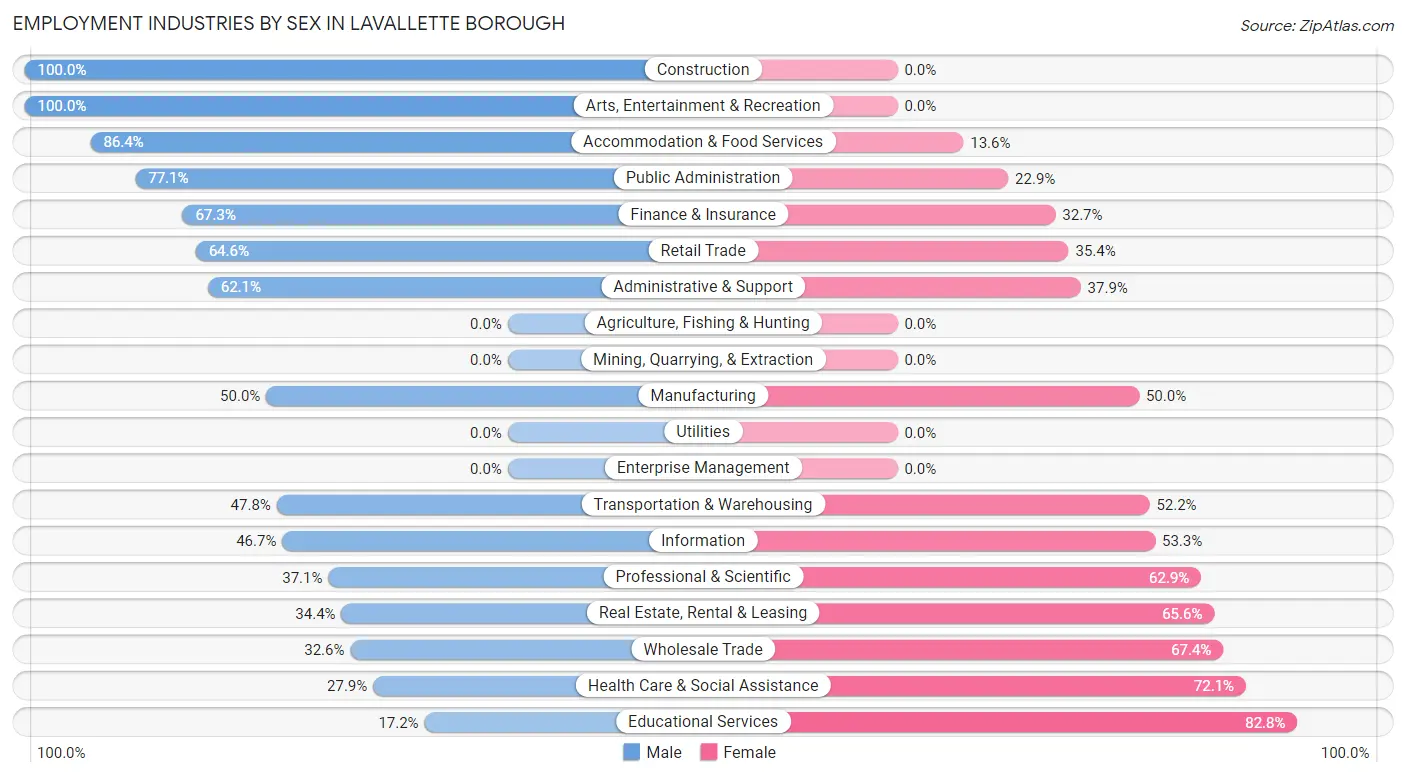
Employment Industries by Sex in Lavallette borough
The Lavallette borough industries that see more men than women are Construction (100.0%), Arts, Entertainment & Recreation (100.0%), and Accommodation & Food Services (86.4%), whereas the industries that tend to have a higher number of women are Educational Services (82.8%), Health Care & Social Assistance (72.1%), and Wholesale Trade (67.4%).
| Industry | Male | Female |
| Agriculture, Fishing & Hunting | 0 (0.0%) | 0 (0.0%) |
| Mining, Quarrying, & Extraction | 0 (0.0%) | 0 (0.0%) |
| Construction | 89 (100.0%) | 0 (0.0%) |
| Manufacturing | 10 (50.0%) | 10 (50.0%) |
| Wholesale Trade | 43 (32.6%) | 89 (67.4%) |
| Retail Trade | 82 (64.6%) | 45 (35.4%) |
| Transportation & Warehousing | 11 (47.8%) | 12 (52.2%) |
| Utilities | 0 (0.0%) | 0 (0.0%) |
| Information | 7 (46.7%) | 8 (53.3%) |
| Finance & Insurance | 35 (67.3%) | 17 (32.7%) |
| Real Estate, Rental & Leasing | 21 (34.4%) | 40 (65.6%) |
| Professional & Scientific | 26 (37.1%) | 44 (62.9%) |
| Enterprise Management | 0 (0.0%) | 0 (0.0%) |
| Administrative & Support | 18 (62.1%) | 11 (37.9%) |
| Educational Services | 15 (17.2%) | 72 (82.8%) |
| Health Care & Social Assistance | 17 (27.9%) | 44 (72.1%) |
| Arts, Entertainment & Recreation | 11 (100.0%) | 0 (0.0%) |
| Accommodation & Food Services | 19 (86.4%) | 3 (13.6%) |
| Public Administration | 37 (77.1%) | 11 (22.9%) |
| Total | 447 (52.2%) | 410 (47.8%) |
Education in Lavallette borough
School Enrollment in Lavallette borough
The most common levels of schooling among the 317 students in Lavallette borough are nursery / preschool (130 | 41.0%), kindergarten (74 | 23.3%), and high school (37 | 11.7%).
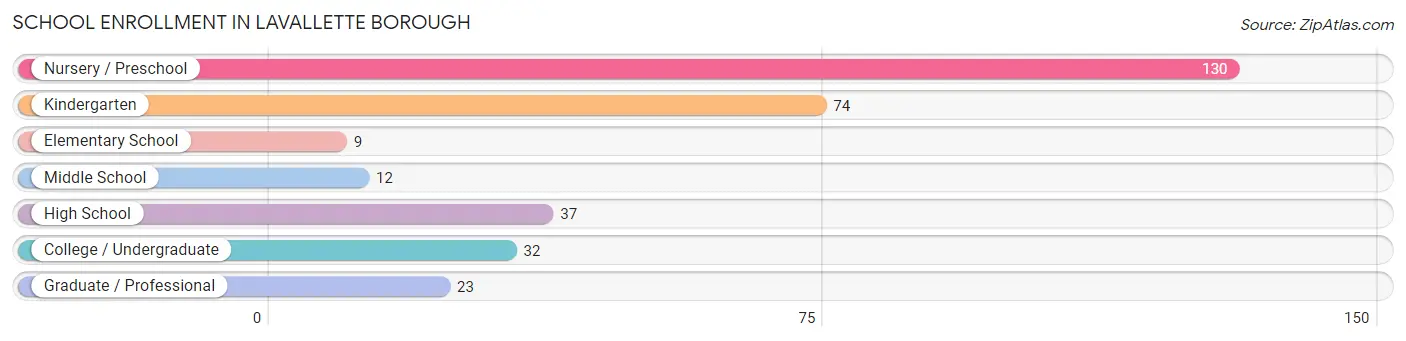
| School Level | # Students | % Students |
| Nursery / Preschool | 130 | 41.0% |
| Kindergarten | 74 | 23.3% |
| Elementary School | 9 | 2.8% |
| Middle School | 12 | 3.8% |
| High School | 37 | 11.7% |
| College / Undergraduate | 32 | 10.1% |
| Graduate / Professional | 23 | 7.3% |
| Total | 317 | 100.0% |
School Enrollment by Age by Funding Source in Lavallette borough
Out of a total of 317 students who are enrolled in schools in Lavallette borough, 16 (5.0%) attend a private institution, while the remaining 301 (95.0%) are enrolled in public schools. The age group of 25 to 34 year olds has the highest likelihood of being enrolled in private schools, with 11 (64.7% in the age bracket) enrolled. Conversely, the age group of 3 to 4 year olds has the lowest likelihood of being enrolled in a private school, with 130 (100.0% in the age bracket) attending a public institution.
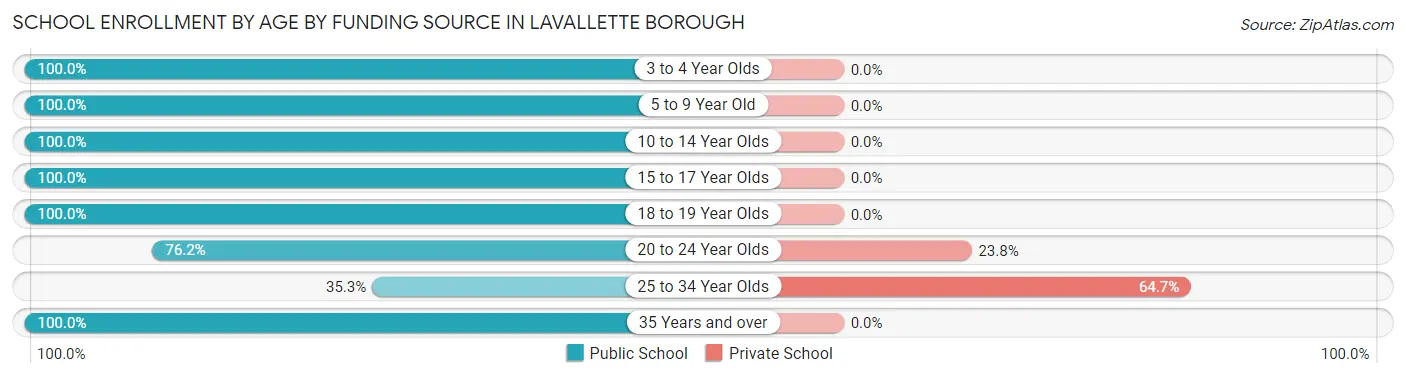
| Age Bracket | Public School | Private School |
| 3 to 4 Year Olds | 130 (100.0%) | 0 (0.0%) |
| 5 to 9 Year Old | 83 (100.0%) | 0 (0.0%) |
| 10 to 14 Year Olds | 12 (100.0%) | 0 (0.0%) |
| 15 to 17 Year Olds | 20 (100.0%) | 0 (0.0%) |
| 18 to 19 Year Olds | 24 (100.0%) | 0 (0.0%) |
| 20 to 24 Year Olds | 16 (76.2%) | 5 (23.8%) |
| 25 to 34 Year Olds | 6 (35.3%) | 11 (64.7%) |
| 35 Years and over | 10 (100.0%) | 0 (0.0%) |
| Total | 301 (95.0%) | 16 (5.0%) |
Educational Attainment by Field of Study in Lavallette borough
Business (206 | 20.2%), education (189 | 18.5%), visual & performing arts (116 | 11.4%), science & technology (101 | 9.9%), and liberal arts & history (92 | 9.0%) are the most common fields of study among 1,021 individuals in Lavallette borough who have obtained a bachelor's degree or higher.
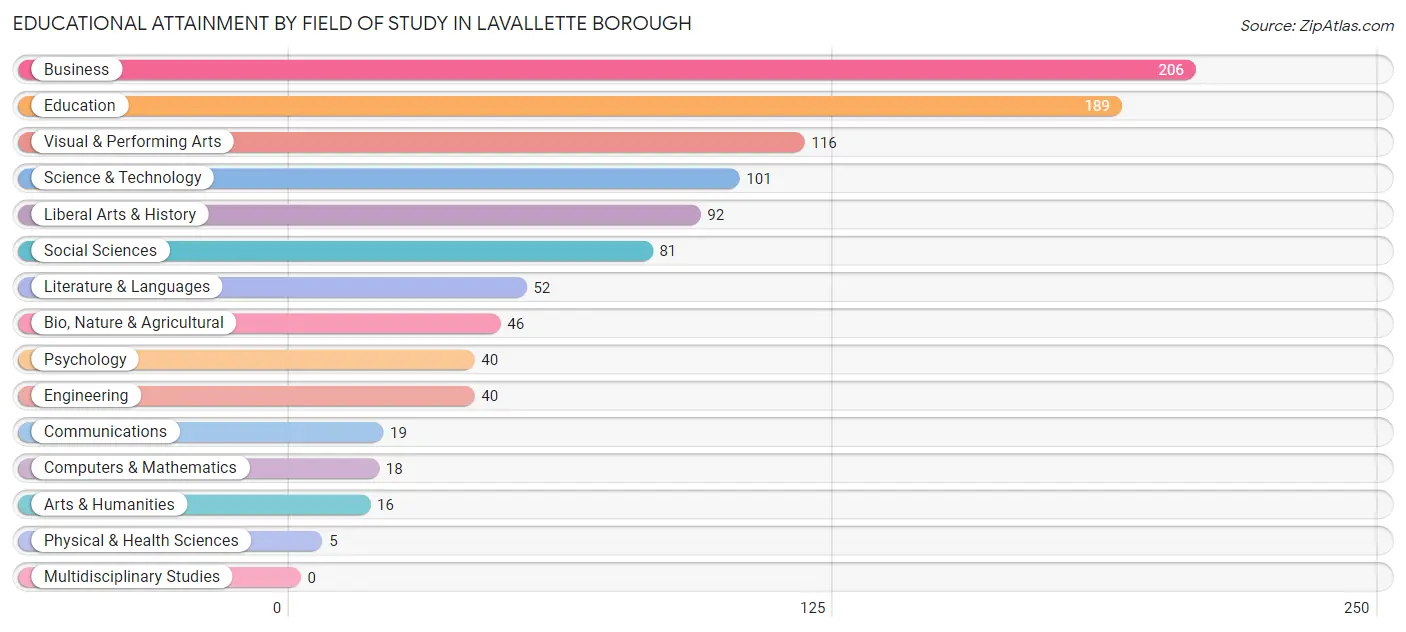
| Field of Study | # Graduates | % Graduates |
| Computers & Mathematics | 18 | 1.8% |
| Bio, Nature & Agricultural | 46 | 4.5% |
| Physical & Health Sciences | 5 | 0.5% |
| Psychology | 40 | 3.9% |
| Social Sciences | 81 | 7.9% |
| Engineering | 40 | 3.9% |
| Multidisciplinary Studies | 0 | 0.0% |
| Science & Technology | 101 | 9.9% |
| Business | 206 | 20.2% |
| Education | 189 | 18.5% |
| Literature & Languages | 52 | 5.1% |
| Liberal Arts & History | 92 | 9.0% |
| Visual & Performing Arts | 116 | 11.4% |
| Communications | 19 | 1.9% |
| Arts & Humanities | 16 | 1.6% |
| Total | 1,021 | 100.0% |
Transportation & Commute in Lavallette borough
Vehicle Availability by Sex in Lavallette borough
The most prevalent vehicle ownership categories in Lavallette borough are males with 1 vehicle (151, accounting for 34.2%) and females with 1 vehicle (65, making up 36.8%).
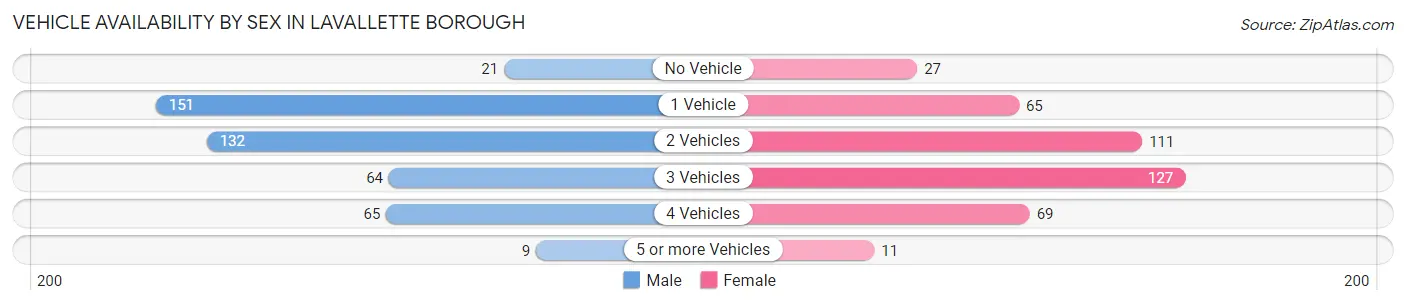
| Vehicles Available | Male | Female |
| No Vehicle | 21 (4.8%) | 27 (6.6%) |
| 1 Vehicle | 151 (34.2%) | 65 (15.9%) |
| 2 Vehicles | 132 (29.9%) | 111 (27.1%) |
| 3 Vehicles | 64 (14.5%) | 127 (31.0%) |
| 4 Vehicles | 65 (14.7%) | 69 (16.8%) |
| 5 or more Vehicles | 9 (2.0%) | 11 (2.7%) |
| Total | 442 (100.0%) | 410 (100.0%) |
Commute Time in Lavallette borough
The most frequently occuring commute durations in Lavallette borough are 15 to 19 minutes (135 commuters, 17.1%), 90 or more minutes (126 commuters, 15.9%), and 45 to 59 minutes (104 commuters, 13.1%).
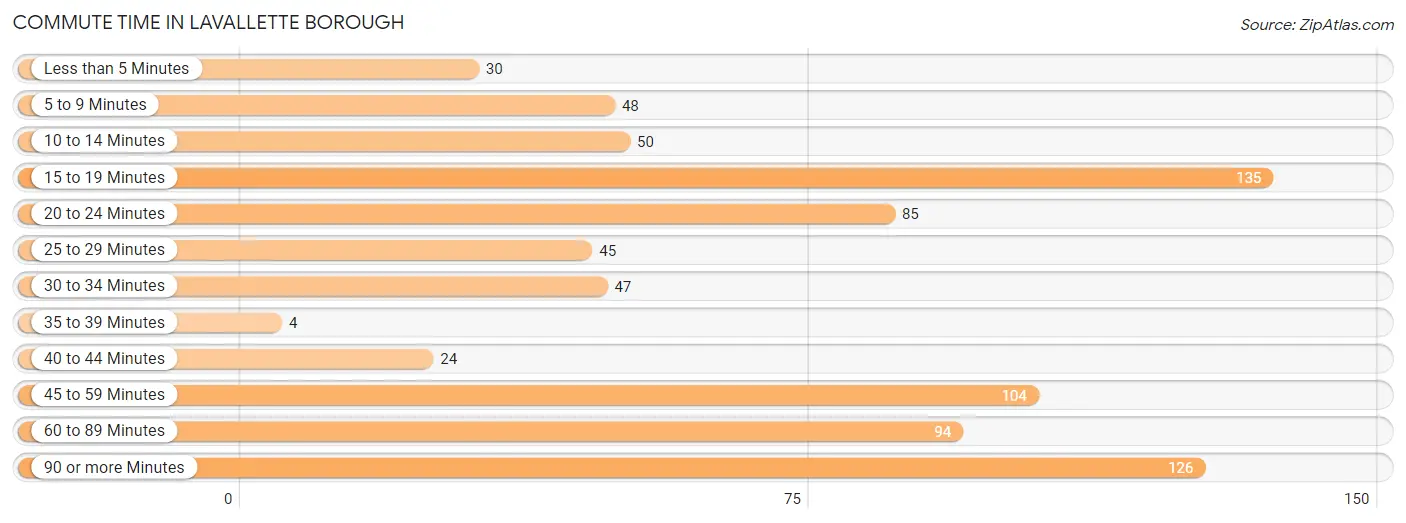
| Commute Time | # Commuters | % Commuters |
| Less than 5 Minutes | 30 | 3.8% |
| 5 to 9 Minutes | 48 | 6.1% |
| 10 to 14 Minutes | 50 | 6.3% |
| 15 to 19 Minutes | 135 | 17.1% |
| 20 to 24 Minutes | 85 | 10.7% |
| 25 to 29 Minutes | 45 | 5.7% |
| 30 to 34 Minutes | 47 | 5.9% |
| 35 to 39 Minutes | 4 | 0.5% |
| 40 to 44 Minutes | 24 | 3.0% |
| 45 to 59 Minutes | 104 | 13.1% |
| 60 to 89 Minutes | 94 | 11.9% |
| 90 or more Minutes | 126 | 15.9% |
Commute Time by Sex in Lavallette borough
The most common commute times in Lavallette borough are 90 or more minutes (99 commuters, 24.5%) for males and 15 to 19 minutes (105 commuters, 27.1%) for females.
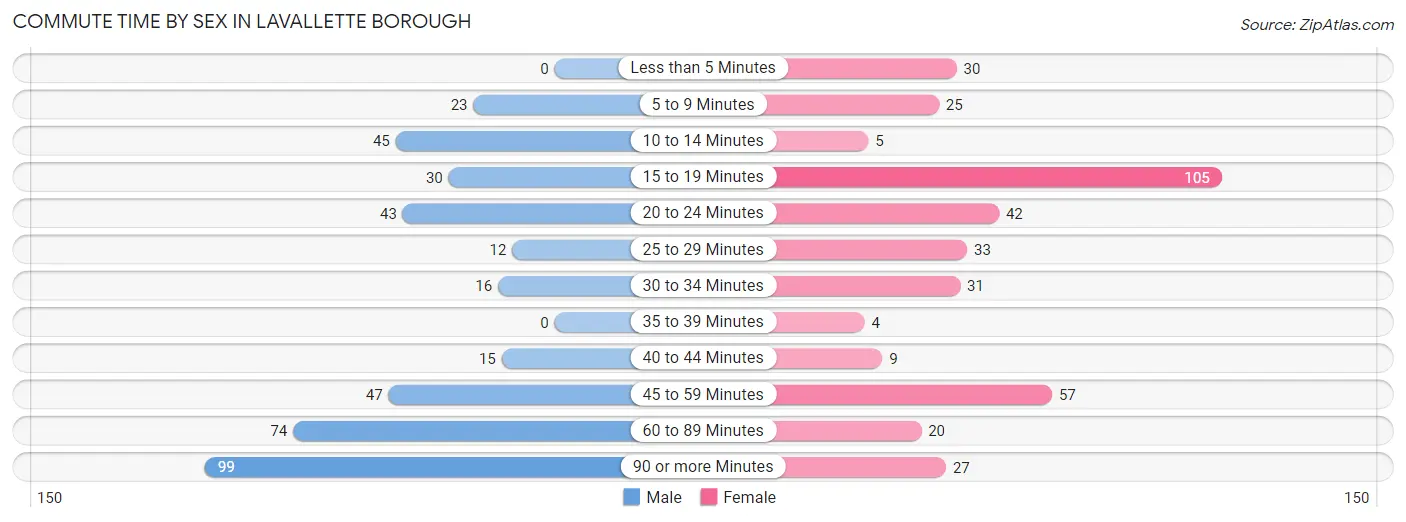
| Commute Time | Male | Female |
| Less than 5 Minutes | 0 (0.0%) | 30 (7.7%) |
| 5 to 9 Minutes | 23 (5.7%) | 25 (6.4%) |
| 10 to 14 Minutes | 45 (11.1%) | 5 (1.3%) |
| 15 to 19 Minutes | 30 (7.4%) | 105 (27.1%) |
| 20 to 24 Minutes | 43 (10.6%) | 42 (10.8%) |
| 25 to 29 Minutes | 12 (3.0%) | 33 (8.5%) |
| 30 to 34 Minutes | 16 (4.0%) | 31 (8.0%) |
| 35 to 39 Minutes | 0 (0.0%) | 4 (1.0%) |
| 40 to 44 Minutes | 15 (3.7%) | 9 (2.3%) |
| 45 to 59 Minutes | 47 (11.6%) | 57 (14.7%) |
| 60 to 89 Minutes | 74 (18.3%) | 20 (5.1%) |
| 90 or more Minutes | 99 (24.5%) | 27 (7.0%) |
Time of Departure to Work by Sex in Lavallette borough
The most frequent times of departure to work in Lavallette borough are 5:30 AM to 5:59 AM (92, 22.8%) for males and 8:30 AM to 8:59 AM (142, 36.6%) for females.
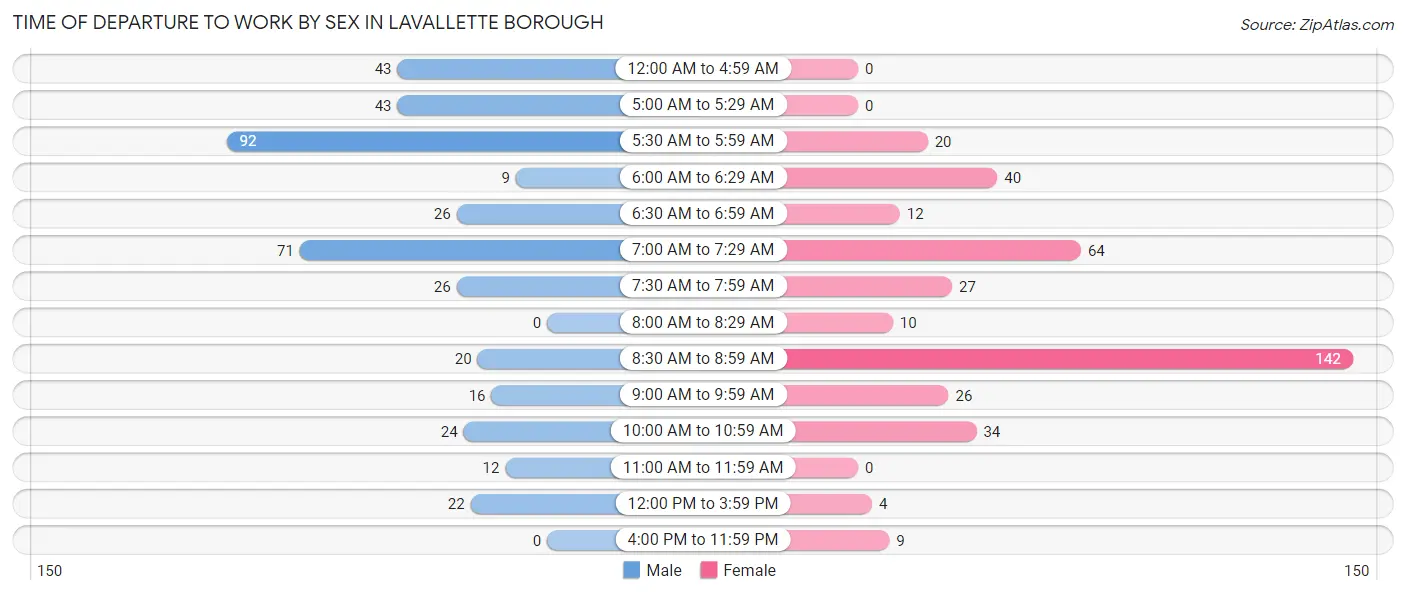
| Time of Departure | Male | Female |
| 12:00 AM to 4:59 AM | 43 (10.6%) | 0 (0.0%) |
| 5:00 AM to 5:29 AM | 43 (10.6%) | 0 (0.0%) |
| 5:30 AM to 5:59 AM | 92 (22.8%) | 20 (5.1%) |
| 6:00 AM to 6:29 AM | 9 (2.2%) | 40 (10.3%) |
| 6:30 AM to 6:59 AM | 26 (6.4%) | 12 (3.1%) |
| 7:00 AM to 7:29 AM | 71 (17.6%) | 64 (16.5%) |
| 7:30 AM to 7:59 AM | 26 (6.4%) | 27 (7.0%) |
| 8:00 AM to 8:29 AM | 0 (0.0%) | 10 (2.6%) |
| 8:30 AM to 8:59 AM | 20 (5.0%) | 142 (36.6%) |
| 9:00 AM to 9:59 AM | 16 (4.0%) | 26 (6.7%) |
| 10:00 AM to 10:59 AM | 24 (5.9%) | 34 (8.8%) |
| 11:00 AM to 11:59 AM | 12 (3.0%) | 0 (0.0%) |
| 12:00 PM to 3:59 PM | 22 (5.4%) | 4 (1.0%) |
| 4:00 PM to 11:59 PM | 0 (0.0%) | 9 (2.3%) |
| Total | 404 (100.0%) | 388 (100.0%) |
Housing Occupancy in Lavallette borough
Occupancy by Ownership in Lavallette borough
Of the total 971 dwellings in Lavallette borough, owner-occupied units account for 776 (79.9%), while renter-occupied units make up 195 (20.1%).
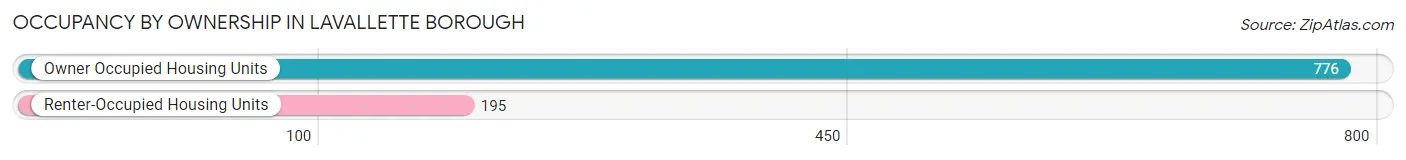
| Occupancy | # Housing Units | % Housing Units |
| Owner Occupied Housing Units | 776 | 79.9% |
| Renter-Occupied Housing Units | 195 | 20.1% |
| Total Occupied Housing Units | 971 | 100.0% |
Occupancy by Household Size in Lavallette borough
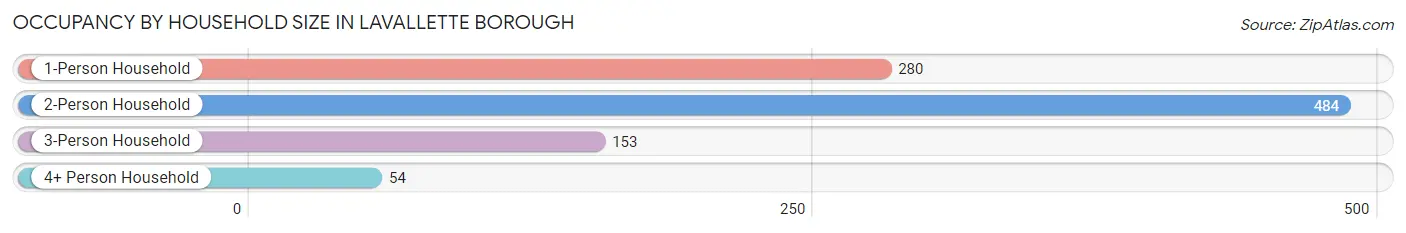
| Household Size | # Housing Units | % Housing Units |
| 1-Person Household | 280 | 28.8% |
| 2-Person Household | 484 | 49.8% |
| 3-Person Household | 153 | 15.8% |
| 4+ Person Household | 54 | 5.6% |
| Total Housing Units | 971 | 100.0% |
Occupancy by Ownership by Household Size in Lavallette borough
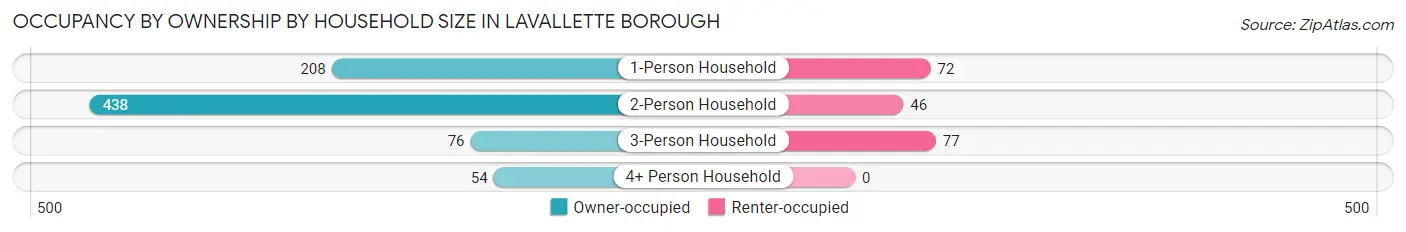
| Household Size | Owner-occupied | Renter-occupied |
| 1-Person Household | 208 (74.3%) | 72 (25.7%) |
| 2-Person Household | 438 (90.5%) | 46 (9.5%) |
| 3-Person Household | 76 (49.7%) | 77 (50.3%) |
| 4+ Person Household | 54 (100.0%) | 0 (0.0%) |
| Total Housing Units | 776 (79.9%) | 195 (20.1%) |
Occupancy by Educational Attainment in Lavallette borough
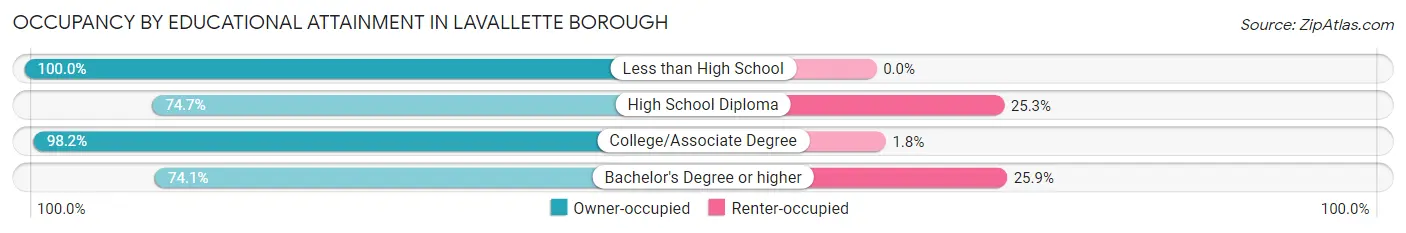
| Household Size | Owner-occupied | Renter-occupied |
| Less than High School | 13 (100.0%) | 0 (0.0%) |
| High School Diploma | 115 (74.7%) | 39 (25.3%) |
| College/Associate Degree | 213 (98.2%) | 4 (1.8%) |
| Bachelor's Degree or higher | 435 (74.1%) | 152 (25.9%) |
Occupancy by Age of Householder in Lavallette borough
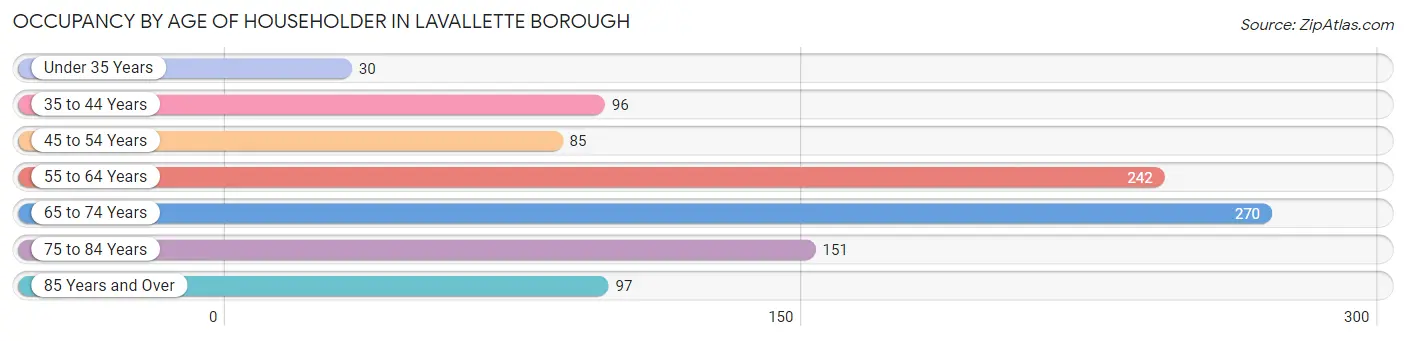
| Age Bracket | # Households | % Households |
| Under 35 Years | 30 | 3.1% |
| 35 to 44 Years | 96 | 9.9% |
| 45 to 54 Years | 85 | 8.7% |
| 55 to 64 Years | 242 | 24.9% |
| 65 to 74 Years | 270 | 27.8% |
| 75 to 84 Years | 151 | 15.5% |
| 85 Years and Over | 97 | 10.0% |
| Total | 971 | 100.0% |
Housing Finances in Lavallette borough
Median Income by Occupancy in Lavallette borough
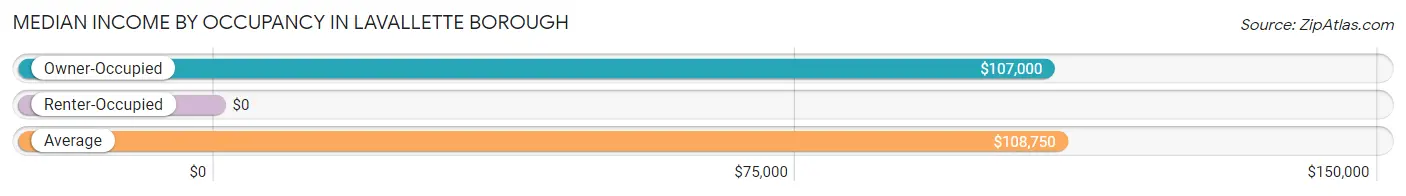
| Occupancy Type | # Households | Median Income |
| Owner-Occupied | 776 (79.9%) | $107,000 |
| Renter-Occupied | 195 (20.1%) | $0 |
| Average | 971 (100.0%) | $108,750 |
Occupancy by Householder Income Bracket in Lavallette borough
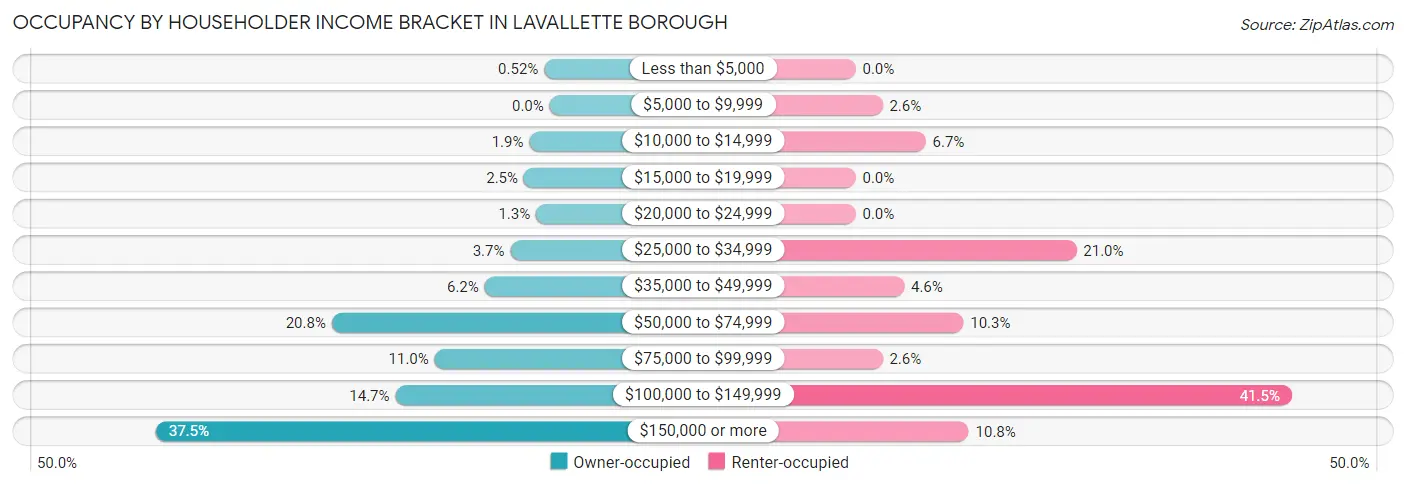
| Income Bracket | Owner-occupied | Renter-occupied |
| Less than $5,000 | 4 (0.5%) | 0 (0.0%) |
| $5,000 to $9,999 | 0 (0.0%) | 5 (2.6%) |
| $10,000 to $14,999 | 15 (1.9%) | 13 (6.7%) |
| $15,000 to $19,999 | 19 (2.5%) | 0 (0.0%) |
| $20,000 to $24,999 | 10 (1.3%) | 0 (0.0%) |
| $25,000 to $34,999 | 29 (3.7%) | 41 (21.0%) |
| $35,000 to $49,999 | 48 (6.2%) | 9 (4.6%) |
| $50,000 to $74,999 | 161 (20.7%) | 20 (10.3%) |
| $75,000 to $99,999 | 85 (11.0%) | 5 (2.6%) |
| $100,000 to $149,999 | 114 (14.7%) | 81 (41.5%) |
| $150,000 or more | 291 (37.5%) | 21 (10.8%) |
| Total | 776 (100.0%) | 195 (100.0%) |
Monthly Housing Cost Tiers in Lavallette borough
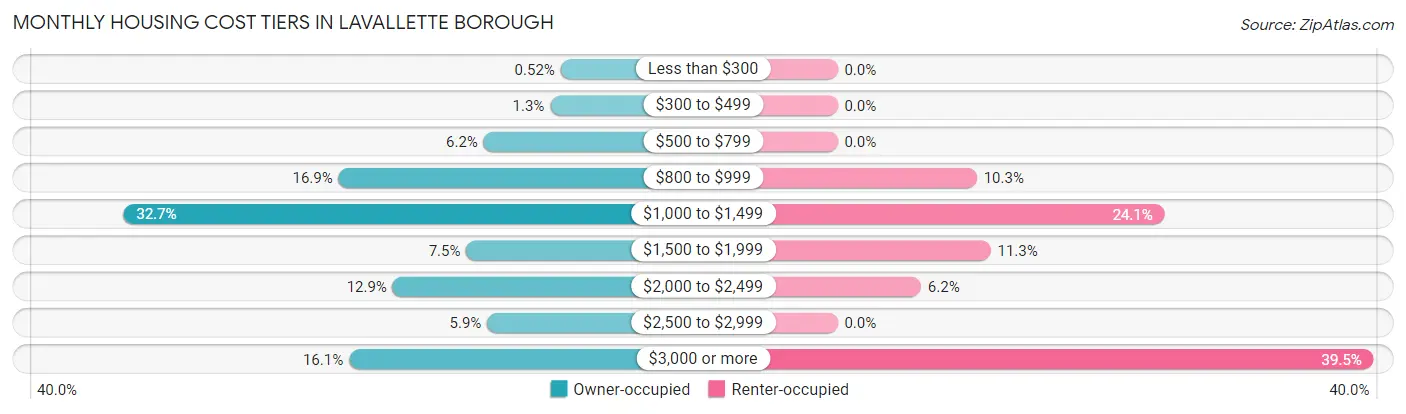
| Monthly Cost | Owner-occupied | Renter-occupied |
| Less than $300 | 4 (0.5%) | 0 (0.0%) |
| $300 to $499 | 10 (1.3%) | 0 (0.0%) |
| $500 to $799 | 48 (6.2%) | 0 (0.0%) |
| $800 to $999 | 131 (16.9%) | 20 (10.3%) |
| $1,000 to $1,499 | 254 (32.7%) | 47 (24.1%) |
| $1,500 to $1,999 | 58 (7.5%) | 22 (11.3%) |
| $2,000 to $2,499 | 100 (12.9%) | 12 (6.1%) |
| $2,500 to $2,999 | 46 (5.9%) | 0 (0.0%) |
| $3,000 or more | 125 (16.1%) | 77 (39.5%) |
| Total | 776 (100.0%) | 195 (100.0%) |
Physical Housing Characteristics in Lavallette borough
Housing Structures in Lavallette borough
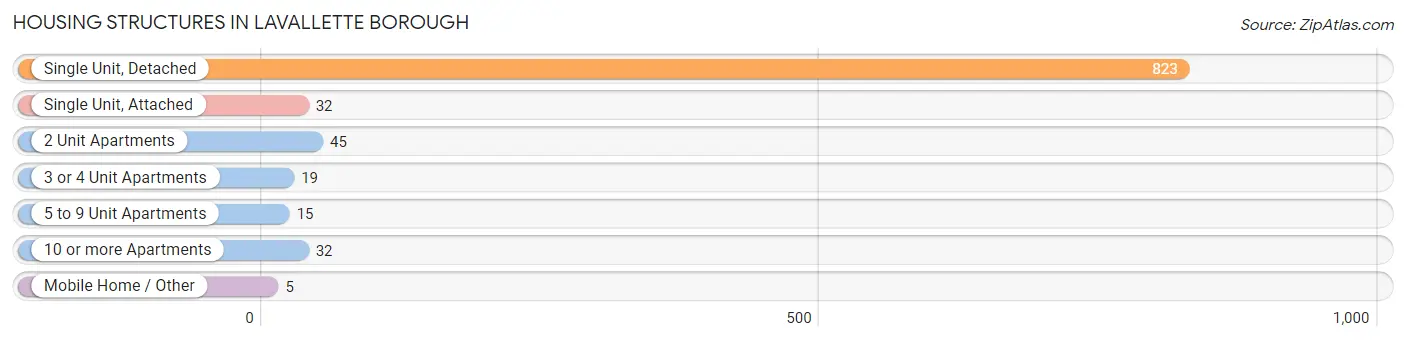
| Structure Type | # Housing Units | % Housing Units |
| Single Unit, Detached | 823 | 84.8% |
| Single Unit, Attached | 32 | 3.3% |
| 2 Unit Apartments | 45 | 4.6% |
| 3 or 4 Unit Apartments | 19 | 2.0% |
| 5 to 9 Unit Apartments | 15 | 1.5% |
| 10 or more Apartments | 32 | 3.3% |
| Mobile Home / Other | 5 | 0.5% |
| Total | 971 | 100.0% |
Housing Structures by Occupancy in Lavallette borough
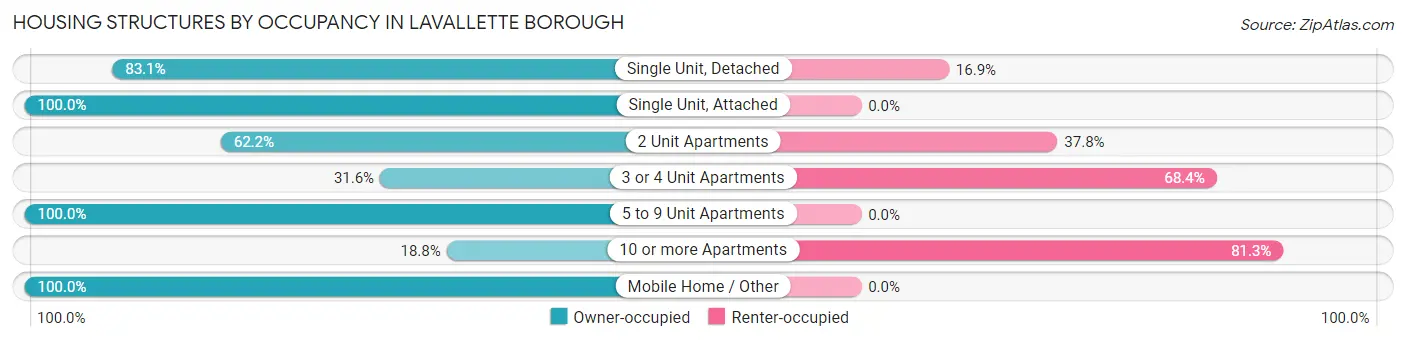
| Structure Type | Owner-occupied | Renter-occupied |
| Single Unit, Detached | 684 (83.1%) | 139 (16.9%) |
| Single Unit, Attached | 32 (100.0%) | 0 (0.0%) |
| 2 Unit Apartments | 28 (62.2%) | 17 (37.8%) |
| 3 or 4 Unit Apartments | 6 (31.6%) | 13 (68.4%) |
| 5 to 9 Unit Apartments | 15 (100.0%) | 0 (0.0%) |
| 10 or more Apartments | 6 (18.8%) | 26 (81.2%) |
| Mobile Home / Other | 5 (100.0%) | 0 (0.0%) |
| Total | 776 (79.9%) | 195 (20.1%) |
Housing Structures by Number of Rooms in Lavallette borough
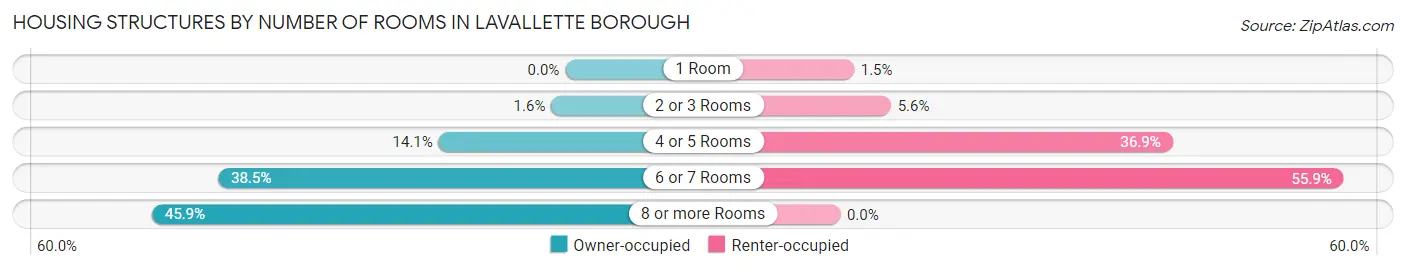
| Number of Rooms | Owner-occupied | Renter-occupied |
| 1 Room | 0 (0.0%) | 3 (1.5%) |
| 2 or 3 Rooms | 12 (1.5%) | 11 (5.6%) |
| 4 or 5 Rooms | 109 (14.1%) | 72 (36.9%) |
| 6 or 7 Rooms | 299 (38.5%) | 109 (55.9%) |
| 8 or more Rooms | 356 (45.9%) | 0 (0.0%) |
| Total | 776 (100.0%) | 195 (100.0%) |
Housing Structure by Heating Type in Lavallette borough
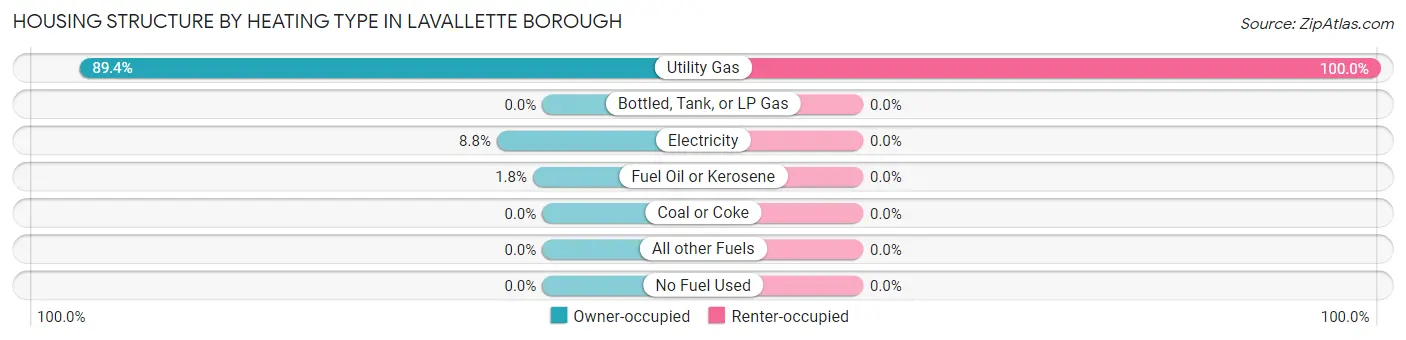
| Heating Type | Owner-occupied | Renter-occupied |
| Utility Gas | 694 (89.4%) | 195 (100.0%) |
| Bottled, Tank, or LP Gas | 0 (0.0%) | 0 (0.0%) |
| Electricity | 68 (8.8%) | 0 (0.0%) |
| Fuel Oil or Kerosene | 14 (1.8%) | 0 (0.0%) |
| Coal or Coke | 0 (0.0%) | 0 (0.0%) |
| All other Fuels | 0 (0.0%) | 0 (0.0%) |
| No Fuel Used | 0 (0.0%) | 0 (0.0%) |
| Total | 776 (100.0%) | 195 (100.0%) |
Household Vehicle Usage in Lavallette borough
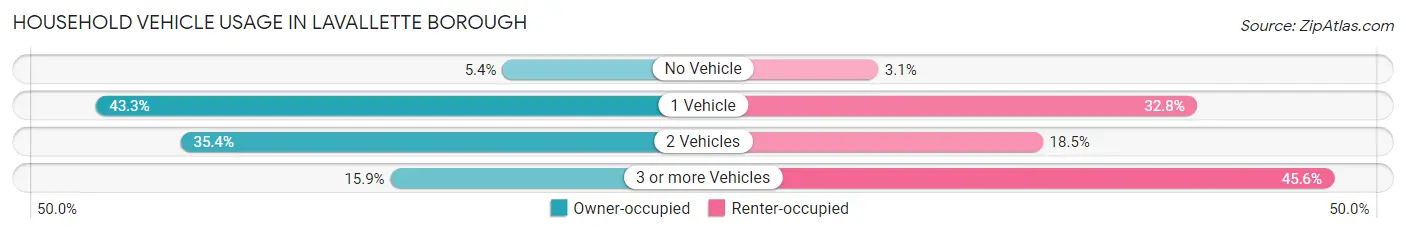
| Vehicles per Household | Owner-occupied | Renter-occupied |
| No Vehicle | 42 (5.4%) | 6 (3.1%) |
| 1 Vehicle | 336 (43.3%) | 64 (32.8%) |
| 2 Vehicles | 275 (35.4%) | 36 (18.5%) |
| 3 or more Vehicles | 123 (15.9%) | 89 (45.6%) |
| Total | 776 (100.0%) | 195 (100.0%) |
Real Estate & Mortgages in Lavallette borough
Real Estate and Mortgage Overview in Lavallette borough
| Characteristic | Without Mortgage | With Mortgage |
| Housing Units | 495 | 281 |
| Median Property Value | $883,100 | $998,600 |
| Median Household Income | $95,469 | $127 |
| Monthly Housing Costs | $1,076 | $125 |
| Real Estate Taxes | $6,782 | $10 |
Property Value by Mortgage Status in Lavallette borough
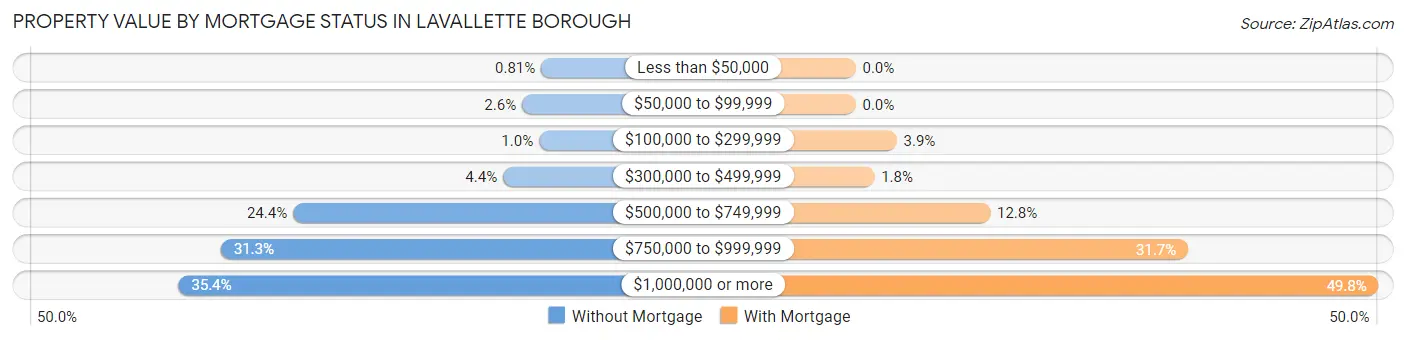
| Property Value | Without Mortgage | With Mortgage |
| Less than $50,000 | 4 (0.8%) | 0 (0.0%) |
| $50,000 to $99,999 | 13 (2.6%) | 0 (0.0%) |
| $100,000 to $299,999 | 5 (1.0%) | 11 (3.9%) |
| $300,000 to $499,999 | 22 (4.4%) | 5 (1.8%) |
| $500,000 to $749,999 | 121 (24.4%) | 36 (12.8%) |
| $750,000 to $999,999 | 155 (31.3%) | 89 (31.7%) |
| $1,000,000 or more | 175 (35.3%) | 140 (49.8%) |
| Total | 495 (100.0%) | 281 (100.0%) |
Household Income by Mortgage Status in Lavallette borough
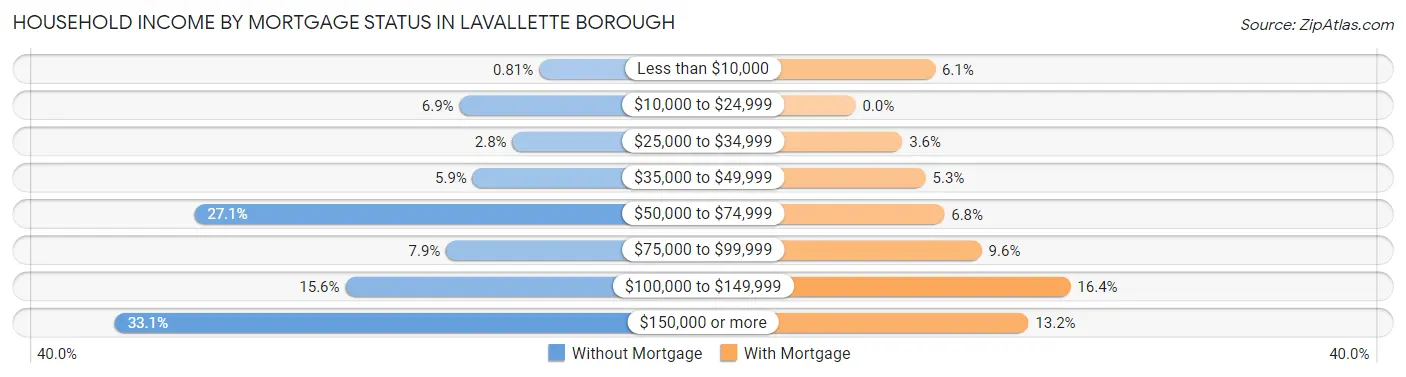
| Household Income | Without Mortgage | With Mortgage |
| Less than $10,000 | 4 (0.8%) | 17 (6.0%) |
| $10,000 to $24,999 | 34 (6.9%) | 0 (0.0%) |
| $25,000 to $34,999 | 14 (2.8%) | 10 (3.6%) |
| $35,000 to $49,999 | 29 (5.9%) | 15 (5.3%) |
| $50,000 to $74,999 | 134 (27.1%) | 19 (6.8%) |
| $75,000 to $99,999 | 39 (7.9%) | 27 (9.6%) |
| $100,000 to $149,999 | 77 (15.6%) | 46 (16.4%) |
| $150,000 or more | 164 (33.1%) | 37 (13.2%) |
| Total | 495 (100.0%) | 281 (100.0%) |
Property Value to Household Income Ratio in Lavallette borough
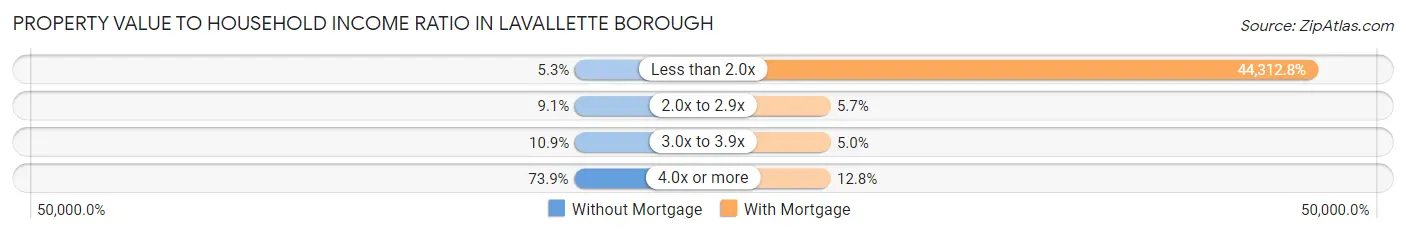
| Value-to-Income Ratio | Without Mortgage | With Mortgage |
| Less than 2.0x | 26 (5.2%) | 124,519 (44,312.8%) |
| 2.0x to 2.9x | 45 (9.1%) | 16 (5.7%) |
| 3.0x to 3.9x | 54 (10.9%) | 14 (5.0%) |
| 4.0x or more | 366 (73.9%) | 36 (12.8%) |
| Total | 495 (100.0%) | 281 (100.0%) |
Real Estate Taxes by Mortgage Status in Lavallette borough
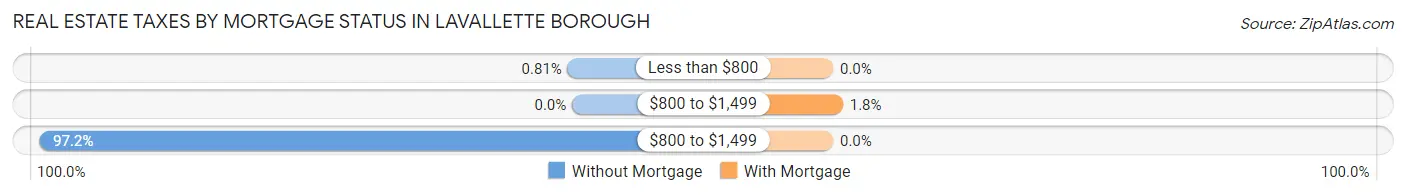
| Property Taxes | Without Mortgage | With Mortgage |
| Less than $800 | 4 (0.8%) | 0 (0.0%) |
| $800 to $1,499 | 0 (0.0%) | 5 (1.8%) |
| $800 to $1,499 | 481 (97.2%) | 0 (0.0%) |
| Total | 495 (100.0%) | 281 (100.0%) |
Health & Disability in Lavallette borough
Health Insurance Coverage by Age in Lavallette borough
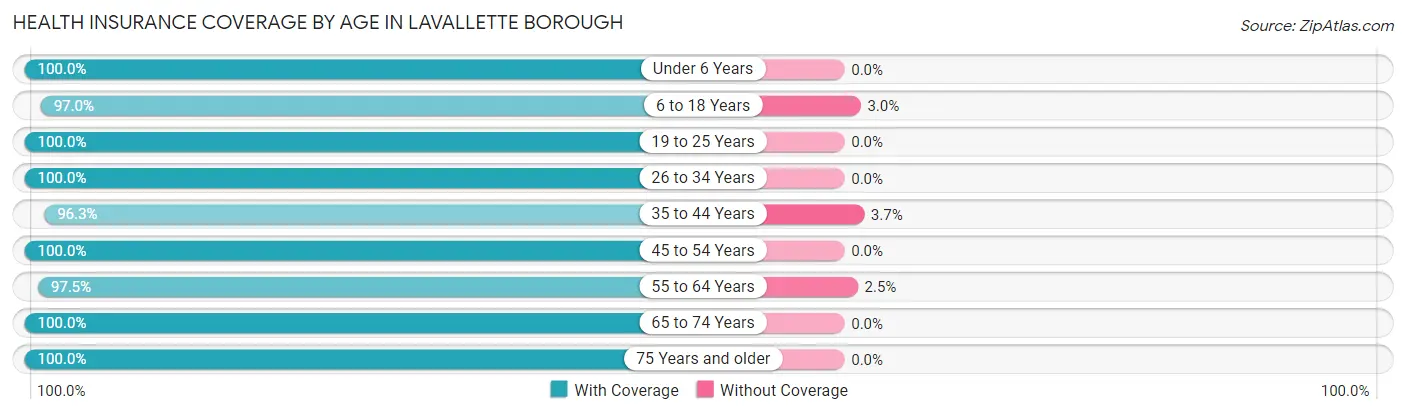
| Age Bracket | With Coverage | Without Coverage |
| Under 6 Years | 146 (100.0%) | 0 (0.0%) |
| 6 to 18 Years | 129 (97.0%) | 4 (3.0%) |
| 19 to 25 Years | 87 (100.0%) | 0 (0.0%) |
| 26 to 34 Years | 67 (100.0%) | 0 (0.0%) |
| 35 to 44 Years | 158 (96.3%) | 6 (3.7%) |
| 45 to 54 Years | 149 (100.0%) | 0 (0.0%) |
| 55 to 64 Years | 471 (97.5%) | 12 (2.5%) |
| 65 to 74 Years | 428 (100.0%) | 0 (0.0%) |
| 75 Years and older | 378 (100.0%) | 0 (0.0%) |
| Total | 2,013 (98.9%) | 22 (1.1%) |
Health Insurance Coverage by Citizenship Status in Lavallette borough
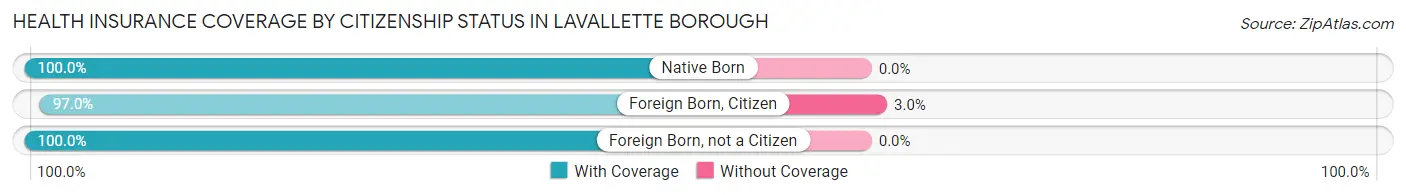
| Citizenship Status | With Coverage | Without Coverage |
| Native Born | 146 (100.0%) | 0 (0.0%) |
| Foreign Born, Citizen | 129 (97.0%) | 4 (3.0%) |
| Foreign Born, not a Citizen | 87 (100.0%) | 0 (0.0%) |
Health Insurance Coverage by Household Income in Lavallette borough
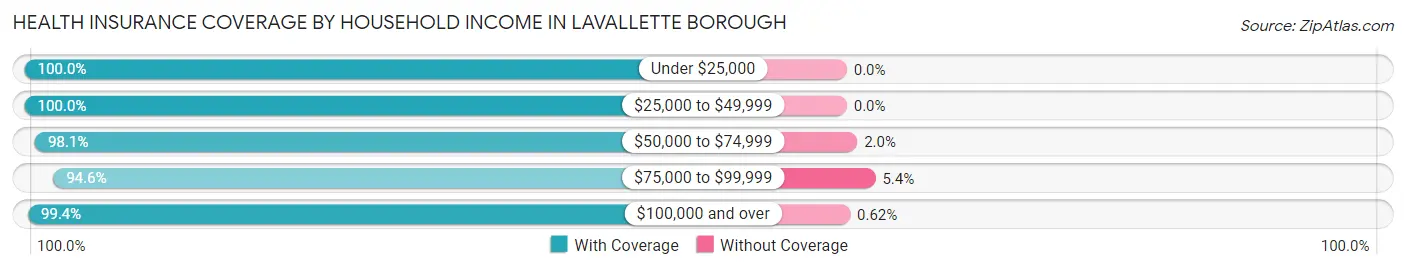
| Household Income | With Coverage | Without Coverage |
| Under $25,000 | 85 (100.0%) | 0 (0.0%) |
| $25,000 to $49,999 | 197 (100.0%) | 0 (0.0%) |
| $50,000 to $74,999 | 301 (98.1%) | 6 (1.9%) |
| $75,000 to $99,999 | 141 (94.6%) | 8 (5.4%) |
| $100,000 and over | 1,289 (99.4%) | 8 (0.6%) |
Public vs Private Health Insurance Coverage by Age in Lavallette borough
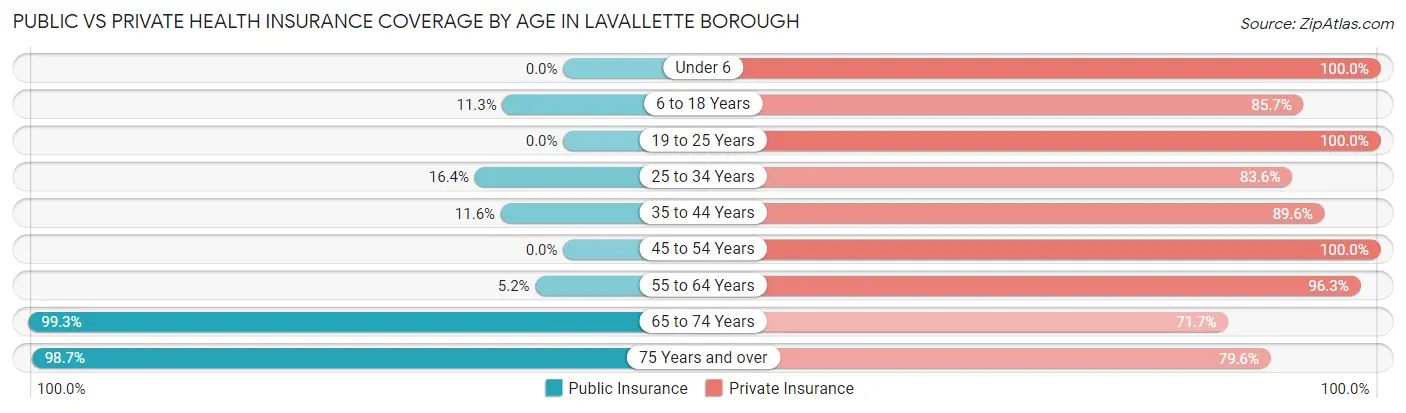
| Age Bracket | Public Insurance | Private Insurance |
| Under 6 | 0 (0.0%) | 146 (100.0%) |
| 6 to 18 Years | 15 (11.3%) | 114 (85.7%) |
| 19 to 25 Years | 0 (0.0%) | 87 (100.0%) |
| 25 to 34 Years | 11 (16.4%) | 56 (83.6%) |
| 35 to 44 Years | 19 (11.6%) | 147 (89.6%) |
| 45 to 54 Years | 0 (0.0%) | 149 (100.0%) |
| 55 to 64 Years | 25 (5.2%) | 465 (96.3%) |
| 65 to 74 Years | 425 (99.3%) | 307 (71.7%) |
| 75 Years and over | 373 (98.7%) | 301 (79.6%) |
| Total | 868 (42.6%) | 1,772 (87.1%) |
Disability Status by Sex by Age in Lavallette borough
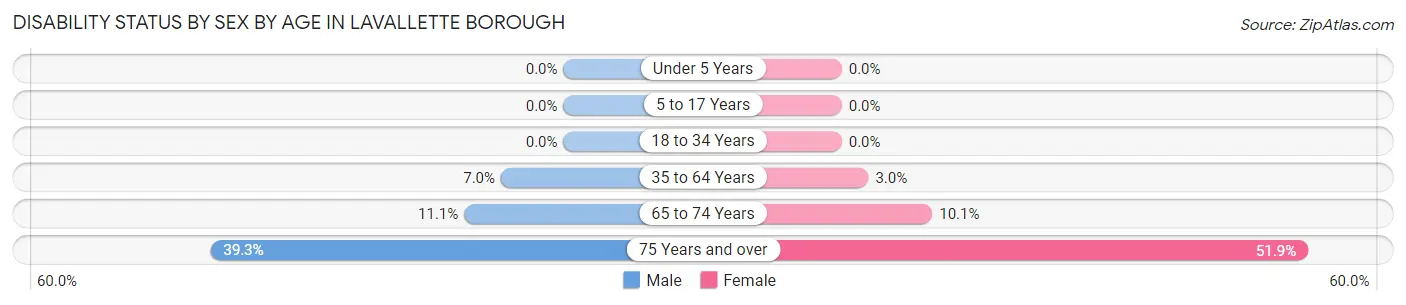
| Age Bracket | Male | Female |
| Under 5 Years | 0 (0.0%) | 0 (0.0%) |
| 5 to 17 Years | 0 (0.0%) | 0 (0.0%) |
| 18 to 34 Years | 0 (0.0%) | 0 (0.0%) |
| 35 to 64 Years | 25 (7.0%) | 13 (3.0%) |
| 65 to 74 Years | 21 (11.1%) | 24 (10.1%) |
| 75 Years and over | 57 (39.3%) | 121 (51.9%) |
Disability Class by Sex by Age in Lavallette borough
Disability Class: Hearing Difficulty
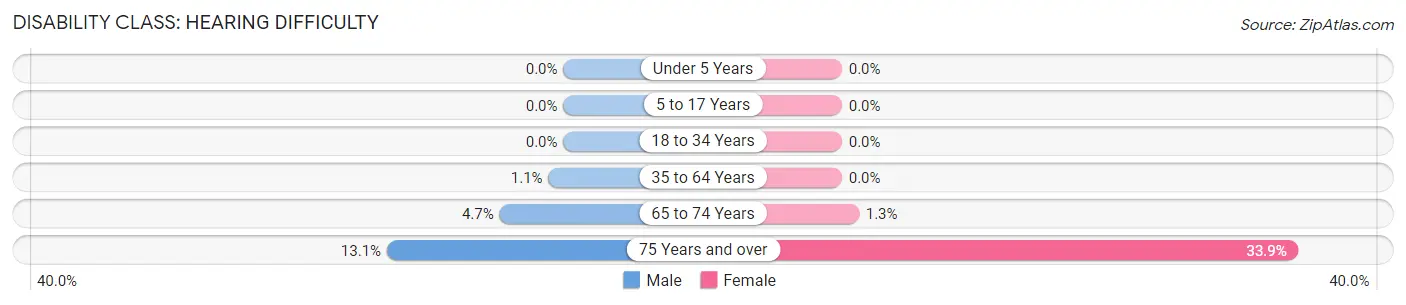
| Age Bracket | Male | Female |
| Under 5 Years | 0 (0.0%) | 0 (0.0%) |
| 5 to 17 Years | 0 (0.0%) | 0 (0.0%) |
| 18 to 34 Years | 0 (0.0%) | 0 (0.0%) |
| 35 to 64 Years | 4 (1.1%) | 0 (0.0%) |
| 65 to 74 Years | 9 (4.7%) | 3 (1.3%) |
| 75 Years and over | 19 (13.1%) | 79 (33.9%) |
Disability Class: Vision Difficulty
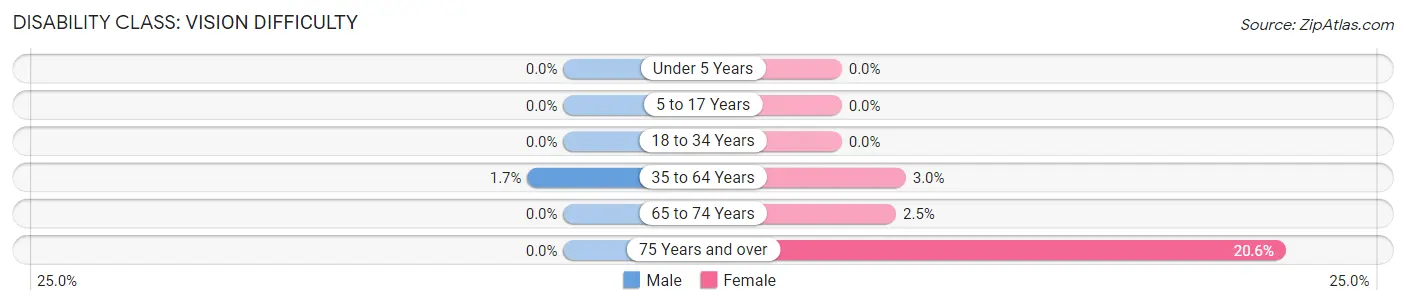
| Age Bracket | Male | Female |
| Under 5 Years | 0 (0.0%) | 0 (0.0%) |
| 5 to 17 Years | 0 (0.0%) | 0 (0.0%) |
| 18 to 34 Years | 0 (0.0%) | 0 (0.0%) |
| 35 to 64 Years | 6 (1.7%) | 13 (3.0%) |
| 65 to 74 Years | 0 (0.0%) | 6 (2.5%) |
| 75 Years and over | 0 (0.0%) | 48 (20.6%) |
Disability Class: Cognitive Difficulty
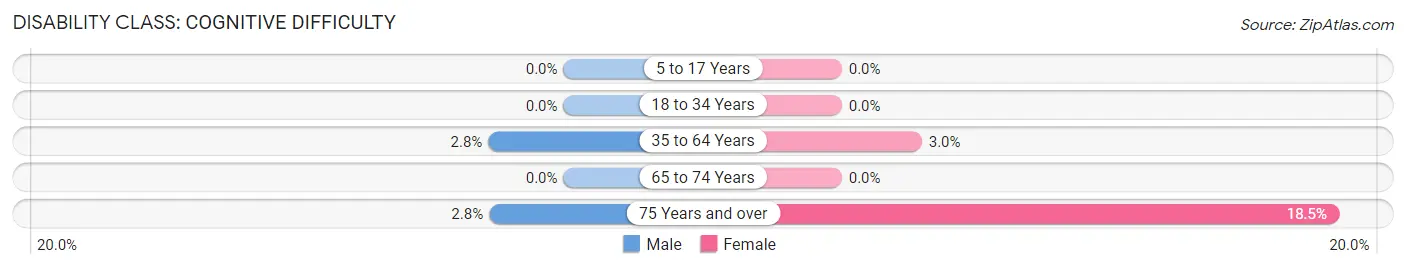
| Age Bracket | Male | Female |
| 5 to 17 Years | 0 (0.0%) | 0 (0.0%) |
| 18 to 34 Years | 0 (0.0%) | 0 (0.0%) |
| 35 to 64 Years | 10 (2.8%) | 13 (3.0%) |
| 65 to 74 Years | 0 (0.0%) | 0 (0.0%) |
| 75 Years and over | 4 (2.8%) | 43 (18.4%) |
Disability Class: Ambulatory Difficulty
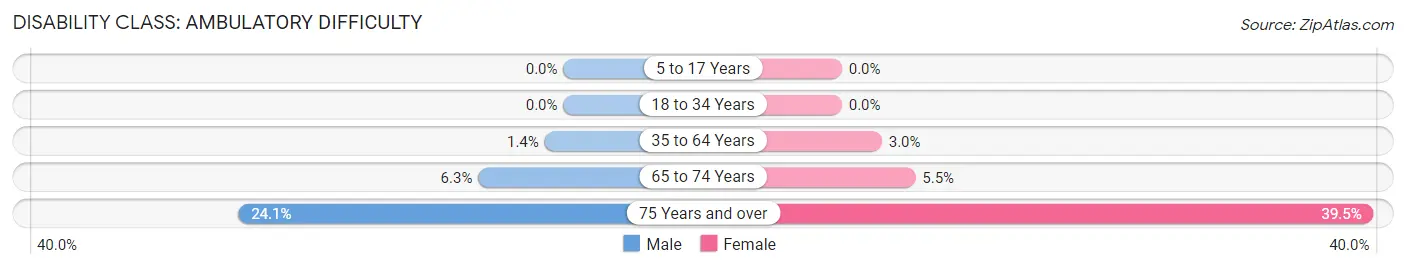
| Age Bracket | Male | Female |
| 5 to 17 Years | 0 (0.0%) | 0 (0.0%) |
| 18 to 34 Years | 0 (0.0%) | 0 (0.0%) |
| 35 to 64 Years | 5 (1.4%) | 13 (3.0%) |
| 65 to 74 Years | 12 (6.3%) | 13 (5.5%) |
| 75 Years and over | 35 (24.1%) | 92 (39.5%) |
Disability Class: Self-Care Difficulty
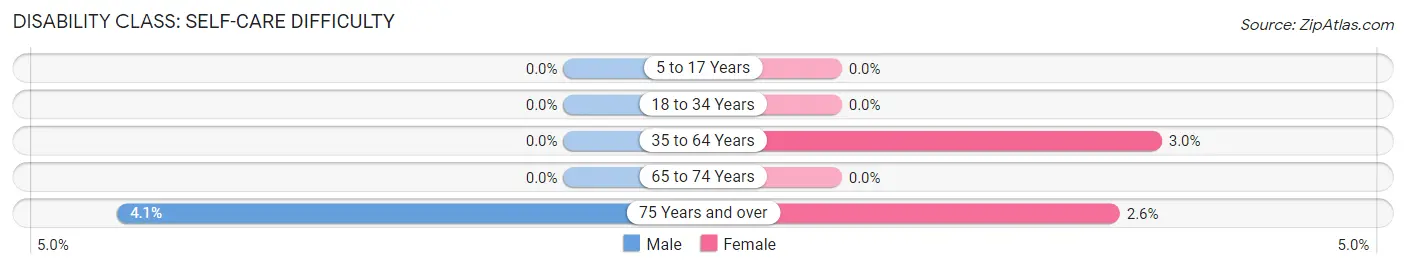
| Age Bracket | Male | Female |
| 5 to 17 Years | 0 (0.0%) | 0 (0.0%) |
| 18 to 34 Years | 0 (0.0%) | 0 (0.0%) |
| 35 to 64 Years | 0 (0.0%) | 13 (3.0%) |
| 65 to 74 Years | 0 (0.0%) | 0 (0.0%) |
| 75 Years and over | 6 (4.1%) | 6 (2.6%) |
Technology Access in Lavallette borough
Computing Device Access in Lavallette borough
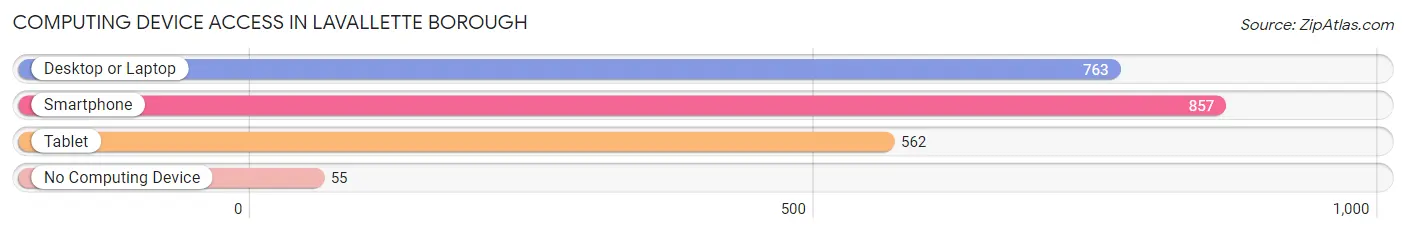
| Device Type | # Households | % Households |
| Desktop or Laptop | 763 | 78.6% |
| Smartphone | 857 | 88.3% |
| Tablet | 562 | 57.9% |
| No Computing Device | 55 | 5.7% |
| Total | 971 | 100.0% |
Internet Access in Lavallette borough
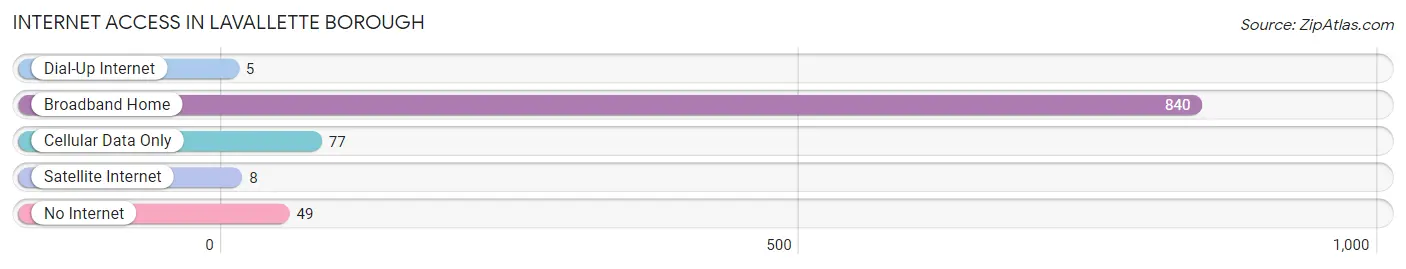
| Internet Type | # Households | % Households |
| Dial-Up Internet | 5 | 0.5% |
| Broadband Home | 840 | 86.5% |
| Cellular Data Only | 77 | 7.9% |
| Satellite Internet | 8 | 0.8% |
| No Internet | 49 | 5.1% |
| Total | 971 | 100.0% |
Lavallette borough Summary
Lavallette Borough is a small borough located in Ocean County, New Jersey. It is situated on the Barnegat Peninsula, a barrier island that separates Barnegat Bay from the Atlantic Ocean. The borough is bordered by the towns of Seaside Heights to the north, Seaside Park to the south, and Berkeley Township to the west. Lavallette is a popular summer destination for tourists and vacationers, and is known for its beaches, boardwalk, and fishing.
History
Lavallette was first settled in the late 1800s by a group of fishermen from New York City. The area was originally known as “Fisherman’s Island”, and was later renamed “Lavallette” after a French settler who had arrived in the area in the early 1900s. The borough was officially incorporated in 1887.
In the early 1900s, Lavallette became a popular summer destination for wealthy families from New York City. The town was known for its beautiful beaches and boardwalk, and was home to several large hotels and resorts. In the 1920s, the town began to attract a larger number of tourists, and the boardwalk was expanded to accommodate the influx of visitors.
In the 1950s, Lavallette began to experience a decline in tourism due to the increasing popularity of other beach towns in the area. However, the town was able to remain a popular destination due to its proximity to New York City and its beautiful beaches.
Geography
Lavallette is located on the Barnegat Peninsula, a barrier island that separates Barnegat Bay from the Atlantic Ocean. The borough is bordered by the towns of Seaside Heights to the north, Seaside Park to the south, and Berkeley Township to the west. The borough covers an area of 1.3 square miles, and is home to a population of approximately 2,000 people.
The borough is situated on a narrow strip of land between the Atlantic Ocean and Barnegat Bay. The borough is home to several beaches, including Lavallette Beach, which is located on the Atlantic Ocean side of the borough. The borough also contains a boardwalk, which runs along the beach and is a popular destination for tourists and locals alike.
Economy
The economy of Lavallette is largely driven by tourism. The borough is home to several hotels and resorts, as well as restaurants, bars, and shops. The borough also contains a marina, which is a popular destination for boaters and fishermen.
The borough is also home to several businesses that provide services to the local community, such as medical offices, banks, and real estate agencies.
Demographics
As of the 2010 census, the population of Lavallette was 2,042. The racial makeup of the borough was 94.3% White, 1.7% African American, 0.2% Native American, 1.2% Asian, 0.1% Pacific Islander, 1.2% from other races, and 1.5% from two or more races. Hispanic or Latino of any race were 4.2% of the population.
The median household income in Lavallette was $63,750, and the median family income was $76,250. The per capita income for the borough was $35,945. About 4.3% of families and 6.2% of the population were below the poverty line, including 8.2% of those under age 18 and 4.2% of those age 65 or over.
Common Questions
What is Per Capita Income in Lavallette borough?
Per Capita income in Lavallette borough is $80,917.
What is the Median Family Income in Lavallette borough?
Median Family Income in Lavallette borough is $131,851.
What is the Median Household income in Lavallette borough?
Median Household Income in Lavallette borough is $108,750.
What is Income or Wage Gap in Lavallette borough?
Income or Wage Gap in Lavallette borough is 18.8%.
Women in Lavallette borough earn 81.2 cents for every dollar earned by a man.
What is Inequality or Gini Index in Lavallette borough?
Inequality or Gini Index in Lavallette borough is 0.53.
What is the Total Population of Lavallette borough?
Total Population of Lavallette borough is 2,036.
What is the Total Male Population of Lavallette borough?
Total Male Population of Lavallette borough is 951.
What is the Total Female Population of Lavallette borough?
Total Female Population of Lavallette borough is 1,085.
What is the Ratio of Males per 100 Females in Lavallette borough?
There are 87.65 Males per 100 Females in Lavallette borough.
What is the Ratio of Females per 100 Males in Lavallette borough?
There are 114.09 Females per 100 Males in Lavallette borough.
What is the Median Population Age in Lavallette borough?
Median Population Age in Lavallette borough is 61.5 Years.
What is the Average Family Size in Lavallette borough
Average Family Size in Lavallette borough is 2.5 People.
What is the Average Household Size in Lavallette borough
Average Household Size in Lavallette borough is 2.1 People.
How Large is the Labor Force in Lavallette borough?
There are 869 People in the Labor Forcein in Lavallette borough.
What is the Percentage of People in the Labor Force in Lavallette borough?
48.4% of People are in the Labor Force in Lavallette borough.
What is the Unemployment Rate in Lavallette borough?
Unemployment Rate in Lavallette borough is 1.2%.