Erma, NJ Map & Demographics
Erma Map
Erma Overview
$36,787
PER CAPITA INCOME
$99,679
AVG FAMILY INCOME
$92,226
AVG HOUSEHOLD INCOME
30.5%
WAGE / INCOME GAP [ % ]
69.5¢/ $1
WAGE / INCOME GAP [ $ ]
0.33
INEQUALITY / GINI INDEX
1,844
TOTAL POPULATION
903
MALE POPULATION
941
FEMALE POPULATION
95.96
MALES / 100 FEMALES
104.21
FEMALES / 100 MALES
41.6
MEDIAN AGE
3.0
AVG FAMILY SIZE
2.6
AVG HOUSEHOLD SIZE
1,032
LABOR FORCE [ PEOPLE ]
72.1%
PERCENT IN LABOR FORCE
11.6%
UNEMPLOYMENT RATE
Income in Erma
Income Overview in Erma
Per Capita Income in Erma is $36,787, while median incomes of families and households are $99,679 and $92,226 respectively.
| Characteristic | Number | Measure |
| Per Capita Income | 1,844 | $36,787 |
| Median Family Income | 537 | $99,679 |
| Mean Family Income | 537 | $108,361 |
| Median Household Income | 707 | $92,226 |
| Mean Household Income | 707 | $94,944 |
| Income Deficit | 537 | $0 |
| Wage / Income Gap (%) | 1,844 | 30.50% |
| Wage / Income Gap ($) | 1,844 | 69.50¢ per $1 |
| Gini / Inequality Index | 1,844 | 0.33 |
Earnings by Sex in Erma
Average Earnings in Erma are $45,395, $57,167 for men and $39,732 for women, a difference of 30.5%.
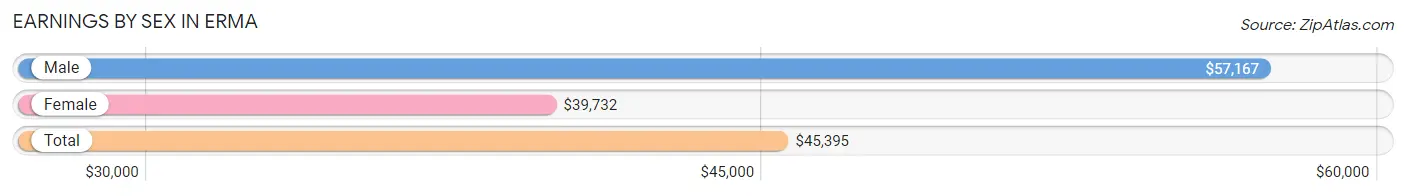
| Sex | Number | Average Earnings |
| Male | 536 (51.1%) | $57,167 |
| Female | 512 (48.8%) | $39,732 |
| Total | 1,048 (100.0%) | $45,395 |
Earnings by Sex by Income Bracket in Erma
The most common earnings brackets in Erma are $55,000 to $64,999 for men (121 | 22.6%) and $65,000 to $74,999 for women (76 | 14.8%).
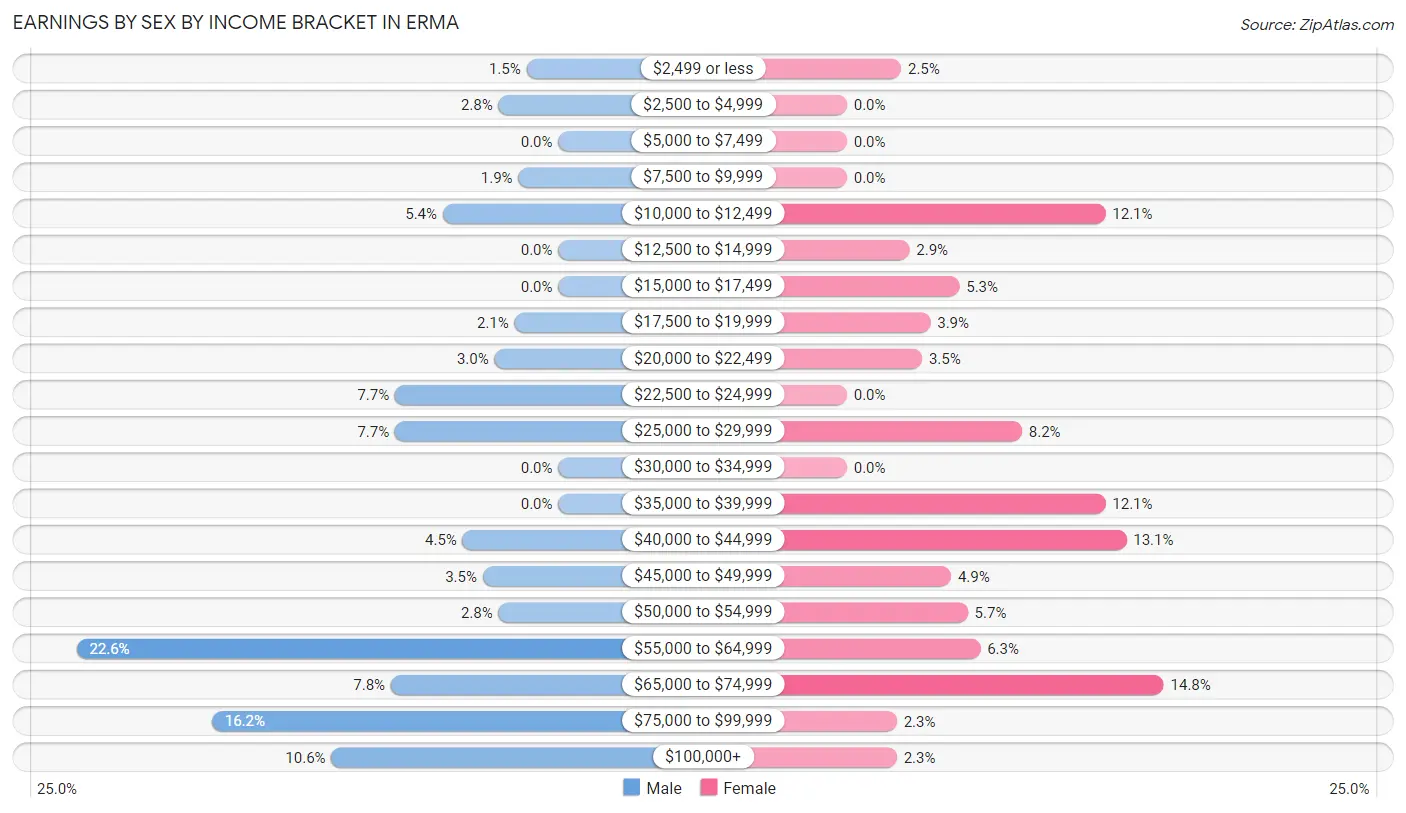
| Income | Male | Female |
| $2,499 or less | 8 (1.5%) | 13 (2.5%) |
| $2,500 to $4,999 | 15 (2.8%) | 0 (0.0%) |
| $5,000 to $7,499 | 0 (0.0%) | 0 (0.0%) |
| $7,500 to $9,999 | 10 (1.9%) | 0 (0.0%) |
| $10,000 to $12,499 | 29 (5.4%) | 62 (12.1%) |
| $12,500 to $14,999 | 0 (0.0%) | 15 (2.9%) |
| $15,000 to $17,499 | 0 (0.0%) | 27 (5.3%) |
| $17,500 to $19,999 | 11 (2.1%) | 20 (3.9%) |
| $20,000 to $22,499 | 16 (3.0%) | 18 (3.5%) |
| $22,500 to $24,999 | 41 (7.6%) | 0 (0.0%) |
| $25,000 to $29,999 | 41 (7.6%) | 42 (8.2%) |
| $30,000 to $34,999 | 0 (0.0%) | 0 (0.0%) |
| $35,000 to $39,999 | 0 (0.0%) | 62 (12.1%) |
| $40,000 to $44,999 | 24 (4.5%) | 67 (13.1%) |
| $45,000 to $49,999 | 19 (3.5%) | 25 (4.9%) |
| $50,000 to $54,999 | 15 (2.8%) | 29 (5.7%) |
| $55,000 to $64,999 | 121 (22.6%) | 32 (6.2%) |
| $65,000 to $74,999 | 42 (7.8%) | 76 (14.8%) |
| $75,000 to $99,999 | 87 (16.2%) | 12 (2.3%) |
| $100,000+ | 57 (10.6%) | 12 (2.3%) |
| Total | 536 (100.0%) | 512 (100.0%) |
Earnings by Sex by Educational Attainment in Erma
Average earnings in Erma are $57,634 for men and $43,542 for women, a difference of 24.4%. Men with an educational attainment of college or associate's degree enjoy the highest average annual earnings of $61,910, while those with high school diploma education earn the least with $47,303. Women with an educational attainment of bachelor's degree earn the most with the average annual earnings of $57,935, while those with high school diploma education have the smallest earnings of $43,243.
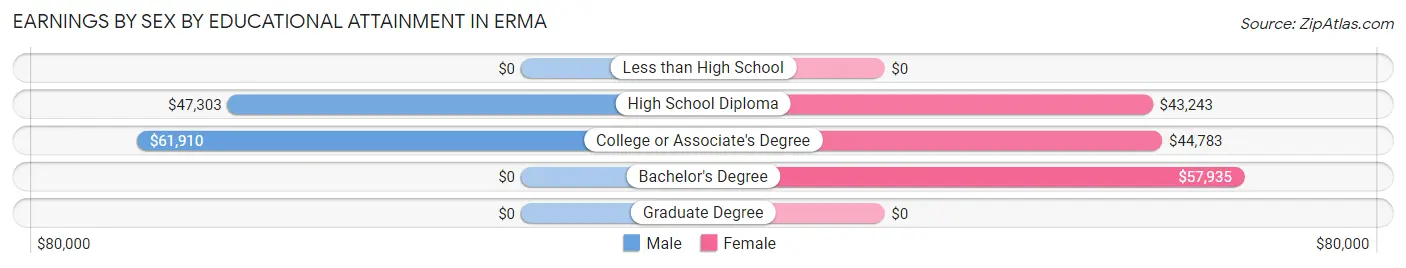
| Educational Attainment | Male Income | Female Income |
| Less than High School | - | - |
| High School Diploma | $47,303 | $43,243 |
| College or Associate's Degree | $61,910 | $44,783 |
| Bachelor's Degree | - | - |
| Graduate Degree | - | - |
| Total | $57,634 | $43,542 |
Family Income in Erma
Family Income Brackets in Erma
According to the Erma family income data, there are 157 families falling into the $100,000 to $149,999 income range, which is the most common income bracket and makes up 29.2% of all families.
| Income Bracket | # Families | % Families |
| Less than $10,000 | 0 | 0.0% |
| $10,000 to $14,999 | 0 | 0.0% |
| $15,000 to $24,999 | 0 | 0.0% |
| $25,000 to $34,999 | 0 | 0.0% |
| $35,000 to $49,999 | 40 | 7.4% |
| $50,000 to $74,999 | 140 | 26.1% |
| $75,000 to $99,999 | 93 | 17.3% |
| $100,000 to $149,999 | 157 | 29.2% |
| $150,000 to $199,999 | 52 | 9.7% |
| $200,000+ | 55 | 10.2% |
Family Income by Famaliy Size in Erma
3-person families (84 | 15.6%) account for the highest median family income in Erma with $120,781 per family, while 2-person families (296 | 55.1%) have the highest median income of $46,875 per family member.
| Income Bracket | # Families | Median Income |
| 2-Person Families | 296 (55.1%) | $93,750 |
| 3-Person Families | 84 (15.6%) | $120,781 |
| 4-Person Families | 69 (12.9%) | $0 |
| 5-Person Families | 18 (3.4%) | $0 |
| 6-Person Families | 70 (13.0%) | $0 |
| 7+ Person Families | 0 (0.0%) | $0 |
| Total | 537 (100.0%) | $99,679 |
Family Income by Number of Earners in Erma
The median family income in Erma is $99,679, with families comprising 3+ earners (78) having the highest median family income of $140,625, while families with 1 earner (144) have the lowest median family income of $55,944, accounting for 14.5% and 26.8% of families, respectively.
| Number of Earners | # Families | Median Income |
| No Earners | 53 (9.9%) | $98,162 |
| 1 Earner | 144 (26.8%) | $55,944 |
| 2 Earners | 262 (48.8%) | $105,122 |
| 3+ Earners | 78 (14.5%) | $140,625 |
| Total | 537 (100.0%) | $99,679 |
Household Income in Erma
Household Income Brackets in Erma
With 181 households falling in the category, the $100,000 to $149,999 income range is the most frequent in Erma, accounting for 25.6% of all households.
| Income Bracket | # Households | % Households |
| Less than $10,000 | 13 | 1.8% |
| $10,000 to $14,999 | 12 | 1.7% |
| $15,000 to $24,999 | 0 | 0.0% |
| $25,000 to $34,999 | 39 | 5.5% |
| $35,000 to $49,999 | 82 | 11.6% |
| $50,000 to $74,999 | 155 | 21.9% |
| $75,000 to $99,999 | 118 | 16.7% |
| $100,000 to $149,999 | 181 | 25.6% |
| $150,000 to $199,999 | 52 | 7.4% |
| $200,000+ | 55 | 7.8% |
Household Income by Householder Age in Erma
The median household income in Erma is $92,226, with the highest median household income of $95,769 found in the 45 to 64 years age bracket for the primary householder. A total of 306 households (43.3%) fall into this category.
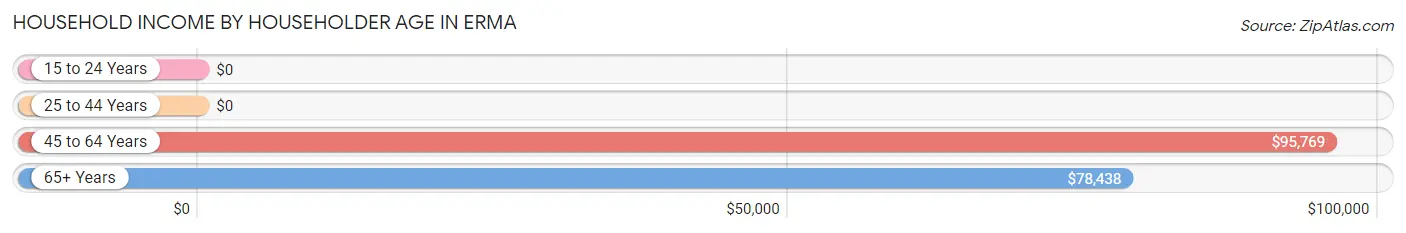
| Income Bracket | # Households | Median Income |
| 15 to 24 Years | 0 (0.0%) | $0 |
| 25 to 44 Years | 201 (28.4%) | $0 |
| 45 to 64 Years | 306 (43.3%) | $95,769 |
| 65+ Years | 200 (28.3%) | $78,438 |
| Total | 707 (100.0%) | $92,226 |
Poverty in Erma
Income Below Poverty by Sex and Age in Erma
With 5.1% poverty level for males and 1.5% for females among the residents of Erma, 25 to 34 year old males and 65 to 74 year old females are the most vulnerable to poverty, with 25 males (12.2%) and 12 females (11.9%) in their respective age groups living below the poverty level.
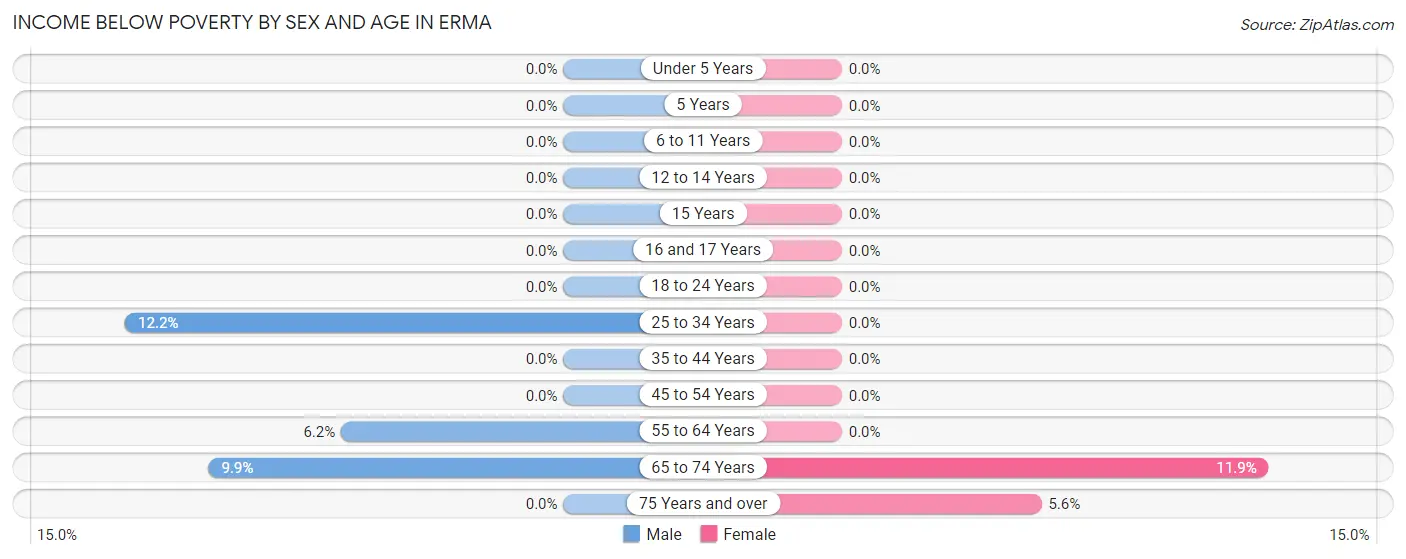
| Age Bracket | Male | Female |
| Under 5 Years | 0 (0.0%) | 0 (0.0%) |
| 5 Years | 0 (0.0%) | 0 (0.0%) |
| 6 to 11 Years | 0 (0.0%) | 0 (0.0%) |
| 12 to 14 Years | 0 (0.0%) | 0 (0.0%) |
| 15 Years | 0 (0.0%) | 0 (0.0%) |
| 16 and 17 Years | 0 (0.0%) | 0 (0.0%) |
| 18 to 24 Years | 0 (0.0%) | 0 (0.0%) |
| 25 to 34 Years | 25 (12.2%) | 0 (0.0%) |
| 35 to 44 Years | 0 (0.0%) | 0 (0.0%) |
| 45 to 54 Years | 0 (0.0%) | 0 (0.0%) |
| 55 to 64 Years | 13 (6.2%) | 0 (0.0%) |
| 65 to 74 Years | 8 (9.9%) | 12 (11.9%) |
| 75 Years and over | 0 (0.0%) | 2 (5.6%) |
| Total | 46 (5.1%) | 14 (1.5%) |
Income Above Poverty by Sex and Age in Erma
According to the poverty statistics in Erma, males aged under 5 years and females aged under 5 years are the age groups that are most secure financially, with 100.0% of males and 100.0% of females in these age groups living above the poverty line.
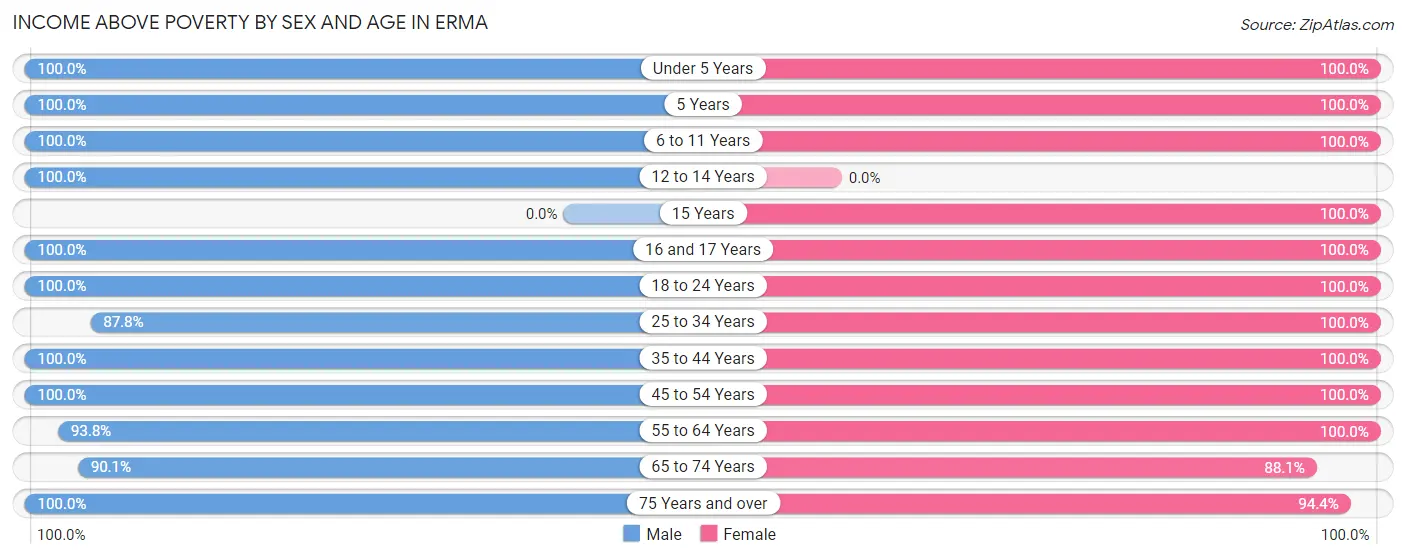
| Age Bracket | Male | Female |
| Under 5 Years | 61 (100.0%) | 112 (100.0%) |
| 5 Years | 12 (100.0%) | 26 (100.0%) |
| 6 to 11 Years | 96 (100.0%) | 75 (100.0%) |
| 12 to 14 Years | 17 (100.0%) | 0 (0.0%) |
| 15 Years | 0 (0.0%) | 10 (100.0%) |
| 16 and 17 Years | 17 (100.0%) | 36 (100.0%) |
| 18 to 24 Years | 15 (100.0%) | 51 (100.0%) |
| 25 to 34 Years | 180 (87.8%) | 109 (100.0%) |
| 35 to 44 Years | 34 (100.0%) | 116 (100.0%) |
| 45 to 54 Years | 75 (100.0%) | 73 (100.0%) |
| 55 to 64 Years | 197 (93.8%) | 193 (100.0%) |
| 65 to 74 Years | 73 (90.1%) | 89 (88.1%) |
| 75 Years and over | 80 (100.0%) | 34 (94.4%) |
| Total | 857 (94.9%) | 924 (98.5%) |
Income Below Poverty Among Married-Couple Families in Erma
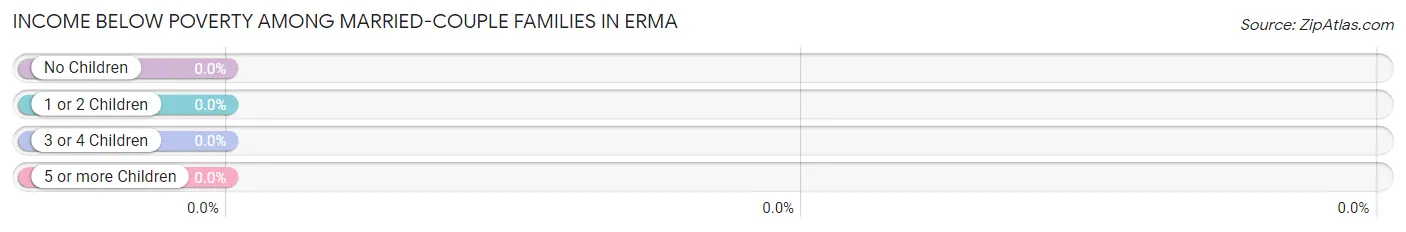
| Children | Above Poverty | Below Poverty |
| No Children | 263 (100.0%) | 0 (0.0%) |
| 1 or 2 Children | 94 (100.0%) | 0 (0.0%) |
| 3 or 4 Children | 80 (100.0%) | 0 (0.0%) |
| 5 or more Children | 0 (0.0%) | 0 (0.0%) |
| Total | 437 (100.0%) | 0 (0.0%) |
Income Below Poverty Among Single-Parent Households in Erma
| Children | Single Father | Single Mother |
| No Children | 0 (0.0%) | 0 (0.0%) |
| 1 or 2 Children | 0 (0.0%) | 0 (0.0%) |
| 3 or 4 Children | 0 (0.0%) | 0 (0.0%) |
| 5 or more Children | 0 (0.0%) | 0 (0.0%) |
| Total | 0 (0.0%) | 0 (0.0%) |
Income Below Poverty Among Married-Couple vs Single-Parent Households in Erma
| Children | Married-Couple Families | Single-Parent Households |
| No Children | 0 (0.0%) | 0 (0.0%) |
| 1 or 2 Children | 0 (0.0%) | 0 (0.0%) |
| 3 or 4 Children | 0 (0.0%) | 0 (0.0%) |
| 5 or more Children | 0 (0.0%) | 0 (0.0%) |
| Total | 0 (0.0%) | 0 (0.0%) |
Race in Erma
The most populous races in Erma are White / Caucasian (1,438 | 78.0%), Two or more Races (322 | 17.5%), and Hispanic or Latino (125 | 6.8%).
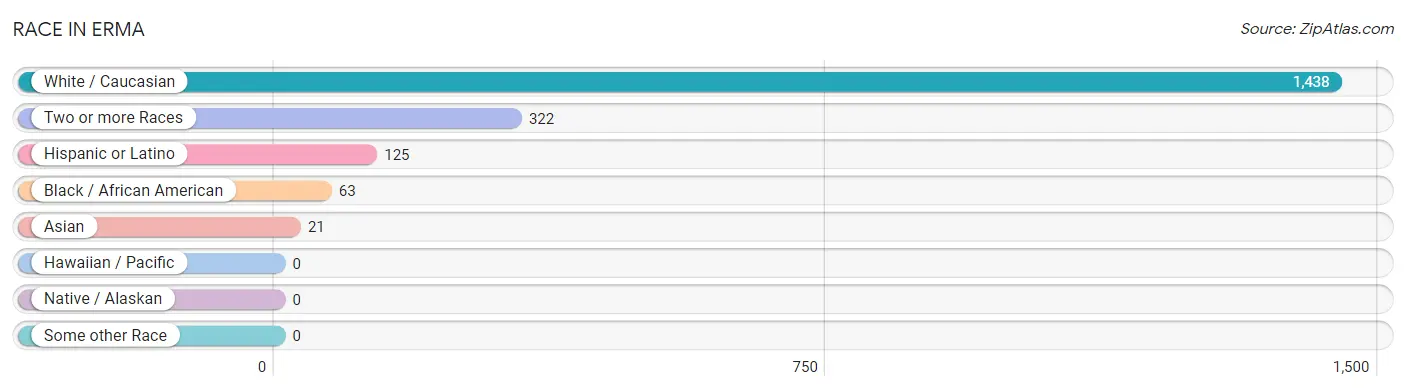
| Race | # Population | % Population |
| Asian | 21 | 1.1% |
| Black / African American | 63 | 3.4% |
| Hawaiian / Pacific | 0 | 0.0% |
| Hispanic or Latino | 125 | 6.8% |
| Native / Alaskan | 0 | 0.0% |
| White / Caucasian | 1,438 | 78.0% |
| Two or more Races | 322 | 17.5% |
| Some other Race | 0 | 0.0% |
| Total | 1,844 | 100.0% |
Ancestry in Erma
The most populous ancestries reported in Erma are Irish (495 | 26.8%), German (392 | 21.3%), English (232 | 12.6%), Italian (188 | 10.2%), and Polish (123 | 6.7%), together accounting for 77.5% of all Erma residents.
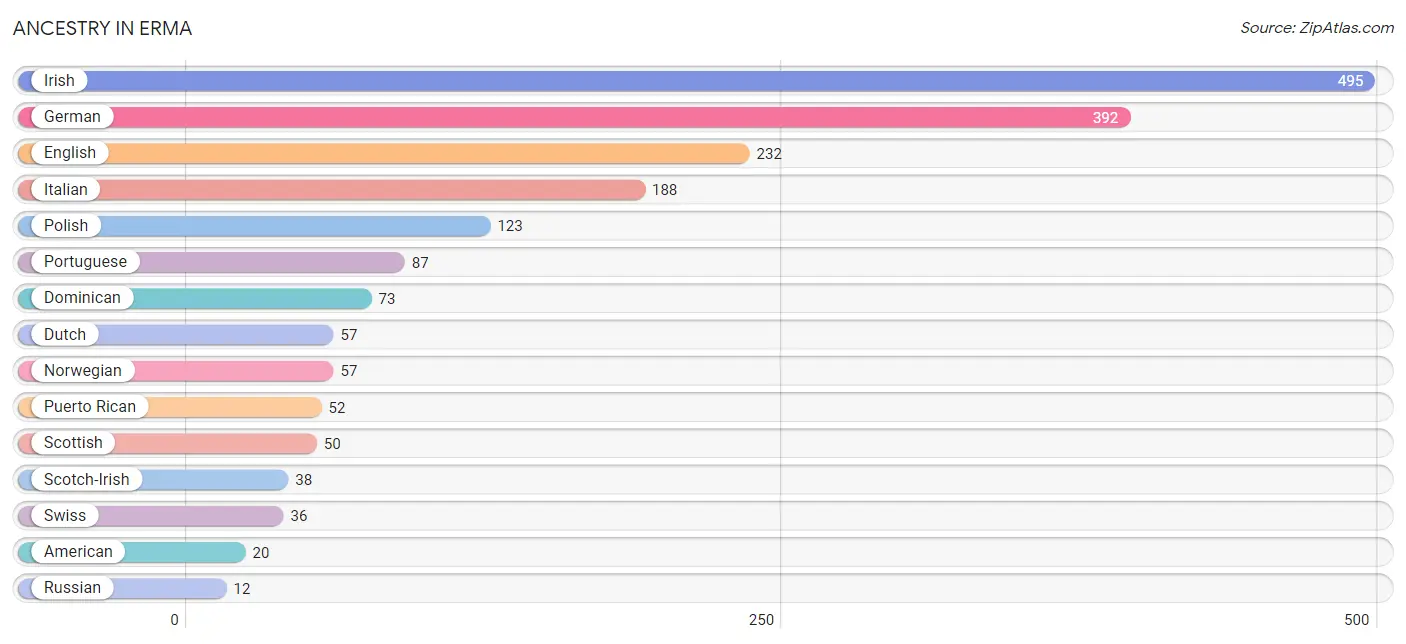
| Ancestry | # Population | % Population |
| American | 20 | 1.1% |
| Dominican | 73 | 4.0% |
| Dutch | 57 | 3.1% |
| English | 232 | 12.6% |
| German | 392 | 21.3% |
| Irish | 495 | 26.8% |
| Italian | 188 | 10.2% |
| Lithuanian | 8 | 0.4% |
| Maltese | 8 | 0.4% |
| Norwegian | 57 | 3.1% |
| Pakistani | 9 | 0.5% |
| Pennsylvania German | 7 | 0.4% |
| Polish | 123 | 6.7% |
| Portuguese | 87 | 4.7% |
| Puerto Rican | 52 | 2.8% |
| Russian | 12 | 0.6% |
| Scotch-Irish | 38 | 2.1% |
| Scottish | 50 | 2.7% |
| Swedish | 11 | 0.6% |
| Swiss | 36 | 1.9% |
| Thai | 12 | 0.6% |
| Welsh | 11 | 0.6% | View All 22 Rows |
Immigrants in Erma
The most numerous immigrant groups reported in Erma came from Europe (63 | 3.4%), Northern Europe (27 | 1.5%), Portugal (24 | 1.3%), Southern Europe (24 | 1.3%), and Asia (21 | 1.1%), together accounting for 8.6% of all Erma residents.
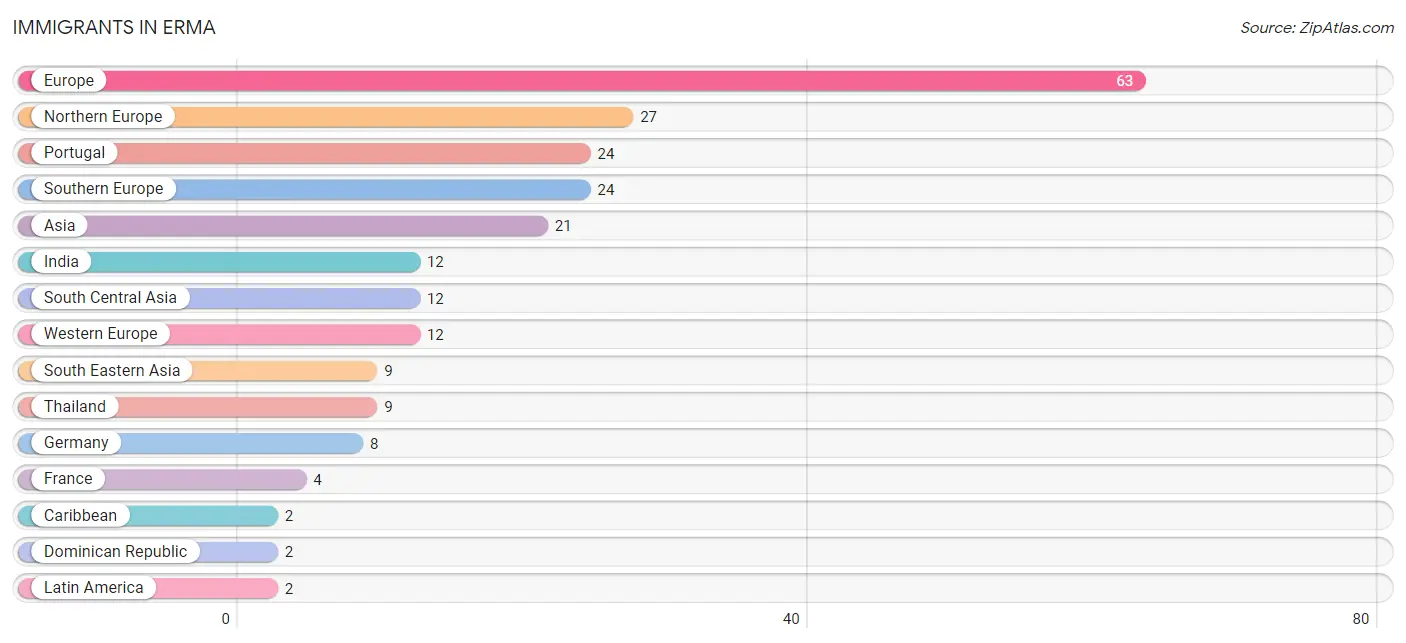
| Immigration Origin | # Population | % Population |
| Asia | 21 | 1.1% |
| Caribbean | 2 | 0.1% |
| Dominican Republic | 2 | 0.1% |
| Europe | 63 | 3.4% |
| France | 4 | 0.2% |
| Germany | 8 | 0.4% |
| India | 12 | 0.6% |
| Latin America | 2 | 0.1% |
| Northern Europe | 27 | 1.5% |
| Portugal | 24 | 1.3% |
| South Central Asia | 12 | 0.6% |
| South Eastern Asia | 9 | 0.5% |
| Southern Europe | 24 | 1.3% |
| Thailand | 9 | 0.5% |
| Western Europe | 12 | 0.6% | View All 15 Rows |
Sex and Age in Erma
Sex and Age in Erma
The most populous age groups in Erma are 60 to 64 Years (144 | 16.0%) for men and 60 to 64 Years (121 | 12.9%) for women.
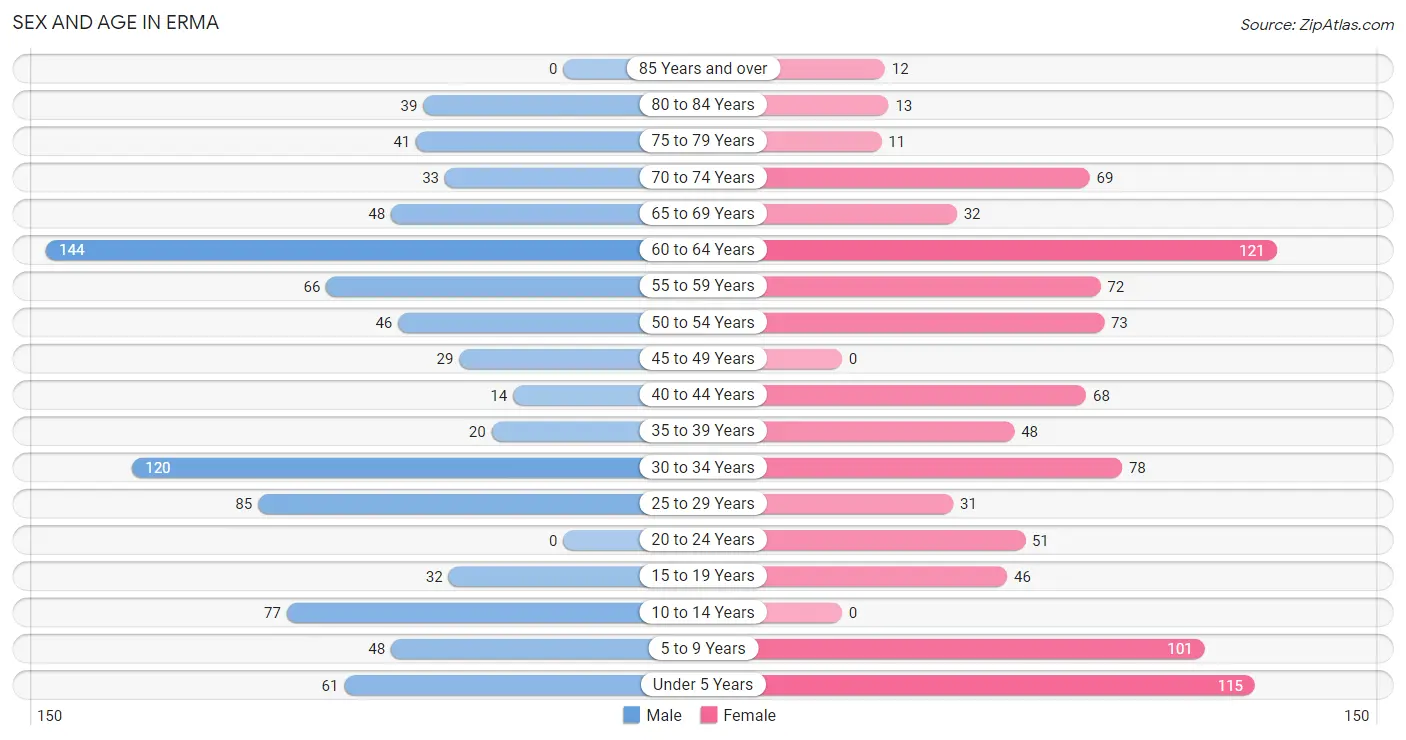
| Age Bracket | Male | Female |
| Under 5 Years | 61 (6.8%) | 115 (12.2%) |
| 5 to 9 Years | 48 (5.3%) | 101 (10.7%) |
| 10 to 14 Years | 77 (8.5%) | 0 (0.0%) |
| 15 to 19 Years | 32 (3.5%) | 46 (4.9%) |
| 20 to 24 Years | 0 (0.0%) | 51 (5.4%) |
| 25 to 29 Years | 85 (9.4%) | 31 (3.3%) |
| 30 to 34 Years | 120 (13.3%) | 78 (8.3%) |
| 35 to 39 Years | 20 (2.2%) | 48 (5.1%) |
| 40 to 44 Years | 14 (1.5%) | 68 (7.2%) |
| 45 to 49 Years | 29 (3.2%) | 0 (0.0%) |
| 50 to 54 Years | 46 (5.1%) | 73 (7.8%) |
| 55 to 59 Years | 66 (7.3%) | 72 (7.6%) |
| 60 to 64 Years | 144 (16.0%) | 121 (12.9%) |
| 65 to 69 Years | 48 (5.3%) | 32 (3.4%) |
| 70 to 74 Years | 33 (3.6%) | 69 (7.3%) |
| 75 to 79 Years | 41 (4.5%) | 11 (1.2%) |
| 80 to 84 Years | 39 (4.3%) | 13 (1.4%) |
| 85 Years and over | 0 (0.0%) | 12 (1.3%) |
| Total | 903 (100.0%) | 941 (100.0%) |
Families and Households in Erma
Median Family Size in Erma
The median family size in Erma is 2.98 persons per family, with married-couple families (437 | 81.4%) accounting for the largest median family size of 3.14 persons per family. On the other hand, single male/father families (54 | 10.1%) represent the smallest median family size with 1.78 persons per family.
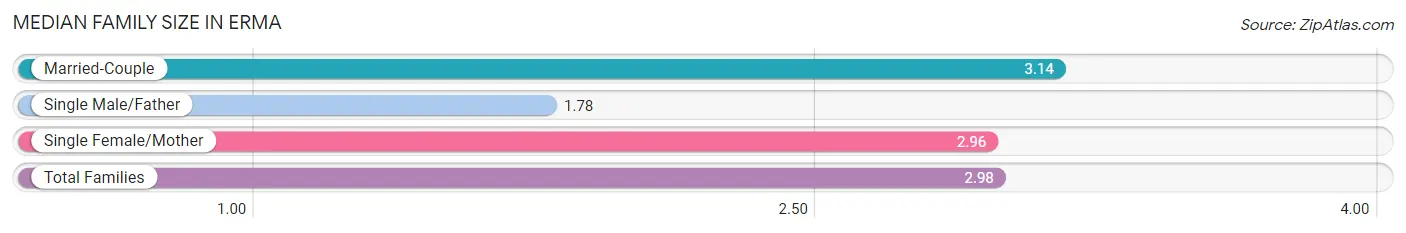
| Family Type | # Families | Family Size |
| Married-Couple | 437 (81.4%) | 3.14 |
| Single Male/Father | 54 (10.1%) | 1.78 |
| Single Female/Mother | 46 (8.6%) | 2.96 |
| Total Families | 537 (100.0%) | 2.98 |
Median Household Size in Erma
The median household size in Erma is 2.60 persons per household, with married-couple households (437 | 61.8%) accounting for the largest median household size of 3.2 persons per household. non-family households (170 | 24.0%) represent the smallest median household size with 1.22 persons per household.
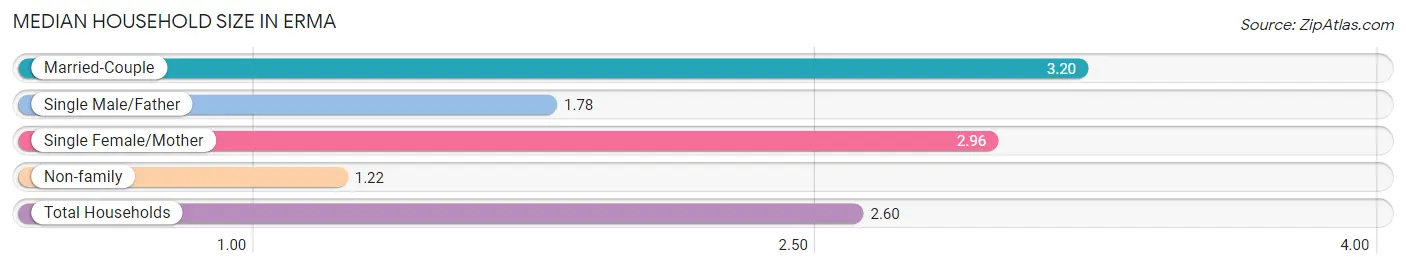
| Household Type | # Households | Household Size |
| Married-Couple | 437 (61.8%) | 3.20 |
| Single Male/Father | 54 (7.6%) | 1.78 |
| Single Female/Mother | 46 (6.5%) | 2.96 |
| Non-family | 170 (24.0%) | 1.22 |
| Total Households | 707 (100.0%) | 2.60 |
Household Size by Marriage Status in Erma
Out of a total of 707 households in Erma, 537 (75.9%) are family households, while 170 (24.0%) are nonfamily households. The most numerous type of family households are 2-person households, comprising 283, and the most common type of nonfamily households are 1-person households, comprising 130.
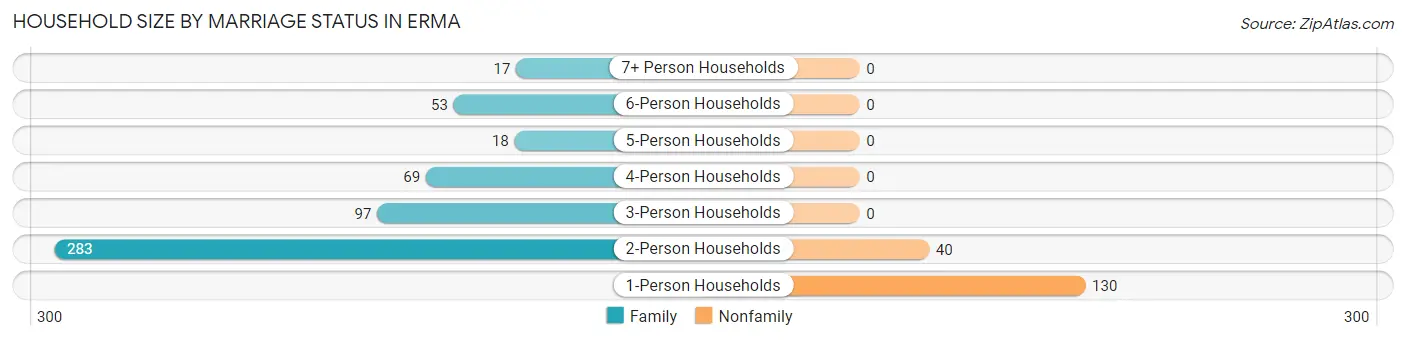
| Household Size | Family Households | Nonfamily Households |
| 1-Person Households | - | 130 (18.4%) |
| 2-Person Households | 283 (40.0%) | 40 (5.7%) |
| 3-Person Households | 97 (13.7%) | 0 (0.0%) |
| 4-Person Households | 69 (9.8%) | 0 (0.0%) |
| 5-Person Households | 18 (2.5%) | 0 (0.0%) |
| 6-Person Households | 53 (7.5%) | 0 (0.0%) |
| 7+ Person Households | 17 (2.4%) | 0 (0.0%) |
| Total | 537 (75.9%) | 170 (24.0%) |
Female Fertility in Erma
Fertility by Age in Erma
Average fertility rate in Erma is 60.0 births per 1,000 women. Women in the age bracket of 20 to 34 years have the highest fertility rate with 125.0 births per 1,000 women. Women in the age bracket of 20 to 34 years acount for 100.0% of all women with births.
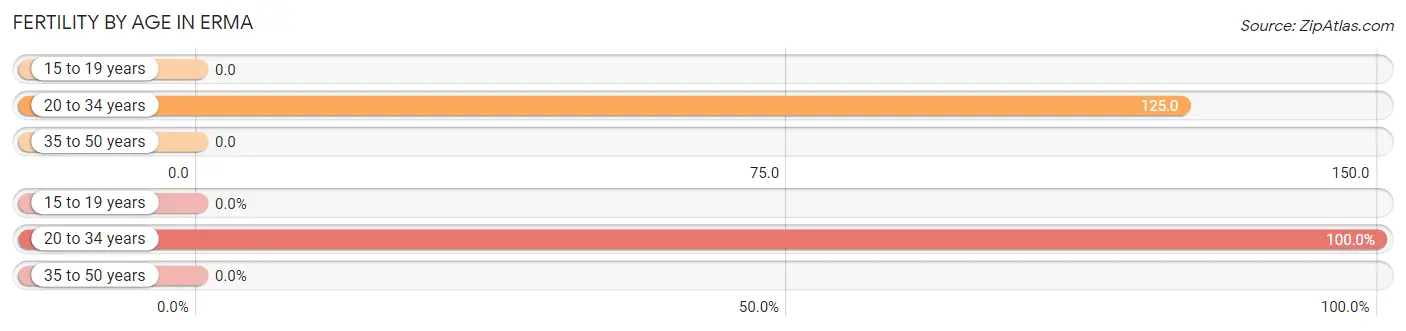
| Age Bracket | Women with Births | Births / 1,000 Women |
| 15 to 19 years | 0 (0.0%) | 0.0 |
| 20 to 34 years | 20 (100.0%) | 125.0 |
| 35 to 50 years | 0 (0.0%) | 0.0 |
| Total | 20 (100.0%) | 60.0 |
Fertility by Age by Marriage Status in Erma
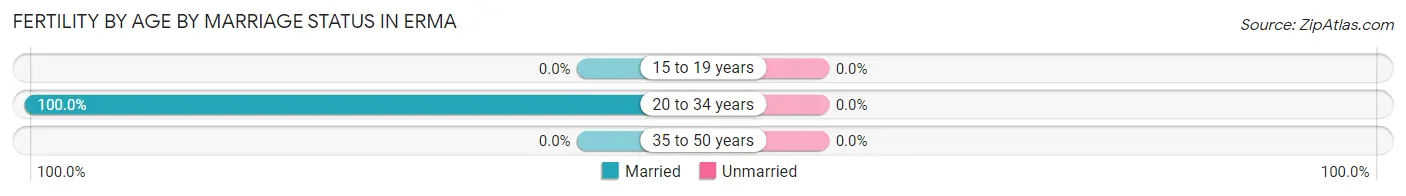
| Age Bracket | Married | Unmarried |
| 15 to 19 years | 0 (0.0%) | 0 (0.0%) |
| 20 to 34 years | 20 (100.0%) | 0 (0.0%) |
| 35 to 50 years | 0 (0.0%) | 0 (0.0%) |
| Total | 20 (100.0%) | 0 (0.0%) |
Fertility by Education in Erma
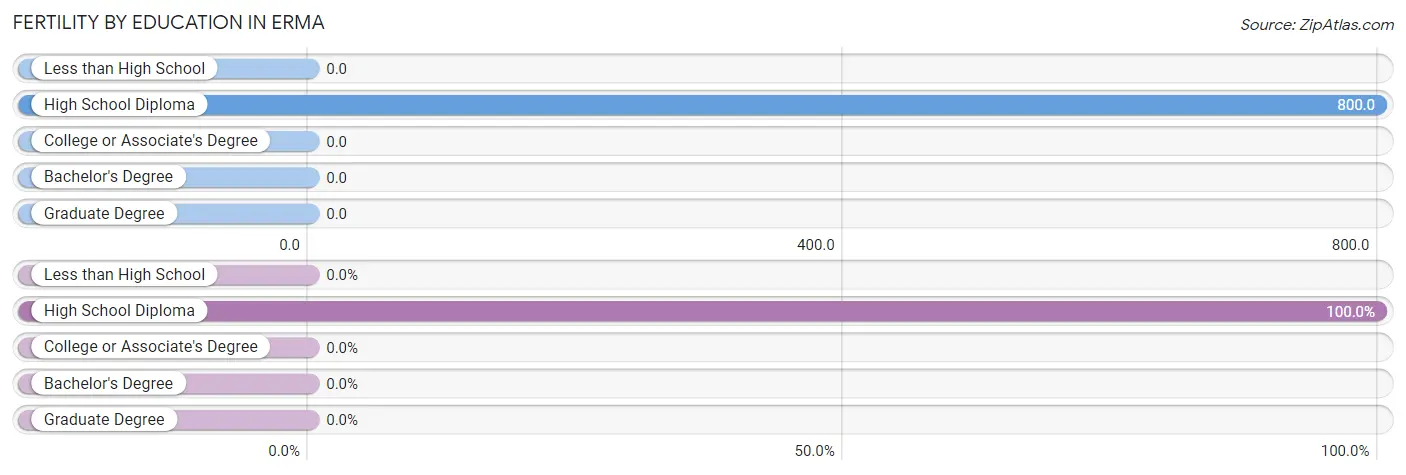
| Educational Attainment | Women with Births | Births / 1,000 Women |
| Less than High School | 0 (0.0%) | 0.0 |
| High School Diploma | 20 (100.0%) | 800.0 |
| College or Associate's Degree | 0 (0.0%) | 0.0 |
| Bachelor's Degree | 0 (0.0%) | 0.0 |
| Graduate Degree | 0 (0.0%) | 0.0 |
| Total | 20 (100.0%) | 60.0 |
Fertility by Education by Marriage Status in Erma
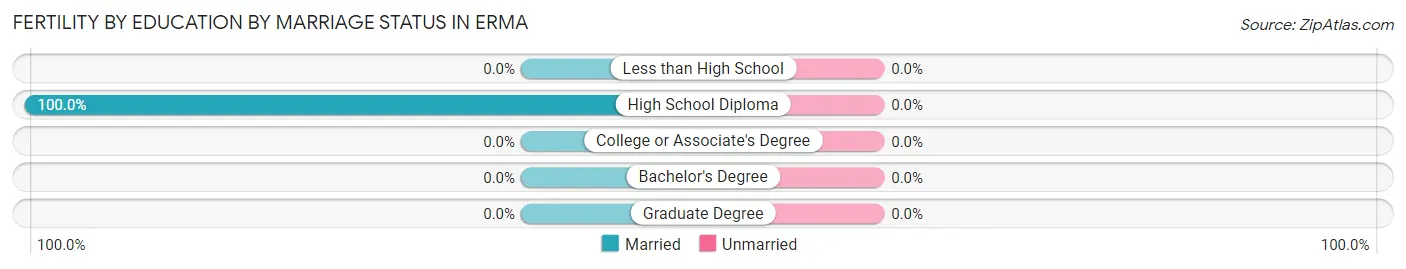
| Educational Attainment | Married | Unmarried |
| Less than High School | 0 (0.0%) | 0 (0.0%) |
| High School Diploma | 20 (100.0%) | 0 (0.0%) |
| College or Associate's Degree | 0 (0.0%) | 0 (0.0%) |
| Bachelor's Degree | 0 (0.0%) | 0 (0.0%) |
| Graduate Degree | 0 (0.0%) | 0 (0.0%) |
| Total | 20 (100.0%) | 0 (0.0%) |
Employment Characteristics in Erma
Employment by Class of Employer in Erma
Among the 868 employed individuals in Erma, private company employees (446 | 51.4%), local government employees (147 | 16.9%), and state government employees (65 | 7.5%) make up the most common classes of employment.
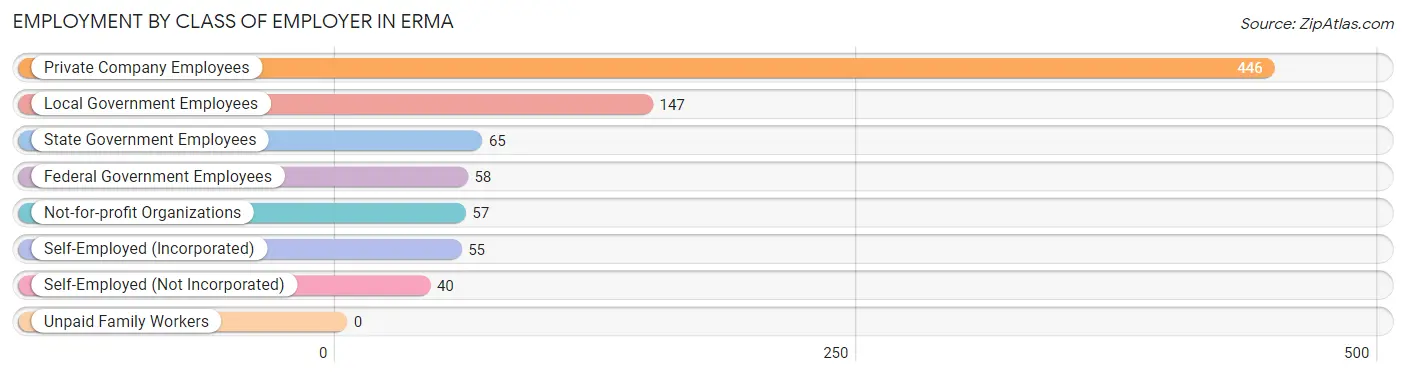
| Employer Class | # Employees | % Employees |
| Private Company Employees | 446 | 51.4% |
| Self-Employed (Incorporated) | 55 | 6.3% |
| Self-Employed (Not Incorporated) | 40 | 4.6% |
| Not-for-profit Organizations | 57 | 6.6% |
| Local Government Employees | 147 | 16.9% |
| State Government Employees | 65 | 7.5% |
| Federal Government Employees | 58 | 6.7% |
| Unpaid Family Workers | 0 | 0.0% |
| Total | 868 | 100.0% |
Employment Status by Age in Erma
According to the labor force statistics for Erma, out of the total population over 16 years of age (1,432), 72.1% or 1,032 individuals are in the labor force, with 11.6% or 120 of them unemployed. The age group with the highest labor force participation rate is 20 to 24 years, with 100.0% or 51 individuals in the labor force. Within the labor force, the 45 to 54 years age range has the highest percentage of unemployed individuals, with 39.9% or 59 of them being unemployed.
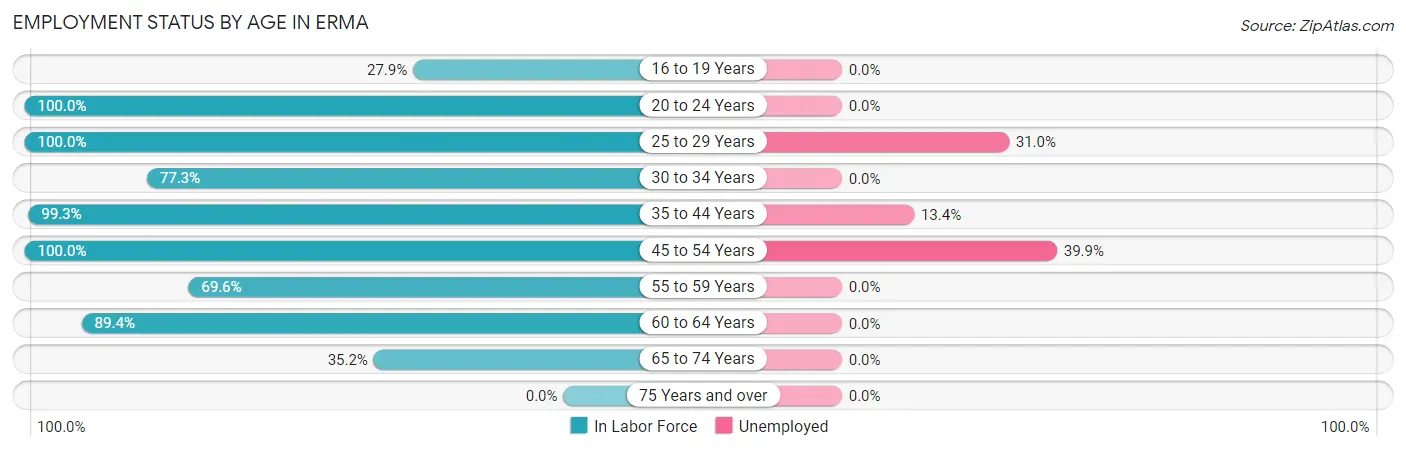
| Age Bracket | In Labor Force | Unemployed |
| 16 to 19 Years | 19 (27.9%) | 0 (0.0%) |
| 20 to 24 Years | 51 (100.0%) | 0 (0.0%) |
| 25 to 29 Years | 116 (100.0%) | 36 (31.0%) |
| 30 to 34 Years | 153 (77.3%) | 0 (0.0%) |
| 35 to 44 Years | 149 (99.3%) | 20 (13.4%) |
| 45 to 54 Years | 148 (100.0%) | 59 (39.9%) |
| 55 to 59 Years | 96 (69.6%) | 0 (0.0%) |
| 60 to 64 Years | 237 (89.4%) | 0 (0.0%) |
| 65 to 74 Years | 64 (35.2%) | 0 (0.0%) |
| 75 Years and over | 0 (0.0%) | 0 (0.0%) |
| Total | 1,032 (72.1%) | 120 (11.6%) |
Employment Status by Educational Attainment in Erma
According to labor force statistics for Erma, 88.6% of individuals (899) out of the total population between 25 and 64 years of age (1,015) are in the labor force, with 13.5% or 121 of them being unemployed. The group with the highest labor force participation rate are those with the educational attainment of bachelor's degree or higher, with 96.1% or 324 individuals in the labor force. Within the labor force, individuals with bachelor's degree or higher education have the highest percentage of unemployment, with 31.8% or 103 of them being unemployed.
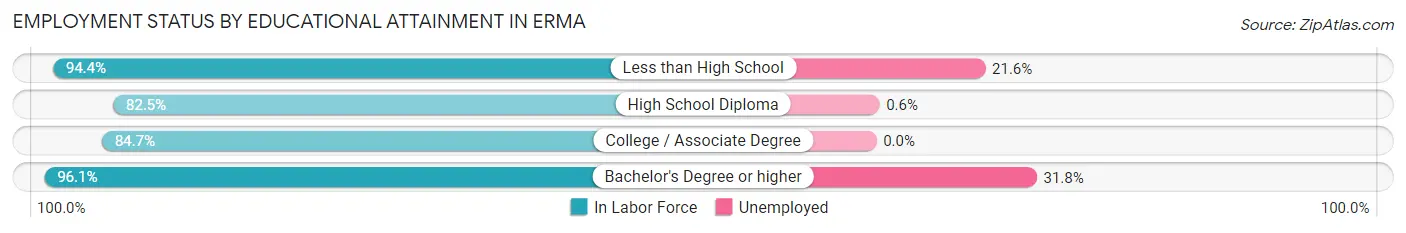
| Educational Attainment | In Labor Force | Unemployed |
| Less than High School | 51 (94.4%) | 12 (21.6%) |
| High School Diploma | 175 (82.5%) | 1 (0.6%) |
| College / Associate Degree | 349 (84.7%) | 0 (0.0%) |
| Bachelor's Degree or higher | 324 (96.1%) | 107 (31.8%) |
| Total | 899 (88.6%) | 137 (13.5%) |
Employment Occupations by Sex in Erma
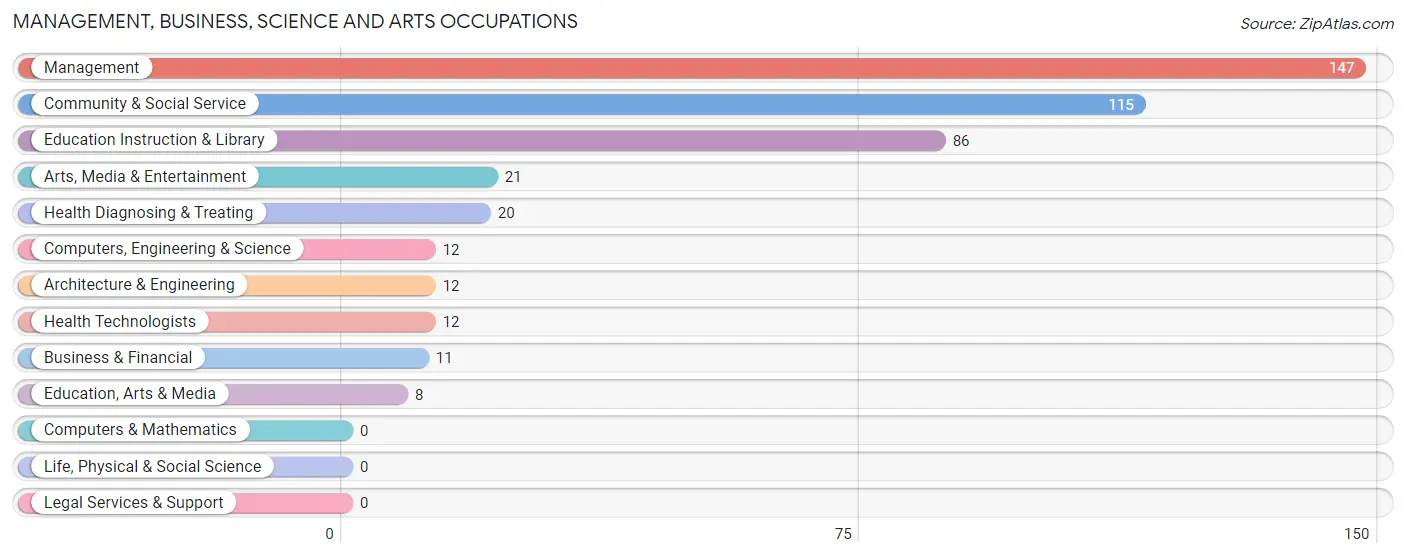
Management, Business, Science and Arts Occupations
The most common Management, Business, Science and Arts occupations in Erma are Management (147 | 16.8%), Community & Social Service (115 | 13.2%), Education Instruction & Library (86 | 9.9%), Arts, Media & Entertainment (21 | 2.4%), and Health Diagnosing & Treating (20 | 2.3%).
Management, Business, Science and Arts Occupations by Sex
Within the Management, Business, Science and Arts occupations in Erma, the most male-oriented occupations are Computers, Engineering & Science (100.0%), Architecture & Engineering (100.0%), and Management (50.3%), while the most female-oriented occupations are Education, Arts & Media (100.0%), Arts, Media & Entertainment (100.0%), and Health Diagnosing & Treating (100.0%).
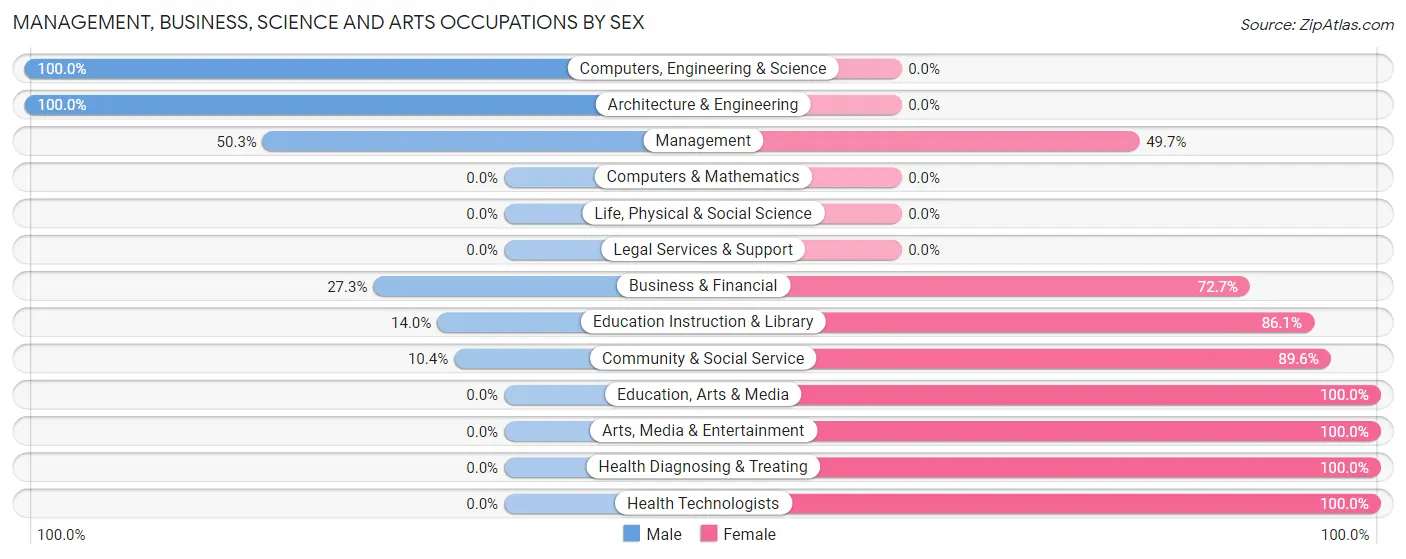
| Occupation | Male | Female |
| Management | 74 (50.3%) | 73 (49.7%) |
| Business & Financial | 3 (27.3%) | 8 (72.7%) |
| Computers, Engineering & Science | 12 (100.0%) | 0 (0.0%) |
| Computers & Mathematics | 0 (0.0%) | 0 (0.0%) |
| Architecture & Engineering | 12 (100.0%) | 0 (0.0%) |
| Life, Physical & Social Science | 0 (0.0%) | 0 (0.0%) |
| Community & Social Service | 12 (10.4%) | 103 (89.6%) |
| Education, Arts & Media | 0 (0.0%) | 8 (100.0%) |
| Legal Services & Support | 0 (0.0%) | 0 (0.0%) |
| Education Instruction & Library | 12 (14.0%) | 74 (86.1%) |
| Arts, Media & Entertainment | 0 (0.0%) | 21 (100.0%) |
| Health Diagnosing & Treating | 0 (0.0%) | 20 (100.0%) |
| Health Technologists | 0 (0.0%) | 12 (100.0%) |
| Total (Category) | 101 (33.1%) | 204 (66.9%) |
| Total (Overall) | 420 (48.1%) | 453 (51.9%) |
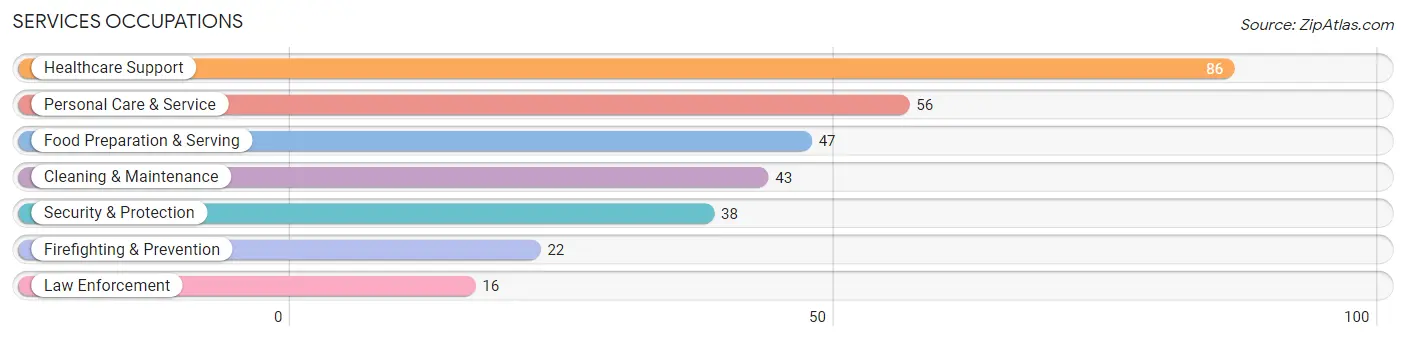
Services Occupations
The most common Services occupations in Erma are Healthcare Support (86 | 9.9%), Personal Care & Service (56 | 6.4%), Food Preparation & Serving (47 | 5.4%), Cleaning & Maintenance (43 | 4.9%), and Security & Protection (38 | 4.3%).
Services Occupations by Sex
Within the Services occupations in Erma, the most male-oriented occupations are Law Enforcement (100.0%), Cleaning & Maintenance (100.0%), and Security & Protection (76.3%), while the most female-oriented occupations are Healthcare Support (100.0%), Food Preparation & Serving (44.7%), and Firefighting & Prevention (40.9%).
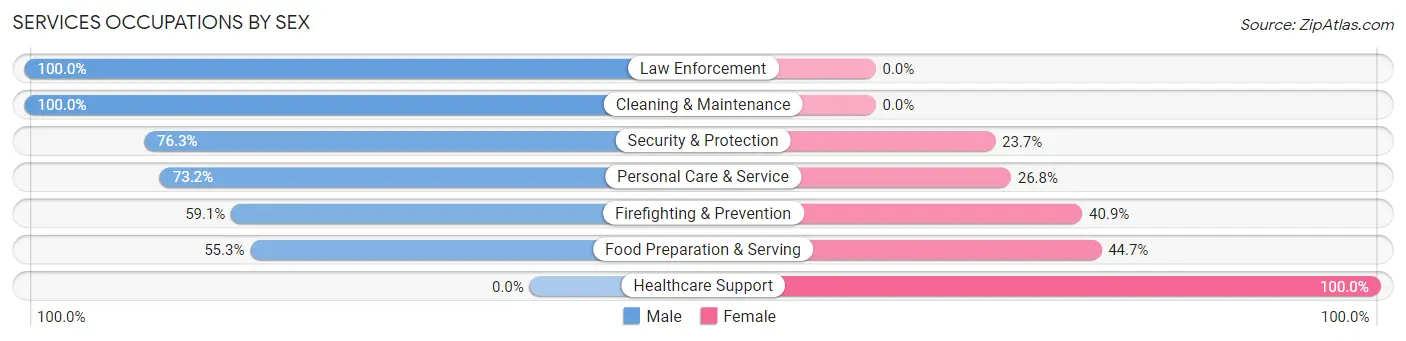
| Occupation | Male | Female |
| Healthcare Support | 0 (0.0%) | 86 (100.0%) |
| Security & Protection | 29 (76.3%) | 9 (23.7%) |
| Firefighting & Prevention | 13 (59.1%) | 9 (40.9%) |
| Law Enforcement | 16 (100.0%) | 0 (0.0%) |
| Food Preparation & Serving | 26 (55.3%) | 21 (44.7%) |
| Cleaning & Maintenance | 43 (100.0%) | 0 (0.0%) |
| Personal Care & Service | 41 (73.2%) | 15 (26.8%) |
| Total (Category) | 139 (51.5%) | 131 (48.5%) |
| Total (Overall) | 420 (48.1%) | 453 (51.9%) |
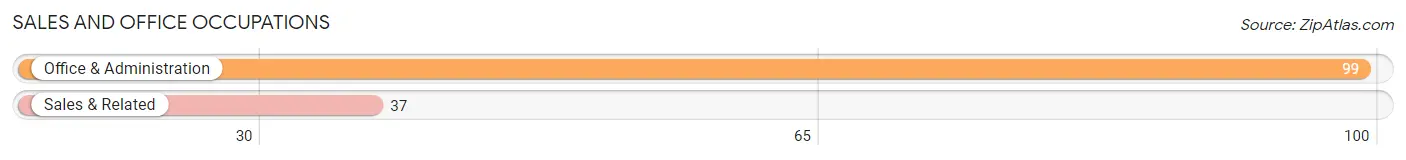
Sales and Office Occupations
The most common Sales and Office occupations in Erma are Office & Administration (99 | 11.3%), and Sales & Related (37 | 4.2%).
Sales and Office Occupations by Sex
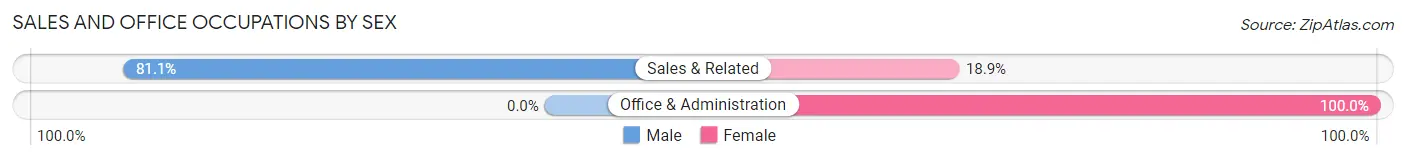
| Occupation | Male | Female |
| Sales & Related | 30 (81.1%) | 7 (18.9%) |
| Office & Administration | 0 (0.0%) | 99 (100.0%) |
| Total (Category) | 30 (22.1%) | 106 (77.9%) |
| Total (Overall) | 420 (48.1%) | 453 (51.9%) |
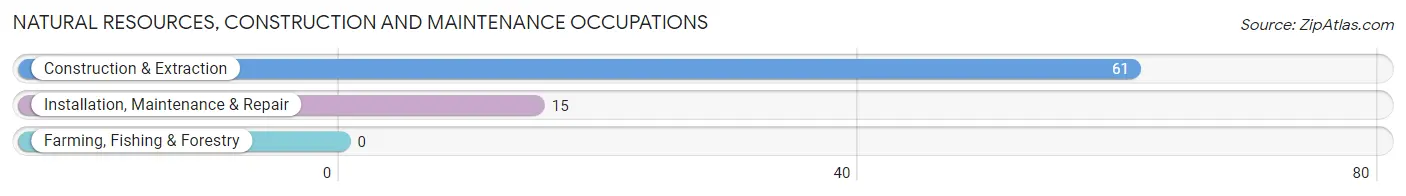
Natural Resources, Construction and Maintenance Occupations
The most common Natural Resources, Construction and Maintenance occupations in Erma are Construction & Extraction (61 | 7.0%), and Installation, Maintenance & Repair (15 | 1.7%).
Natural Resources, Construction and Maintenance Occupations by Sex
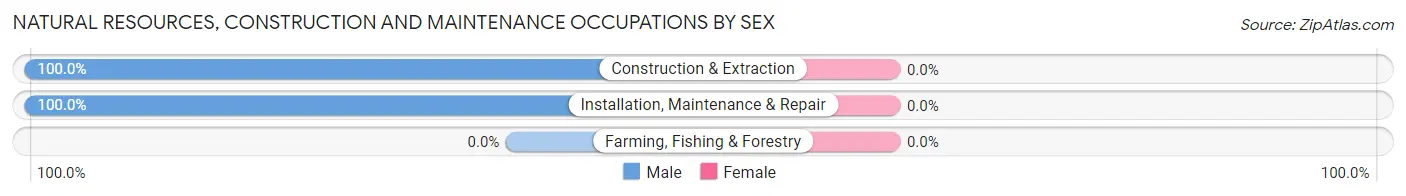
| Occupation | Male | Female |
| Farming, Fishing & Forestry | 0 (0.0%) | 0 (0.0%) |
| Construction & Extraction | 61 (100.0%) | 0 (0.0%) |
| Installation, Maintenance & Repair | 15 (100.0%) | 0 (0.0%) |
| Total (Category) | 76 (100.0%) | 0 (0.0%) |
| Total (Overall) | 420 (48.1%) | 453 (51.9%) |
Production, Transportation and Moving Occupations
The most common Production, Transportation and Moving occupations in Erma are Production (64 | 7.3%), Transportation (14 | 1.6%), and Material Moving (8 | 0.9%).
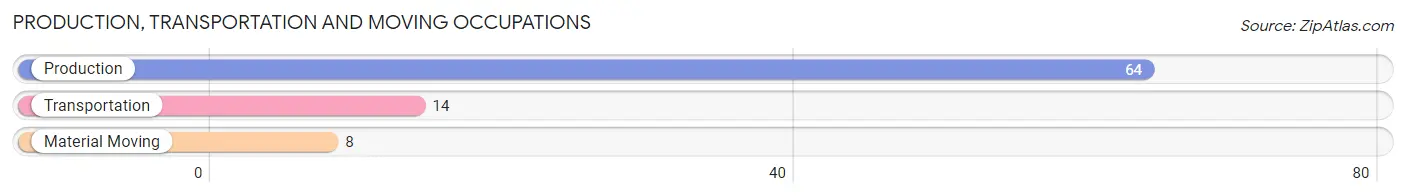
Production, Transportation and Moving Occupations by Sex
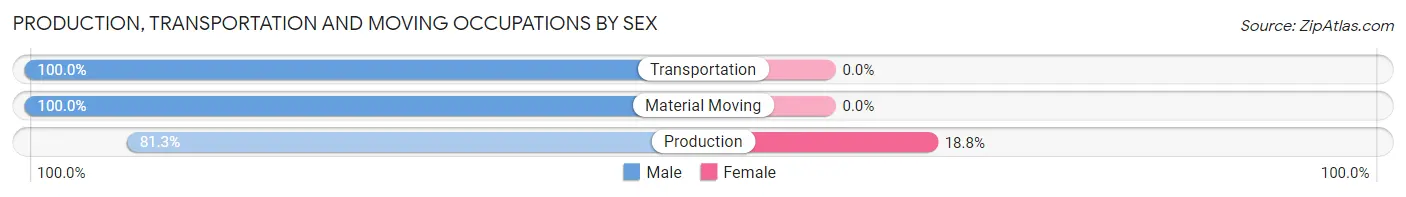
| Occupation | Male | Female |
| Production | 52 (81.2%) | 12 (18.8%) |
| Transportation | 14 (100.0%) | 0 (0.0%) |
| Material Moving | 8 (100.0%) | 0 (0.0%) |
| Total (Category) | 74 (86.1%) | 12 (14.0%) |
| Total (Overall) | 420 (48.1%) | 453 (51.9%) |
Employment Industries by Sex in Erma
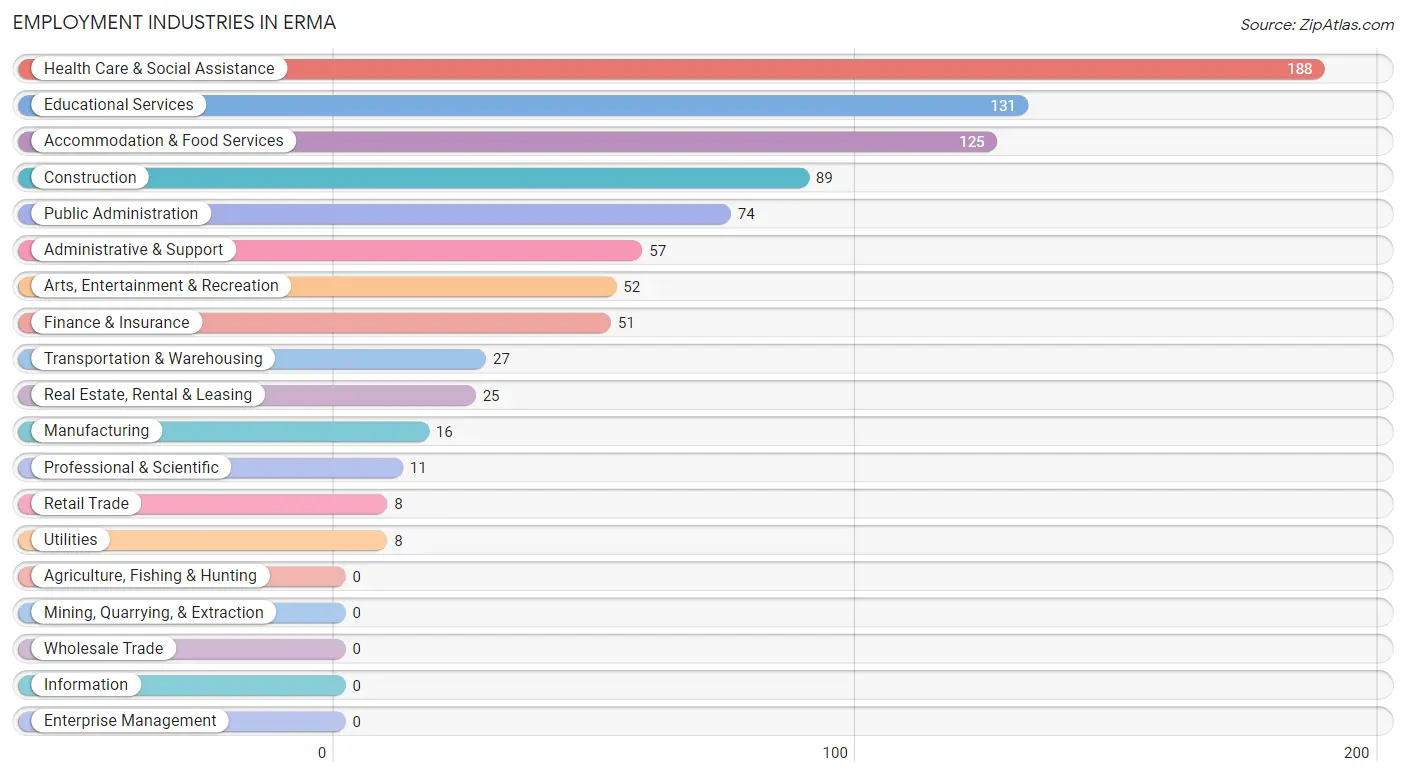
Employment Industries in Erma
The major employment industries in Erma include Health Care & Social Assistance (188 | 21.5%), Educational Services (131 | 15.0%), Accommodation & Food Services (125 | 14.3%), Construction (89 | 10.2%), and Public Administration (74 | 8.5%).
Employment Industries by Sex in Erma
The Erma industries that see more men than women are Construction (100.0%), Manufacturing (100.0%), and Retail Trade (100.0%), whereas the industries that tend to have a higher number of women are Finance & Insurance (100.0%), Educational Services (90.8%), and Health Care & Social Assistance (85.6%).
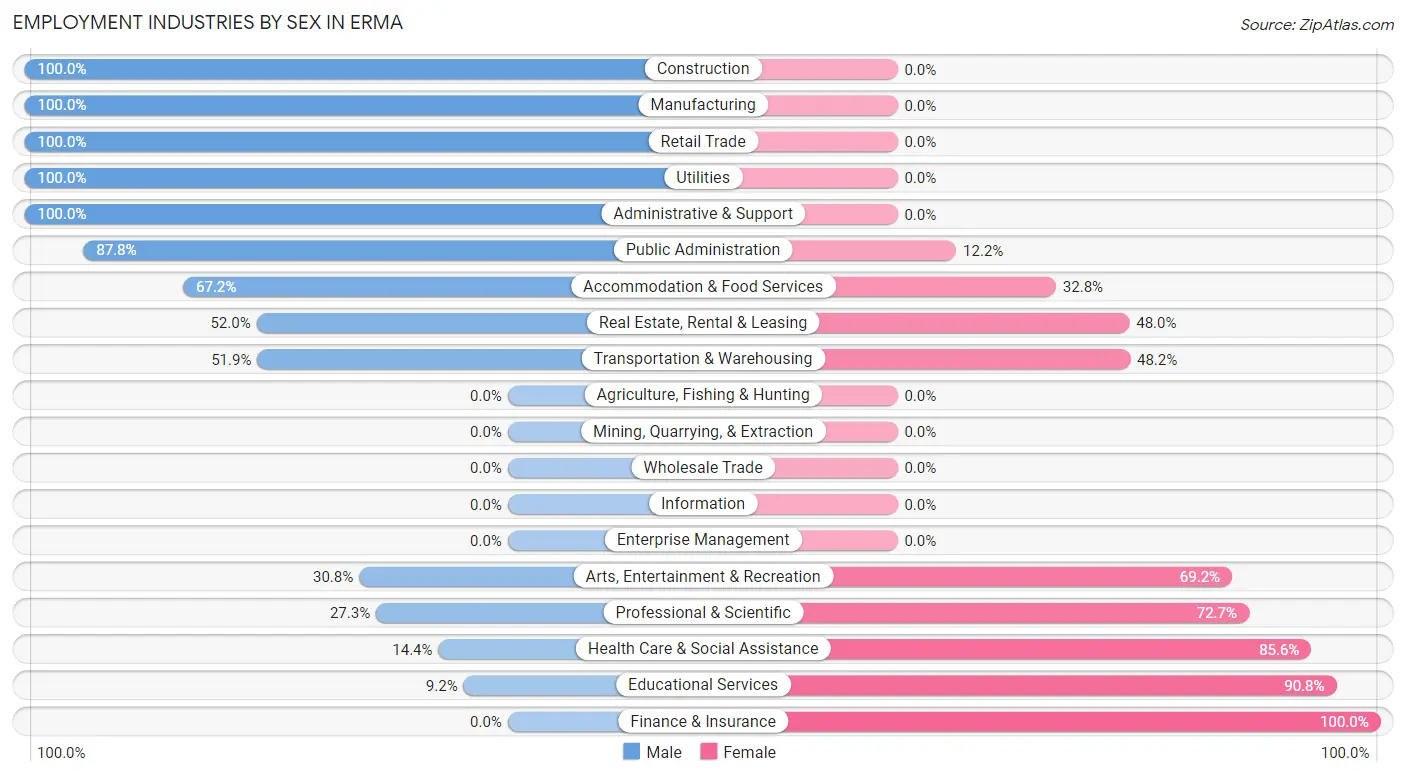
| Industry | Male | Female |
| Agriculture, Fishing & Hunting | 0 (0.0%) | 0 (0.0%) |
| Mining, Quarrying, & Extraction | 0 (0.0%) | 0 (0.0%) |
| Construction | 89 (100.0%) | 0 (0.0%) |
| Manufacturing | 16 (100.0%) | 0 (0.0%) |
| Wholesale Trade | 0 (0.0%) | 0 (0.0%) |
| Retail Trade | 8 (100.0%) | 0 (0.0%) |
| Transportation & Warehousing | 14 (51.8%) | 13 (48.1%) |
| Utilities | 8 (100.0%) | 0 (0.0%) |
| Information | 0 (0.0%) | 0 (0.0%) |
| Finance & Insurance | 0 (0.0%) | 51 (100.0%) |
| Real Estate, Rental & Leasing | 13 (52.0%) | 12 (48.0%) |
| Professional & Scientific | 3 (27.3%) | 8 (72.7%) |
| Enterprise Management | 0 (0.0%) | 0 (0.0%) |
| Administrative & Support | 57 (100.0%) | 0 (0.0%) |
| Educational Services | 12 (9.2%) | 119 (90.8%) |
| Health Care & Social Assistance | 27 (14.4%) | 161 (85.6%) |
| Arts, Entertainment & Recreation | 16 (30.8%) | 36 (69.2%) |
| Accommodation & Food Services | 84 (67.2%) | 41 (32.8%) |
| Public Administration | 65 (87.8%) | 9 (12.2%) |
| Total | 420 (48.1%) | 453 (51.9%) |
Education in Erma
School Enrollment in Erma
The most common levels of schooling among the 463 students in Erma are nursery / preschool (109 | 23.5%), elementary school (93 | 20.1%), and high school (78 | 16.9%).
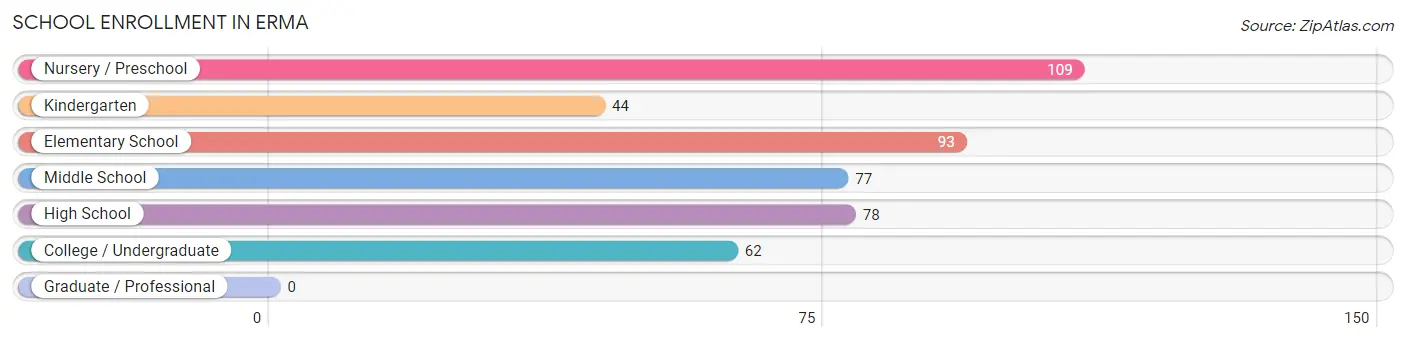
| School Level | # Students | % Students |
| Nursery / Preschool | 109 | 23.5% |
| Kindergarten | 44 | 9.5% |
| Elementary School | 93 | 20.1% |
| Middle School | 77 | 16.6% |
| High School | 78 | 16.9% |
| College / Undergraduate | 62 | 13.4% |
| Graduate / Professional | 0 | 0.0% |
| Total | 463 | 100.0% |
School Enrollment by Age by Funding Source in Erma
Out of a total of 463 students who are enrolled in schools in Erma, 176 (38.0%) attend a private institution, while the remaining 287 (62.0%) are enrolled in public schools. The age group of 20 to 24 year olds has the highest likelihood of being enrolled in private schools, with 31 (100.0% in the age bracket) enrolled. Conversely, the age group of 15 to 17 year olds has the lowest likelihood of being enrolled in a private school, with 63 (100.0% in the age bracket) attending a public institution.
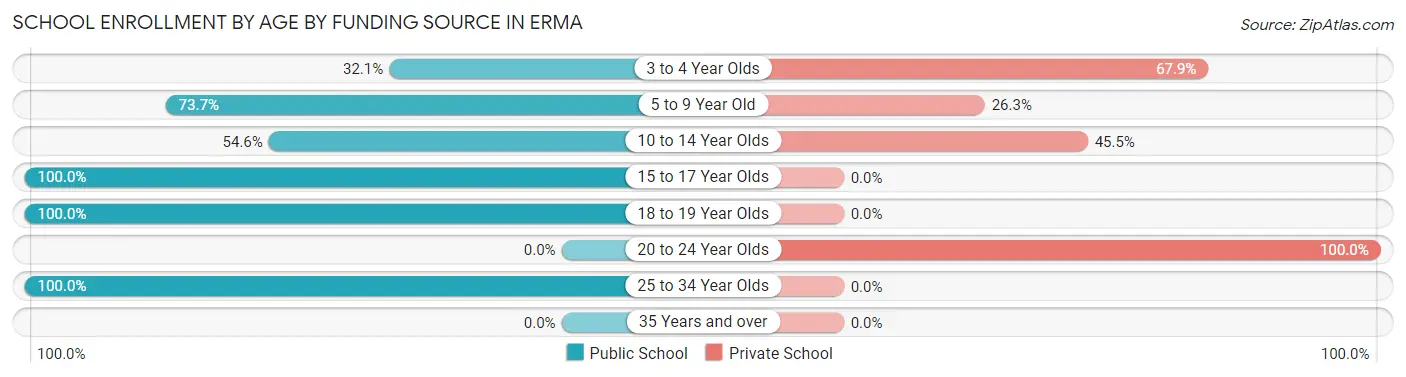
| Age Bracket | Public School | Private School |
| 3 to 4 Year Olds | 35 (32.1%) | 74 (67.9%) |
| 5 to 9 Year Old | 101 (73.7%) | 36 (26.3%) |
| 10 to 14 Year Olds | 42 (54.5%) | 35 (45.5%) |
| 15 to 17 Year Olds | 63 (100.0%) | 0 (0.0%) |
| 18 to 19 Year Olds | 15 (100.0%) | 0 (0.0%) |
| 20 to 24 Year Olds | 0 (0.0%) | 31 (100.0%) |
| 25 to 34 Year Olds | 31 (100.0%) | 0 (0.0%) |
| 35 Years and over | 0 (0.0%) | 0 (0.0%) |
| Total | 287 (62.0%) | 176 (38.0%) |
Educational Attainment by Field of Study in Erma
Education (197 | 44.8%), business (65 | 14.8%), arts & humanities (43 | 9.8%), science & technology (35 | 8.0%), and social sciences (33 | 7.5%) are the most common fields of study among 440 individuals in Erma who have obtained a bachelor's degree or higher.
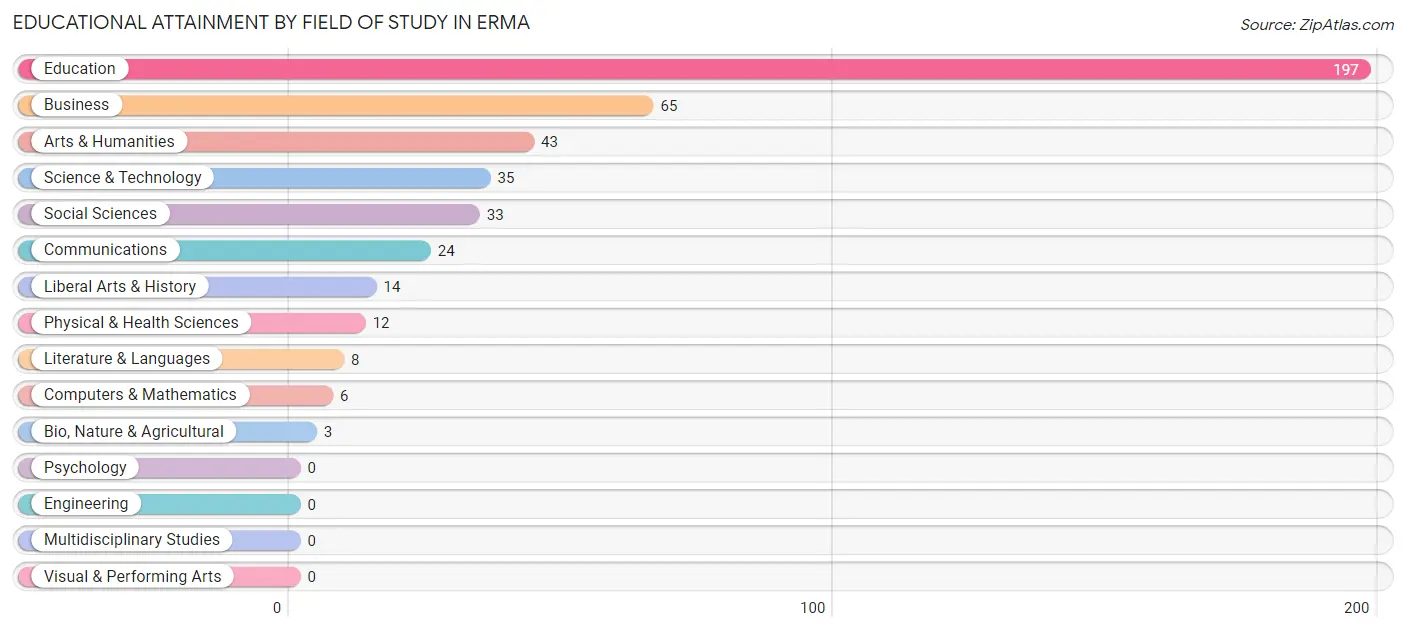
| Field of Study | # Graduates | % Graduates |
| Computers & Mathematics | 6 | 1.4% |
| Bio, Nature & Agricultural | 3 | 0.7% |
| Physical & Health Sciences | 12 | 2.7% |
| Psychology | 0 | 0.0% |
| Social Sciences | 33 | 7.5% |
| Engineering | 0 | 0.0% |
| Multidisciplinary Studies | 0 | 0.0% |
| Science & Technology | 35 | 8.0% |
| Business | 65 | 14.8% |
| Education | 197 | 44.8% |
| Literature & Languages | 8 | 1.8% |
| Liberal Arts & History | 14 | 3.2% |
| Visual & Performing Arts | 0 | 0.0% |
| Communications | 24 | 5.4% |
| Arts & Humanities | 43 | 9.8% |
| Total | 440 | 100.0% |
Transportation & Commute in Erma
Vehicle Availability by Sex in Erma
The most prevalent vehicle ownership categories in Erma are males with 3 vehicles (208, accounting for 50.1%) and females with 3 vehicles (176, making up 45.9%).
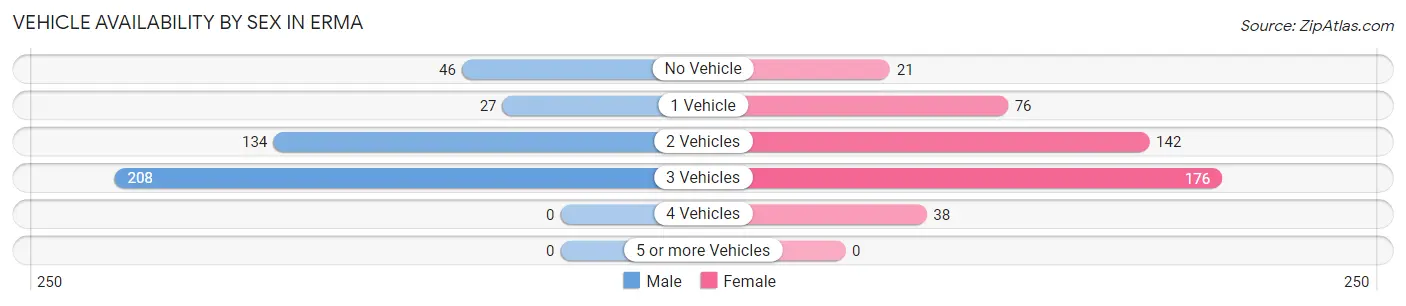
| Vehicles Available | Male | Female |
| No Vehicle | 46 (11.1%) | 21 (4.6%) |
| 1 Vehicle | 27 (6.5%) | 76 (16.8%) |
| 2 Vehicles | 134 (32.3%) | 142 (31.4%) |
| 3 Vehicles | 208 (50.1%) | 176 (38.9%) |
| 4 Vehicles | 0 (0.0%) | 38 (8.4%) |
| 5 or more Vehicles | 0 (0.0%) | 0 (0.0%) |
| Total | 415 (100.0%) | 453 (100.0%) |
Commute Time in Erma
The most frequently occuring commute durations in Erma are 10 to 14 minutes (214 commuters, 25.6%), 15 to 19 minutes (200 commuters, 23.9%), and 20 to 24 minutes (144 commuters, 17.2%).
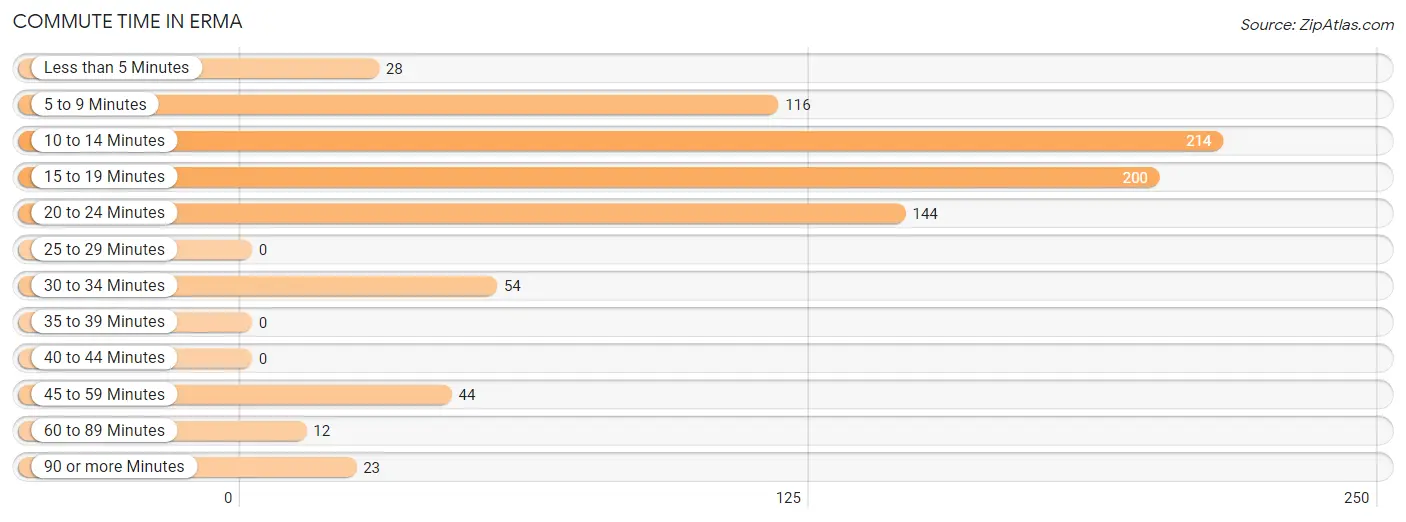
| Commute Time | # Commuters | % Commuters |
| Less than 5 Minutes | 28 | 3.4% |
| 5 to 9 Minutes | 116 | 13.9% |
| 10 to 14 Minutes | 214 | 25.6% |
| 15 to 19 Minutes | 200 | 23.9% |
| 20 to 24 Minutes | 144 | 17.2% |
| 25 to 29 Minutes | 0 | 0.0% |
| 30 to 34 Minutes | 54 | 6.5% |
| 35 to 39 Minutes | 0 | 0.0% |
| 40 to 44 Minutes | 0 | 0.0% |
| 45 to 59 Minutes | 44 | 5.3% |
| 60 to 89 Minutes | 12 | 1.4% |
| 90 or more Minutes | 23 | 2.8% |
Commute Time by Sex in Erma
The most common commute times in Erma are 15 to 19 minutes (132 commuters, 32.8%) for males and 10 to 14 minutes (128 commuters, 29.6%) for females.
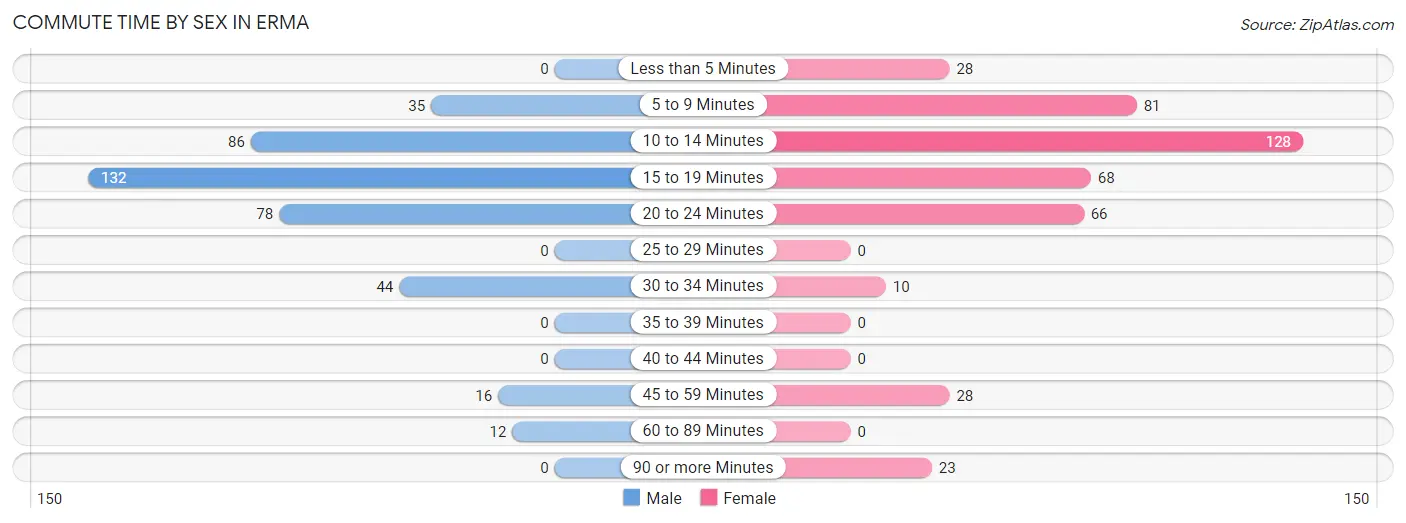
| Commute Time | Male | Female |
| Less than 5 Minutes | 0 (0.0%) | 28 (6.5%) |
| 5 to 9 Minutes | 35 (8.7%) | 81 (18.8%) |
| 10 to 14 Minutes | 86 (21.3%) | 128 (29.6%) |
| 15 to 19 Minutes | 132 (32.8%) | 68 (15.7%) |
| 20 to 24 Minutes | 78 (19.4%) | 66 (15.3%) |
| 25 to 29 Minutes | 0 (0.0%) | 0 (0.0%) |
| 30 to 34 Minutes | 44 (10.9%) | 10 (2.3%) |
| 35 to 39 Minutes | 0 (0.0%) | 0 (0.0%) |
| 40 to 44 Minutes | 0 (0.0%) | 0 (0.0%) |
| 45 to 59 Minutes | 16 (4.0%) | 28 (6.5%) |
| 60 to 89 Minutes | 12 (3.0%) | 0 (0.0%) |
| 90 or more Minutes | 0 (0.0%) | 23 (5.3%) |
Time of Departure to Work by Sex in Erma
The most frequent times of departure to work in Erma are 7:00 AM to 7:29 AM (116, 28.8%) for males and 8:30 AM to 8:59 AM (76, 17.6%) for females.
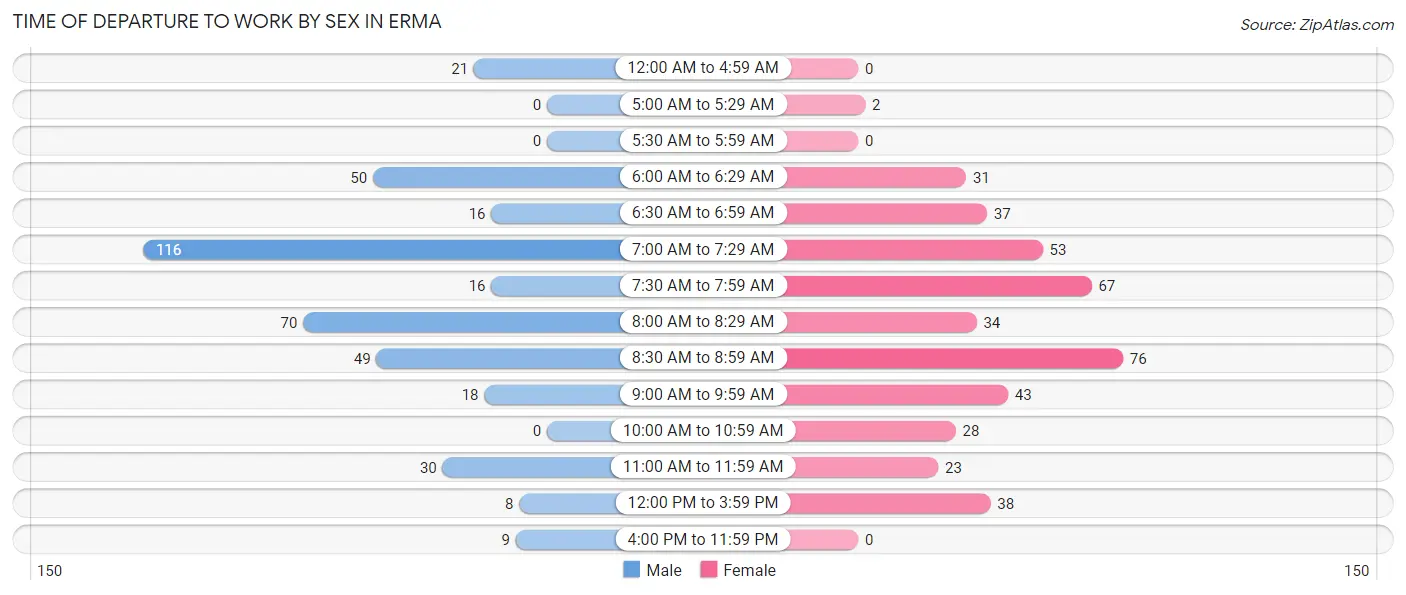
| Time of Departure | Male | Female |
| 12:00 AM to 4:59 AM | 21 (5.2%) | 0 (0.0%) |
| 5:00 AM to 5:29 AM | 0 (0.0%) | 2 (0.5%) |
| 5:30 AM to 5:59 AM | 0 (0.0%) | 0 (0.0%) |
| 6:00 AM to 6:29 AM | 50 (12.4%) | 31 (7.2%) |
| 6:30 AM to 6:59 AM | 16 (4.0%) | 37 (8.6%) |
| 7:00 AM to 7:29 AM | 116 (28.8%) | 53 (12.3%) |
| 7:30 AM to 7:59 AM | 16 (4.0%) | 67 (15.5%) |
| 8:00 AM to 8:29 AM | 70 (17.4%) | 34 (7.9%) |
| 8:30 AM to 8:59 AM | 49 (12.2%) | 76 (17.6%) |
| 9:00 AM to 9:59 AM | 18 (4.5%) | 43 (10.0%) |
| 10:00 AM to 10:59 AM | 0 (0.0%) | 28 (6.5%) |
| 11:00 AM to 11:59 AM | 30 (7.4%) | 23 (5.3%) |
| 12:00 PM to 3:59 PM | 8 (2.0%) | 38 (8.8%) |
| 4:00 PM to 11:59 PM | 9 (2.2%) | 0 (0.0%) |
| Total | 403 (100.0%) | 432 (100.0%) |
Housing Occupancy in Erma
Occupancy by Ownership in Erma
Of the total 707 dwellings in Erma, owner-occupied units account for 572 (80.9%), while renter-occupied units make up 135 (19.1%).
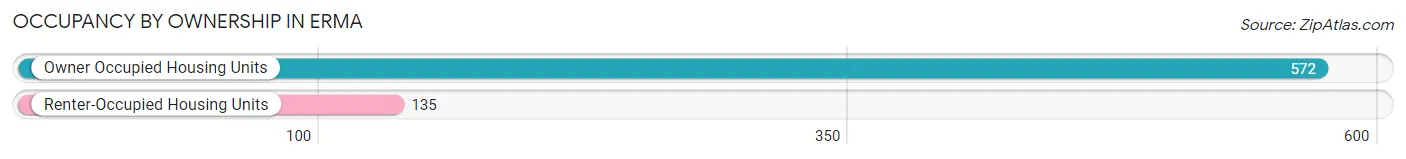
| Occupancy | # Housing Units | % Housing Units |
| Owner Occupied Housing Units | 572 | 80.9% |
| Renter-Occupied Housing Units | 135 | 19.1% |
| Total Occupied Housing Units | 707 | 100.0% |
Occupancy by Household Size in Erma
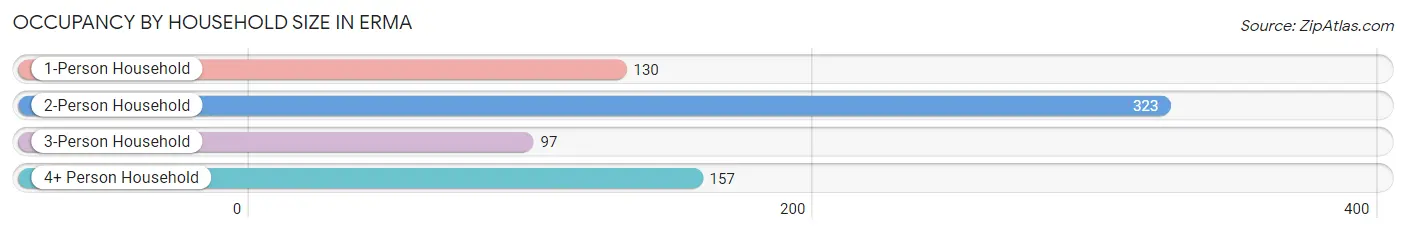
| Household Size | # Housing Units | % Housing Units |
| 1-Person Household | 130 | 18.4% |
| 2-Person Household | 323 | 45.7% |
| 3-Person Household | 97 | 13.7% |
| 4+ Person Household | 157 | 22.2% |
| Total Housing Units | 707 | 100.0% |
Occupancy by Ownership by Household Size in Erma
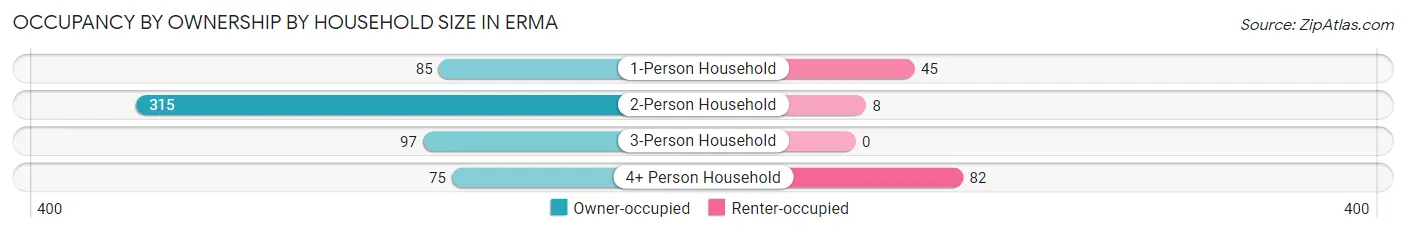
| Household Size | Owner-occupied | Renter-occupied |
| 1-Person Household | 85 (65.4%) | 45 (34.6%) |
| 2-Person Household | 315 (97.5%) | 8 (2.5%) |
| 3-Person Household | 97 (100.0%) | 0 (0.0%) |
| 4+ Person Household | 75 (47.8%) | 82 (52.2%) |
| Total Housing Units | 572 (80.9%) | 135 (19.1%) |
Occupancy by Educational Attainment in Erma
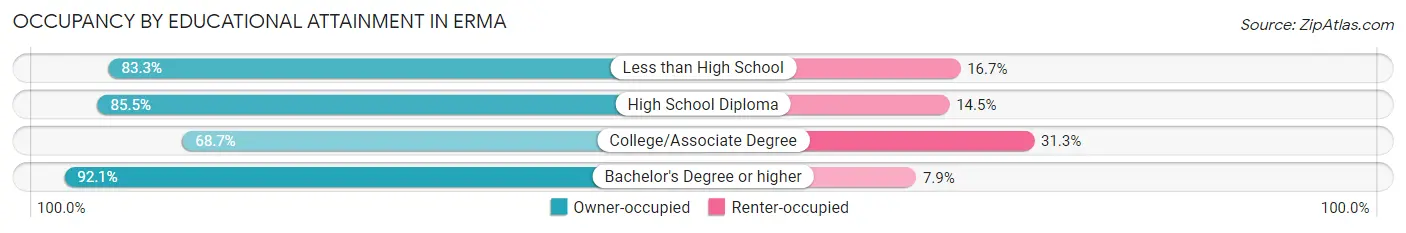
| Household Size | Owner-occupied | Renter-occupied |
| Less than High School | 40 (83.3%) | 8 (16.7%) |
| High School Diploma | 177 (85.5%) | 30 (14.5%) |
| College/Associate Degree | 180 (68.7%) | 82 (31.3%) |
| Bachelor's Degree or higher | 175 (92.1%) | 15 (7.9%) |
Occupancy by Age of Householder in Erma
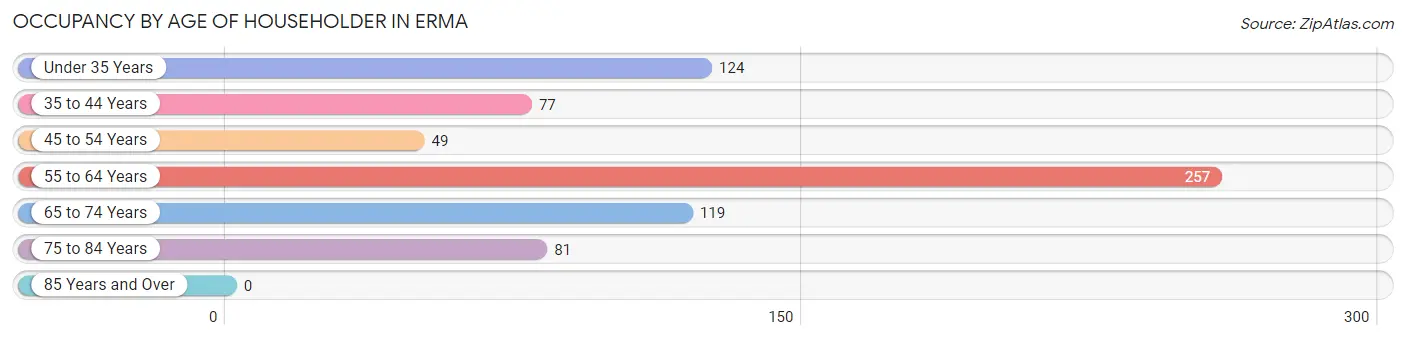
| Age Bracket | # Households | % Households |
| Under 35 Years | 124 | 17.5% |
| 35 to 44 Years | 77 | 10.9% |
| 45 to 54 Years | 49 | 6.9% |
| 55 to 64 Years | 257 | 36.3% |
| 65 to 74 Years | 119 | 16.8% |
| 75 to 84 Years | 81 | 11.5% |
| 85 Years and Over | 0 | 0.0% |
| Total | 707 | 100.0% |
Housing Finances in Erma
Median Income by Occupancy in Erma
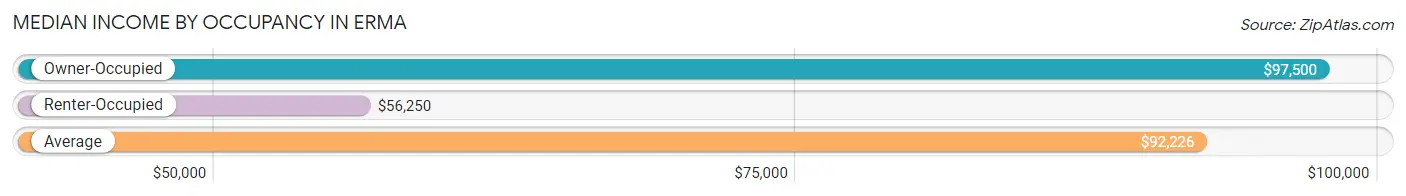
| Occupancy Type | # Households | Median Income |
| Owner-Occupied | 572 (80.9%) | $97,500 |
| Renter-Occupied | 135 (19.1%) | $56,250 |
| Average | 707 (100.0%) | $92,226 |
Occupancy by Householder Income Bracket in Erma
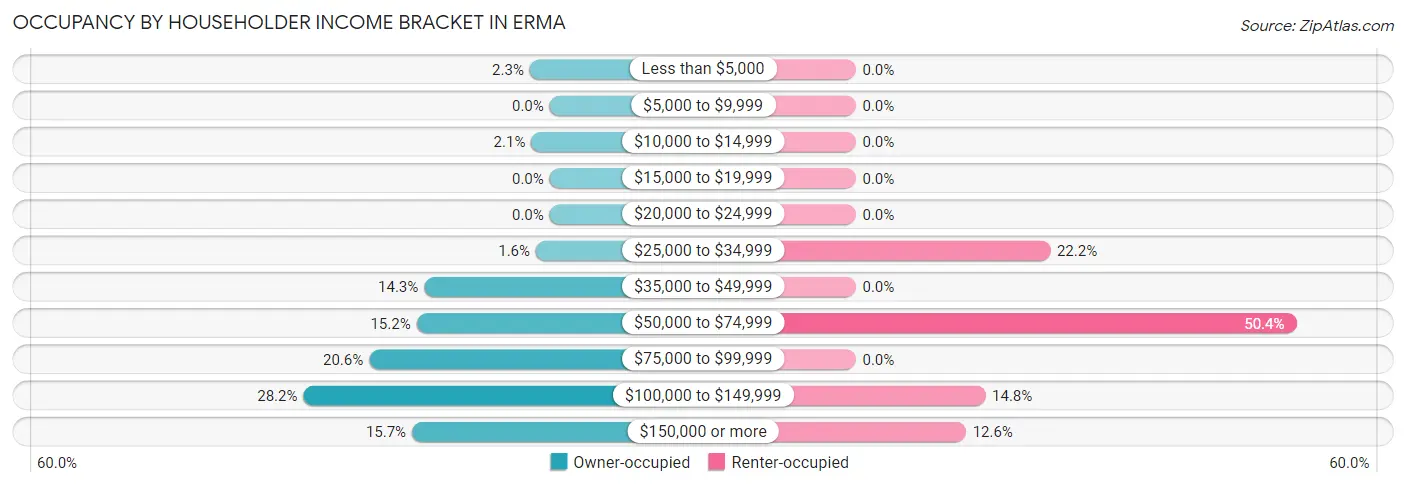
| Income Bracket | Owner-occupied | Renter-occupied |
| Less than $5,000 | 13 (2.3%) | 0 (0.0%) |
| $5,000 to $9,999 | 0 (0.0%) | 0 (0.0%) |
| $10,000 to $14,999 | 12 (2.1%) | 0 (0.0%) |
| $15,000 to $19,999 | 0 (0.0%) | 0 (0.0%) |
| $20,000 to $24,999 | 0 (0.0%) | 0 (0.0%) |
| $25,000 to $34,999 | 9 (1.6%) | 30 (22.2%) |
| $35,000 to $49,999 | 82 (14.3%) | 0 (0.0%) |
| $50,000 to $74,999 | 87 (15.2%) | 68 (50.4%) |
| $75,000 to $99,999 | 118 (20.6%) | 0 (0.0%) |
| $100,000 to $149,999 | 161 (28.1%) | 20 (14.8%) |
| $150,000 or more | 90 (15.7%) | 17 (12.6%) |
| Total | 572 (100.0%) | 135 (100.0%) |
Monthly Housing Cost Tiers in Erma
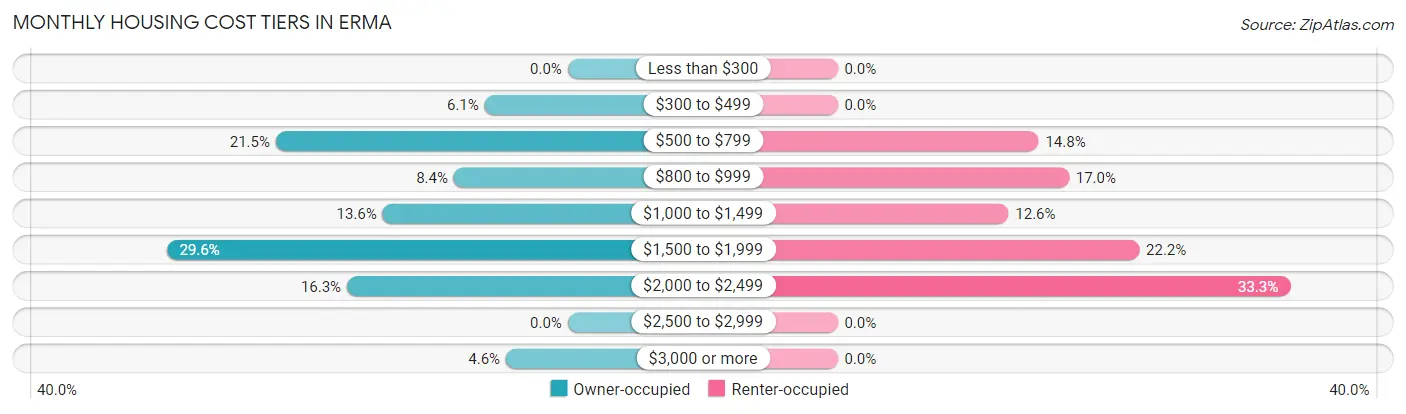
| Monthly Cost | Owner-occupied | Renter-occupied |
| Less than $300 | 0 (0.0%) | 0 (0.0%) |
| $300 to $499 | 35 (6.1%) | 0 (0.0%) |
| $500 to $799 | 123 (21.5%) | 20 (14.8%) |
| $800 to $999 | 48 (8.4%) | 23 (17.0%) |
| $1,000 to $1,499 | 78 (13.6%) | 17 (12.6%) |
| $1,500 to $1,999 | 169 (29.5%) | 30 (22.2%) |
| $2,000 to $2,499 | 93 (16.3%) | 45 (33.3%) |
| $2,500 to $2,999 | 0 (0.0%) | 0 (0.0%) |
| $3,000 or more | 26 (4.5%) | 0 (0.0%) |
| Total | 572 (100.0%) | 135 (100.0%) |
Physical Housing Characteristics in Erma
Housing Structures in Erma
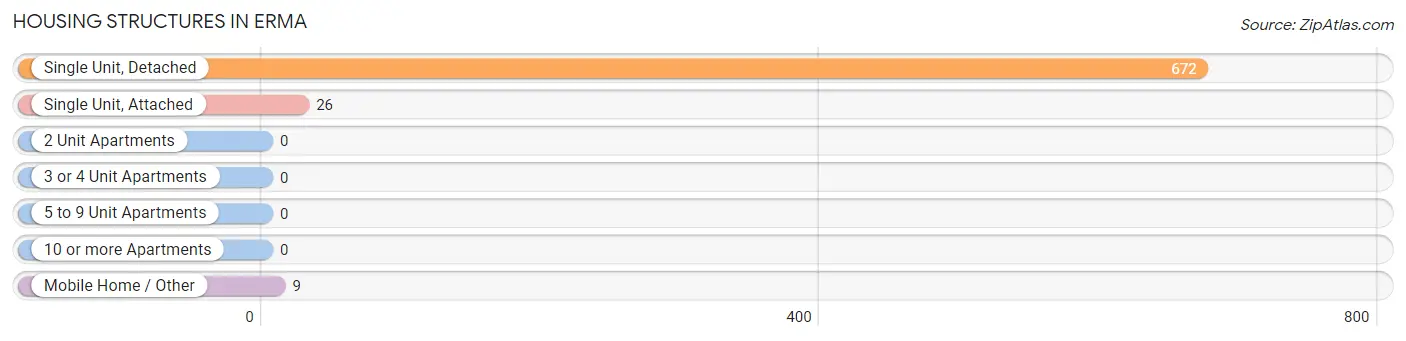
| Structure Type | # Housing Units | % Housing Units |
| Single Unit, Detached | 672 | 95.1% |
| Single Unit, Attached | 26 | 3.7% |
| 2 Unit Apartments | 0 | 0.0% |
| 3 or 4 Unit Apartments | 0 | 0.0% |
| 5 to 9 Unit Apartments | 0 | 0.0% |
| 10 or more Apartments | 0 | 0.0% |
| Mobile Home / Other | 9 | 1.3% |
| Total | 707 | 100.0% |
Housing Structures by Occupancy in Erma
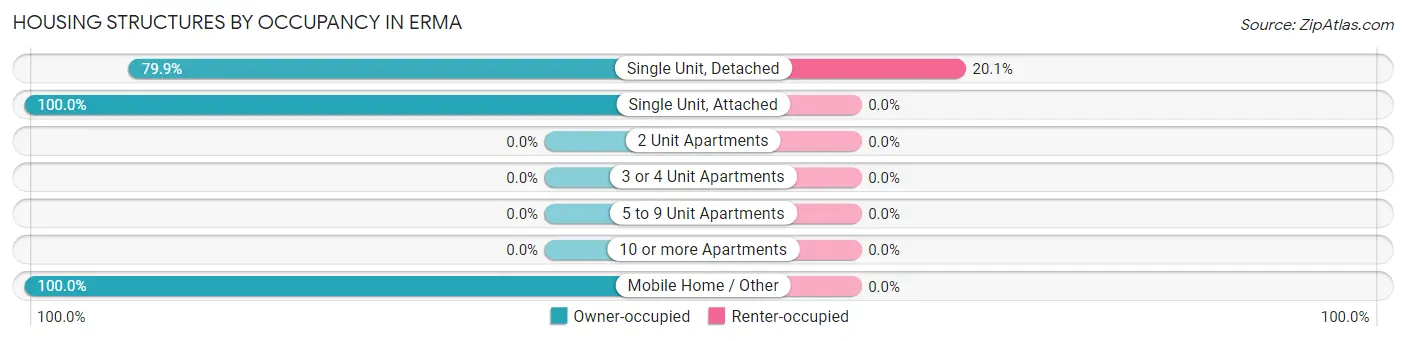
| Structure Type | Owner-occupied | Renter-occupied |
| Single Unit, Detached | 537 (79.9%) | 135 (20.1%) |
| Single Unit, Attached | 26 (100.0%) | 0 (0.0%) |
| 2 Unit Apartments | 0 (0.0%) | 0 (0.0%) |
| 3 or 4 Unit Apartments | 0 (0.0%) | 0 (0.0%) |
| 5 to 9 Unit Apartments | 0 (0.0%) | 0 (0.0%) |
| 10 or more Apartments | 0 (0.0%) | 0 (0.0%) |
| Mobile Home / Other | 9 (100.0%) | 0 (0.0%) |
| Total | 572 (80.9%) | 135 (19.1%) |
Housing Structures by Number of Rooms in Erma
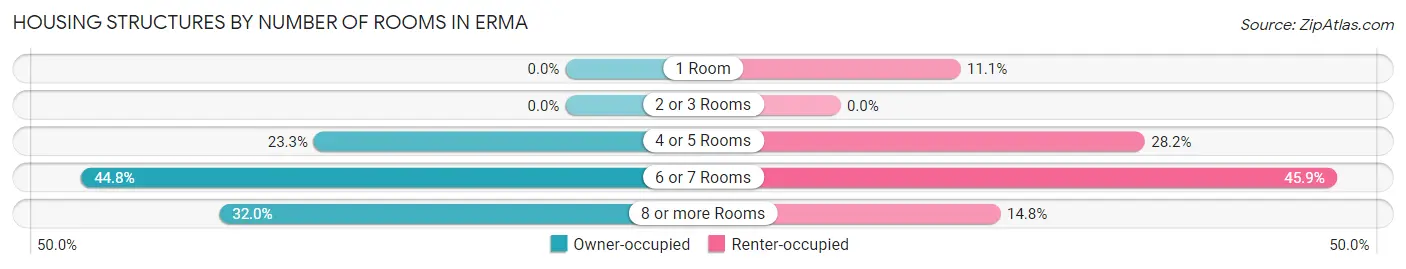
| Number of Rooms | Owner-occupied | Renter-occupied |
| 1 Room | 0 (0.0%) | 15 (11.1%) |
| 2 or 3 Rooms | 0 (0.0%) | 0 (0.0%) |
| 4 or 5 Rooms | 133 (23.3%) | 38 (28.1%) |
| 6 or 7 Rooms | 256 (44.8%) | 62 (45.9%) |
| 8 or more Rooms | 183 (32.0%) | 20 (14.8%) |
| Total | 572 (100.0%) | 135 (100.0%) |
Housing Structure by Heating Type in Erma
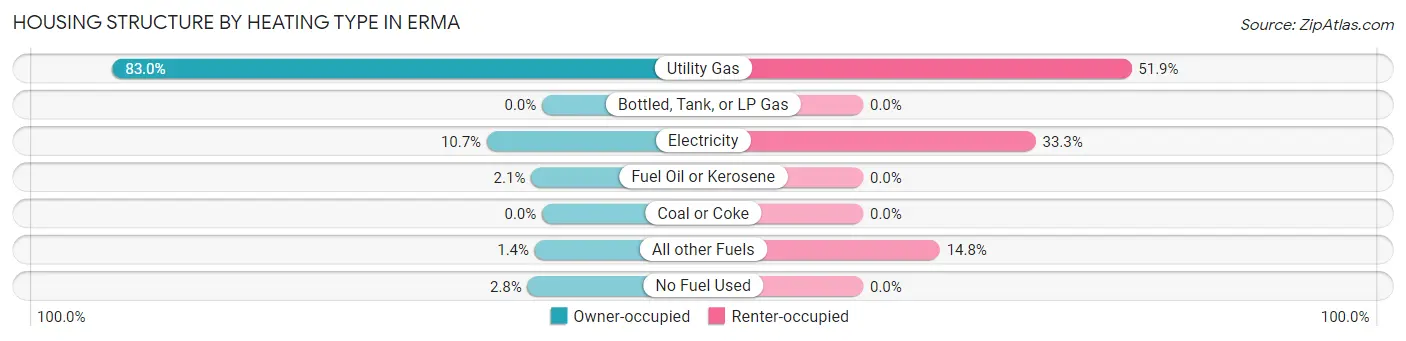
| Heating Type | Owner-occupied | Renter-occupied |
| Utility Gas | 475 (83.0%) | 70 (51.8%) |
| Bottled, Tank, or LP Gas | 0 (0.0%) | 0 (0.0%) |
| Electricity | 61 (10.7%) | 45 (33.3%) |
| Fuel Oil or Kerosene | 12 (2.1%) | 0 (0.0%) |
| Coal or Coke | 0 (0.0%) | 0 (0.0%) |
| All other Fuels | 8 (1.4%) | 20 (14.8%) |
| No Fuel Used | 16 (2.8%) | 0 (0.0%) |
| Total | 572 (100.0%) | 135 (100.0%) |
Household Vehicle Usage in Erma
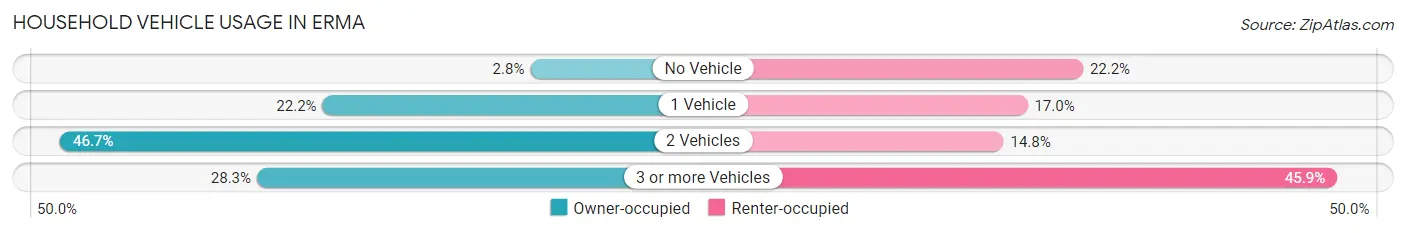
| Vehicles per Household | Owner-occupied | Renter-occupied |
| No Vehicle | 16 (2.8%) | 30 (22.2%) |
| 1 Vehicle | 127 (22.2%) | 23 (17.0%) |
| 2 Vehicles | 267 (46.7%) | 20 (14.8%) |
| 3 or more Vehicles | 162 (28.3%) | 62 (45.9%) |
| Total | 572 (100.0%) | 135 (100.0%) |
Real Estate & Mortgages in Erma
Real Estate and Mortgage Overview in Erma
| Characteristic | Without Mortgage | With Mortgage |
| Housing Units | 263 | 309 |
| Median Property Value | $311,300 | $311,000 |
| Median Household Income | $62,656 | $71 |
| Monthly Housing Costs | $720 | $26 |
| Real Estate Taxes | $4,471 | $0 |
Property Value by Mortgage Status in Erma
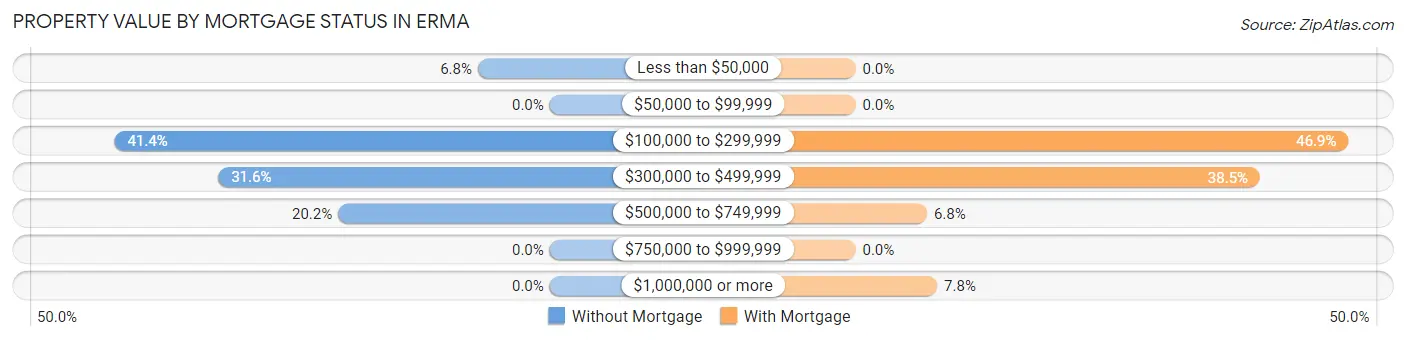
| Property Value | Without Mortgage | With Mortgage |
| Less than $50,000 | 18 (6.8%) | 0 (0.0%) |
| $50,000 to $99,999 | 0 (0.0%) | 0 (0.0%) |
| $100,000 to $299,999 | 109 (41.4%) | 145 (46.9%) |
| $300,000 to $499,999 | 83 (31.6%) | 119 (38.5%) |
| $500,000 to $749,999 | 53 (20.2%) | 21 (6.8%) |
| $750,000 to $999,999 | 0 (0.0%) | 0 (0.0%) |
| $1,000,000 or more | 0 (0.0%) | 24 (7.8%) |
| Total | 263 (100.0%) | 309 (100.0%) |
Household Income by Mortgage Status in Erma
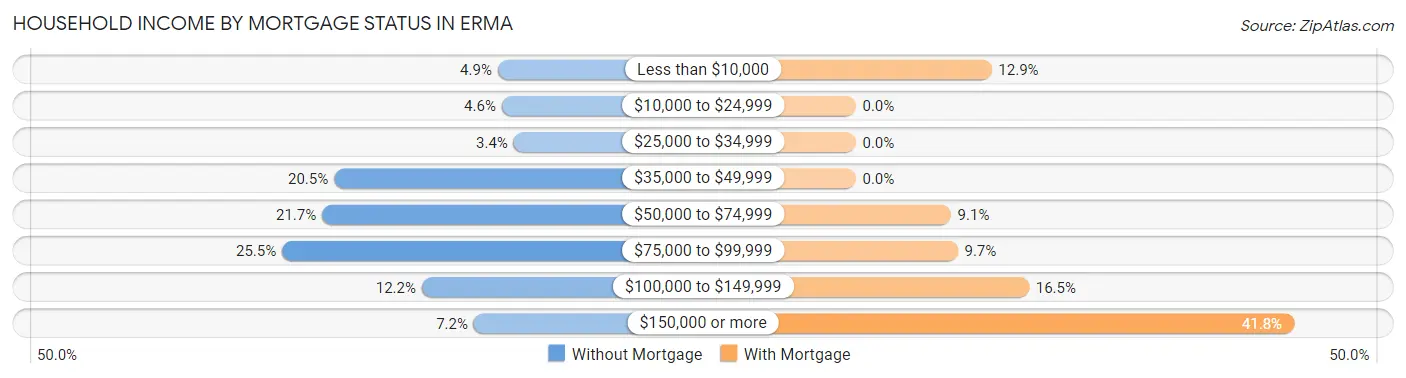
| Household Income | Without Mortgage | With Mortgage |
| Less than $10,000 | 13 (4.9%) | 40 (12.9%) |
| $10,000 to $24,999 | 12 (4.6%) | 0 (0.0%) |
| $25,000 to $34,999 | 9 (3.4%) | 0 (0.0%) |
| $35,000 to $49,999 | 54 (20.5%) | 0 (0.0%) |
| $50,000 to $74,999 | 57 (21.7%) | 28 (9.1%) |
| $75,000 to $99,999 | 67 (25.5%) | 30 (9.7%) |
| $100,000 to $149,999 | 32 (12.2%) | 51 (16.5%) |
| $150,000 or more | 19 (7.2%) | 129 (41.7%) |
| Total | 263 (100.0%) | 309 (100.0%) |
Property Value to Household Income Ratio in Erma
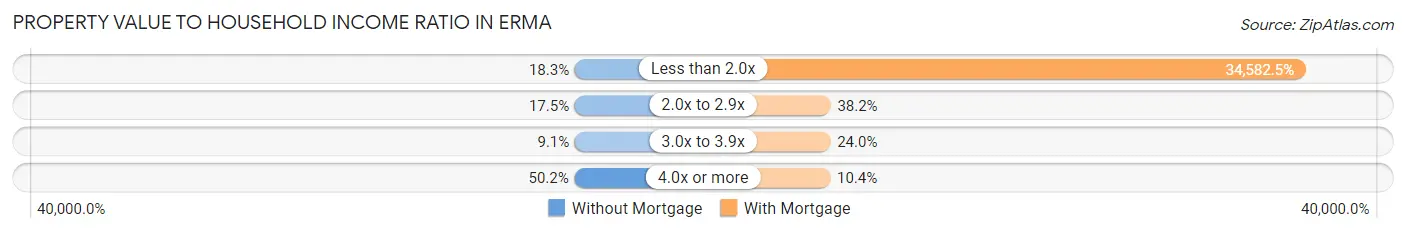
| Value-to-Income Ratio | Without Mortgage | With Mortgage |
| Less than 2.0x | 48 (18.2%) | 106,860 (34,582.5%) |
| 2.0x to 2.9x | 46 (17.5%) | 118 (38.2%) |
| 3.0x to 3.9x | 24 (9.1%) | 74 (23.9%) |
| 4.0x or more | 132 (50.2%) | 32 (10.4%) |
| Total | 263 (100.0%) | 309 (100.0%) |
Real Estate Taxes by Mortgage Status in Erma
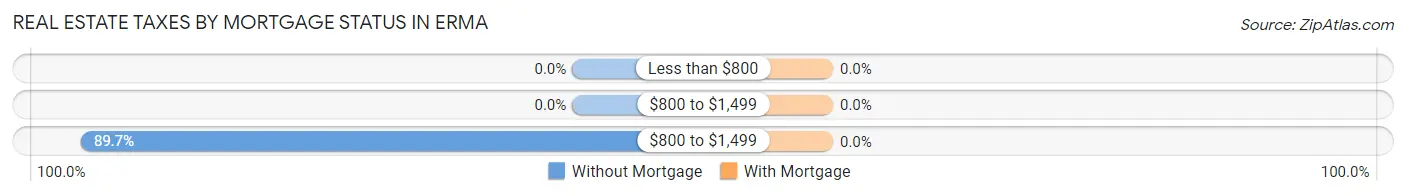
| Property Taxes | Without Mortgage | With Mortgage |
| Less than $800 | 0 (0.0%) | 0 (0.0%) |
| $800 to $1,499 | 0 (0.0%) | 0 (0.0%) |
| $800 to $1,499 | 236 (89.7%) | 0 (0.0%) |
| Total | 263 (100.0%) | 309 (100.0%) |
Health & Disability in Erma
Health Insurance Coverage by Age in Erma
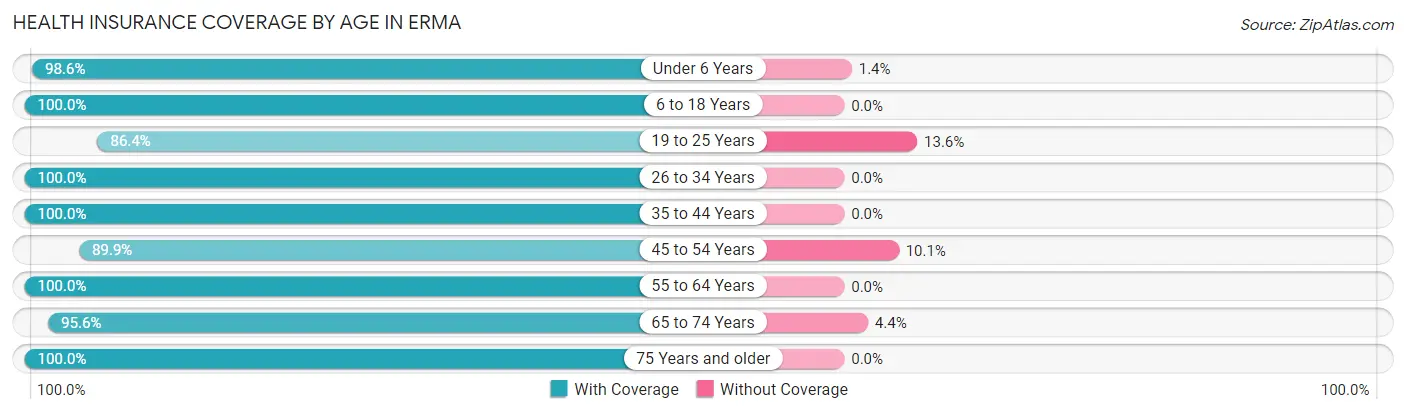
| Age Bracket | With Coverage | Without Coverage |
| Under 6 Years | 211 (98.6%) | 3 (1.4%) |
| 6 to 18 Years | 266 (100.0%) | 0 (0.0%) |
| 19 to 25 Years | 70 (86.4%) | 11 (13.6%) |
| 26 to 34 Years | 239 (100.0%) | 0 (0.0%) |
| 35 to 44 Years | 150 (100.0%) | 0 (0.0%) |
| 45 to 54 Years | 133 (89.9%) | 15 (10.1%) |
| 55 to 64 Years | 403 (100.0%) | 0 (0.0%) |
| 65 to 74 Years | 174 (95.6%) | 8 (4.4%) |
| 75 Years and older | 116 (100.0%) | 0 (0.0%) |
| Total | 1,762 (97.9%) | 37 (2.1%) |
Health Insurance Coverage by Citizenship Status in Erma
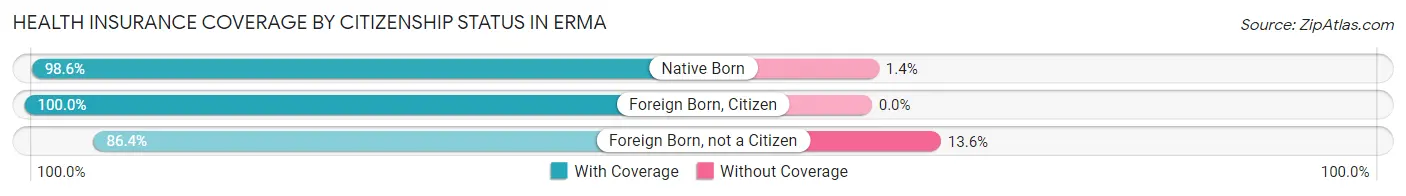
| Citizenship Status | With Coverage | Without Coverage |
| Native Born | 211 (98.6%) | 3 (1.4%) |
| Foreign Born, Citizen | 266 (100.0%) | 0 (0.0%) |
| Foreign Born, not a Citizen | 70 (86.4%) | 11 (13.6%) |
Health Insurance Coverage by Household Income in Erma
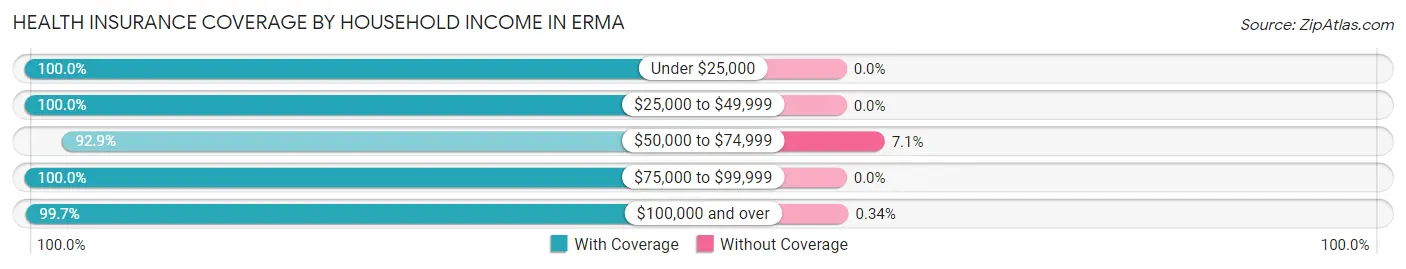
| Household Income | With Coverage | Without Coverage |
| Under $25,000 | 25 (100.0%) | 0 (0.0%) |
| $25,000 to $49,999 | 167 (100.0%) | 0 (0.0%) |
| $50,000 to $74,999 | 444 (92.9%) | 34 (7.1%) |
| $75,000 to $99,999 | 232 (100.0%) | 0 (0.0%) |
| $100,000 and over | 887 (99.7%) | 3 (0.3%) |
Public vs Private Health Insurance Coverage by Age in Erma
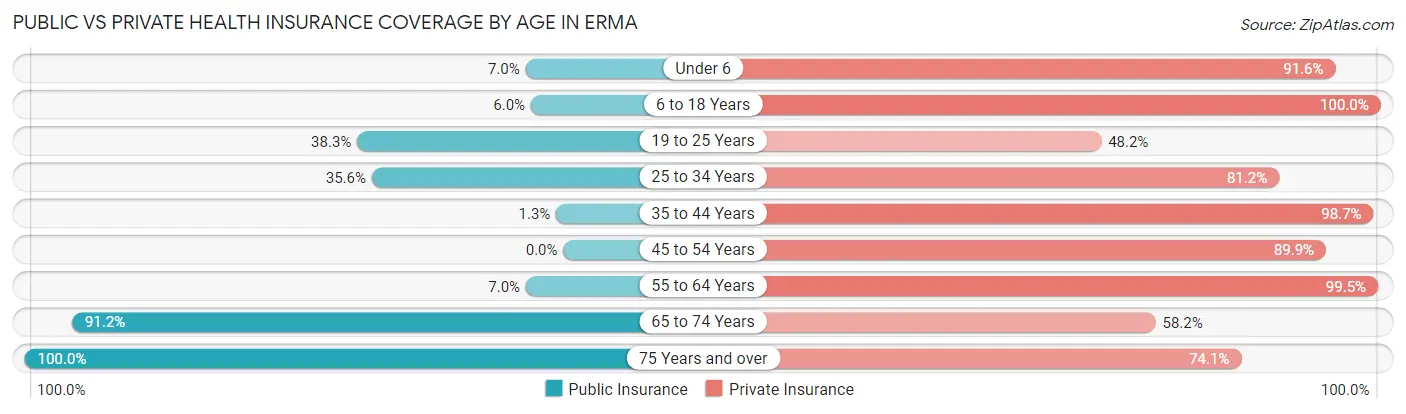
| Age Bracket | Public Insurance | Private Insurance |
| Under 6 | 15 (7.0%) | 196 (91.6%) |
| 6 to 18 Years | 16 (6.0%) | 266 (100.0%) |
| 19 to 25 Years | 31 (38.3%) | 39 (48.1%) |
| 25 to 34 Years | 85 (35.6%) | 194 (81.2%) |
| 35 to 44 Years | 2 (1.3%) | 148 (98.7%) |
| 45 to 54 Years | 0 (0.0%) | 133 (89.9%) |
| 55 to 64 Years | 28 (7.0%) | 401 (99.5%) |
| 65 to 74 Years | 166 (91.2%) | 106 (58.2%) |
| 75 Years and over | 116 (100.0%) | 86 (74.1%) |
| Total | 459 (25.5%) | 1,569 (87.2%) |
Disability Status by Sex by Age in Erma
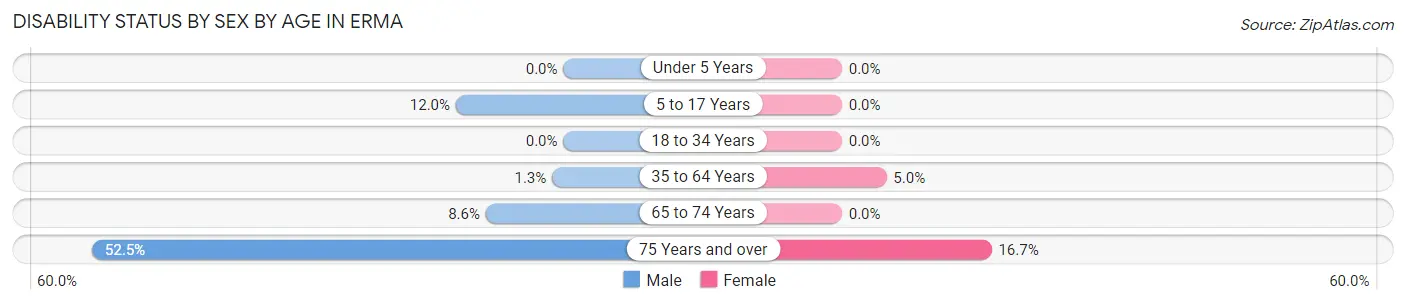
| Age Bracket | Male | Female |
| Under 5 Years | 0 (0.0%) | 0 (0.0%) |
| 5 to 17 Years | 17 (12.0%) | 0 (0.0%) |
| 18 to 34 Years | 0 (0.0%) | 0 (0.0%) |
| 35 to 64 Years | 4 (1.3%) | 19 (5.0%) |
| 65 to 74 Years | 7 (8.6%) | 0 (0.0%) |
| 75 Years and over | 42 (52.5%) | 6 (16.7%) |
Disability Class by Sex by Age in Erma
Disability Class: Hearing Difficulty
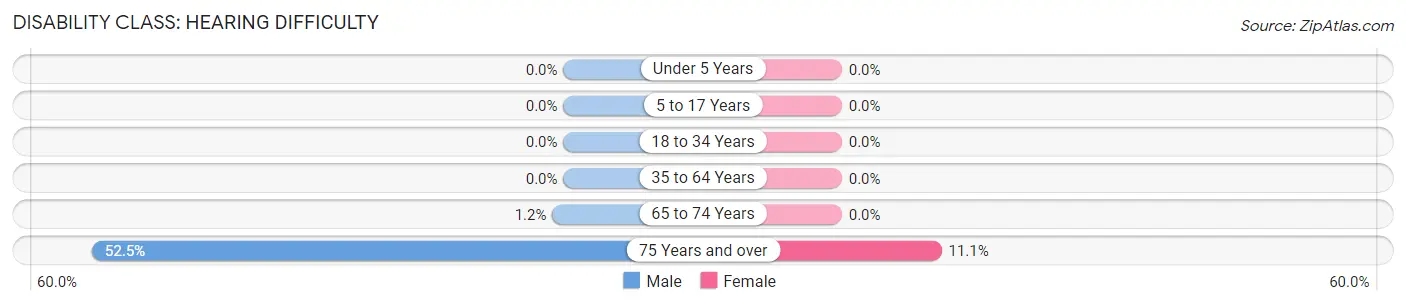
| Age Bracket | Male | Female |
| Under 5 Years | 0 (0.0%) | 0 (0.0%) |
| 5 to 17 Years | 0 (0.0%) | 0 (0.0%) |
| 18 to 34 Years | 0 (0.0%) | 0 (0.0%) |
| 35 to 64 Years | 0 (0.0%) | 0 (0.0%) |
| 65 to 74 Years | 1 (1.2%) | 0 (0.0%) |
| 75 Years and over | 42 (52.5%) | 4 (11.1%) |
Disability Class: Vision Difficulty
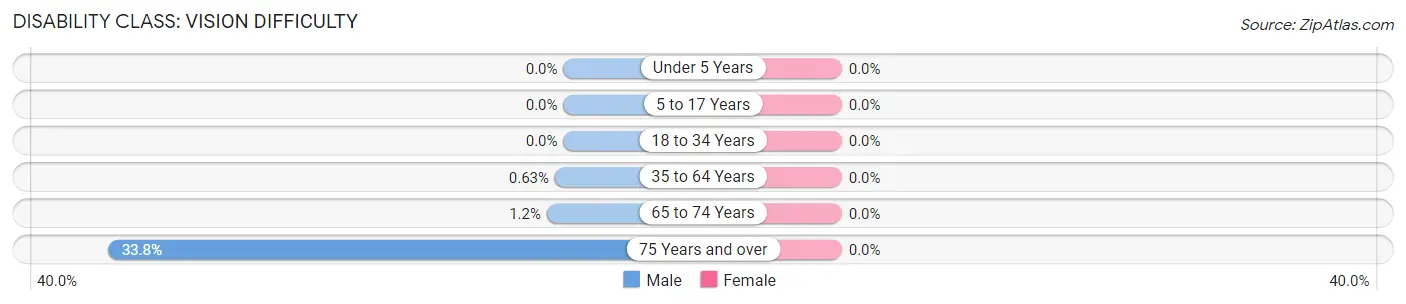
| Age Bracket | Male | Female |
| Under 5 Years | 0 (0.0%) | 0 (0.0%) |
| 5 to 17 Years | 0 (0.0%) | 0 (0.0%) |
| 18 to 34 Years | 0 (0.0%) | 0 (0.0%) |
| 35 to 64 Years | 2 (0.6%) | 0 (0.0%) |
| 65 to 74 Years | 1 (1.2%) | 0 (0.0%) |
| 75 Years and over | 27 (33.8%) | 0 (0.0%) |
Disability Class: Cognitive Difficulty
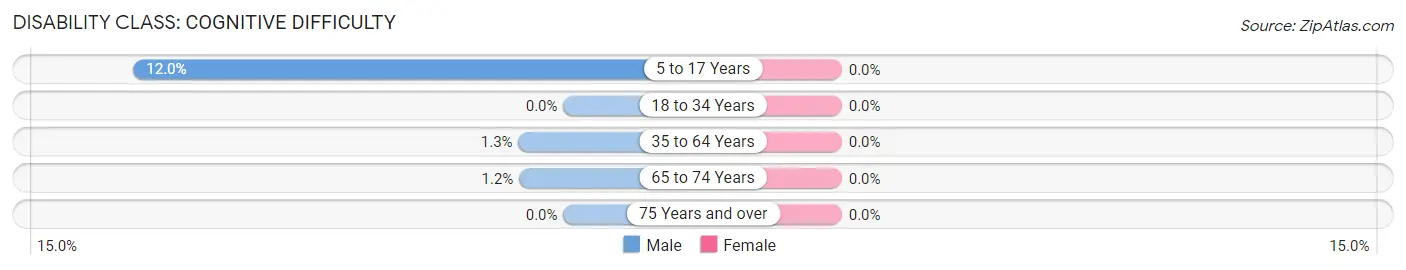
| Age Bracket | Male | Female |
| 5 to 17 Years | 17 (12.0%) | 0 (0.0%) |
| 18 to 34 Years | 0 (0.0%) | 0 (0.0%) |
| 35 to 64 Years | 4 (1.3%) | 0 (0.0%) |
| 65 to 74 Years | 1 (1.2%) | 0 (0.0%) |
| 75 Years and over | 0 (0.0%) | 0 (0.0%) |
Disability Class: Ambulatory Difficulty
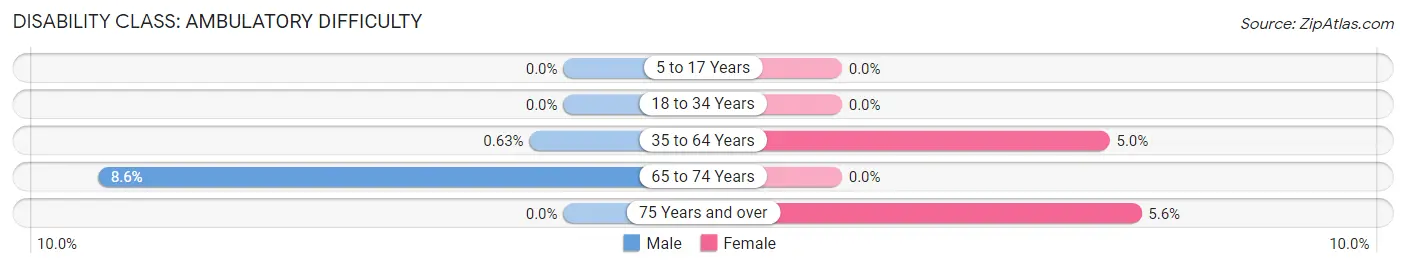
| Age Bracket | Male | Female |
| 5 to 17 Years | 0 (0.0%) | 0 (0.0%) |
| 18 to 34 Years | 0 (0.0%) | 0 (0.0%) |
| 35 to 64 Years | 2 (0.6%) | 19 (5.0%) |
| 65 to 74 Years | 7 (8.6%) | 0 (0.0%) |
| 75 Years and over | 0 (0.0%) | 2 (5.6%) |
Disability Class: Self-Care Difficulty
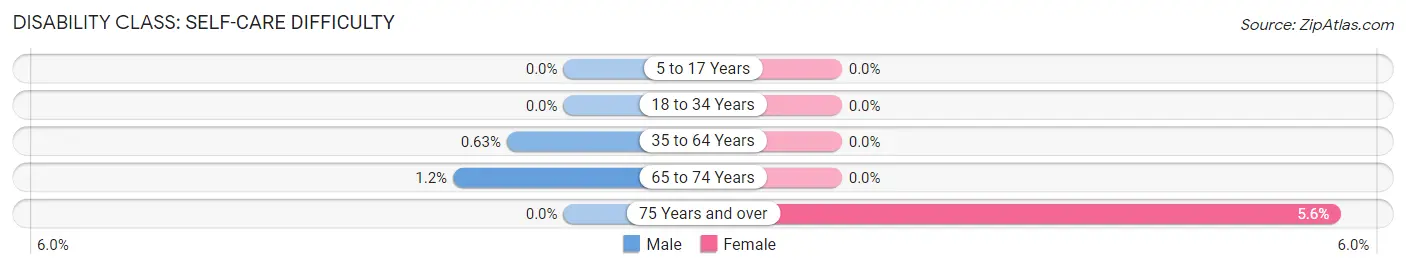
| Age Bracket | Male | Female |
| 5 to 17 Years | 0 (0.0%) | 0 (0.0%) |
| 18 to 34 Years | 0 (0.0%) | 0 (0.0%) |
| 35 to 64 Years | 2 (0.6%) | 0 (0.0%) |
| 65 to 74 Years | 1 (1.2%) | 0 (0.0%) |
| 75 Years and over | 0 (0.0%) | 2 (5.6%) |
Technology Access in Erma
Computing Device Access in Erma
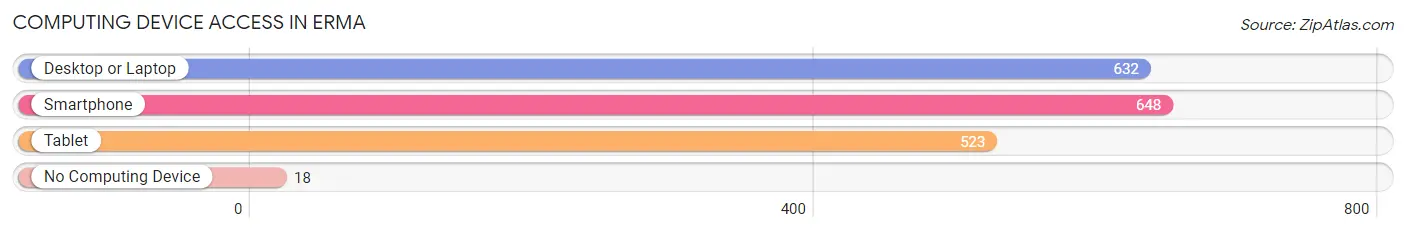
| Device Type | # Households | % Households |
| Desktop or Laptop | 632 | 89.4% |
| Smartphone | 648 | 91.6% |
| Tablet | 523 | 74.0% |
| No Computing Device | 18 | 2.5% |
| Total | 707 | 100.0% |
Internet Access in Erma
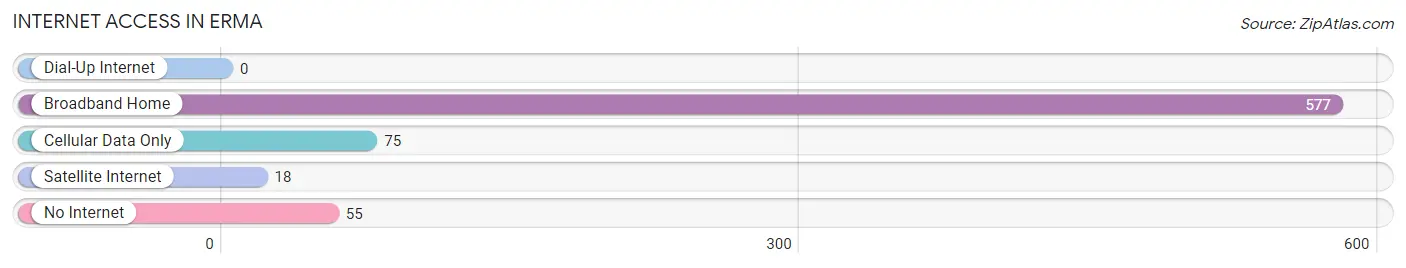
| Internet Type | # Households | % Households |
| Dial-Up Internet | 0 | 0.0% |
| Broadband Home | 577 | 81.6% |
| Cellular Data Only | 75 | 10.6% |
| Satellite Internet | 18 | 2.5% |
| No Internet | 55 | 7.8% |
| Total | 707 | 100.0% |
Erma Summary
Erma is a small unincorporated community located in Cape May County, New Jersey. It is situated in the Upper Township area, and is bordered by the towns of Sea Isle City, Avalon, and Stone Harbor. Erma is a quiet, rural community that is home to a variety of wildlife, including deer, foxes, and other small animals.
History
Erma was first settled in the late 1800s by a group of German immigrants. The area was originally known as “Erma’s Corner”, named after the wife of one of the original settlers. The community was officially established in 1891, and the first post office was opened in 1895.
In the early 1900s, Erma was a thriving farming community. The area was known for its production of tomatoes, corn, and other vegetables. The community also had a number of small businesses, including a general store, a blacksmith, and a sawmill.
Geography
Erma is located in the Upper Township area of Cape May County, New Jersey. It is bordered by the towns of Sea Isle City, Avalon, and Stone Harbor. The community is situated on a small peninsula, surrounded by the Atlantic Ocean and the Great Egg Harbor Bay.
The area is characterized by its flat terrain and sandy soil. The climate is mild, with temperatures ranging from the mid-50s in the winter to the mid-80s in the summer.
Economy
Erma is a small, rural community with a limited economy. The area is primarily residential, with a few small businesses located in the community. These businesses include a general store, a gas station, and a few restaurants.
The area is also home to a number of small farms, which produce a variety of fruits and vegetables. The farms also provide employment opportunities for local residents.
Demographics
As of the 2010 census, Erma had a population of 1,845. The population is primarily white (94.3%), with a small percentage of African Americans (2.2%) and Hispanics (2.5%). The median household income is $50,945, and the median age is 44.
Conclusion
Erma is a small, rural community located in Cape May County, New Jersey. It is bordered by the towns of Sea Isle City, Avalon, and Stone Harbor. The area is characterized by its flat terrain and sandy soil, and is home to a variety of wildlife. The economy is primarily residential, with a few small businesses located in the community. The population is primarily white, with a median household income of $50,945 and a median age of 44.
Common Questions
What is Per Capita Income in Erma?
Per Capita income in Erma is $36,787.
What is the Median Family Income in Erma?
Median Family Income in Erma is $99,679.
What is the Median Household income in Erma?
Median Household Income in Erma is $92,226.
What is Income or Wage Gap in Erma?
Income or Wage Gap in Erma is 30.5%.
Women in Erma earn 69.5 cents for every dollar earned by a man.
What is Inequality or Gini Index in Erma?
Inequality or Gini Index in Erma is 0.33.
What is the Total Population of Erma?
Total Population of Erma is 1,844.
What is the Total Male Population of Erma?
Total Male Population of Erma is 903.
What is the Total Female Population of Erma?
Total Female Population of Erma is 941.
What is the Ratio of Males per 100 Females in Erma?
There are 95.96 Males per 100 Females in Erma.
What is the Ratio of Females per 100 Males in Erma?
There are 104.21 Females per 100 Males in Erma.
What is the Median Population Age in Erma?
Median Population Age in Erma is 41.6 Years.
What is the Average Family Size in Erma
Average Family Size in Erma is 3.0 People.
What is the Average Household Size in Erma
Average Household Size in Erma is 2.6 People.
How Large is the Labor Force in Erma?
There are 1,032 People in the Labor Forcein in Erma.
What is the Percentage of People in the Labor Force in Erma?
72.1% of People are in the Labor Force in Erma.
What is the Unemployment Rate in Erma?
Unemployment Rate in Erma is 11.6%.